
Water Erosion Risk Analysis in the Arribes del Duero Natural Park (Spain) Using RUSLE and GIS Techniques


1
Department of Soil Sciences, Faculty of Agricultural and Environmental Sciences, University of Salamanca, Filiberto Villalobos Avenue, 119, 37007 Salamanca, Spain
2
Department of Geology, Faculty of Sciences, Merced Square, University of Salamanca, 37008 Salamanca, Spain
*
Author to whom correspondence should be addressed.
Sustainability 2023, 15(2), 1627; https://doi.org/10.3390/su15021627
Submission received: 18 December 2022
/
Revised: 7 January 2023
/
Accepted: 11 January 2023
/
Published: 13 January 2023
(This article belongs to the Special Issue GeoHeritage and Geodiversity in the Natural Heritage: Geoparks)
Abstract
:Nowadays, soil erosion is a global problem of great environmental and social concern, affecting natural resources, natural spaces and agricultural production. Therefore, it is necessary to carry out an erosion risk analysis to estimate the amount of soil lost, as well as to establish possible conservation practices to mitigate this loss. One way of doing this is through the integration of empirical equations such as RUSLE and GIS techniques, giving rise to a mapping of potential and actual erosion, considering the factors that make up this equation. The results obtained indicate that the areas with extreme erosion levels in Arribes del Duero, that is, with the greatest losses (greater than 200 Tm/ha/year), correspond to areas with steep slopes, poorly developed soils such as Leptosols and Regosols and vegetation with little or no vegetation cover. On the other hand, areas with stable levels of erosion (up to 10 Tm/ha/year) are found in flat areas, with more developed soils, such as Alisols and Luvisols, and vegetation with a higher density and herbaceous cover. Finally, it is concluded that the integration of GIS techniques with parametric equations constitutes a simple and economic tool for estimating these losses and, together with land use, allows different mitigation measures to be established, which, in our study area, focus on reducing the length and gradient of the slope, such as contour cultivation, construction of terraces and “bancales”.
1. Introduction
Soil loss through erosion is a global problem, affecting natural resources and agricultural production [1,2,3,4,5], and has increased significantly during the 20th century, becoming a global problem of major environmental and social concern [6]. Average soil erosion rates worldwide are estimated to be between 12 and 15 T ha−1 yr−1 [7], which means that each year, the earth’s surface loses about 0.90–0.95 mm of soil [8]. Among the climatic factors causing soil erosion, water is more influential than wind [2].
Water erosion is a natural process involving the separation, transport and sedimentation of materials [9,10,11,12]; the main triggers of which are, among others, precipitation, slope and land use changes [13,14]. It constitutes the major form of land degradation, serving as a precursor of irreversible effects on the soil, causing loss of fertility, slope instability and loss of surface horizons [15,16,17].
Human-induced erosion, on the other hand, is linked to deforestation, poor agricultural practices, overgrazing, forest fires and rapidly increasing urbanisation. The above-mentioned factors, together with other inappropriate land practices, are responsible for triggering erosion along with other inappropriate land management practices [18,19,20]. In general, these practices can reduce the productive potential of agricultural regions, generate slope instability and reduce soil porosity, which lead to loss of water retention, infiltration and percolation capacity. As a result, surface runoff, sediment transport, siltation and water pollution due to the transport of agrochemicals such as fertilisers and pesticides increase [13,18,19].
Soil erosion may become more severe in the near future due to climate change, further aggravated by increased population pressure, overexploitation of natural resources and poor land and water management practices [20,21]. Soil conservation is needed to reverse the process of land abandonment and improve agricultural production to ensure food security and sustainability. Therefore, there is a need to identify critical areas prone to erosion to provide the necessary information to establish soil conservation strategies, such as protected areas [22].
Researchers have developed different tools to estimate soil loss empirically, such as the Soil and Water Assessment Tool (SWAT), the Water Erosion Prediction Project (WEPP), the Universal Soil Loss Equation (USLE) and the Revised Universal Soil Loss Equation (RUSLE) [2,23,24]. Among these models, the USLE and its revised version (RUSLE) are the most widely used due to their simplicity, ease of use and ability to successfully integrate the various parameters of the ecosystem or natural areas [25,26]. Therefore, the RUSLE model will be used in this study.
RUSLE is an erosion prediction model, which estimates long-term annual soil loss with acceptable accuracy [27,28,29]. This model comprises the following five factors: rainfall erosivity (R factor), soil erodibility (K factor), topographic factor (LS factor), land use (C factor) and soil management and conservation practices (P factor) [30,31].
In addition to using empirical equations such as RUSLE in recent years, Geographic Information Systems (GIS) and Remote Sensing (RS) have become useful tools for natural resource management and disaster research. The use of these technologies, which facilitate the handling of many spatial data in a fast and efficient way [32], allows the generation of erosion risk models and cartographies through the analysis of a database to elaborate classifications, map algebra, etc. In this database, it is possible to integrate all the basic thematic parameters (R, K, LS, C and P), resulting in specific mappings, which are overlaid to finally establish synthetic erosive risk mapping [33]. For this reason, many researchers use GIS as the main approach to estimate soil erosion at all scales [34,35,36,37,38,39,40,41].
In this article, which was carried out in the Arribes del Duero natural park (Salamanca-Zamora), the objective is to determine the risk of soil erosion (not previously studied) by using the RUSLE model and, in addition to this, the use of GIS and RS, highlighting as a novelty with respect to other studies the use of satellite images of the highest current relevance and digital terrain models with high spatial resolution, allowing, in a quick way, the development of a cartography of erosion risk in a quick way to distinguish potential and actual erosion. In this natural park, the conservation of soil resources is a priority in order to promote economic activities that lead to population settlement. Finally, this cartography and the land use will determine the possible conservation practices or measures that could be implemented in the future to mitigate these losses.
2. Materials and Methods
2.1. Study Area
The study area (Figure 1) chosen for this work is the Arribes del Duero Natural Space, located to the west of the provinces of Salamanca and Zamora, on the border with Portugal. It is a protected area of 1061 km2, made up of 38 municipalities and a population of about 17,000 inhabitants. The climate is characterised by mild winters and very hot and long summers in the valley areas, with an average annual temperature and rainfall of 17.1 °C and 500 mm, respectively, in contrast to the extreme continental climate that characterises the plains, with temperatures of 12.2 °C and rainfall of 750 mm [42]. Its landscape is characterised by an undulating peneplain (with a uniform height of 700–800 m) and the steep slopes formed by the canyons (with heights of 130 m) carved by the river system (Duero, Tormes, Uces, Huebra and Águeda rivers). In terms of vegetation, the “peneplain” is a rich mosaic, delimited by stone walls and pastureland, with species of the genus Quercus (holm oak, pyrenean oak, cork oak and gall oak), mixed with other tree species (ash trees) and scrub (scrubland and broom), pastures and dry crops (wheat, barley, rye and vines). For their part, olive and almond trees remain on the slopes and terraces, only displaced by myrtle, holm oak and juniper groves, where agricultural use has been abandoned [43,44]. Finally, it should also be noted that this is one of the areas with the greatest hydroelectric potential in the Iberian Peninsula.
2.2. Methodology
The methodology followed in this article combines field work with laboratory work. As a result, a series of water erosion risk maps of the soils of the Arribes del Duero Natural Park was obtained. The field work focused on obtaining representative samples of the different types of soils existing in the study area. The laboratory work considered of analysing the samples, taking care to establish the necessary parameters for calculating the different factors (granular-metric analysis, organic matter, structure, etc.) that determine the application of the RUSLE to the risk of water erosion. Finally, the data obtained in the field campaigns and the laboratory analyses were studied by applying graphic (Wischmeier nomogram, DTM generation, etc.) and empirical procedures (formulas for the calculation of parameters, RUSLE equation, etc.), in order to elaborate a database that has been implemented in a Geographic Information System (ArcGis 10.5) and to obtain different parametric and final erosion risk cartographies of the study area.
Therefore, the quantification of soil losses due to water erosion has been carried out by means of two mappings (Figure 2) [45].
1. Map of Potential Erosion or states of the terrain under hypothetical natural conditions: this constitutes the susceptibility of an area to erosion. In order to predict this risk, a detailed study of a series of factors or elements of the physical environment (mechanical resistance, rainfall, slopes, etc.) that condition erosion processes is performed. Knowing these variables, the potential erosion units can be inventoried and mapped by using erodibility indices (lithofacies and slopes) and erosivity indices (aggressiveness of rain).
2. Current Erosion Map: it considers current conditions and determines the degree of current soil loss in each area by considering the “present moment” and analysing the soil forming and protective factors, as well as its spatial distribution (types of crops and native vegetation and conservation practices).
For both mappings, the modified version of the RUSLE has been used to estimate the average annual soil loss under different conditions of use, climatic variation, relief and use of conservation practices. This model is expressed by Equation (1):
where A is the soil loss per unit area in a given time in Tm/ha/year, R is the rainfall erosivity factor, K is the soil erodibility factor, LS is the topographic factor encompassing slope length (L) and slope steepness (S), C is the land use and management factor and P is the soil conservation practices factor.
A = R × K × LS × C × P
2.3. Potential Erosion Risk Cartography
The Potential Erosion Map is obtained from the multiplication of the three factors R, K and LS. Once obtained, the reclassification of the erosive degrees is carried out in smaller intervals, using the criteria in Table 1.
2.3.1. Rain Erosivity Factor (R)
This factor considers the average of the kinetic energy intensity values estimated from monthly and annual average rainfall [12]. This rainfall must have a continuous record of rainfall intensity variations and has been obtained from the database of the Geographic Information System for Agricultural Data (SIGA) [46].
To obtain this factor, firstly, rainfall data were collected from 35 stations in the study area, with data from more than 20 consecutive years. Then, given the dispersion of the stations, an interpolation was carried out using the weighted distance method (IDW) with ArcGis. In our study, we have worked with a cell size of 5 metres, thus obtaining greater precision. This operation was repeated each of the month of the year, thus obtaining the corresponding raster. The next step was the application of the Modified Fourier Index (IMF) [47], whose formula is (2):
where pi is the precipitation of each month in mm and Pt is the mean annual precipitation in mm. Each of the previous raster corresponds to each of the 12 values of pi, so that from them we can obtain the raster that represents the value of the mean annual precipitation, which will be the sum of all the monthly precipitation values. Finally, to calculate the R Factor, we have used Equation (3), which is the regression equation proposed by the I.C.O.N.A. for the region where our study area is located, which allowed us to calculate the value of R as a function of readily available precipitation variables, such as the total precipitation or maximum precipitation in a month [48]:
2.3.2. Soil Erodibility Factor (K)
This is a sensitive parameter related to regional characteristics, soil structure and degree of weathering. It describes the susceptibility of the soil to detachment and transport of particles in quantity and flow rate for a specific predicted rainfall event. It is a quantitative value experimentally determined from soil texture, structure, organic matter content and permeability [10,12].
This factor is obtained using with the data obtained in the physico-chemical analyses carried out in the laboratory of the 38 soil profiles taken in the field work, necessary for the use of the corresponding Equation (4), whose values are shown in Table 2. The values obtained have been validated with the Wischmeier nomogram [12].
where T is the texture parameter of the surface 15 cm, MO is the organic matter content (%), E is the structure and P is the permeability.
2.3.3. Topographic Factor (LS)
The topographic factor is determined by the length of the slope (L) and the slope (S). Thus, it establishes the need for an exhaustive knowledge of the spatial distribution, since soil erosion is intensified as a consequence of the concentration of runoff water towards the lower areas. As L increases, soil erosion increases, as well as increasing as a consequence of velocity and surface runoff [12].
To calculate this factor, the methodology followed by Zhanh et al., 2013 [49] was used, based on Equation (5), proposed by Moore and Burch (1986) [50]:
where Flow Accumulation is the number of cells contributing to the flow in a given cell, cell size is the length of the size of one side of the cells and sin slope is the sine of the slope in radians.
First, the slope is calculated in degrees and then transformed to radians. Next, the calculation of the slope length is carried out, which is done on the basis of the flow accumulation raster, which represents the cells in which water accumulates when flowing from the cells with the highest altitude value. To obtain it, it is necessary to calculate the filling of sinkholes, the flow directions and the accumulation of flow. Once the slope and slope length are obtained, the LS Factor is calculated considering the above formula, which involves multiplying the flow accumulation by the cell size. In our study, the maximum flow accumulation value is 4796.821, which multiplied by the cell size (5 m) would result in a high maximum runoff length. Therefore, using these data would be erroneous, as it would overestimate the value of the slope length, resulting in exaggerated erosion values. To avoid this, it is necessary to establish a maximum length of 25 m, which is equivalent to 5 cells, thus obtaining a flow accumulation raster with a maximum value of 5. Finally, a reclassification of the flow accumulation is carried out (considering this maximum length), which will be used to calculate the LS Factor by means of the above formula.
2.4. Real Erosion Risk Cartography
This cartography is obtained from the Potential Erosion Map by adding two terms from the RUSLE, which are: the crop or vegetation factor (C-factor) and the Conservation Practices Factor (P-Factor).
2.4.1. Plant Cover Factor (C)
This factor analyses the influence of plant species, crop rotation and the degree of erosive susceptibility of the soil, which will influence its productivity. For its calculation, the management of plant masses and crops is considered, using the Forestry Map of Spain, scale 1:25,000, delimiting the study area. Finally, to obtain this value (Table 3), the values established for tree, shrub and mixed tree formations are considered, analysing the percentage of tree and shrub cover, type of herbaceous cover and thickness of plant debris as well as its extent [22]. For the herbaceous formations, the Wischmeier classification was considered [51]
2.4.2. Soil Conservation Practices Factor (P)
This factor analyses the existence of soil conservation practices in land use [27]. In this study, as in most soil loss estimates, it is not considered, given that we are interested in knowing the potential and real losses considering natural factors. On the other hand, human activities can increase this soil loss or reduce it through the implementation of specific actions: terraces and contour cultivation. As a result, this is a parameter to be subtracted from the potential erosion risk, so it is not considered, i.e., Factor P in our study area has a value of 1 [44].
3. Results and Discussions
The USLE factors (Figure 3), have been estimated with a 5 m × 5 m grid, being a very precise scale that allows us to provide the special distribution of the average annual soil erosion in the Arribes del Duero Natural Park with great detail and to resemble reality as much reality as possible, unlike other grids of lower precision.
3.1. RUSLE Factor Analysis
The R Factor has been obtained from the monthly and annual rainfall data of the different meteorological stations spread over the study area with normal data (20 years) by applying the IMF. Average annual rainfall ranged between 483.9 and 846.4 mm. The highest rainfall was concentrated between Saucelle and Aldeadávila. This factor shows values ranging between 156 and 291 (Figure 3A), being maximum between the above-mentioned localities.
The K factor has considered the soils studied by the authors in previous works, as well as their corresponding physico-chemical data [52]. With these data and the Wischmeier nomogram, values between 0.12 and 0.49 have been obtained (Figure 3B).
The topographic factor is influenced both by the length of the slope and by the gradient; therefore, geomorphological aspects are one of the main factors that determine the emission of sediments in a river basin. Our study area is characterised by the boxing in of the Duero River, i.e., a peneplain followed by a steep slope, the latter being more susceptible to erosion. Observing the results obtained (Figure 3C), the values range between 0 and 61. The areas with the steepest slope and the longest slope have the highest values.
Finally, the vegetation cover factor (Factor C) is a determining natural element in the protection of the soil against the erosive force of precipitation, because in addition to controlling the energy with which raindrops hit the surface of the soil, it slows down the speed of surface runoff. Additionally, stoniness must be considered because it acts as protection, reducing the inertia with which the drops fall, since the soil is covered by fragments of rock or gravel. In view of the results obtained (Figure 3D), C values between 0.003 and 0.42 are obtained.
3.2. Potential Erosion Risk Cartography
To make this mapping (Figure 4), the factors of the physical environment have been multiplied: R, K and LS, showing the susceptibility of the area to erosion, considering the existing conditions. In this way, the areas corresponding to the Duero River basin, as well as its main tributaries such as the Tormes, Águeda, Huebra and Uces, are where the greatest erosion is identified, with values of over 200 Tm/ha/year (reaching 5137.36 Tm/ha/year), being identified as an extreme erosive level.
This area coincides with high slopes that favour turbulent movements, giving rise to severe erosive forms, such as rills (Figure 5A) and gullies (Figure 5B), and, in addition, with poorly developed soils, such as Leptosols and Regosols, which have a higher sand content that act as erosive agents as it is dragged along by surface runoff. There are differences between these soils: the lithic and distric Leptosols are more susceptible than the Eutrophic regosols. The former because they have an A horizon with little thickness (<10 cm); the latter because they are desaturated. The clays are more susceptible to dispersion, compared to the Eutrophic regosols, which are saturated. On the other hand, the areas with a moderate and medium level of erosion, with values between 10.1 and 50 Tm/ha/year, correspond to peneplain areas in which medium development soils predominate, such as Gleysols and Distric and Eutric cambisols, which, unlike the previous ones, have a cambic. Among them, the Distric cambisols are the most susceptible as they are desaturated, compared to the Eutric cambisols and the Distric gleysols. Finally, the tolerable levels of erosion (up to 10 Tm/ha/year) are also found in peneplain areas, with the difference that the soils are more developed, such as Chromic cambisols, Gleyic luvisols and Chromic alisols. These soils are characterised by a higher content of dehydrated iron oxides, which act as a bridge between the clay and the organic matter, giving this complex greater stability to the soil. The other two types of soil are characterised by a Bt horizon of clay illuviation, i.e., with a higher percentage of clay, and also have a higher organic matter content with a more developed clay-humic complex, which protects the soil from possible erosion.
3.3. Real Erosion Risk Cartography
This map indicates the current erosion risk (Figure 6). It has been drawn up on the basis of the potential erosion risk considering the vegetation cover factor, which gives the soil certain protection, depending on its characteristics (height, density, percentage of cover and territorial extension). In order to classify the degrees of water erosion obtained, a reclassification is carried out considering the aforementioned criteria, expressed in Tm/ha/year and mm/year.
In view of the results, the areas suffering the greatest water erosion are those located in the river beds, especially in the case of the Duero River and its most abundant tributaries. These sectors are characterised by their steep slopes, increasing the speed of surface runoff as it descends, thus carrying away the materials most susceptible to erosion. In addition to this, it coincides with areas of vegetation with little protective power and with low percentages of cover, such as conifers and broadleaf trees, which further accentuates the erosive vulnerability of these soils. These areas show severe to extreme erosion, with values ranging from 50.1 to >200 Tm/ha/year and soil losses ranging from 4.18 to >16.70 mm/year. On the other hand, we find lower erosion values in the plain areas (<4.18 mm/year), as there are no or little slopes and the characteristic vegetation provides greater protection. It has a greater density and herbaceous cover and makes this area less vulnerable to erosion.
3.4. Erosion Validation and Mitigation: Land Uses Erosion
For the validation of erosion, the real erosion cartography and the land use map (SIOSE) have been considered, making it possible to determine the uses most susceptible to erosion in order to establish possible conservation practices to mitigate these losses. Thus, the most affected uses, ordered from highest to lowest, are as follows (Figure 7): coniferous and hardwood forests, crops, olive trees, non-citrus fruit trees and scrubland. In the case of coniferous forests, the needles tend to acidify the ground when they fall, preventing the development of herbaceous plants and leaving on the ground bare and exposed to runoff.
The hardwood forests characteristic of the study area does not have an appreciable undergrowth and, therefore, leave the soil exposed to erosion. Both olive trees and non-citrus fruit trees have a very low percentage of cover with hardly any protection for the soil. Lastly but to a lesser extent, scrubland, varies according to its density; if it is denser, it will provide greater protection to the soil.
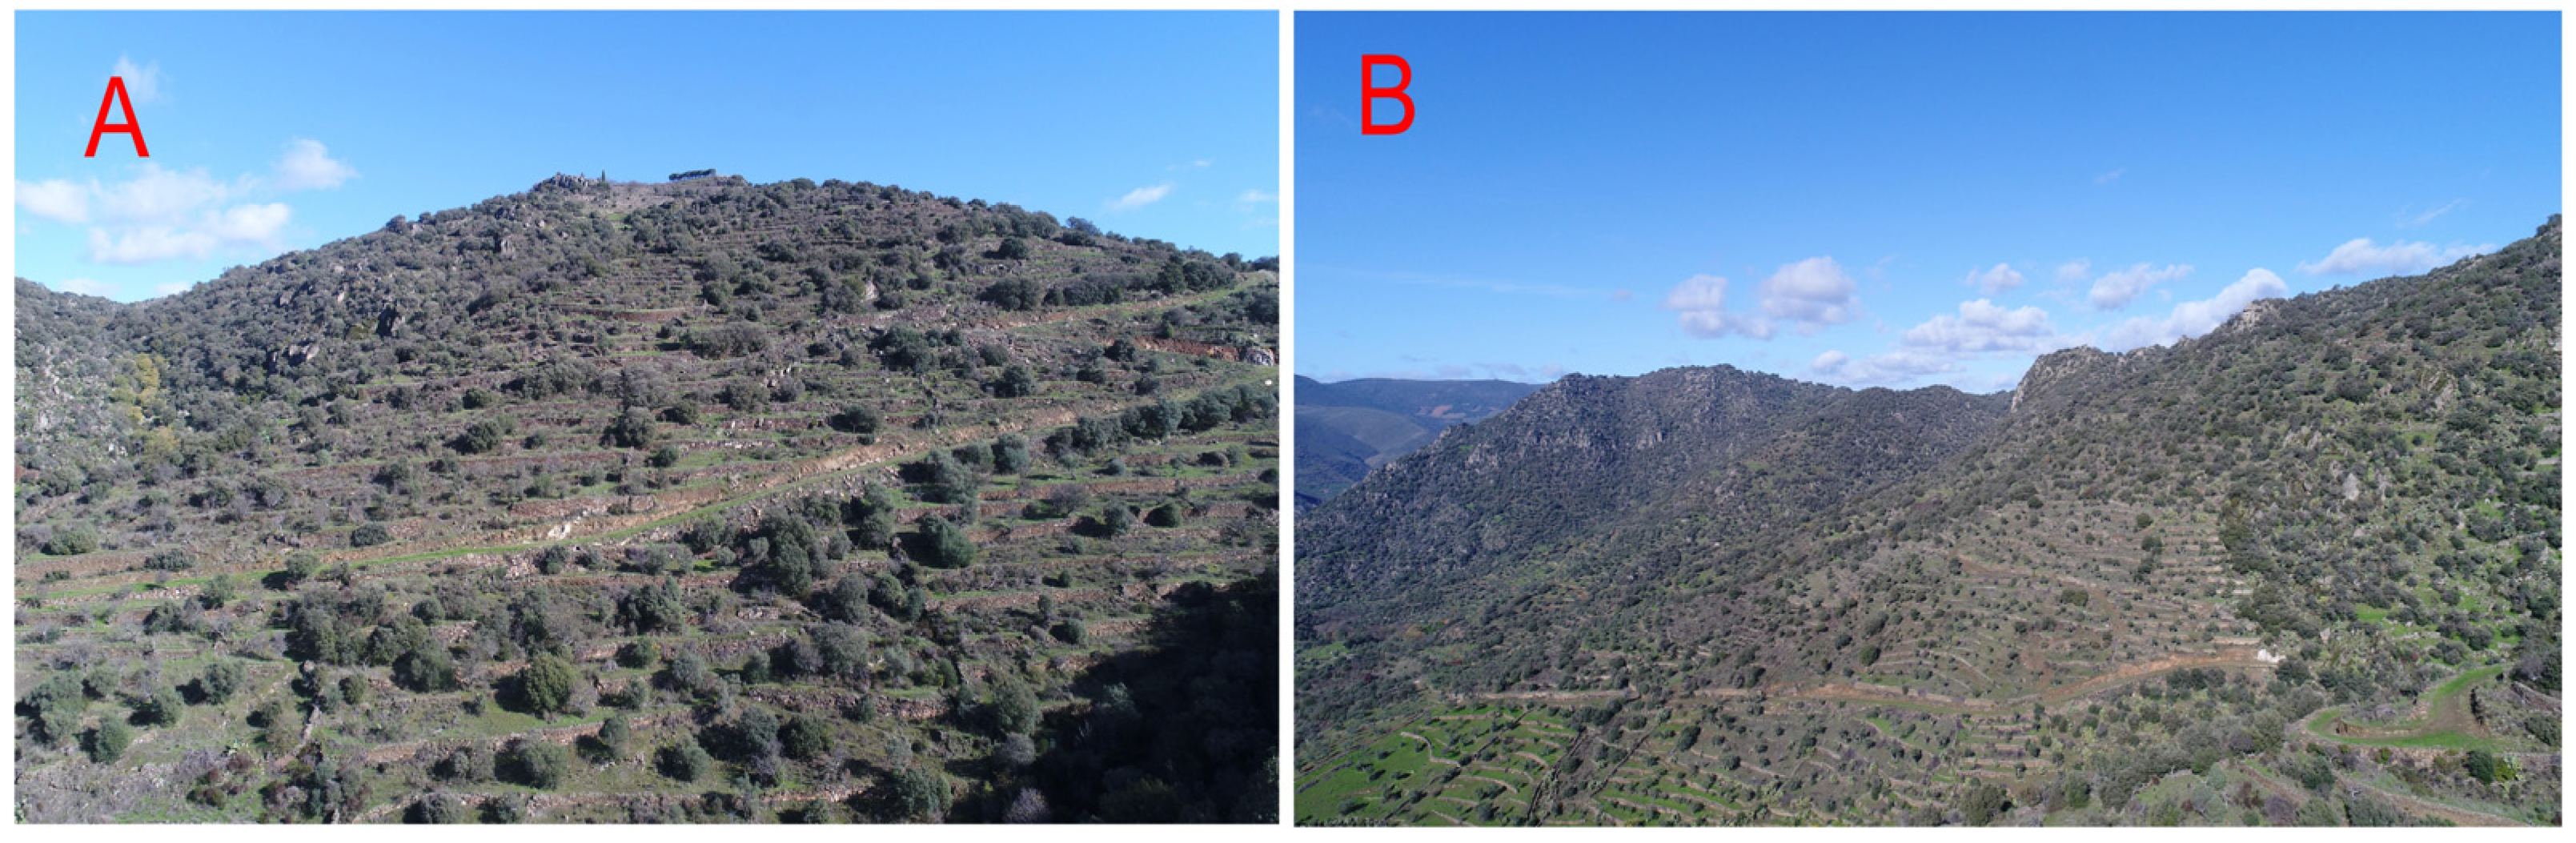
Bearing this in mind and considering that the most affected areas have a steep slope, the practices that can be carried out are: reducing their length (and thus, the speed of runoff) and breaking up the slope. Some examples of such practices are contour cultivation (following contour lines), construction of “bancales” (Figure 8A) or terraces (Figure 8B), among others. The latter have already been carried out in the area, especially with vine crops. As they do not require highly developed soils they are adapted to this type of practice. Therefore, the use of this crop and this practice is very useful for reducing erosion in these areas where the soils are not very developed and the slope is steep.
4. Conclusions
Currently, there are numerous methodologies for calculating the losses caused by water erosion in soils, most of them based on contrasted formulas but difficult to update and implement quickly taking into account current geomatic resources (high-resolution orthophotos, metric and centimetric lidar models, use of UAVs, etc.). Thus, as a novelty in this article, USLE has been implemented by means of factorial or parametric analysis in GIS, making it possible to generate an automated RUSLE model so that, with new and future technologies, erosion values can be improved in great detail. In this way, taking into account the determining components of the territory, two maps are obtained, one of potential erosion and the other of actual erosion, from which soil losses due to water erosion in the study area are calculated and quantified.
In the study area, three zones are differentiated according to their degree of erosion. The first ones are zones with an extreme level of erosion, losses of more than 200 Tm/ha/year, high slopes, poorly developed soils and vegetation with little protective power, low density and cover, such as conifers and broadleaf trees. The second ones are areas with moderate and medium erosion levels, with values between 10.1 and 50 Tm/ha/year, corresponding to the peneplain, with medium developed soils and vegetation with a certain degree of protection. The last ones are areas with tolerable levels of erosion (up to 10 Tm/ha/year) also coincide with penillanura but with more developed soils. The vegetation provides greater protection, as it has a higher density and herbaceous cover and makes this area less vulnerable to erosion.
In turn, these maps make it possible to establish in a simple way the degrees of erosion established according to the FAO, expressed in Tm/ha/year and mm/year and, together with the land use map, they constitute a low-cost non-structural measure that helps to identify the areas where it is necessary and urgent to implement conservation practices that mitigate soil losses. With this in mind, these measures will focus on reducing the length and steepness of the slope such as contour cultivation, “bancales” or terracing.
Author Contributions
Conceptualisation, L.M., A.M.M.-G., P.A.R. and M.C.; methodology, L.M.; software, L.M. and A.M.M.-G.; validation, L.M. and A.M.M.-G.; formal analysis, L.M., A.M.M.-G., P.A.R. and M.C.; investigation, L.M. and A.M.M.-G.; resources, L.M., A.M.M.-G., P.A.R. and M.C.; data curation, L.M. and A.M.M.-G.; writing—original draft preparation, L.M. and A.M.M.-G.; writing—review and editing, L.M. and A.M.M.-G.; visualisation, L.M. and A.M.M.-G.; supervision, A.M.M.-G.; project administration, A.M.M.-G.; funding acquisition, A.M.M.-G. All authors have read and agreed to the published version of the manuscript.
Funding
This research was assisted by Project TED2021-131874B-I00 (ATENCACLI) funded by the Ministry of Science and Innovation.
Data Availability Statement
Not applicable.
Acknowledgments
This research was assisted GEAPAGE research group (Environmental Geomorphology and Geological Heritage) of the University of Salamanca.
Conflicts of Interest
The authors declare no conflict of interest.
References
- Pimentel, D. Soil erosión: A food and environmental threat. Environ. Dev. Sustain. 2006, 8, 119–137. [Google Scholar] [CrossRef]
- Parveen, R.; Kumar, U. Integrated Approach of Universal Soil Loss Equation (USLE) and Geographical Information System (GIS) for Soil Loss Risk Assessment in Upper South Koel Basin, Jharkhand. J. Geogr. Inf. Syst. 2012, 4, 26324. [Google Scholar] [CrossRef] [Green Version]
- Bakker, M.M.; Govers, G.; Kosmas, C.; Vanacker, V.; Van Oost, K.; Rounsevell, M. Soil erosión as a driver of land-use change. Agric. Ecosyst. Environ. 2005, 105, 467–481. [Google Scholar] [CrossRef]
- Ighodaro, I.D.; Lategan, F.S.; Yusuf, S.F. The impact of soil erosión on agricultural potential and performance of Sheshegu community farmers in the Eastern Cape of South Africa. J. Agric. Sci. 2013, 5, 140. [Google Scholar] [CrossRef] [Green Version]
- Littleboy, M.; Freebairn, D.M.; Hammer, G.L.; Silburn, D.M. Impact of soil erosión on production in cropping systems, II. Simulation of production and erosión risks for a wheat cropping system. Soil Res. 1992, 30, 775–788. [Google Scholar] [CrossRef]
- Angima, S.D.; Stott, D.E.; O’neill, M.K.; Ong, C.K.; Weesies, G.A. Soil erosión prediction using RUSLE for central Kenyan highland conditions. Agric. Ecosyst. Environ. 2003, 97, 295–308. [Google Scholar] [CrossRef]
- Biesemans, J.; Van Meirvenne, M.; Gabriels, D. Extending the RUSLE with the Monte Carlo error propagation technique to predict long-term average off-site sediment accumulation. J. Soil Water Conserv. 2000, 55, 35–42. [Google Scholar]
- Food and Agriculture Organization of the Unites Nations. 2015 Food and Agriculture Organization of the Unites Nations Soil Change: Impacts and Responses; FAO: Rome, Italy, 2015; ISBN 978-92-5-109004-6. [Google Scholar]
- Hao, H.X.; Wang, J.G.; Guo, Z.L.; Hua, L. Water erosión processes and dynamic changes of sediment size distribution under the combined effects of rainfall and overland flow. Catena 2019, 173, 494–504. [Google Scholar] [CrossRef]
- Nearing, M.A.; Yin, S.Q.; Borrelli, P.; Polyakov, V.O. Rainfall erosivity: An historical review. Catena 2017, 157, 357–362. [Google Scholar] [CrossRef]
- Pereira, T.S.R.; dos Santos, K.A.; da Silva, B.F.; Formiga, K.T.M. Determinação e espacialização da perda de solo da bacia hidrográfica do Córrego Cascavel, Goiás. Rev. Geográfica Acadêmica 2015, 9, 76–93. [Google Scholar] [CrossRef] [Green Version]
- Wischmeier, W.H.; Smith, D.D. Predicting Rainfall Erosión Losses: A Guide to Conservation Planning (No. 537); Department of Agriculture, Science and Education Administration: Washinton DC, USA, 1978. [Google Scholar]
- Abdulkareem, J.H.; Pradhan, B.; Sulaiman, W.N.A.; Jamil, N.R. Prediction of spatial soil loss impacted by long-term land-use/land-cover change in a tropical watershed. Geosci. Front. 2019, 10, 389–403. [Google Scholar] [CrossRef]
- Nascimento, D.T.F.; Romão, P.D.A.; Sales, M.M. Erosividade e Erodibilidade ao Longo de Dutovia Cortando os Estados de Minas Gerais e Goiás–Brasil. 2018. Available online: http://repositorio.bc.ufg.br/handle/ri/17285 (accessed on 22 November 2022).
- Zhou, W.; Wu, B. Evaluación de la erosión del suelo y la tasa de entrega de sedimentos utilizando sensores remotos y SIG: Un estudio de caso de la cuenca del río Chaobaihe río arriba, en el norte de China. Rev. Int. Investig. Sedimentos 2008, 23, 167–173. [Google Scholar]
- Buttafuoco, G.; Conforti, M.; Aucelli, P.P.C.; Robustelli, G.Y.; Scarciglia, F. Evaluación de la incertidumbre espacial en el mapeo del factor de erosiónabilidad del suelo mediante simulación estocástica geoestadística. Cienc. Ambient. Tierra 2012, 66, 1111–1125. [Google Scholar]
- Prasannakumar, V.; Vijith, H.; Abinod, S.G. NJGF Estimación del riesgo de erosión del suelo dentro de una pequeña subcuenca montañosa en Kerala, India, utilizando la Ecuación Universal Revisada de Pérdida de Suelo (RUSLE) y tecnología de geoinformación. Front. Geocienc. 2012, 3, 209–215. [Google Scholar] [CrossRef] [Green Version]
- Barbosa, A.F.; de Oliveira, E.F.; Mioto, C.L.; Paranhos Filho, A.C. Aplicação da Equação Universal de Perda do Solo (USLE) em Softwares Livres e Gratuitos. Anuário Inst. Geociências 2015, 38, 170–179. [Google Scholar] [CrossRef]
- Durães, M.F.; Mello, C.R.D. Distribuição espacial da erosão potencial e atual do solo na Bacia Hidrográfica do Rio Sapucaí, MG. Eng. Sanitária Ambient. 2016, 21, 677–685. [Google Scholar] [CrossRef] [Green Version]
- Amore, E.; Modica, C.; Nearing, M.A.; Santoro, V.C. Scale effect in USLE and WEPP application for soil erosión computation from three Sicilian basins. J. Hydrol. 2004, 293, 100–114. [Google Scholar] [CrossRef]
- Jena, S.K.; Kumar, A.; Brahmanand, P.S.; Mishra, A.; Sahoo, N.; Patil, D.U. Design and development of rubber dams for watersheds in the climate change scenario. In Climate Change Modelling, Planning and Policy for Agriculture; Springer: New Delhi, India, 2015; pp. 93–98. [Google Scholar]
- Singh, G.P. RK Evaluación basada en celdas de cuadrícula del potencial de erosión del suelo para la identificación de áreas críticas propensas a la erosión utilizando USLE, GIS y sensores remotos: Un estudio de caso en la cuenca de Kapgari, India. Investig. Int. Conserv. Suelos Aguas 2017, 5, 202–211. [Google Scholar]
- Wischmeier, W.H.; Smith, D.D. Predicting Rainfall-Erosión Losses from Cropland East of the Rocky Mountains; Department of Agriculture, Science and Education Administration: Washinton, DC, USA, 1965. [Google Scholar]
- Lufafa, A.; Tenywa, M.M.; Isabirye, M.; Majaliwa, M.J.G.; Woomer, P.L. Prediction of soil erosion in a Lake Victoria basin catchment using a GIS-based Universal Soil Loss model. Agric. Syst. 2003, 76, 883–894. [Google Scholar] [CrossRef]
- Alewell, C.; Borrelli, P.; Meusburger, K.; Panagos, P. Using the USLE: Chances, challenges and limitations of soil erosion modelling. Int. Soil Water Conserv. Res. 2019, 7, 203–225. [Google Scholar] [CrossRef]
- Borrelli, P.; Alewell, C.; Alvarez, P.; Anache, J.A.A.; Baartman, J.; Ballabio, C.; Panagos, P. Soil erosion modelling: A global review and statistical analysis. Sci. Total Environ. 2021, 780, 146494. [Google Scholar] [CrossRef] [PubMed]
- Bagarello, V.; Di Stefano, C.; Ferro, V.; Pampalone, V. Predicting maximum annual values of event soil loss by USLE-type models. Catena 2017, 155, 10–19. [Google Scholar] [CrossRef]
- Beskow, S.; Mello, C.R.; Norton, L.D.; Curi, N.; Viola, M.R.; Avanzi, J.C. Soil erosion prediction in the Grande River Basin, Brazil using distributed modeling. Catena 2009, 79, 49–59. [Google Scholar] [CrossRef]
- Yue, T.; Xie, Y.; Yin, S.; Yu, B.; Miao, C.; Wang, W. Effect of time resolution of rainfall measurements on the erosivity factor in the USLE in China. Int. Soil Water Conserv. Res. 2020, 8, 373–382. [Google Scholar] [CrossRef]
- Gericke, A.; Kiesel, J.; Deumlich, D.; Venohr, M. Recent and future changes in rainfall erosivity and implications for the soil erosión risk in brandenburg, ne germany. Water 2019, 11, 904. [Google Scholar] [CrossRef] [Green Version]
- Wang, C.; Shan, L.; Liu, X.; Yang, Q.; Cruse, R.M.; Liu, B.; Pang, G. Impacts of horizontal resolution and downscaling on the USLE LS factor for different terrains. Int. Soil Water Conserv. Res. 2020, 8, 363–372. [Google Scholar] [CrossRef]
- dos Santos Alves, W.; Martins, A.P.; Morais, W.A.; Pôssa, É.M.; Castro, R.M.; de Moura, D.M.B. USLE modelling of soil loss in a Brazilian cerrado catchment. Remote Sens. Appl. Soc. Environ. 2022, 27, 100788. [Google Scholar]
- Qin, W.; Guo, Q.; Cao, W.; Yin, Z.; Yan, Q.; Shan, Z.; Zheng, F. A new RUSLE slope length factor and its application to soil erosión assessment in a Loess Plateau watershed. Soil Tillage Res. 2018, 182, 10–24. [Google Scholar] [CrossRef]
- Graña, A.M.; Goy, J.L.; Forteza, J.; Zazo, C.; Barrera, I.; González, F.M. Riesgo de pérdida de suelo en los espacios naturales de Batuecas-S. Francia y Quilamas (Salamanca, España). In I Simposio Nacional sobre Control dela Erosión y Degradación del Suelo; Bienes, R., Marqués, M.J., Eds.; Aplicación cartográfica mediante SIG. Libro; Universidad Autónoma de: Madrid, Spain, 2003; pp. 593–596. [Google Scholar]
- Martínez-Graña, A.M.; Sánchez Martín, N.; Goy, J.L.; Zazo, C.; Baile, L.; Forteza, J. Cartografía de Riesgo de Erosión del ENP “Las Batuecas-Sierra de Francia y Quilamas (Salamanca, España)” Mediante Técnicas de Teledetección y SIG. 2005. Available online: http://hdl.handle.net/10261/250177 (accessed on 22 November 2022).
- Fistikoglu, O.; Harmancioglu, N.B. Integration of GIS with USLE in assessment of soil erosion. Water Resour. Manag. 2002, 16, 447–467. [Google Scholar] [CrossRef]
- Gunawan, G.; Sutjiningsih, D.; Soeryantono, H.; Sulistioweni, S. Soil erosión estimation based on GIS and remote sensing for supporting integrated water resources conservation management. Int. J. Tecnol. 2013, 4, 157–166. [Google Scholar] [CrossRef] [Green Version]
- Le Hung, T.; Tuyen, V.D. Evaluation of soil erosión risk using remote sensing and GIS data (A case study: Lang Chanh district, Thanh Hoa province, Vietnam). Becmнuк Aгpapнoй Hayкu 2015, 55, 57–64. [Google Scholar]
- Ali, S.A.; Hagos, H. Estimation of soil erosión using USLE and GIS in Awassa Catchment, Rift valley. Cent. Ethiop. Geoderma Reg. 2016, 7, 159–166. [Google Scholar] [CrossRef]
- Belasri, A.; Lakhouili, A. Estimation of soil erosión risk using the universal soil loss equation (USLE) and geo-information technology in Oued El Makhazine Watershed, Morocco. J. Geogr. Inf. Syst. 2016, 8, 98. [Google Scholar] [CrossRef] [Green Version]
- Martínez-Graña, A.; Carrillo, J.; Lombana, L.; Criado, M.; Palacios, C. Mapping the Risk of Water Soil Erosión in Larrodrigo (Salamanca, Spain) Using the RUSLE Model and A-DInSAR Technique. Agronomy 2021, 11, 2120. [Google Scholar] [CrossRef]
- Martínez-Graña, A.M.; Goy, J.L.; Cimarra, C. 2D to 3D geologic map transformation using virtual globes, flight simulators, and their applications in the analysis of geodiversity in natural areas. Environ. Earth Sci. 2015, 73, 8023–8034. [Google Scholar] [CrossRef]
- Martínez-Graña, A.; Goy, J.L.; González-Delgado, J.A.; Cruz, R.; Sanz, J.; Bustamante, I. 3D Virtual itinerary in the Geological Heritage from Natural Parks in Salamanca-Ávila-Cáceres, Spain. Sustainability 2019, 11, 144. [Google Scholar] [CrossRef]
- Marino Alfonso, J.L.; Poblete Piedrabuena, M.A.; Beato Bergua, S. Paisajes de Interés Natural (PIN) en los Arribes del Duero (Zamora, España). Investig. Geográficas 2020, 73, 95–119. [Google Scholar] [CrossRef] [Green Version]
- Graña, A.M.M.; Goy, J.L.G.; Cruz, R.; Bonnin, J.F.; Zazo, C.; Barrera, I. Cartografía del riesgo de erosión hídrica mediante sig en los espacios naturales de candelario–Gredos (Salamanca, Avila). Edafología 2006, 13, 11–20. [Google Scholar]
- de Agricultura, M.; Alimentacion, P. Sistema de Información Geográfica de Datos Agrarios. Consultado el 20 de Octubre del 2022. Disponible en. Available online: https://sig.mapama.gob.es/siga/ (accessed on 22 November 2022).
- Arnoldo, H.M.J. Una Aproximación del Factor de Lluvia en la Ecuación Universal de Pérdida de Suelo. Una Aproximación del Factor de Lluvia en la Ecuación Universal de Pérdida de Suelo; John Wiley and Sons: Madrid, Spain, 1980; pp. 127–132. [Google Scholar]
- Instituto para la Conservación de la Naturaleza (ICONA). Mapas de Estados Erosivos. In Cuenca Hidrográfica del Duero; ICONA: Madrid, Spain, 1990; 96p. [Google Scholar]
- Zhang, H.; Yang, Q.; Li, R.; Liu, Q.; Moore, D.; He, P.; Geissen, V. Ampliación de un procedimiento GIS para calcular el factor LS de la ecuación RUSLE. Inf. Y Geocienc. 2013, 52, 177–188. [Google Scholar]
- Moore, I.D.; Burch, G.J. Base física del factor longitud-pendiente en la ecuación universal de pérdida de suelo. Soil Sci. Soc. Am. J. 1986, 50, 1294–1298. [Google Scholar] [CrossRef]
- Wischmeier, W.H. New developments in estimating water erosión. In Proceedings of the 29th Annual Meeting of the Soil Conservation Society of America, Ankeney, IA, USA, 4–6 May 1974; pp. 179–186. [Google Scholar]
- Merchán, L.; Martínez-Graña, A.M.; Egido, J.A.; Criado, M. Geomorphoedaphic Itinerary of Arribes Del Duero (Spain). Sustainability 2022, 14, 7066. [Google Scholar] [CrossRef]
Figure 1.
Study area located in: (A) Spain; (B) Castilla y León. (C) Arribes del Duero, highlighting the main villages and rivers, weather stations and soil profiles.
Figure 1.
Study area located in: (A) Spain; (B) Castilla y León. (C) Arribes del Duero, highlighting the main villages and rivers, weather stations and soil profiles.

Figure 2.
Methodological scheme for mapping water erosion risks in the Arribes del Duero Natural Park.
Figure 2.
Methodological scheme for mapping water erosion risks in the Arribes del Duero Natural Park.

Figure 3.
USLE factors: (A) Rainfall Erosivity Factor (R); (B) Soil Erodibility Factor (K); (C) Topographic Factor (LS); (D) Vegetation Cover Factor (C).
Figure 3.
USLE factors: (A) Rainfall Erosivity Factor (R); (B) Soil Erodibility Factor (K); (C) Topographic Factor (LS); (D) Vegetation Cover Factor (C).

Figure 4.
Potential Erosion Map. Zone 1: province of Salamanca; Zona 2: province of Zamora.

Figure 5.
Erosional forms observed: (A) Rills; (B) Gullies.
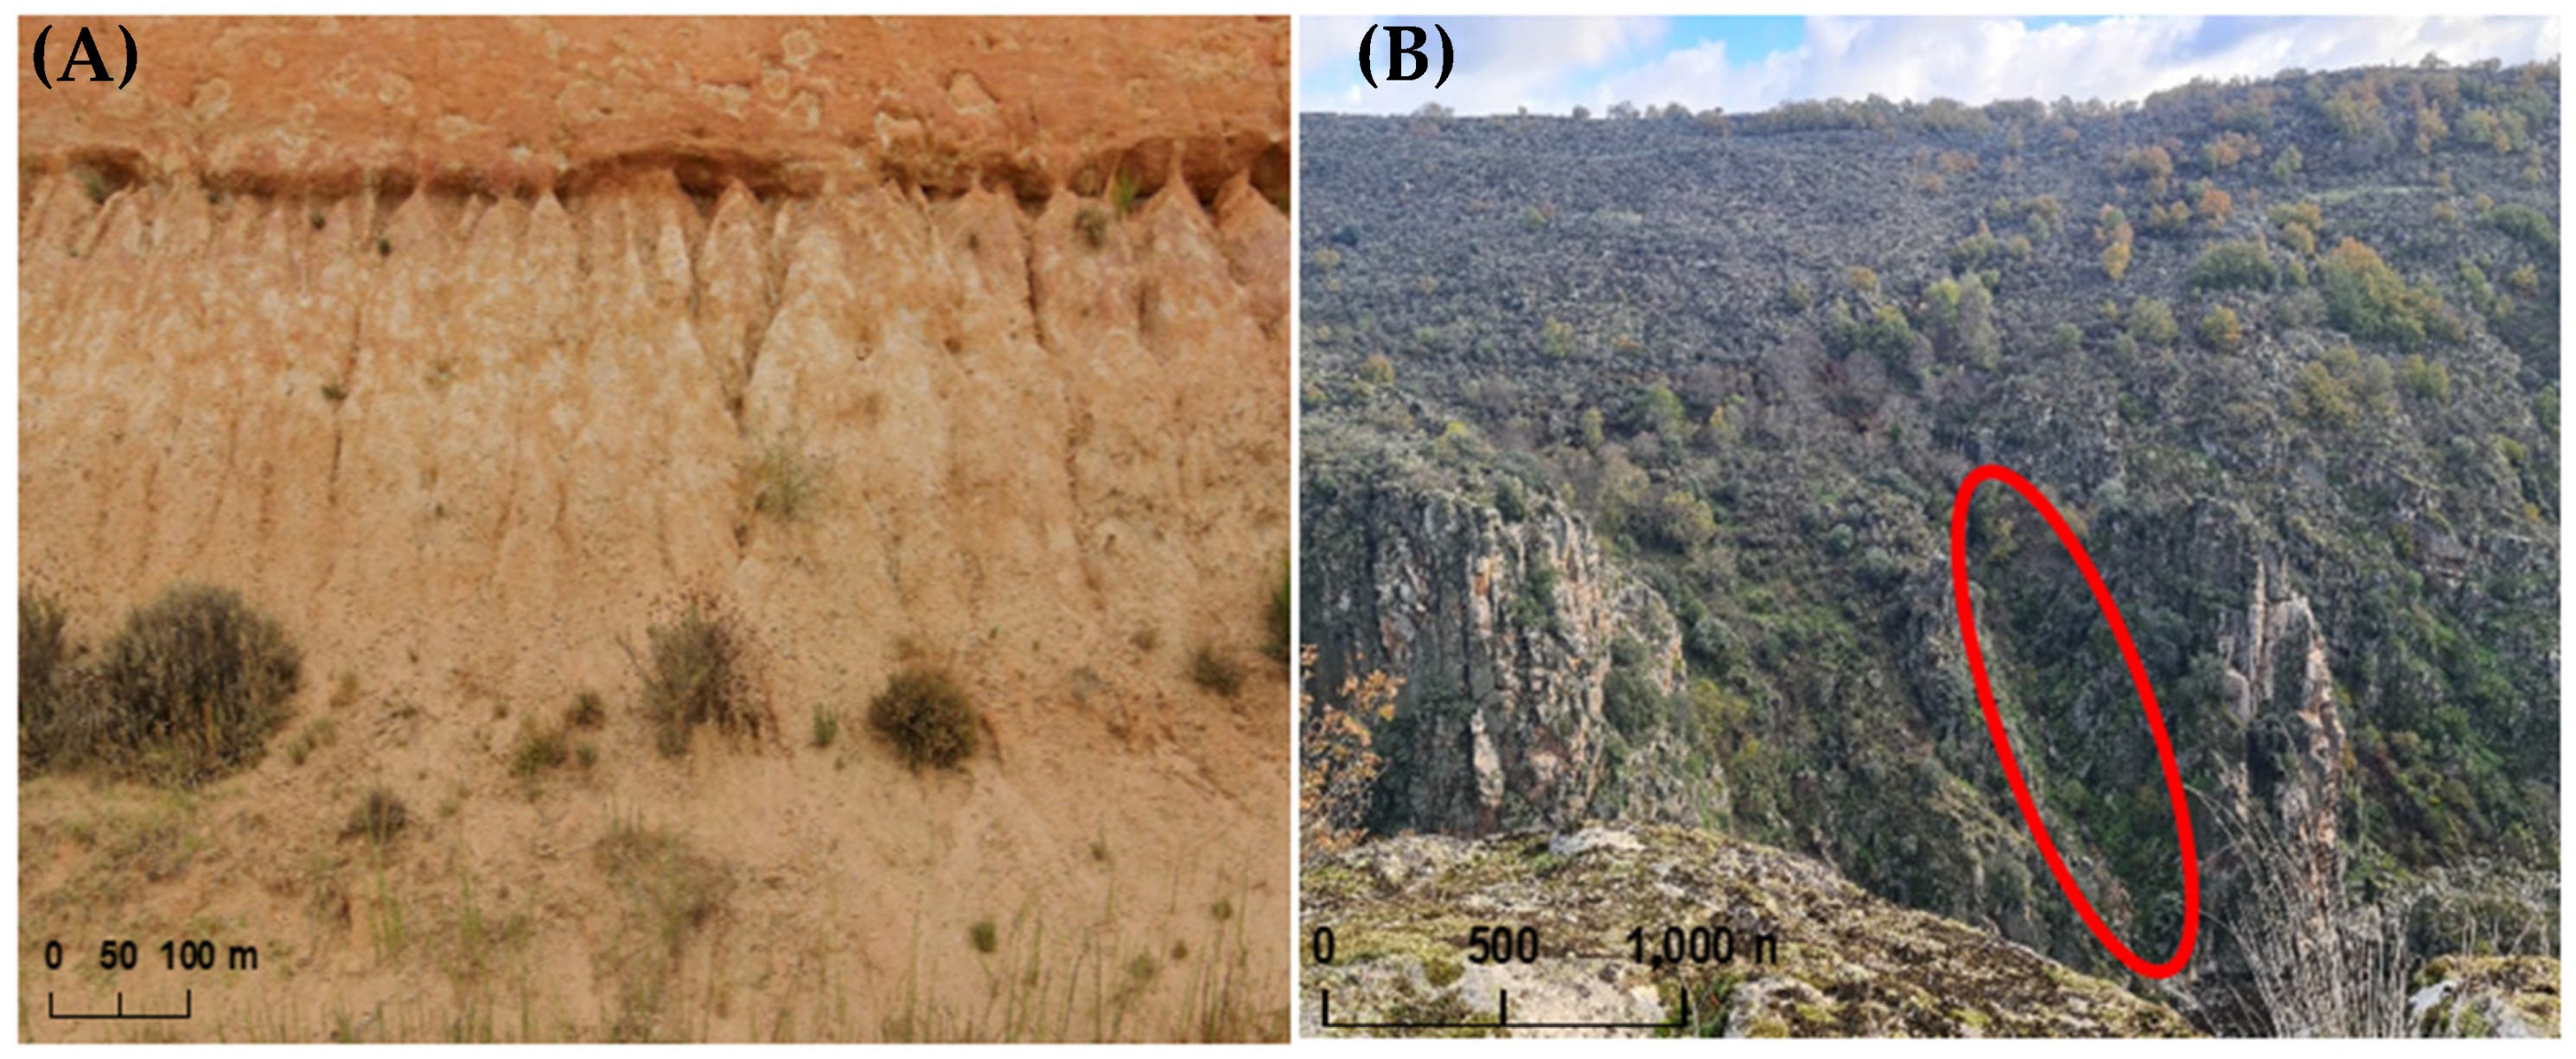
Figure 6.
Real Erosion Map. Zone 1: province of Salamanca; Zona 2: province of Zamora.

Figure 7.
Land uses most affected by erosion. Zone 1: province of Salamanca; Zona 2: province of Zamora.
Figure 7.
Land uses most affected by erosion. Zone 1: province of Salamanca; Zona 2: province of Zamora.

Figure 8.
Conservation practices observed: (A) “Bancales”; (B) Terraces.

Table 1.
Annual soil loss classification.
| Types of Erosion | Loss of Soil (Tm/ha/year) |
|---|---|
| Very low erosion and tolerable soil loss | <5 |
| Low erosion and tolerable soil losses | 5.1–10 |
| Mild erosion level | 10.1–25 |
| Moderate erosion level | 25.1–50 |
| Severe erosion level | 50.1–100 |
| Very severe erosion level | 100.1–200 |
| Extreme erosive level | >200 |
Table 2.
Erodibility values.
| Soil Type | K Value |
|---|---|
| Gleyc luvisols | 0.12 |
| Chromic alisols | 0.17 |
| Chromic cambisols | 0.19 |
| Dystric gleysols | 0.20 |
| Eutric cambisols | 0.22 |
| Dystric cambisols | 0.24 |
| Eutric regosols | 0.28 |
| Dystric regosols | 0.38 |
| Dystric leptosols | 0.39 |
| Lithic leptosols | 0.49 |
Table 3.
Vegetation Cover Values.
| Vegetation Cover Type | C Value |
|---|---|
| Mixed hardwood forests | 0.003 |
| Mediterranean scrub | 0.04 |
| Riparian forest | 0.09 |
| Poplar and banana plantations in production | 0.09 |
| Ash groves | 0.09 |
| Wild olive groves | 0.18 |
| Juniper groves | 0.18 |
| Cork oak groves | 0.19 |
| Meadows | 0.19 |
| Holm oak groves | 0.19 |
| Oak groves | 0.19 |
| Chestnut groves | 0.22 |
| Non wooded | 0.24 |
| Mixed conifers | 0.42 |
Disclaimer/Publisher’s Note: The statements, opinions and data contained in all publications are solely those of the individual author(s) and contributor(s) and not of MDPI and/or the editor(s). MDPI and/or the editor(s) disclaim responsibility for any injury to people or property resulting from any ideas, methods, instructions or products referred to in the content. |
© 2023 by the authors. Licensee MDPI, Basel, Switzerland. This article is an open access article distributed under the terms and conditions of the Creative Commons Attribution (CC BY) license (https://creativecommons.org/licenses/by/4.0/).
Share and Cite
MDPI and ACS Style
Merchán, L.; Martínez-Graña, A.M.; Alonso Rojo, P.; Criado, M. Water Erosion Risk Analysis in the Arribes del Duero Natural Park (Spain) Using RUSLE and GIS Techniques. Sustainability 2023, 15, 1627. https://doi.org/10.3390/su15021627
AMA Style
Merchán L, Martínez-Graña AM, Alonso Rojo P, Criado M. Water Erosion Risk Analysis in the Arribes del Duero Natural Park (Spain) Using RUSLE and GIS Techniques. Sustainability. 2023; 15(2):1627. https://doi.org/10.3390/su15021627
Chicago/Turabian StyleMerchán, Leticia, Antonio Miguel Martínez-Graña, Pilar Alonso Rojo, and Marco Criado. 2023. "Water Erosion Risk Analysis in the Arribes del Duero Natural Park (Spain) Using RUSLE and GIS Techniques" Sustainability 15, no. 2: 1627. https://doi.org/10.3390/su15021627
Note that from the first issue of 2016, this journal uses article numbers instead of page numbers. See further details here.