
Does the Collaboration of Digitalization Foster Regional Green Development?

1
Business School, Suzhou University of Science and Technology, Suzhou 215009, China
2
School of Economics, Wuhan Polytechnic University, Wuhan 430040, China
*
Author to whom correspondence should be addressed.
Sustainability 2023, 15(20), 14799; https://doi.org/10.3390/su152014799
Submission received: 25 August 2023
/
Revised: 25 September 2023
/
Accepted: 2 October 2023
/
Published: 12 October 2023
(This article belongs to the Special Issue Digital Innovation for Sustainable Development)
Abstract
:The collaboration of digitalization refers to a comprehensive digital governance system that achieves cross-regional digital industrialization and deep integration of industrial digitization through the construction of digital infrastructure, which paves the way toward regional sustainability. However, little is known about whether and to what extent regional digital collaboration contributes to green development. Furthermore, the specific role of digital collaboration in greening the regional economy and society remains unexplored. Thus, this paper tests the relationship between digital collaboration, business environment, and regional green development by using data from 285 prefecture-level cities in China from 2008 to 2022. The findings suggest that: (1) the hysteresis phenomenon of the “green dividend effect” response to regional digital collaboration is present; (2) digital collaboration in eastern cities positively impacted (but lagged) the greening of the economy and society, but cities in central and western regions negatively impact this process; (3) the business environment mediates the relationship between the lagged digital collaboration and regional green development, and it positively moderates the relationship between both the current and lagged digital collaboration and regional green development. By elucidating the relationship between digital collaboration, business environment, and regional green development, contributions have been made to previous digital innovation literature, and management insights have been provided for how regions can promote green development in the digital age.
1. Introduction
Promoting green development in cities has become a heated issue with the goal of achieving carbon peak and carbon neutrality [1,2] As an important global economy, China has achieved rapid development since the reform and opening up, and it has gradually relied on “factor-driven investment” to create the “China miracle”, becoming the main driving force for world economic growth [3]. With the changes in the stages of economic development, the contradiction between environmental governance and economic growth has become increasingly prominent, seriously constraining the high-quality development of the future economy and society [4,5]. According to statistics, in 2011, the proportion of coal consumption was 70.2%. During the period from 2012 to 2021, this proportion continued to decline, reaching 56% in 2021. In 2022, the total energy consumption was 5.41 billion tons of standard coal, a year-on-year increase of 2.9%. Coal accounted for 56.2% of the total energy consumption, a year-on-year increase of 0.3 percentage points, and clean energy consumption accounted for 25.9% of the total energy consumption. It can be seen that, although the transformation of the energy consumption structure is continuously advancing, economic growth still comes at the cost of high environmental pollution. In this context, China has proposed the concept of green development and made it a strategic choice for regional economic development.
In the era of digital economy, digitization, as a typical characteristic of the era, has been demonstrated in the relevant literature for its importance to regional green development [4,6,7,8]. Digitalization can accelerate the speed of knowledge spillover and information exchange in innovation networks, facilitate enterprises to acquire advanced technologies at lower costs, and promote technological upgrading and green transformation of production methods [3]. In addition, digital technology can break through the traditional temporal and spatial boundaries and achieve intensive integration and efficient utilization of production factors, thereby improving economic efficiency and promoting urban green development [4,9,10]. However, with the deepening of digital transformation, academia and industry have become increasingly aware that digital transformation is no longer an independent act of a single entity but a joint action between entities. Only by achieving coordinated cooperation in digital transformation and forming a chain network structure based on effective digital technology links and interactions, namely digital collaboration, can all entities fully enjoy the dividends brought by digitalization and avoid falling into the so-called “Solow paradox” [11,12,13,14]. Therefore, compared to the digital development index of a single region, the digital synergy index between regions can more comprehensively and systematically examine the role and effect of digital technology penetration in regional green development. This is conducive to fully evaluating the green momentum that digital technology can unleash in the process of deep integration into economic and social development, and to a greater extent, clarifying the threshold conditions for digitalization to play a role.
Another focus of this article is to explore how digital collaboration affects regional green development from the perspective of the business environment. The business environment is an important comprehensive element that promotes the development of enterprises, including social, economic, political, and legal aspects [15,16], and the green production and operation activities of enterprises are considered one of the important ways to promote regional green development [17,18,19]. Thus, the business environment has a significant impact on regional green development. Meanwhile, digital collaboration between regions can encourage enterprises to strengthen information sharing and coordination with partners, governments, and markets through digital channels based on independent digital transformation, an increase in information transparency and reliability, and a reduction in resource acquisition costs [3,13], thereby optimizing the regional business environment. The business environment is recognized as playing a crucial role in the relationship between digital collaboration and regional green development. Therefore, both the mediating and moderating effects of the business environment will be further examined in order to explore how they affect the relationship between digital collaboration and regional green development.
To sum up, this paper will empirically explore the impact of digital collaboration on regional green development and analyze the mediating and moderating effects of the business environment between them by introducing the Tobit Model, Propensity Score Matching (PSM) Method, Mediation Model, and Moderation Model. The potential contributions of this paper are as follows: (1) The previous literature mainly explores the effects and mechanisms of the digitalization of a single region on green development, while digitalization is not an independent behavior of a single entity, but a joint action between entities. Thus, it is necessary to examine the “Green Dividend Effect” of digitalization from the perspective of digital collaboration. Accordingly, this paper will construct an evaluation system for digital collaboration between regions, and further clarify the impact of digital collaboration on regional green development through theoretical analysis and empirical testing, which deepens the understanding of regional digitization and its role in green development. (2) Enterprises are considered important entities in promoting regional green development, and the business environment can comprehensively reflect the green development environment of enterprises from the perspectives of environmental regulation, green market demand, public supervision, etc. This indicates that they will play an important role in the process of digital collaborative impact on regional green development. Therefore, this study attempts to reveal the internal mechanisms of the role of digital collaboration in regional green development from the perspective of both the mediating and regulating effects of the business environment in order to expand the understanding of environmental regulations and market green demands on which green development relies. This enriches the literature that reveals the impact of digital transformation on regional green development mechanisms. (3) Analyzing the relationship between digital collaboration, business environment, and green development from the eastern, central, and western regions can ensure the robustness of benchmark regression, and also discover the differences in the green dividend effects of digital collaboration in different regions, thus to some extent confirming the geographical conditions under which digital collaboration exerts its effects. This provides a theoretical extension for the existing literature to explore the differences in the effects of digital transformation on regional green development.
The paper is structured as follows: Section 2 synthesizes the literature regarding the link between digital collaboration and regional green innovation as well as the literature concerning the mediating and moderating effect of the business environment. Section 3 describes the methodology, involving the measurement of the digital collaborative index and green development level, model setting, data, and sampling. Section 4 presents empirical findings and discussions. Section 5 outlines the conclusions, research limitations, and future directions.
2. Literature Review and Research Hypothesis
2.1. Digital Collaboration and Regional Green Development
Collaboration is the overall effect generated by the integration of physical resources or the sharing of hidden resources [14,18,20]. Drawing on the research of Li et al. (2022) [13], regional digital collaboration refers to the sharing and coordination of infrastructure construction, digital industrialization, industrial digitization, and digital governance among regions through digital channels. Based on the essential characteristics of digitization, networking, intelligence, and sharing in the digital economy [3,7,10], digital collaboration strengthens regional interaction and cooperation, which is conducive to improving regional resource utilization efficiency, forming a circular economy system, reducing pollution emissions, and promoting regional green development [4,21,22]. On the practical level, on the one hand, limited by spatial isolation, forming a benign industrial agglomeration pattern requires significant costs. On the other hand, the competitive effect between neighboring regions hinders inter-regional cooperation, so the positive externalities of industrial agglomeration and regional cooperation cannot be fully utilized [23,24,25]. With the development of the digital economy and the formation of digital synergy, spatial isolation is no longer an obstacle to regional cooperation, and remote cooperation between regions is more convenient. The forms of cooperation have been given a new understanding in the digital era and are no longer limited by the negative impact of “neighboring government competition” [26]. The digital collaboration between regions in areas such as digital infrastructure, digital industrialization, industrial digitization, and digital governance will be more conducive to the emergence of new industries, formats, and models, such as the sharing economy, remote healthcare, online offices, online education, and platform economy on a large scale [27], effectively aggregating fragmented demand and supply information and accelerating product matching and trading [28,29]. This will reduce the search costs for enterprises and users between regions caused by information asymmetry, greatly improve economic operational efficiency, and thereby promote regional green development [24]. Therefore, compared to the role and effects of digitalization in green development in a single region, such as green total factor energy efficiency, green economic recovery, green innovation performance, and other fields [4,7,30], the digital synergy between regions is conducive to a more comprehensive and systematic examination of the role and effects of digitalization in these fields. This is conducive to fully evaluating the kinetic energy that digitalization can stimulate in driving regional green development and clarifying the conditions for digitalization to play a greater role.
Based on this, this paper proposes hypothesis 1 (see Figure 1):
Hypothesis 1 (H1):
Digital collaboration can directly promote the improvement of the regional green development level.
2.2. The Moderating and Mediating Effects of the Business Environment
In the current new era of green economy development, digital collaboration emphasizes the deep use of digital technology among related regions for comprehensive collaborative transformation, including the collaborative construction of a green business environment. At the same time, the business environment is an important factor that promotes enterprises to build green competitive advantages and drive regional green development [16], at both the government and market levels, such as government subsidies and government tax [31,32,33], public supervision [3], and market green demand [34,35]. Therefore, the business environment plays an important role in the relationship between digital collaboration and regional green development. In addition, due to significant differences in environmental protection standards for the development of different industries in different regions of China at present, the role of the business environment may have both an intermediary and a regulatory role.
Digital collaboration can significantly improve the level of the regional business environment. This mechanism is specifically manifested in various ways. The first is the role of the business environment in maintaining market operations. Digital collaboration is able to support cross regional enterprises to jointly build a symbiotic ecological network for digital transformation through the openness, affordability, and generativity of digital technology, resulting in information-sharing effects, resource aggregation effects, and resource integration effects, thus promoting the green development of enterprises (including green technology innovation and sustainable development) [36,37,38]. The second is the guiding role of the business environment in the market’s green demand. With the improvement in consumers’ requirements for the quality of the living environment, green consumption demand will become an inevitable trend in the development of market demand. Digital collaboration can enable consumers to trace and monitor product production, logistics, and transportation information through the Internet of Things technology, which will drive enterprises toward green development [19,39,40]. As for promoting the efficiency of green regulation, digital collaboration is considered to have the potential to encourage regional governments to jointly monitor environmental quality, pollution emissions, river water quality, and environmental carrying capacity in real-time through the application of digital technologies such as big data, cloud computing, artificial intelligence, and remote sensing [8,38,41], thereby avoiding “pollution flight” [42]. This not only improves the government’s regulatory level on resources and the environment but also provides support for the transformation of regional green development. The above analysis indicates that digital collaboration can significantly improve the level of the regional business environment. Therefore, strict environmental regulations for industrial development can form strict restrictions on the entry and operation of enterprises from multiple aspects related to the business environment, such as laws and regulations, market access policies, market demand, and competition and cooperation relationships. This also explains why the business environment plays a mediating role. On the other hand, if the business environment of a region is relatively loose, that is, its environmental regulations, market green demand, and other aspects do not form strict thresholds for enterprise development, then the positive effect of digital collaboration on the greening of the business environment will encourage it to strengthen its positive regulatory role between digital collaboration and regional green development. Based on this, the following assumptions are proposed (see Figure 1):
Hypothesis 2 (H2a):
In regions with strict green development regulations, digital collaboration can drive regional green development by improving the level of the regional business environment.
Hypothesis 2 (H2b):
In areas with relatively loose regulations for green development, the business environment has a positive regulatory effect between digital collaboration and regional green development.
3. Results
3.1. Measurement of Digital Collaborative Index
- (1)
- Urban level digitalization
Based on the previous analysis, this study suggests that urban level digitalization refers to a comprehensive governance system based on the application and development of digital technology, that is, through the construction of digital infrastructure, to achieve the deep integration of digital industrialization and industrial digitization while still considering the diversification and complexity of urban digitalization and its multidimensional impact on local green development. As such, an indicator system is necessary in measuring city-level digitization. Based on the digital economy development framework established by the China Academy of Information and Communications Technology (2020) and the contributions of Pan et al. (2021) [43], this paper constructs the urban digitalization indicator system from four dimensions: digital infrastructure, digital industrialization, industrial digitization, and digital governance.
Digital infrastructure. The construction of sound digital infrastructure is a prerequisite for the application and development of digital technology, and it is also the foundation for urban digitization. According to the contributions of Ma and Ning (2020) [44] and Pan et al. (2021) [43], digital infrastructure mainly includes the construction of information infrastructure and the construction of digital and intelligent support platforms.
Digital industrialization. Digital industrialization is the core industry of the digital economy, referring to the provision of digital technology, products, services, infrastructure, and solutions for economic and social development, as well as various economic activities that rely entirely on digital technology and data elements. The digital industrialization characterization of this study offers the added value of characterizing the information industry using digital technology. According to the “Statistical Classification of Digital Economy and Its Core Industries (2021)” released by the National Bureau of Statistics in 2021, digital industrialization in this paper mainly includes information transmission, computer services and software industries, broadcasting, television, film and the film production industry, communication, computer and other electronic equipment manufacturing industries, software, information technology service industries, etc.
Industrial digitization. Also known as digital integration, it refers to the results of the integration of digital technology and other industries, such as the increase in output and efficiency improvement brought about by the integration and penetration of ICT products and services in other fields. According to the classification of the digital economy industry by the National Bureau of Statistics, industry digitization in this indicator system mainly includes digital commerce, intelligent manufacturing, and digital inclusive finance.
Digital governance. Digital governance refers to the widespread application of digital technology in the process of social governance, which is an important guarantee for the smooth implementation of digitalization, emphasizing the governance of public affairs based on digitalization and the governance of the digital process of the economy and society, and it is mainly used to evaluate the digital governance capabilities of local governments, covering e-government, smart cities, policy measures, etc.
Based on this, a total of 4 primary indicators and 13 secondary indicators were selected to construct an urban digital development indicator system (see Table 1).
- (2)
- Digital collaboration between cities
It is important to consider that the digital development of cities may generate regional spillover effects (Song et al., 2021) [45]; this can affect resource allocation between regions and thus affect regional green development. Thus, it is necessary to measure the digital collaboration index between cities. According to the previous analysis, regional digital collaboration in this study refers to a digital governance system based on co-construction, co-governance, and sharing. Through the construction of digital infrastructure represented by the new generation of digital technology, it achieves the deep integration and development of digital industrialization and industrial digitization between regions, characterized by the synergy of four dimensions: digital governance, digital infrastructure construction, digital industrialization, and industrial digitization.
Specifically, the entropy method is used to standardize various indicators of digital development in order to ensure comparability between indicators and cluster the indicators of each subdimension using principal component analysis to calculate the comprehensive development index of the four dimensions of urban digitization. Then, based on the contribution of Jaffe’s (1986) [46] and Bloom et al. (2013) [47], this paper defines the expression for the similarity of digital development between cities as follows:
where, D represents the subdimension of urban digital development, expressed in vector form. D′ is the transposition of D. Specifically, Di,t = [D1,t,…, D13,t] represents the development index of city i in each digital development dimension in year t. According to Table 1, the digital development dimension can be divided into 13 subcategories. The more similar the digital development structure of cities i and j is, the closer the value of Wij,t (i ≠ j) is to 1, and the higher the similarity of digital development between city j and city i. Conversely, the closer the value of Wij,t (i ≠ j) is to 0, and the lower the similarity between city j and city i.
Although the above matrices can, to some extent, reflect the similarity of digital development between regions, they cannot fully reflect the impact of the linkage effect of digitalization between regions on digital collaboration. Thus, this paper constructs a new matrix based on the contribution of Shi et al. (2023) [20]: the digital synergy matrix. The calculation formula is as follows:
W1 is the matrix Wij,t in Equation (1), W2 is the co-action matrix, and when i = j, Wij = 0; when i ≠ j, wij = 1/std(μt), std(μt) is a regression model (Yi,t = α + βYj,t + μt) for the relationship between digital development of city i and city j. φ and (1 − φ) are represented as the weights of matrices W1 and W2, using the approach of Shao et al. (2016) [48]; the value of φ is set to 0.5.
Finally, to calculate the overall level of coordinated development among cities, this paper further constructs the following model based on Equation (2):
where, Digcori,t is the total index of digital collaborative development for city i, which is the level of regional digital collaboration.
- (3)
- Trend of digital collaborative development in different regions of China
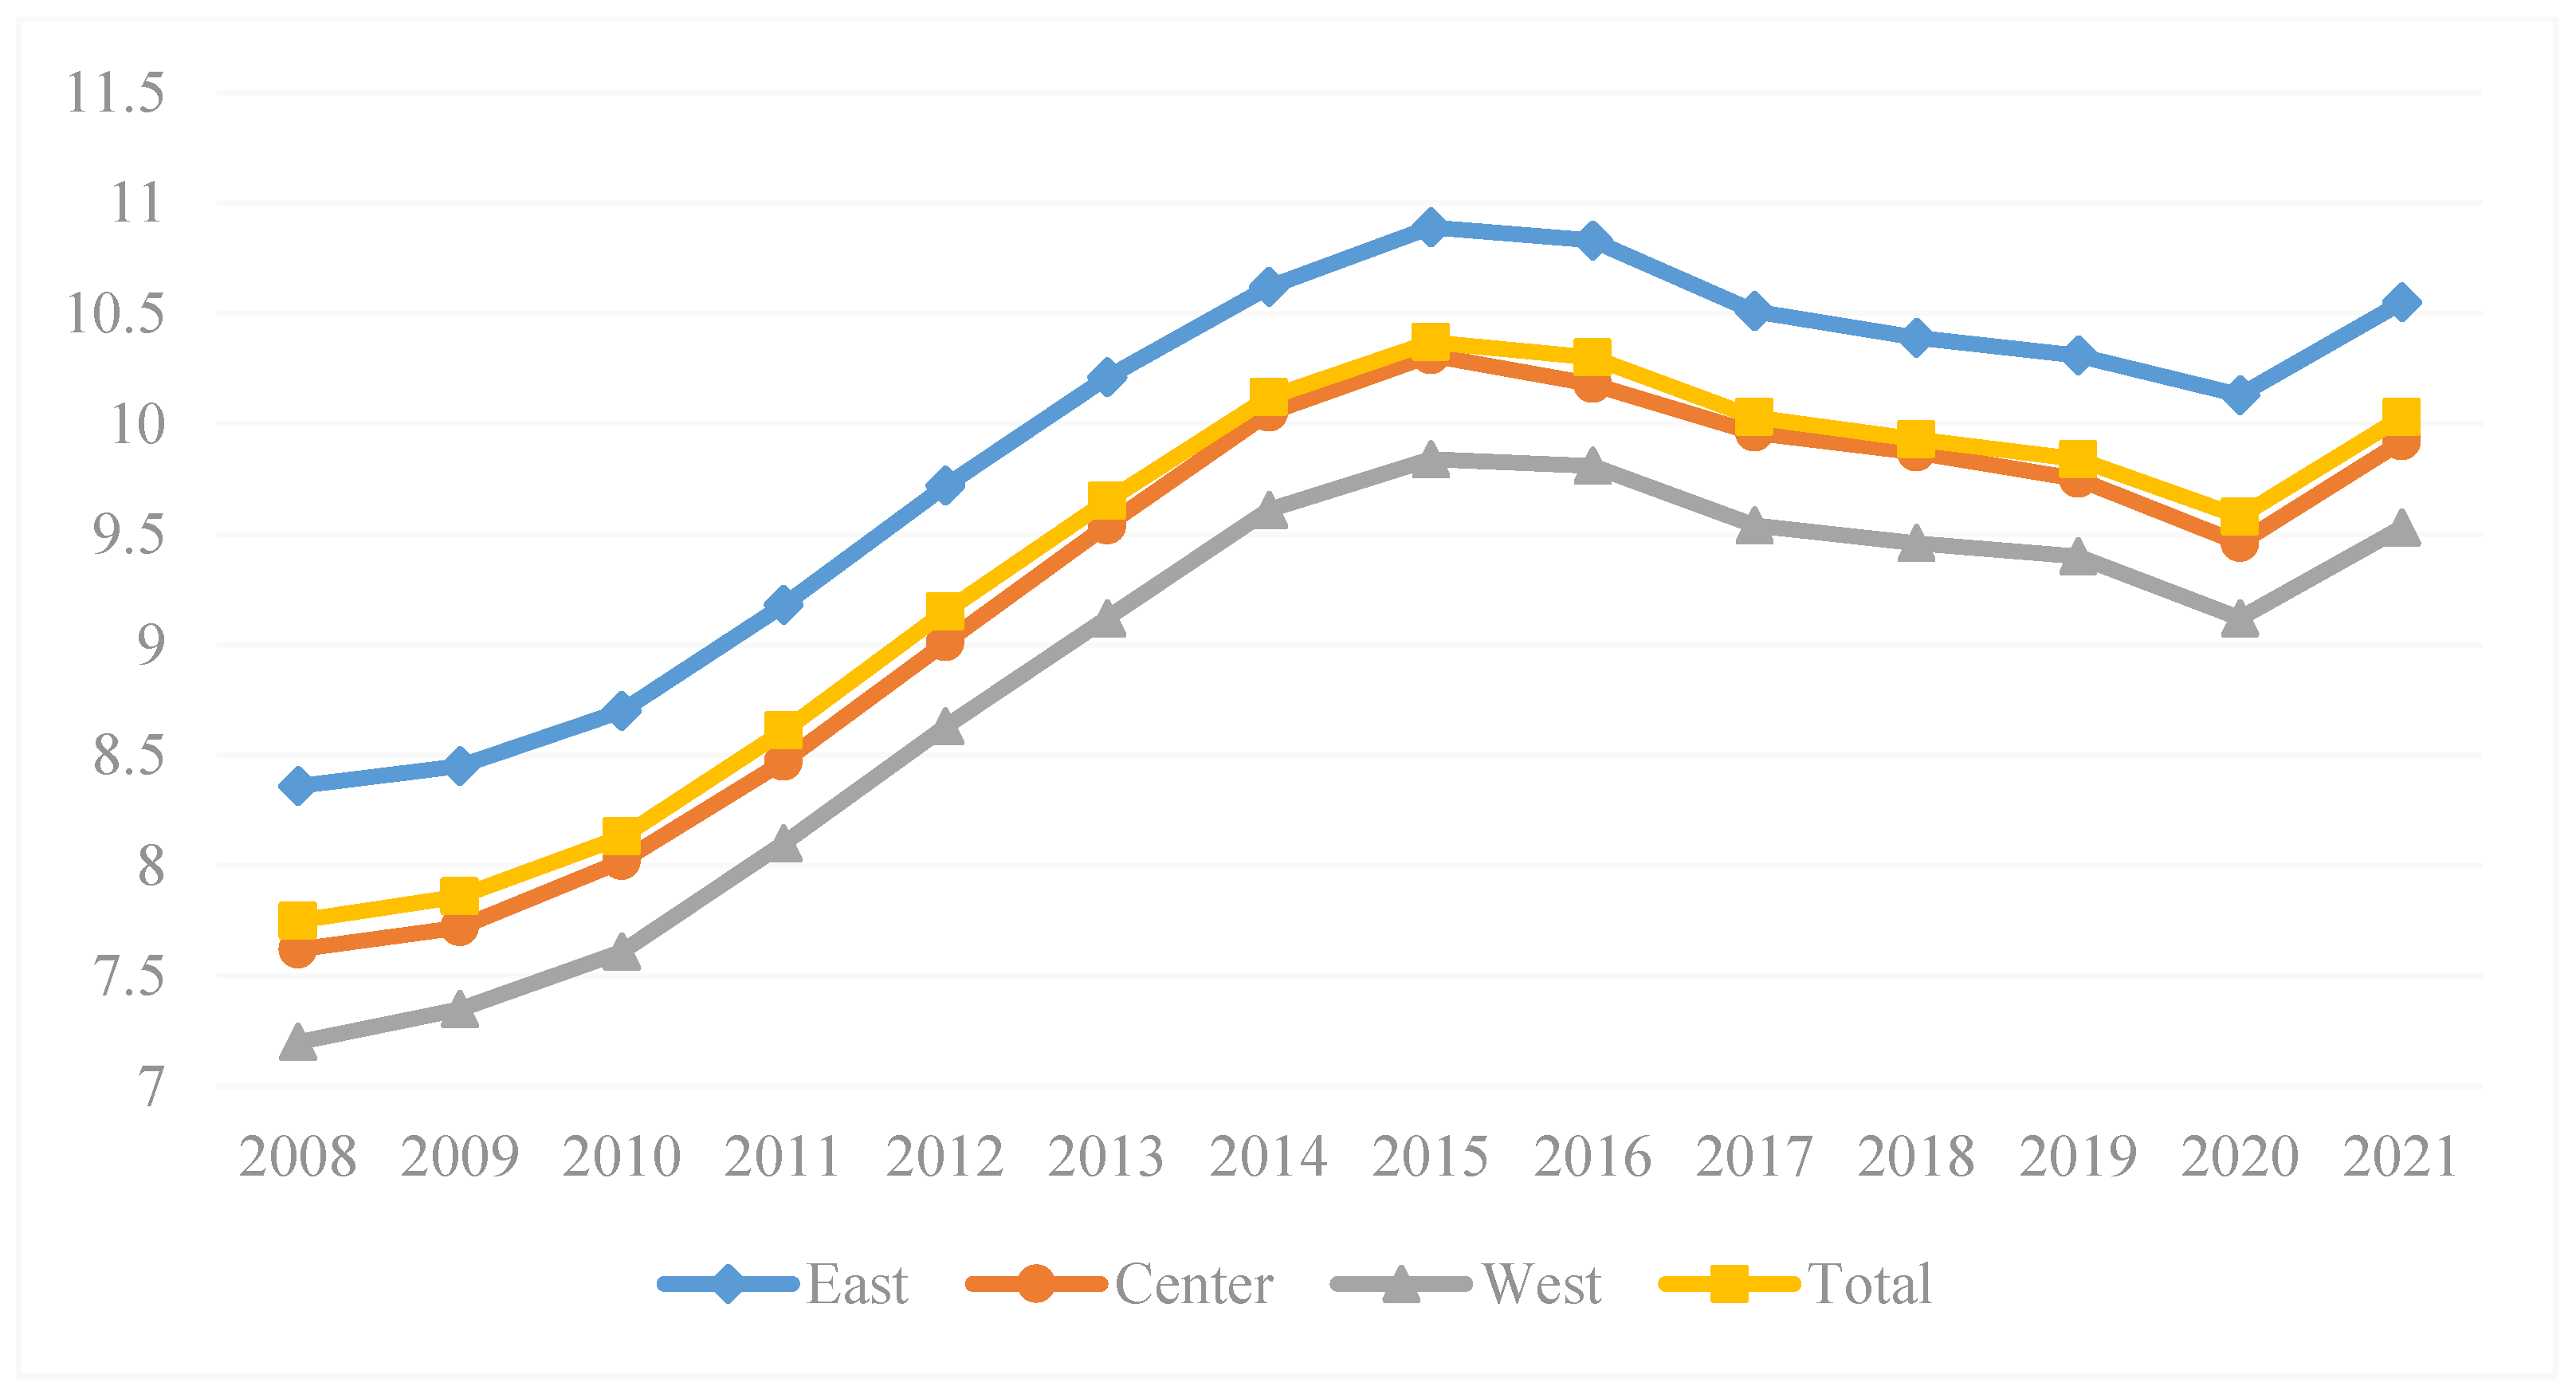
Figure 2 shows the level of digital collaboration between the eastern, central, and western regions of China and the overall situation. From the perspective of development trends, the digital synergy in the eastern, central, western, and overall regions showed a consistent evolution trend during the sample period from 2008 to 2021, with all showing an upward trend from 2008 to 2015, a downward trend from 2015 to 2020, and an upward trend from 2020 to 2021. From a regional comparison perspective, the degree of digital collaboration is ranked from high to low in the eastern, central, and western regions, with the level in the eastern region being higher than the overall national level.
3.2. Green Development Level
According to Tone (2002) [49], this paper adjusted the non-radial and non-angular SBM model, and thereby used the Super SBM model to measure the efficiency of urban green development. Specifically, assuming that there are n DMUs, each of which uses m-type input factor X, possibly producing s-type expected output yg and q-type unexpected output yb, ρ is the efficiency value, the model is constructed as follows:
where, , , , respectively, represent input factors, expected output, non-expected output, and relaxation vectors. is the weight vector, and when , it satisfies the condition of constant return to scale, and when and , it satisfies the condition of variable return to scale. Under a certain input, the higher the expected output and the smaller the unexpected output, the higher the efficiency. This is used to measure whether a city can achieve high expected output at the cost of lower input and fewer unexpected outputs, that is, what is the green development efficiency (GTFP) of the city. The specific indicators are selected as follows in Table 2:
3.3. Baseline Mode
To test the impact of urban digital collaboration on urban green development, this paper constructs the following two-way fixed effect model:
where, i represents the city, t represents the year, GTFPit represents the green development level of city i during the t period, Digcori,t−n represents the digital collaborative index of city i during the t−n period, and ui represents the non-observed fixed effect of the city, γt is a fixed time effect, εi,t is the random error term.
Considering that the efficiency value is a constrained dependent variable greater than 0 and there may be left merging at 0, a Tobit model is constructed to solve the problem of inconsistent regression estimates for the constrained dependent variable. The Tobit model refers to a type of model in which the dependent variable, although approximately continuously distributed on a positive value, contains a portion of observations with a positive probability value of 0, which, also known as the censored regression model, belongs to a type of limited dependent variable regression. A limited dependent variable refers to a dependent variable whose observations are continuous but are subject to certain limitations; the obtained observations do not fully reflect the actual state of the dependent variable. The Tobit model is constructed as follows:
3.4. Sampling and Variables
3.4.1. Sampling and Data
The sample of this study consists of a subset of China’s prefecture level cities, spanning from 2008 to 2021. Given the consistency of statistical caliber and the continuity and availability of data, China’s 285 prefecture-level cities are selected as the research samples.
Data related to this study mainly comes from the databases of listed companies—such as China Research Data Service Platform (CNRDS), CSMAR, WIND, etc.—as well as from research reports on the development of Chinese government websites over the years, Peking University Digital Inclusive Finance Index over the years, statistical yearbooks from each province, statistical bulletins from each city, and government work reports from each city over the years. Interpolation and analogy methods are used to supplement some missing values.
3.4.2. Variables
- (1)
- Dependent variables. The green development index (GTFP) is measured in Section 3.2.
- (2)
- Independent variables. The digital collaboration index (digcor) is measured in Section 3.1.
- (3)
- Related variables. The mediating and moderating variable is the business environment (busienvir), which is measured by the number of newly added enterprises in each city to measure the degree of optimization of the regional business environment. To reduce endogeneity issues caused by missing variables, it is also necessary to control factors that may affect urban green development. In accordance with the previous literature, this paper selects five indicators as the control variables, namely environmental regulation intensity, industrial structure, economic development level, technology investment, and intellectual property protection level. To be specific, environmental regulation intensity (envir) is measured by the comprehensive utilization rate of general industrial solid waste in each city; industrial structure (indcons) is measured by the proportion of the output value of the secondary industry to the output value of the primary industry; the level of economic development (perGDP) is measured by the per capita regional gross domestic product of each city, and logarithmically processed; government science and technology expenditure (gov) selects the logarithm of the total science and technology expenditure of each city as a measurement indicator to examine the level of science and technology investment in each region; and the degree of intellectual property protection (prop) is measured by the number of intellectual property judicial cases accepted in each city.
To avoid the interference of data outliers with the test results, descriptive statistics were conducted on all variables involved in this study. Detailed information can be seen in Table 3. From Table 3, it can be seen that there is a small difference between the mean and median (p50) values of green development, digital collaboration, and business environment, and their standard deviation values are 0.031, 1.325, and 1.124, respectively. This indicates that the differences between regions are relatively small in terms of green development, digital collaboration, and business environment.
Table 4 shows the Spearman Pearson correlation test results between the values of each variable. From Table 3, it can be seen that the Spearman and Pearson correlation coefficients between the main variables are significant at a 10% confidence level. Only the Pearson correlation coefficient between economic development level and industrial structure is not significant, and the Spearman correlation coefficient between government technology expenditure and digital synergy is not significant. This result indicates a preliminary validation of the correlation between the main variables.
4. Empirical Results
4.1. Baseline Results
In this paper, STATA16 is applied to conduct empirical tests. It is important to consider that the impact of digital collaboration on urban green development may not be exogenous. For example, developed cities may have both higher levels of GTFP and higher levels of digital collaboration. This means that potential missing variables that simultaneously affect digital collaboration and GTFP probably lead to this result. Although we have already controlled for the regional economic development in the baseline regression, this paper further analyzes cities with different levels of economic development, namely the eastern, central, and western regions, separately to alleviate potential endogeneity issues. This is because there are significant differences in economic development level, digitization level, business environment quality, and green development level among these regions of China [4,7,50].
Table 5 reports the empirical results of the impact of digital collaboration on regional green development. The results in column (1) show that there is a significant negative effect of digital collaboration without lag on regional green development (β = −0.01; p < 0.01). The results in column (2) further confirm the negative correlation between digital collaboration without lag and regional green development (β = −0.01; p < 0.01), however, the delayed digital collaboration has a significant positive effect on regional green development (β = 0.01; p < 0.01), indicating that digital collaboration has a lagging effect on promoting regional green development. This is possible because digital collaboration will occupy productive resources during the construction process, squeezing the green development space of regions, and regions are also in a period of adaptation, which will have a negative impact on collaborative resource allocation and information sharing. Thus, H1 is supported. This indicates that digital collaboration can enhance regional resource utilization efficiency, form a circular economy system, reduce pollutant emissions, and promote regional green development by strengthening interaction and cooperation between regions.
Columns (3) to (5), respectively, report on the relationship between digital collaboration and regional green development in the eastern, central, and western regions. Among them, the results in the eastern region are consistent with the benchmark results mentioned above. However, there is a negative relationship between digital collaboration in the central and western regions and regional green development, regardless of whether it lags behind digital collaboration. This indicates that the current digital collaboration effect between the central and western regions has not been effectively exerted, and further strengthening of regional cooperation in digital infrastructure, digital industrialization, industrial digitization, and digital governance is needed.
4.2. Endogeneity and Robustness
4.2.1. Endogeneity
This study used the propensity score matching (PSM) method to further address endogeneity issues. Firstly, the logit model is used to estimate the probability of the digital collaboration index in high-level areas. When the digital collaboration level of the target city is higher than the median dependent variable of the sample, the disposal variable digit_ high is assigned a value of 1, otherwise it is 0. Meanwhile, environmental control regulations, industrial structure, economic development level, government financial technology expenditure, and intellectual property protection act as covariates, and control the year- and city-fixed effects. Secondly, we match each highly digital collaborative city with a counterpart that has been calculated as the closest probability estimate during the first step year by year. The final sample includes 125 sample cities with a higher value of digital collaboration and 159 control group cities with a lower value.
Panel A in Table 6 shows the differences in characteristics between the two groups of cities. The results indicate that these differences are not significant, which means that the PSM method achieved a sufficient covariate balance between the treatment group and the control group. This enables us to control potential influencing factors, such as geographical location, environment, and regional economic development level. The results of the PSM samples are reported in columns (1) and (2) of Table 6 (Panel B). These results show a significant positive relationship between digital collaboration and urban GTFP, indicating that the results are still robust after ensuring that highly digital collaborative cities are appropriately matched with lowly digital collaborative cities based on their observable urban characteristics.
4.2.2. Robustness
To further ensure the robustness of the test results, this paper adopts two methods to test the relationship between digital collaboration and regional green development: the first uses alternative algorithms to measure the digital synergy index, which is calculated by multiplying geographic distance and urban digitization index, and the second uses an alternative algorithm to measure GTFP, which replaces the original GTFP with the results obtained from the SBM-DDF-GML algorithm. The robustness test results reported in Table 7 are consistent with the baseline test results in Table 5, indicating that the baseline results have good robustness.
4.3. Mediation Effect and Moderating Effect
To reveal the impact of the business environment on the relationship between digital collaboration and regional green development, this paper examines the mediating and moderating effects of the business environment between the two. The results are shown in Table 8. The test results in column (1) show that digital collaboration that is not lagged has a significant negative impact on the business environment (β = −0.1; p < 0.01), while lagged digital collaboration can significantly improve the level of the business environment (β = 0.17; p < 0.01). The results in column (2) show that the effect of digital collaboration (not lagged and lagged) on regional green development is consistent with the benchmark results in Table 5. The business environment has a significant positive impact on regional green development (β = 0.01; p < 0.01). This indicates that the business environment has a mediating effect between the lagged digital collaboration and regional green development. One possible reason for this is that the region has strict requirements for the green development of enterprises, which can transmit the positive effect of digital collaboration on regional green development from multiple aspects of business environment construction, such as environmental regulations, market green demand, and public supervision.
Columns (3) and (4) report the results of the moderating effect test of the business environment. The results show that column (4) has a smaller AIC value (lowest Akaike Information Criterion value). Accordingly, the higher the AIC value, the better the fitting degree of the model, indicating that the results of column (4) are more explanatory. The results in column (4) show that the business environment has a positive moderating effect between digital collaboration (not lagged and lagged) and regional green development (not lagged: β = 0.01; p < 0.01; lagged: β = 0.01; p < 0.01). According to the conclusions of columns (1) and (2), this may be due to the fact that enterprises have a certain degree of green development self-discipline, which can further obtain stronger driving forces for green development from the business environment field on the basis of actively driving regional green development.
5. Conclusions
5.1. Conclusions
This paper explores the relationship between digital collaboration and regional green development, as well as the moderating and mediating effects of the business environment between the two, and the following conclusions were drawn:
- (1)
- Digital collaboration has a significant negative effect on regional green development, but digital collaboration with a lag period has a significant promoting effect, that is, digital collaboration has a lag effect on the positive effect of regional green development.
- (2)
- From the perspective of regional heterogeneity, the test results in the eastern region are consistent with the baseline results, indicating that the significant promoting effect of digital collaboration on regional green development has a lag effect. There is a negative relationship between digital collaboration in the central and western regions and regional green development, regardless of whether it lags behind digital collaboration. This indicates that the current digital collaboration between the central and western regions has not been effectively utilized, and further strengthening of regional cooperation in digital infrastructure, digital industrialization, industrial digitization, and digital governance is needed.
- (3)
- The business environment has a mediating effect between the lagged digital collaboration and regional green development. Meanwhile, the business environment has a positive moderating effect between digital collaboration (without lag or with lag) and regional green development, and this result is not dependent on the level of regional economic development and the degree of business environment. This indicates that there are strict green requirements for regional development, which can form barriers for the entry and operation of enterprises from multiple levels of the business environment, such as laws and regulations, market access policies, market demand, and competition cooperation relationships. This will lead to the intermediary and regulatory role of the business environment.
5.2. Discussion
Based on theoretical analysis and empirical research conclusions, this paper obtains the following insights:
Firstly, there is a lagged effect of digital collaboration in promoting regional green development. This conclusion is basically consistent with the research findings of Wu et al. (2023) [3] and Hu and Guo (2022) [51], who found that digitalization can significantly improve green development performance. This indicates that cities need to strengthen digital collaboration between regions from the perspectives of digital infrastructure, digital industrialization, industrial digitization, and digital governance to promote regional green development.
Secondly, when strengthening the close connection between digital collaboration and regional green development, it is also necessary to strengthen the construction of a business environment to stimulate and release the radiation and driving effect of digital collaboration on regional green development to a greater extent.
Thirdly, The role of digital collaboration in regional green development varies significantly in the eastern, central, and western regions, which is consistent with the conclusion of Gao et al. (2022) [4] and Yang and Liang (2023) [8], who proposed that the degree of digitalization in the eastern region is relatively high and can effectively release the positive effects of digitalization to promote green development. The government should accelerate the promotion of digital collaborative construction in the central and western regions, continuously narrow the development gap with the eastern region, and continuously release the “multiplier effect” of digital collaboration on green development in the central and western regions.
Although this paper attempts to conduct a more comprehensive study, there are still the following research limitations: Firstly, this paper only examines the role of digital collaboration in regional green development and does not classify it according to the four dimensions of digital infrastructure, digital industrialization, industrial digitization, and digital governance of digital collaboration to thoroughly examine its effectiveness. Secondly, regional green development only examines green total factor productivity, and further exploration is needed to explore the logical role of digital collaboration in the relationship between regional economic development and environmental development. In addition, this study only examines the situation in different regions of the same country, which may be insufficient. In the future, we will consider using global data for in-depth analysis, and it is necessary to measure digital collaboration more accurately when accumulating and collecting sufficient indicators and data for genuine collaboration between regions.
Author Contributions
Conceptualization, T.Z. and H.W.; methodology, T.Z.; software, X.L.; validation, T.Z. and Z.C.; formal analysis, H.W.; data curation, T.Z.; writing—original draft preparation, H.W.; writing—review and editing, T.Z.; supervision, H.W. All authors have read and agreed to the published version of the manuscript.
Funding
This research was funded by Humanities and Social Sciences Research Project of the Hubei Provincial Department of Education (Grant numbers: 21Q145).
Institutional Review Board Statement
Not applicable.
Informed Consent Statement
Informed consent was obtained from all subjects involved in the study.
Data Availability Statement
The data presented in this study are available on request from the corresponding author.
Acknowledgments
We are grateful to acknowledge the support from Xia Zhao for her comments on earlier drafts of this paper, as well as seminar participants at Suzhou University of Science and Technology during the initial writing of this paper. We owe special thanks to Sujie Hu and Damin Sun for their assistance in the data collection and revising of our work.
Conflicts of Interest
The authors declare no conflict of interest.
References
- Dong, X.Q.; Zhong, Y.; Liu, M.K.; Xiao, W.; Qin, C. Research on the impacts of dual environmental regulation on regional carbon emissions under the goal of carbon neutrality-the intermediary role of green technology innovation. Front. Environ. Sci. 2022, 210, 993833. [Google Scholar] [CrossRef]
- Huang, C.H.; Zhang, X.Q.; Liu, K. Effects of human capital structural evolution on carbon emissions intensity in China: A dual perspective of spatial heterogeneity and nonlinear linkages. Renew. Sustain. Energy Rev. 2021, 135, 110258. [Google Scholar] [CrossRef]
- Wu, H.Q.; Hu, S.M.; Hu, S.J. How digitalization works in promoting corporate sustainable development performance? The mediating role of green technology innovation. Environ. Sci. Pollut. Res. 2023, 30, 22013–22023. [Google Scholar] [CrossRef]
- Gao, D.; Li, G.; Yu, J.Y. Does digitization improve green total factor energy efficiency? Evidence from Chinese 213 cities. Energy 2022, 247, 123395. [Google Scholar] [CrossRef]
- Hu, S.M.; Wu, H.Q. The mechanism of media pressure on corporate green technology innovation: The moderating effect of corporate internal governance. Technol. Anal. Strateg. Manag. 2023, 1–17. [Google Scholar] [CrossRef]
- Hosan, S.; Karmaker, S.C.; Rahman, M.M.; Chapman, A.J.; Saha, B.B. Dynamic links among the demographic dividend, digitalization, energy intensity and sustainable economic growth: Empirical evidence from emerging economies. J. Clean. Prod. 2022, 330, 129858. [Google Scholar] [CrossRef]
- Cai, S. Impact of digitization on green economic recovery: An empirical evidence from China. Econ. Chang. Restruct. 2023, 1–13. [Google Scholar] [CrossRef]
- Yang, Y.W.; Liang, Q.Y. Digital economy, environmental regulation and green eco-efficiency-Empirical evidence from 285 cities in China. Front. Environ. Sci. 2023, 11, 1113293. [Google Scholar] [CrossRef]
- Yoo, Y.; Boland, R.J., Jr.; Lyytinen, K. Organizing for innovation in the digitized world. Organ. Sci. 2012, 23, 1398–1408. [Google Scholar] [CrossRef]
- Nambisan, S. Digital entrepreneurship: Toward a digital technology perspective of entrepreneurship. Entrep. Theory Pract. 2017, 41, 1029–1055. [Google Scholar] [CrossRef]
- Hajli, M.; Sims, J.M.; Ibragimov, V. Information technology (IT) productivity paradox in the 21st century. Int. J. Product. Perform. Manag. 2015, 64, 457–478. [Google Scholar] [CrossRef]
- Aulkemeier, F.; Iacob, M.E.; van Hillegersberg, J. Platform-based collaboration in digital ecosystems. Electron. Mark. 2019, 29, 597–608. [Google Scholar] [CrossRef]
- Li, L.X.; Zhu, W.W.; Wei, L.; Yang, S.L. How can digital collaboration capability boost service innovation? Evidence from the information technology industry. Technol. Forecast. Soc. Chang. 2022, 182, 121830. [Google Scholar] [CrossRef]
- Zoppelletto, A.; Orlandi, L.B. Cultural and digital collaboration infrastructures as sustainability enhancing factors: A configurational approach. Technol. Forecast. Soc. Chang. 2022, 179, 121645. [Google Scholar] [CrossRef]
- Haschka, R.; Herwartz, H.; Struthmann, P.; Tran, V.T. The joint effects of financial development and the business environment on firm growth: Evidence from Vietnam. J. Comp. Econ. 2022, 50, 486–506. [Google Scholar] [CrossRef]
- Brychko, M.; Bilan, Y.; Lyeonov, S.; Streimikiene, D. Do changes in the business environment and sustainable development really matter for enhancing enterprise development? Sustain. Dev. 2023, 31, 587–599. [Google Scholar] [CrossRef]
- Lee, K.H.; Min, B. Green R&D for eco-innovation and its impact on carbon emissions and firm performance. J. Clean. Prod. 2015, 108, 534–542. [Google Scholar]
- Wu, H.Q.; Hu, S.M. The impact of synergy effect between government subsidies and slack resources on green technology innovation. J. Clean. Prod. 2020, 274, 122682. [Google Scholar] [CrossRef]
- Jiang, Z.; Gao, X. Text mining and quantitative evaluation of China’s green consumption policies based on green consumption objects. Environ. Dev. Sustain. 2023, 1–22. [Google Scholar] [CrossRef]
- Shi, F.; Zhou, M.; Xu, B. Dynamic spatial measurement of collaborative innovation production in China’s industrial greening. Sci. Res. Manag. 2023, 44, 60–72. (In Chinese) [Google Scholar]
- Viturka, M.; Wokoun, R.; Krejcova, N.; Tonev, P.; Zitek, V. The regional relationship between quality of business and social environment: Harmony or disharmony? EM Ekon. Manag. 2013, 16, 22–40. [Google Scholar]
- Jiang, L.; Wang, Y.Q.; Zhang, J. Local-neighborhood effects of environmental regulations on green technology innovation in manufacturing: Green credit-based regulation. Front. Environ. Sci. 2022, 10, 1072180. [Google Scholar] [CrossRef]
- Wei, Y.H.D.; Liefner, I. Globalization, industrial restructuring, and regional development in China. Appl. Geogr. 2012, 32, 102–105. [Google Scholar] [CrossRef]
- Chen, Y.P.; Nie, H.T.; Chen, J.J.; Peng, L.H. Regional industrial synergy: Potential and path crossing the “environmental mountain”. Sci. Total Environ. 2021, 765, 142714. [Google Scholar] [CrossRef] [PubMed]
- Zheng, Z.; Liu, W.D.; Song, T. Strategic coupling in global production networks through international cooperation zones: The Thai-Chinese Rayong Industrial Zone. Reg. Stud. 2022, 56, 782–793. [Google Scholar] [CrossRef]
- Wang, P.; Cen, C.; Lin, X.Y. Internet development and the spatial optimization of regional productivity: Evidence from China. Growth Chang. 2023. [Google Scholar] [CrossRef]
- Jing, S.; Amy, L.R. Innovation Ability of Strategic Emerging Industrial Cluster Based on 2-Mode Network and Three-Dimensional Grey Correlation Model. J. Grey Syst. 2022, 34, 108–121. [Google Scholar]
- Nambisan, S.; Wright, M.; Feldman, M. The digital transformation of innovation and entrepreneurship: Progress, challenges and key themes. Res. Policy 2019, 48, 103773. [Google Scholar] [CrossRef]
- Mishra, R.; Singh, R.K.; Papadopoulos, T. Linking digital orientation and data-driven innovations: A SAP-LAP linkage framework and research propositions. IEEE Trans. Eng. Manag. 2022, 1–13. [Google Scholar] [CrossRef]
- Jia, L.J.; Hu, X.L.; Zhao, Z.W.; Zhou, T.; He, B. The Impact of Digitization on Green Innovation Performance: Evidence Based on Panel Data of 228 Prefectural-Level Cities in China. Complexity 2022, 2022, 9442902. [Google Scholar] [CrossRef]
- Jung, S.H.; Feng, T.J. Government subsidies for green technology development under uncertainty. Eur. J. Oper. Res. 2020, 286, 726–739. [Google Scholar] [CrossRef]
- Karmaker, S.C.; Hosan, S.; Chapman, A.J.; Saha, B.B. The role of environmental taxes on technological innovation. Energy 2021, 232, 121052. [Google Scholar] [CrossRef]
- Ye, P.; Cai, W.; Zhou, Y. Can green industrial policy promote the total factor productivity of manufacturing enterprises? Environ. Sci. Pollut. Res. 2022, 29, 88041–88054. [Google Scholar] [CrossRef] [PubMed]
- Lin, R.J.; Tan, K.H.; Geng, Y. Market demand, green product innovation, and firm performance: Evidence from Vietnam motorcycle industry. J. Clean. Prod. 2013, 40, 101–107. [Google Scholar] [CrossRef]
- Shao, X.; Liu, S.; Ran, R.; Liu, Y. Environmental regulation, market demand, and green innovation: Spatial perspective evidence from China. Environ. Sci. Pollut. Res. 2022, 29, 63859–63885. [Google Scholar] [CrossRef] [PubMed]
- Sanders, N.R.; Boone, T.; Ganeshan, R.; Wood, J.D. Sustainable Supply Chains in the Age of AI and Digitization: Research Challenges and Opportunities. J. Bus. Logist. 2019, 40, 229–240. [Google Scholar] [CrossRef]
- Menz, M.; Kunisch, S.; Birkinshaw, J.; Collis, D.J.; Foss, N.J.; Hoskisson, R.E.; Prescott, J.E. Corporate Strategy and the Theory of the Firm in the Digital Age. J. Manag. Stud. 2021, 58, 1695–1720. [Google Scholar] [CrossRef]
- Li, G.Q.; Jin, Y.P.; Gao, X. Digital transformation and pollution emission of enterprises: Evidence from China’s micro-enterprises. Energy Rep. 2023, 9, 552–567. [Google Scholar] [CrossRef]
- Al Mamun, A.; Mohamad, M.R.; Bin Yaacob, M.R.; Mohiuddin, M. Intention and behavior towards green consumption among low-income households. J. Environ. Manag. 2018, 227, 73–86. [Google Scholar] [CrossRef] [PubMed]
- Tezer, A.; Bodur, H.O. The Green consumption Effect: How Using Green Products Improves Consumption Experience. J. Consum. Res. 2020, 47, 25–39. [Google Scholar] [CrossRef]
- Xu, C.H.; Chen, X.T.; Dai, W. Effects of Digital Transformation on Environmental Governance of Mining Enterprises: Evidence from China. Int. J. Environ. Res. Public Health 2022, 19, 16474. [Google Scholar] [CrossRef]
- Wang, J.; Li, L.L.; Li, F.Y.; Kharrazi, A.; Bai, Y. Regional footprints and interregional interactions of chemical oxygen demand discharges in China. Resour. Conserv. Recycl. 2018, 132, 386–397. [Google Scholar] [CrossRef]
- Pan, W.; He, Z.; Pan, H. The spatiotemporal evolution and distribution dynamics of China’s digital economy development. China Soft Sci. 2021, 10, 137–147. (In Chinese) [Google Scholar]
- Ma, Z.D.; Ning, C.S. Digital Economy, Factor Allocation, and Manufacturing Quality Upgrade. Econ. Syst. Reform. 2020, 3, 24–30. (In Chinese) [Google Scholar]
- Song, M.; Zhou, P.; Si, H. Financial technology and enterprise total factor productivity-perspective of “enabling” and credit rationing. China Ind. Econ. 2021, 4, 138–155. (In Chinese) [Google Scholar]
- Jaffe, A.B. Technological opportunity and spillovers of R&D: Evidence from firms’ patents, profits, and market value. Am. Econ. Rev. 1986, 76, 984–1001. [Google Scholar]
- Bloom, N.; Schankerman, M.; Van Reenen, J. Identifying technology spillovers and product market rivalry. Econometrica 2013, 81, 1347–1393. [Google Scholar]
- Shao, S.; Li, X.; Cap, J.; Yang, L. Economic policy choice for haze pollution control in China: From the perspective of spatial spillover effect. Econ. Res. J. 2016, 51, 73–88. (In Chinese) [Google Scholar]
- Tone, K.A. Slacks-based measure of Super-Efficiency in data envelopment analysis. Eur. J. Oper. Res. 2002, 143, 32–41. [Google Scholar] [CrossRef]
- Yi, Y.; Cheng, R.W.; Wang, H.Y.; Yi, M.; Huang, Y.J. Industrial digitization and synergy between pollution and carbon emissions control: New empirical evidence from China. Environ. Sci. Pollut. Res. 2023, 29, 36127–36142. [Google Scholar] [CrossRef] [PubMed]
- Hu, X.Y.; Guo, P.F. A spatial effect study on digital economy affecting the green total factor productivity in the Yangtze River Economic Belt. Environ. Sci. Pollut. Res. 2022, 29, 90868–90886. [Google Scholar] [CrossRef] [PubMed]
Figure 1.
Relationship among Digital Collaboration, Business Environment, and Regional Green Development.
Figure 1.
Relationship among Digital Collaboration, Business Environment, and Regional Green Development.

Figure 2.
Growing trends of city-level digital collaboration in China from 2008 to 2021.

Table 1.
Urban digitalization development indicator system.
| Variables | Content | Source | |
|---|---|---|---|
| Digital infrastructure | Information infrastructure | Total number of internet access users per 100 people | China Urban Statistical Yearbook |
| Total number of mobile phone users per 100 people | China Urban Statistical Yearbook | ||
| Platform Foundation | Accumulated number of IoT innovation demonstration zones | Local Bureau of Statistics website | |
| Accumulated number of industrial Internet platforms | Local Bureau of Statistics website | ||
| Digital industrialization | Output value of the digital industry | The total industrial output value of the manufacturing industry, including communication equipment, computers, and other electronic equipment | China Urban Statistical Yearbook |
| Digital industry employees | The proportion of employment in information transmission, computer services, and software industries to total employment | China Urban Statistical Yearbook | |
| Telecommunications business volume | The logarithm value of the total telecommunications business per capita | China Urban Statistical Yearbook | |
| Software business revenue | The logarithmic value of software business revenue | China Urban Statistical Yearbook | |
| Development of the Radio and Television Industry | Accumulated number of listed companies in the broadcasting, television, film, and film recording production industries | CSMAR | |
| Industrial digitization | Enterprise informatization level | Accumulated number of listed companies involved in intelligent business | CSMAR |
| Proportion of websites established by enterprises | CSMAR | ||
| Electric Business Development | Accumulated number of listed companies involved in e-commerce business | CSMAR | |
| E-commerce transaction volume | Wind; Local Bureau of Statistics website | ||
| Internet finance industry | Digital Inclusive Finance Index | Peking University Digital Inclusive Finance Index Report | |
| Digital governance | E-government service capabilities | China Government Website Development Index | Research Report on the Development of Chinese Government Websites |
| Number of government websites | Local government websites | ||
| Smart City Construction | Number of smart city or digital rural projects carried out | Local Bureau of Statistics website | |
| Is it a national level smart city or a national level digital rural pilot area | Local Bureau of Statistics website | ||
| Is there a unified City Brain built | Local Bureau of Statistics website | ||
| Development of digitalization-related policies | Number of keywords related to artificial intelligence, big data, blockchain, etc. in government work reports | Local government websites |
Note: missing values are supplemented by interpolation and analogy methods.
Table 2.
Index system for measuring the city level GTFP in China.
| Variables | Content | |
|---|---|---|
| Input | Material capital | Capital stock |
| Labor Force | Annual employment | |
| Resources Consumption | Water supply | |
| Power consumption | ||
| Desired output | Economic development | regional GDP |
| Welfare and fairness | Average annual income of urban residents | |
| Environmental optimization | Coverage area of parks and green spaces | |
| Undesired output | Pollution discharge | Industrial wastewater discharge |
| Industrial sulfur dioxide emissions | ||
| Industrial smoke and dust emissions |
Source: China Urban Statistical Yearbook, 2008–2021.
Table 3.
Descriptive Statistics of Variables.
| Obs | Mean | Std. | p25 | p50 | p75 | VIF | |
|---|---|---|---|---|---|---|---|
| GTFP | 3976 | 0.995 | 0.031 | 0.983 | 0.993 | 1.004 | —— |
| digcor | 3976 | 9.379 | 1.325 | 8.459 | 9.435 | 10.275 | 2.08 |
| busienvir | 3976 | 10.182 | 1.124 | 9.618 | 10.180 | 10.816 | 3.10 |
| envir | 3976 | 0.747 | 0.288 | 0.564 | 0.727 | 0.887 | 1.27 |
| indcons | 3976 | 1.887 | 3.712 | 0.447 | 0.856 | 1.762 | 1.02 |
| perGDP | 3976 | 10.599 | 0.652 | 10.177 | 10.599 | 11.043 | 2.23 |
| gov | 3976 | 0.003 | 0.003 | 0.001 | 0.002 | 0.003 | 1.23 |
| prop | 3976 | 3.253 | 2.345 | 1.386 | 3.135 | 4.898 | 2.23 |
Note: STATA17 is applied to process empirical data.
Table 4.
Correlation coefficients.
| GTFP | digcor | busienvir | Envir | indcons | perGDP | gov | prop | |
|---|---|---|---|---|---|---|---|---|
| GTFP | 1.000 | 0.039 ** | 0.014 * | 0.041 ** | 0.060 *** | 0.112 *** | 0.001 | 0.105 *** |
| digcor | 0.083 *** | 1.000 | 0.783 *** | 0.354 *** | 0.102 *** | 0.678 *** | 0.383 *** | 0.689 *** |
| busienvir | 0.143 *** | 0.786 *** | 1.000 | 0.330 *** | 0.105 *** | 0.501 *** | 0.355 *** | 0.679 *** |
| envir | 0.066 *** | 0.294 *** | 0.299 *** | 1.000 | 0.164 *** | 0.335 *** | 0.187 *** | 0.374 *** |
| indcons | 0.031 * | 0.028 * | 0.029 * | 0.144 *** | 1.000 | 0.072 *** | 0.077 *** | 0.117 *** |
| perGDP | 0.145 *** | 0.705 *** | 0.505 *** | 0.298 *** | 0.021 | 1.000 | 0.384 *** | 0.541 *** |
| gov | 0.106 *** | 0.329 *** | 0.289 *** | 0.168 *** | 0.080 *** | 0.317 *** | 1.000 | 0.408 *** |
| prop | 0.167 *** | 0.657 *** | 0.669 *** | 0.304* ** | 0.048 *** | 0.505 *** | 0.358 *** | 1.000 |
Note: *, **, ***, respectively, represent significance levels of 10%, 5%, and 1%. The upper triangle represents the Spearman correlation coefficient, while the lower triangle represents the Pearson correlation coefficient.
Table 5.
Results of baseline regression.
| (1) | (2) | (3) | (4) | (5) | |
|---|---|---|---|---|---|
| No Lag | Total | East | Center | West | |
| lngit | −0.01 *** | −0.01 *** | −0.02 *** | −0.01 ** | −0.00 |
| (−5.33) | (−5.48) | (−5.78) | (−2.48) | (−0.94) | |
| L.lngit | 0.01 *** | 0.02 *** | −0.00 | −0.00 | |
| (3.22) | (5.33) | (−1.41) | (−0.29) | ||
| Controls | yes | yes | yes | yes | yes |
| City | yes | yes | yes | yes | yes |
| Year | yes | yes | yes | yes | yes |
| _cons | 0.99 *** | 0.96 *** | 1.03 *** | 0.80 *** | 0.98 *** |
| (41.90) | (35.12) | (14.10) | (17.70) | (37.94) | |
| R2 | 0.023 | 0.030 | 0.064 | 0.061 | 0.008 |
| AIC | −14,590.86 | −13,207.52 | −4006.44 | −5099.46 | −4690.22 |
| BIC | −14,547.94 | −13,159.17 | −3966.49 | −5059.43 | −4651.59 |
| N | 3396 | 3113 | 1089 | 1100 | 924 |
t statistics in parentheses; ** p < 0.05, *** p < 0.01.
Table 6.
PSM estimation.
| Panel A The Differences in Characteristics between the Treat and Control Cities | ||||||
|---|---|---|---|---|---|---|
| Untreated | Treated | t-Test | ||||
| Mean | N | Mean | N | Difference | T | |
| envir | 0.686 | 2226 | 0.691 | 1750 | −0.005 | 0.525 |
| indcons | 1.634 | 2226 | 1.578 | 1750 | 0.056 | 0.589 |
| perGDP | 10.237 | 2226 | 10.815 | 1750 | −0.579 | 0.094 |
| gov | 0.002 | 2226 | 0.003 | 1750 | −0.001 | 0.062 |
| property | 2.167 | 2226 | 3.959 | 1750 | −1.792 | 0.182 |
| Panel B Regression results of PSM | ||||||
| Full-sample | PSM | |||||
| (1) | (2) | |||||
| digit_high | 0.00222 | 0.00018 | ||||
| (0.11) | (1.49) | |||||
| L.digit_high | 0.00422 ** | 0.00366 *** | ||||
| (2.03) | (3.49) | |||||
| Controls | yes | yes | ||||
| City | yes | yes | ||||
| Year | yes | yes | ||||
| _cons | 0.993 *** | 0.926 *** | ||||
| (22.91) | (43.64) | |||||
| R2 | 0.014 | 0.022 | ||||
| N | 3976 | 1750 | ||||
t statistics in parentheses; ** p < 0.05, *** p < 0.01.
Table 7.
Robustness test.
| (1) | (2) | |
|---|---|---|
| Digital Collaboration Replaced | GTFP Replaced | |
| lngit | 0.00 * | −0.01 * |
| (1.67) | (−1.69) | |
| L.lngit | 0.00 ** | 0.01 ** |
| (2.41) | (2.46) | |
| Controls | yes | yes |
| _cons | 0.88 *** | 0.83 *** |
| (16.95) | (13.95) | |
| R2 | 0.039 | 0.019 |
| AIC | −8849.34 | −8321.41 |
| BIC | −8803.82 | −8273.06 |
| N | 3976 | 3976 |
t statistics in parentheses; * p < 0.1, ** p < 0.05, *** p < 0.01.
Table 8.
Results of mediating and moderating effect.
| (1) | (2) | (3) | (4) | |
|---|---|---|---|---|
| Mediating Effect | Moderating Effect | |||
| busienvir | GTFP | GTFP | GTFP | |
| lngit | −0.10 *** | −0.01 *** | −0.02 *** | −0.08 *** |
| (−7.65) | (−4.77) | (−3.84) | (−3.96) | |
| L.lngit | 0.17 *** | 0.00 ** | 0.10 *** | |
| (13.02) | (1.96) | (5.61) | ||
| c.busienvir#c.lngit | 0.00 *** | 0.01 *** | ||
| (2.80) | (4.36) | |||
| c.busienvir#cL.lngit | 0.01 *** | |||
| (5.86) | ||||
| busienvir | 0.01 *** | 0.00 * | 0.01 * | |
| (3.56) | (1.83) | (1.98) | ||
| Controls | yes | yes | yes | yes |
| City | yes | yes | yes | yes |
| Year | yes | yes | yes | yes |
| _cons | 5.27 *** | 0.90 *** | 1.07 *** | 1.06 *** |
| (25.86) | (28.82) | (19.22) | (15.56) | |
| R2 | 0.648 | 0.034 | 0.032 | 0.050 |
| AIC | 589.16 | −13,219.44 | −14,619.50 | −15,266.90 |
| BIC | 638.81 | −13,165.05 | −14,564.32 | −15,200.42 |
| N | 3662 | 3113 | 3396 | 3113 |
t statistics in parentheses; * p < 0.1, ** p < 0.05, *** p < 0.01.
Disclaimer/Publisher’s Note: The statements, opinions and data contained in all publications are solely those of the individual author(s) and contributor(s) and not of MDPI and/or the editor(s). MDPI and/or the editor(s) disclaim responsibility for any injury to people or property resulting from any ideas, methods, instructions or products referred to in the content. |
© 2023 by the authors. Licensee MDPI, Basel, Switzerland. This article is an open access article distributed under the terms and conditions of the Creative Commons Attribution (CC BY) license (https://creativecommons.org/licenses/by/4.0/).
Share and Cite
MDPI and ACS Style
Zhu, T.; Li, X.; Wu, H.; Chu, Z. Does the Collaboration of Digitalization Foster Regional Green Development? Sustainability 2023, 15, 14799. https://doi.org/10.3390/su152014799
AMA Style
Zhu T, Li X, Wu H, Chu Z. Does the Collaboration of Digitalization Foster Regional Green Development? Sustainability. 2023; 15(20):14799. https://doi.org/10.3390/su152014799
Chicago/Turabian StyleZhu, Tianyi, Xue Li, Haoqiang Wu, and Ziyu Chu. 2023. "Does the Collaboration of Digitalization Foster Regional Green Development?" Sustainability 15, no. 20: 14799. https://doi.org/10.3390/su152014799
Note that from the first issue of 2016, this journal uses article numbers instead of page numbers. See further details here.