
Evaluation of Embodied Carbon Emissions in UK Supermarket Constructions: A Study on Steel, Brick, and Timber Frameworks with Consideration of End-of-Life Processes


 , ,
, ,  and
and
Abstract
:1. Introduction
- “Which structural system has the greatest potential to reduce carbon emissions during the end-of-life?”
2. Materials and Methods
2.1. Construction Materials—A Review of the Literature
2.2. Description of Case Study and Justification
2.3. Life-Cycle Assessment
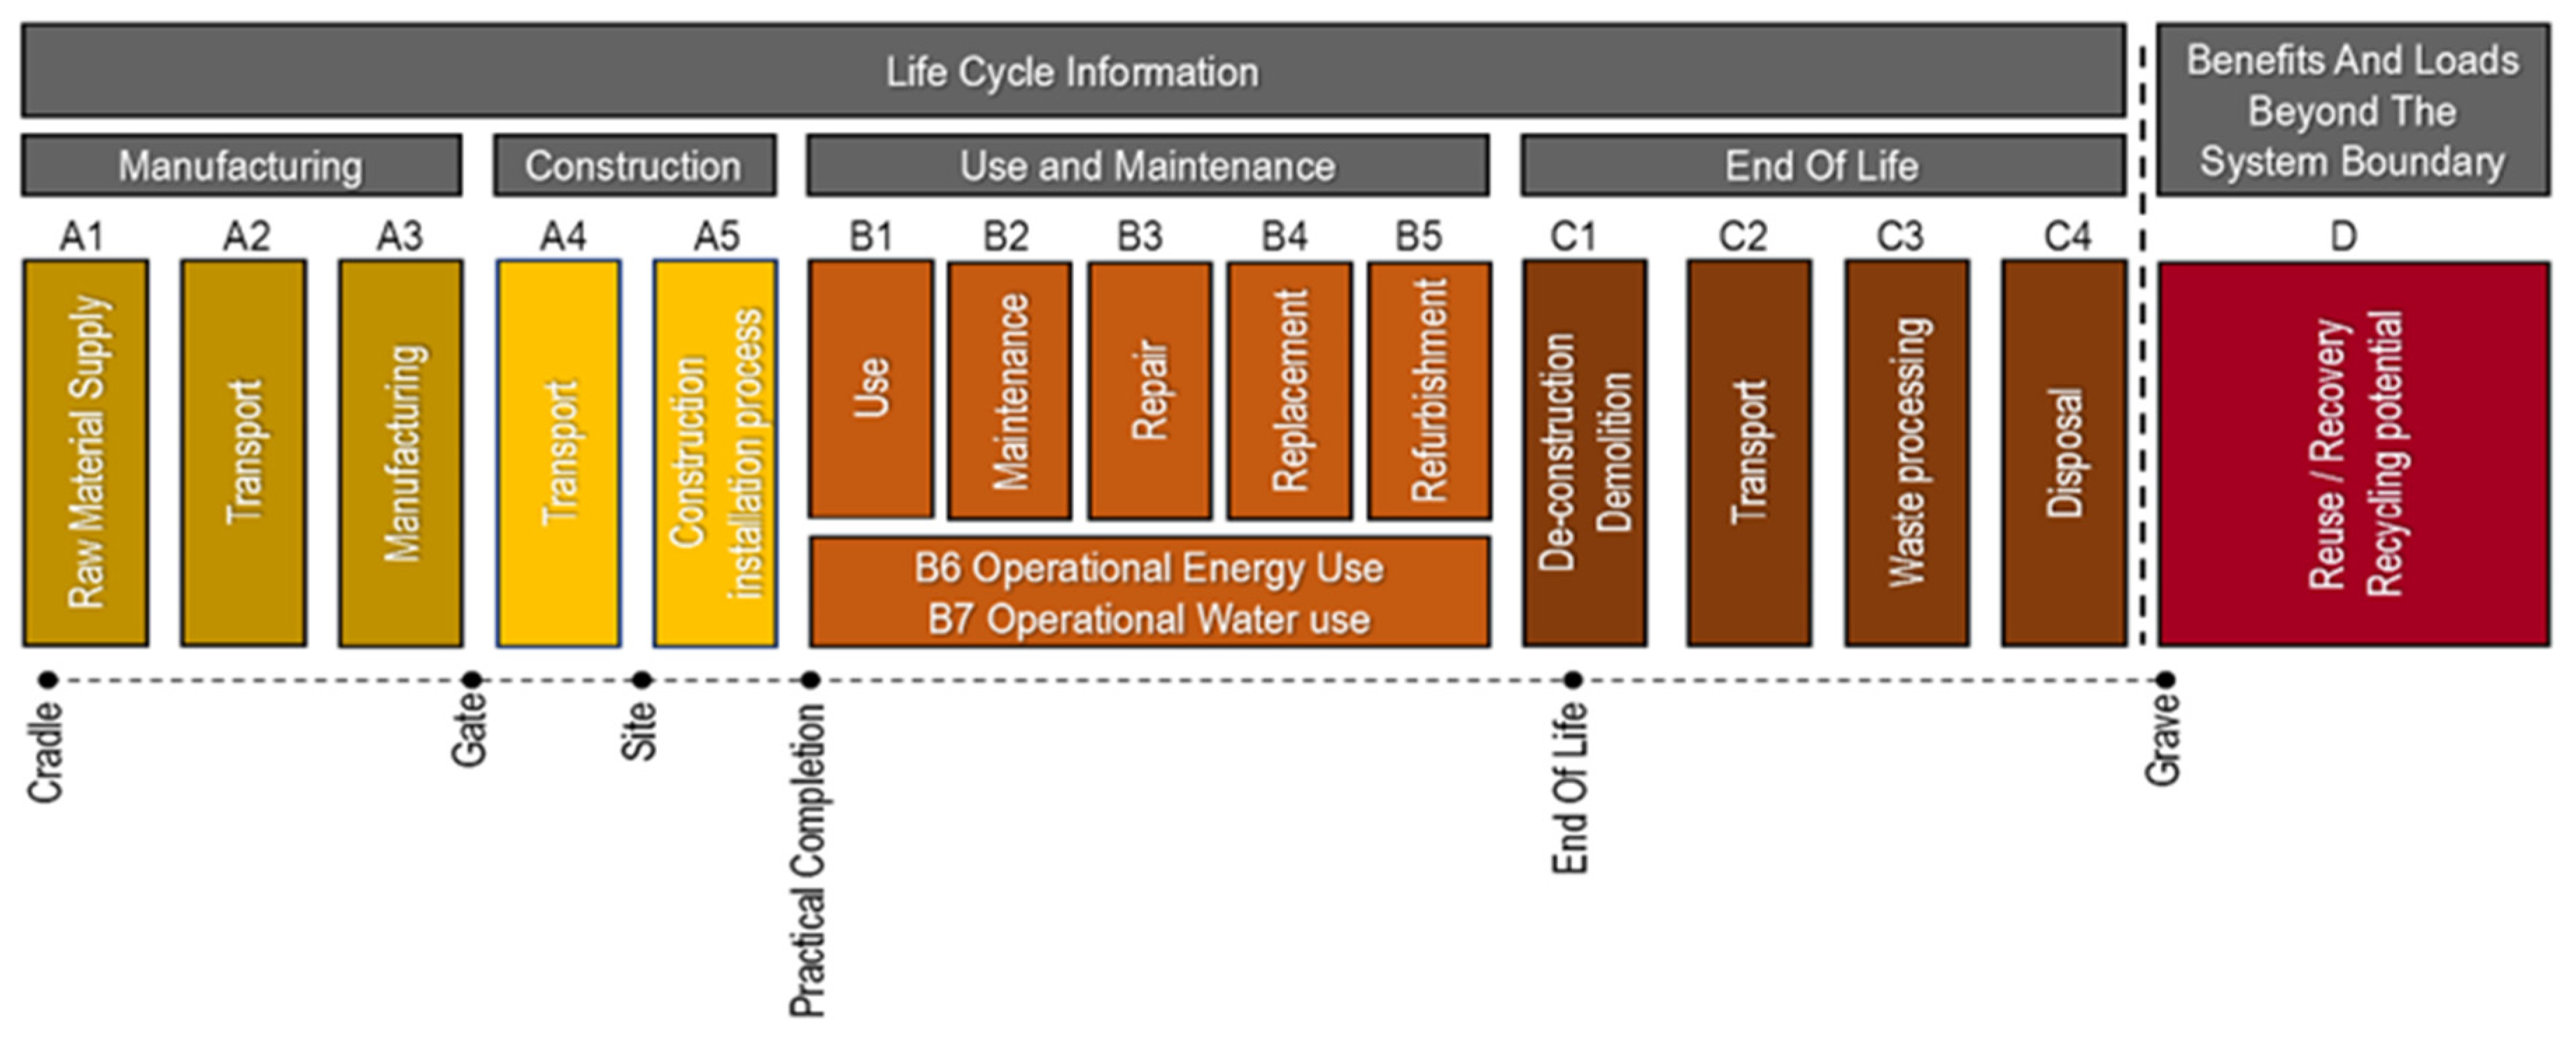
2.3.1. Goal and Scope Definition and System Boundary
2.3.2. Analysis of Life-Cycle Inventory
2.3.3. Building Material Life-Cycle Impact Assessment
2.4. Quantification of the Life-Cycle Embodied Carbon
2.4.1. Cradle-to-Practical Completion Estimation
2.4.2. End-of-Life Estimation
2.5. Assumptions
3. Results
3.1. Material Quantities
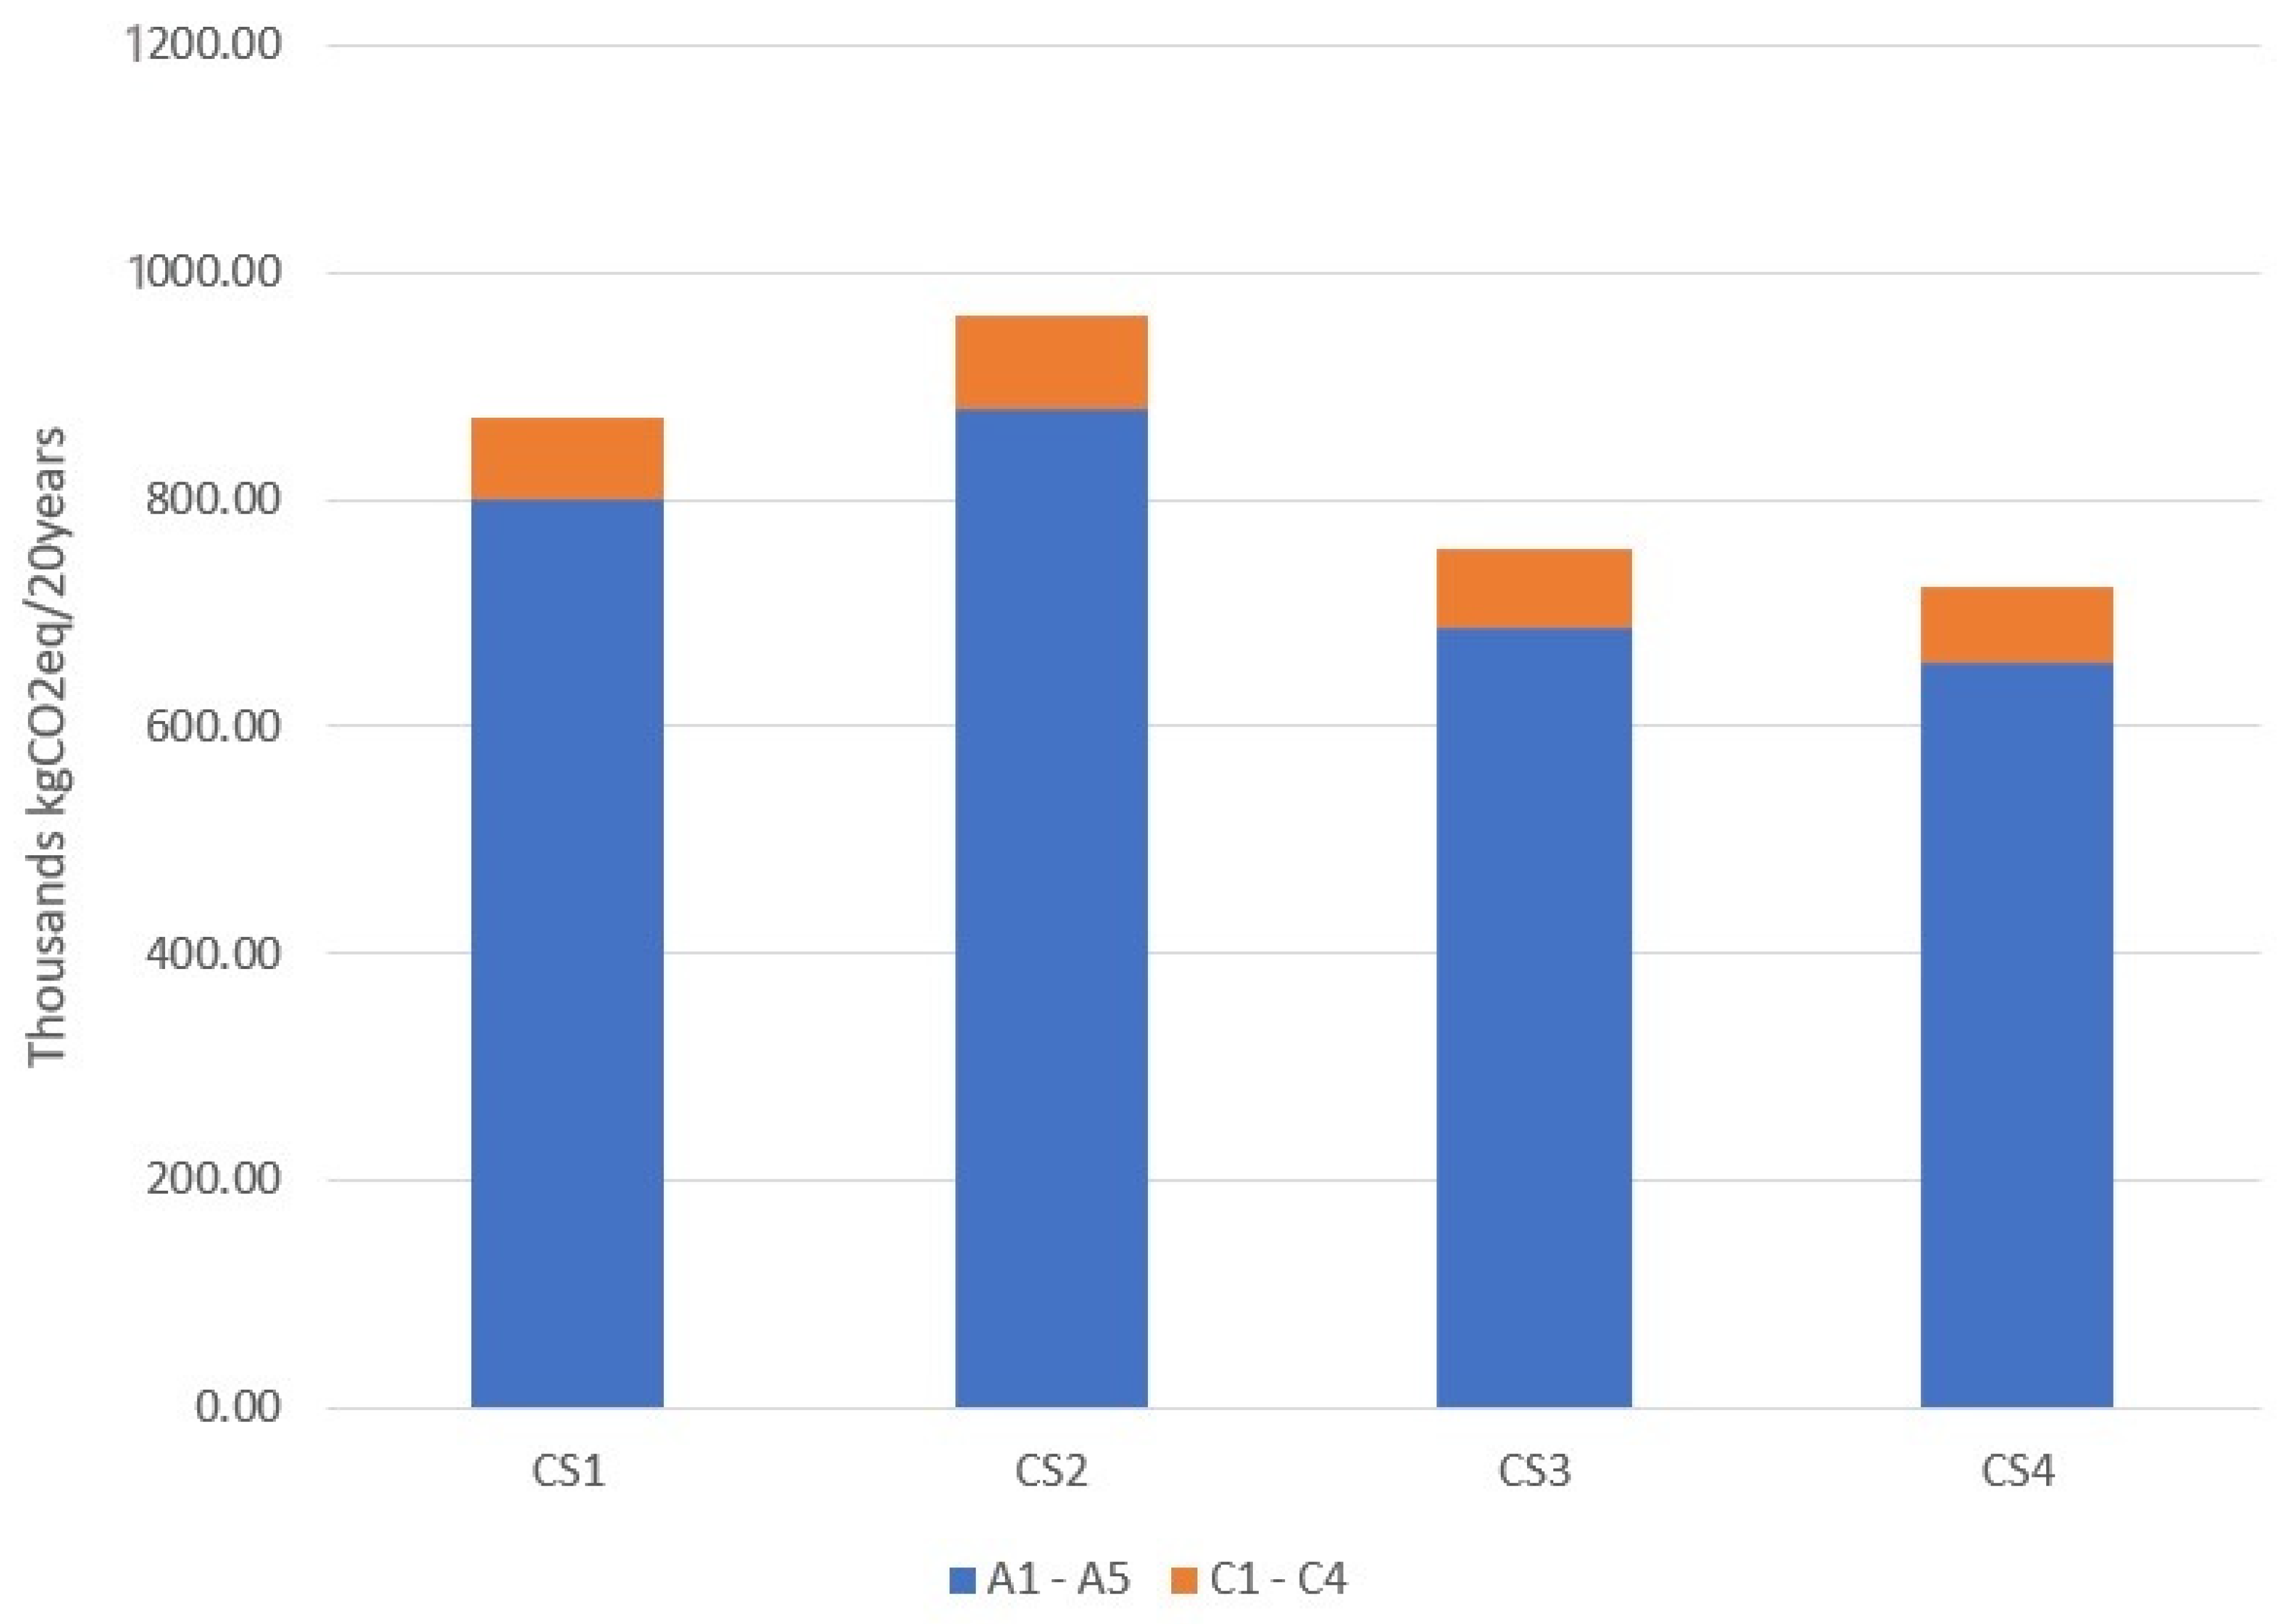
3.2. Comparative Analysis of Embodied Carbon Emissions
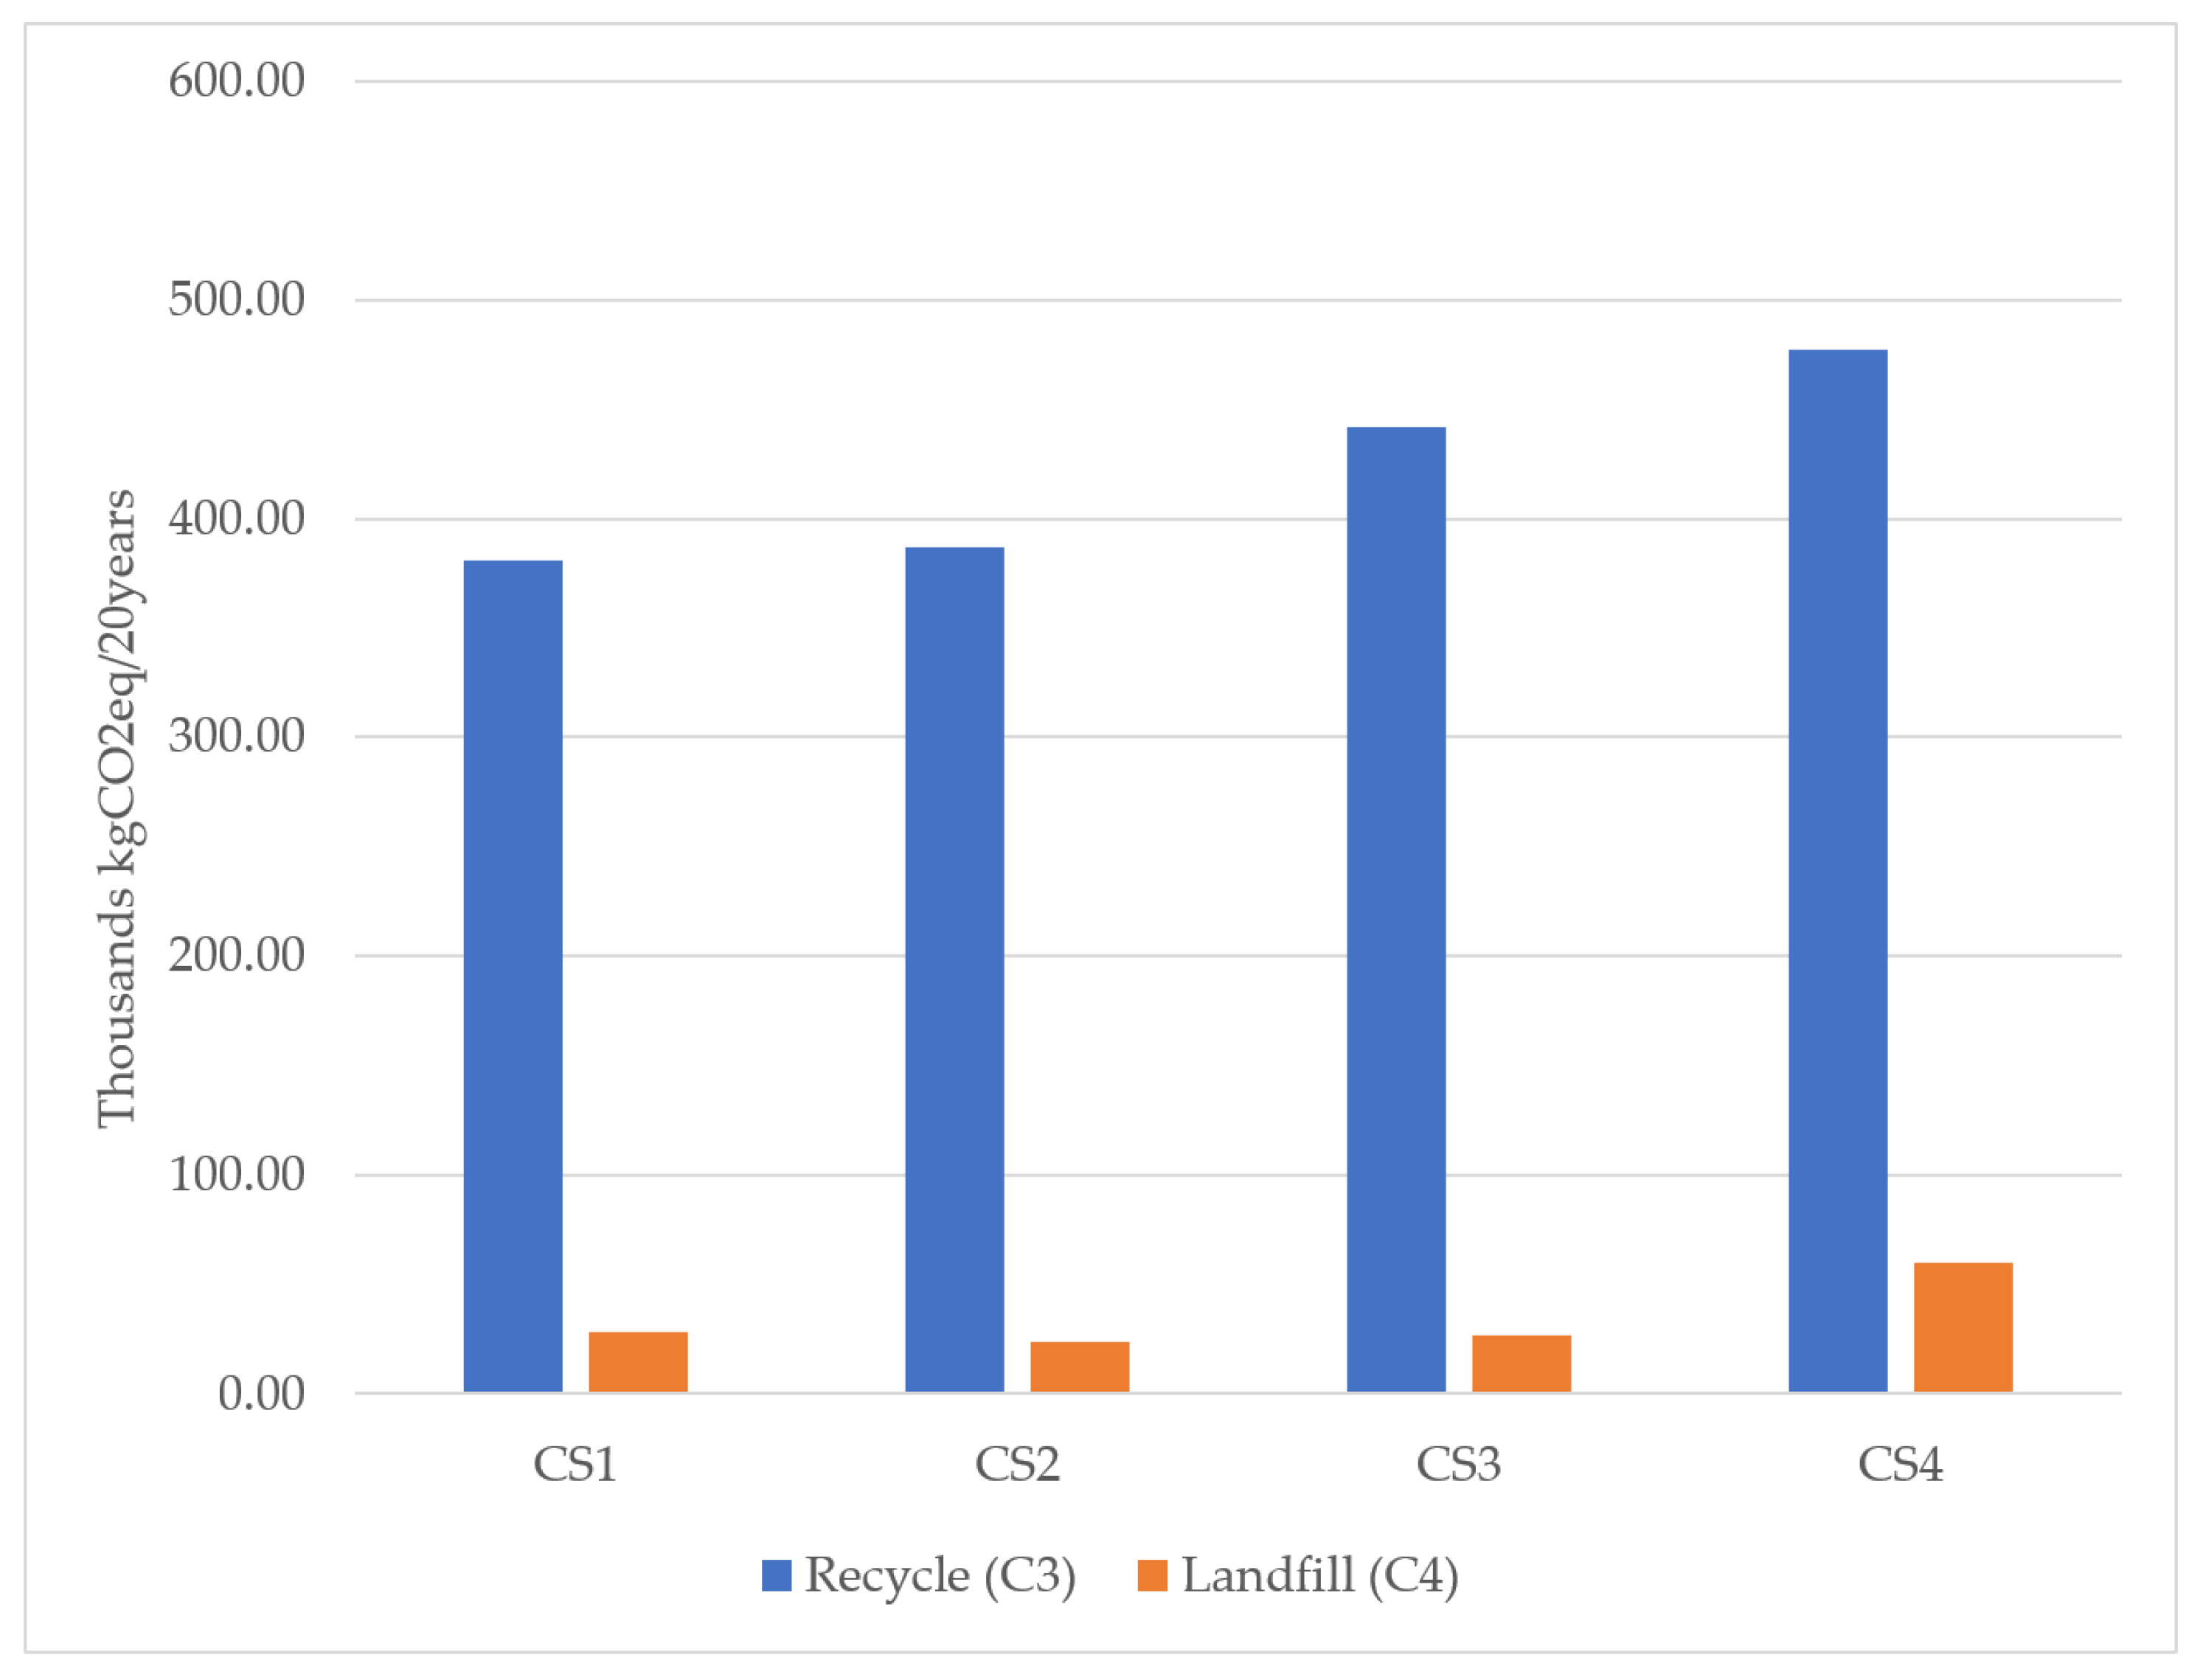
3.3. Assessment of End-of-Life Treatment Options
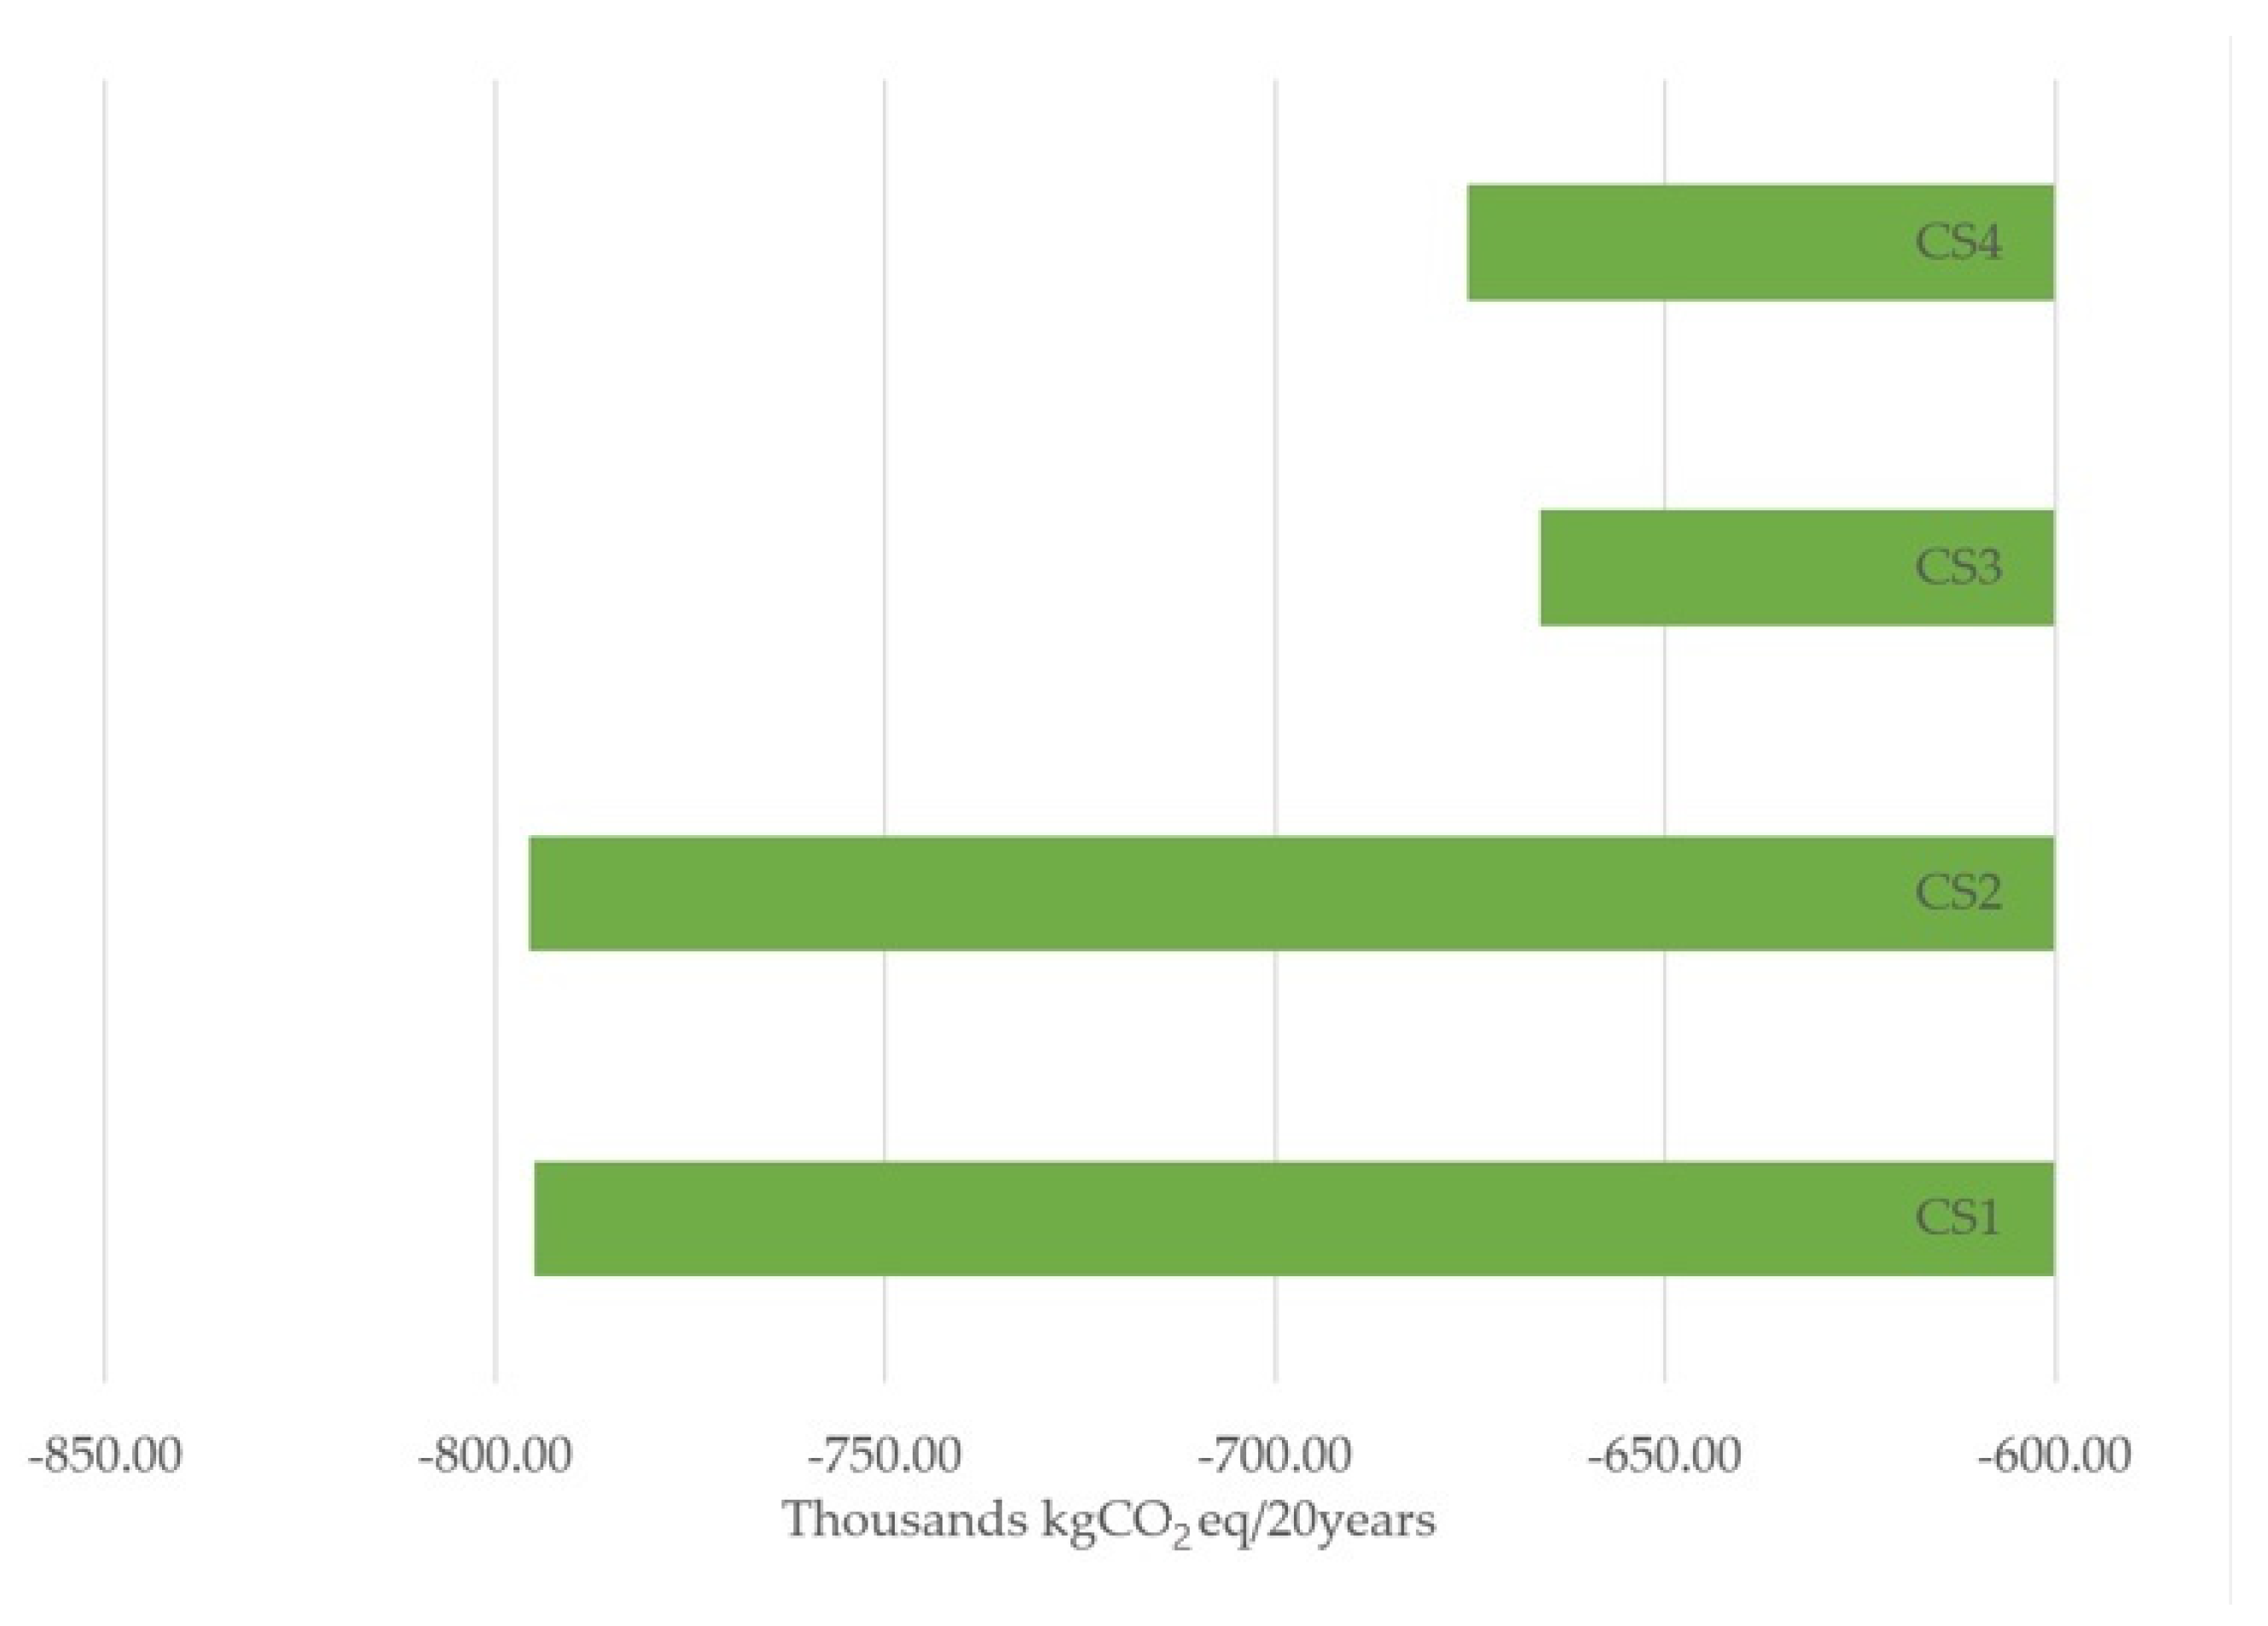
3.4. Material Recovery and Carbon Emission Reduction Potential
4. Discussion
5. Conclusions
Author Contributions
Funding
Institutional Review Board Statement
Informed Consent Statement
Data Availability Statement
Conflicts of Interest
References
- Zimmann, R.; O’Brien, H.; Hargrave, J.; Morrell, M. Circular Economy in the Built Environment. ARUP. 2016. Available online: https://www.arup.com/perspectives/publications/research/section/circular-economy-in-the-built-environment (accessed on 31 October 2022).
- Hossain, M.U.; Wu, Z.; Poon, C.S. Comparative environmental evaluation of construction waste management through different waste sorting systems in Hong Kong. Waste Manag. 2017, 69, 325–335. [Google Scholar] [CrossRef] [PubMed]
- Sandanayake, M.; Zhang, G.; Setunge, M.; Li, C.-Q.; Fang, J. Models and method for estimation and comparison of direct emissions in building construction in Australia and a case study. Energy Build. 2016, 126, 128–138. [Google Scholar] [CrossRef]
- GlobalABC. 2019 Global Status Report for Buildings and Construction: Towards a Zero-Emission, Efficient and Resilient Buildings and Construction Sector. 2019. Available online: http://www.unep.org/resources/publication/2019-global-status-report-buildings-and-construction-sector (accessed on 19 January 2022).
- UN-Habitat. Buildings Day Proves a Hit at COP21 UN-Habitat. 2015. Available online: https://unhabitat.org/buildings-day-proves-a-hit-at-cop21 (accessed on 20 January 2022).
- Hester, J.; Miller, T.R.; Gregory, J.; Kirchain, R. Actionable insights with less data: Guiding early building design decisions with streamlined probabilistic life cycle assessment. Int. J. Life Cycle Assess. 2018, 23, 1903–1915. [Google Scholar] [CrossRef]
- Robati, M.; Daly, D.; Kokogiannakis, G. A method of uncertainty analysis for whole-life embodied carbon emissions (CO2-e) of building materials of a net-zero energy building in Australia. J. Clean. Prod. 2019, 225, 541–553. [Google Scholar] [CrossRef]
- Roberts, M.; Allen, S.; Coley, D. Life cycle assessment in the building design process—A systematic literature review. Build. Environ. 2020, 185, 107274. [Google Scholar] [CrossRef]
- Abouhamad, M.; Abu-Hamd, M. Life Cycle Assessment Framework for Embodied Environmental Impacts of Building Construction Systems. Sustainability 2021, 13, 461. [Google Scholar] [CrossRef]
- Akbarnezhad, A.; Xiao, J. Estimation and Minimization of Embodied Carbon of Buildings: A Review. Buildings 2017, 7, 5. [Google Scholar] [CrossRef]
- De Wolf, C.; Pomponi, F.; Moncaster, A. Measuring embodied carbon dioxide equivalent of buildings: A review and critique of current industry practice. Energy Build. 2017, 140, 68–80. [Google Scholar] [CrossRef]
- Dixit, M.K.; Culp, C.H.; Fernández-Solís, J.L. System boundary for embodied energy in buildings: A conceptual model for definition. Renew. Sustain. Energy Rev. 2013, 21, 153–164. [Google Scholar] [CrossRef]
- Sturgis, S. Targeting Zero Embodied and Whole Carbon Explained; RIBA Publishing: Newcastle upon Tyne, UK, 2017. [Google Scholar]
- Robati, M.; Oldfield, P.; Nezhad, A.A.; Carmichael, D.G.; Kuru, A. Carbon value engineering: A framework for integrating embodied carbon and cost reduction strategies in building design. Build. Environ. 2021, 192, 107620. [Google Scholar] [CrossRef]
- Foraboschi, P.; Mercanzin, M.; Trabucco, D. Sustainable structural design of tall buildings based on embodied energy. Energy Build. 2014, 68, 254–269. [Google Scholar] [CrossRef]
- Robati, M.; Oldfield, P. The embodied carbon of mass timber and concrete buildings in Australia: An uncertainty analysis. Build. Environ. 2022, 214, 108944. [Google Scholar] [CrossRef]
- Thormark, C. The effect of material choice on the total energy need and recycling potential of a building. Build. Environ. 2006, 41, 1019–1026. [Google Scholar] [CrossRef]
- Takano, A.; Pal, S.K.; Kuittinen, M.; Alanne, K.; Hughes, M.; Winter, S. The effect of material selection on life cycle energy balance: A case study on a hypothetical building model in Finland. Build. Environ. 2015, 89, 192–202. [Google Scholar] [CrossRef]
- Danatzko, J.M.; Sezen, H. Sustainable Structural Design Methodologies. Pract. Period. Struct. Des. Constr. 2011, 16, 186–190. [Google Scholar] [CrossRef]
- Nadoushani, Z.S.M.; Akbarnezhad, A. Effects of structural system on the life cycle carbon footprint of buildings. Energy Build. 2015, 102, 337–346. [Google Scholar] [CrossRef]
- Cole, R.J. Energy and greenhouse gas emissions associated with the construction of alternative structural systems. Build. Environ. 1998, 34, 335–348. [Google Scholar] [CrossRef]
- Chiniforush, A.A.; Akbarnezhad, A.; Valipour, H.; Xiao, J. Energy implications of using steel-timber composite (STC) elements in buildings. Energy Build. 2018, 176, 203–215. [Google Scholar] [CrossRef]
- Robertson, A.B.; Lam, F.C.F.; Cole, R.J. A Comparative Cradle-to-Gate Life Cycle Assessment of Mid-Rise Office Building Construction Alternatives: Laminated Timber or Reinforced Concrete. Buildings 2012, 2, 245–270. [Google Scholar] [CrossRef]
- Skullestad, J.L.; Bohne, R.A.; Lohne, J. High-rise Timber Buildings as a Climate Change Mitigation Measure—A Comparative LCA of Structural System Alternatives. Energy Procedia 2016, 96, 112–123. [Google Scholar] [CrossRef]
- Poon, C.-S.; Azhar, S.; Anson, M.; Wong, Y.-L. Comparison of the strength and durability performance of normal- and high-strength pozzolanic concretes at elevated temperatures. Cem. Concr. Res. 2001, 31, 1291–1300. [Google Scholar] [CrossRef]
- Visintin, P.; Ali, M.S.M.; Xie, T.; Sturm, A.B. Experimental investigation of moment redistribution in ultra-high performance fibre reinforced concrete beams. Constr. Build. Mater. 2018, 166, 433–444. [Google Scholar] [CrossRef]
- Türkmen, İ.; Ekinci, E.; Kantarci, F.; Sarici, T. The mechanical and physical properties of unfired earth bricks stabilized with gypsum and Elazığ Ferrochrome slag. Int. J. Sustain. Built Environ. 2017, 6, 565–573. [Google Scholar] [CrossRef]
- Muheise-Araalia, D.; Pavia, S. Properties of unfired, illitic-clay bricks for sustainable construction. Constr. Build. Mater. 2021, 268, 121118. [Google Scholar] [CrossRef]
- Zeitz, A.; Griffin, C.T.; Dusicka, P. Comparing the embodied carbon and energy of a mass timber structure system to typical steel and concrete alternatives for parking garages. Energy Build. 2019, 199, 126–133. [Google Scholar] [CrossRef]
- Morris, F.; Allen, S.; Hawkins, W. On the embodied carbon of structural timber versus steel, and the influence of LCA methodology. Build. Environ. 2021, 206, 108285. [Google Scholar] [CrossRef]
- Li, J.; Rismanchi, B.; Ngo, T. Feasibility study to estimate the environmental benefits of utilising timber to construct high-rise buildings in Australia. Build. Environ. 2019, 147, 108–120. [Google Scholar] [CrossRef]
- Sandanayake, M.; Lokuge, W.; Zhang, G.; Setunge, S.; Thushar, Q. Greenhouse gas emissions during timber and concrete building construction—A scenario based comparative case study. Sustain. Cities Soc. 2018, 38, 91–97. [Google Scholar] [CrossRef]
- Autodesk, Inc. Autodesk Revit [Computer Software]. 2022. Available online: https://www.autodesk.com/products/revit/overview (accessed on 20 September 2023).
- ISO 14040; Environmental Management: Life Cycle Assessment: Principles and Framework. International Organization for Standardization: Geneva, Switzerland, 2006. Available online: https://www.iso.org/cms/render/live/en/sites/isoorg/contents/data/standard/03/74/37456.html (accessed on 7 March 2022).
- ISO 14044; Environmental Management, Life Cycle Assessment, Requirements and Guidelines. International Organization for Standardization: Geneva, Switzerland, 2006. Available online: https://www.iso.org/cms/render/live/en/sites/isoorg/contents/data/standard/03/84/38498.html (accessed on 7 March 2022).
- BS EN 15978:2011; Sustainability of Construction Works: Assessment of Environmental Performance of Buildings: Calculation Method. British Standards Institution: London, UK, 2012.
- Zhu, W.; Feng, W.; Li, X.; Zhang, Z. Analysis of the embodied carbon dioxide in the building sector: A case of China. J. Clean. Prod. 2020, 269, 122438. [Google Scholar] [CrossRef]
- Liu, K.; Leng, J. Quantitative research on embodied carbon emissions in the design stage: A case study from an educational building in China. J. Asian Archit. Build. Eng. 2022, 21, 1182–1192. [Google Scholar] [CrossRef]
- Jones, C.; Hammond, G. ICE Embodied Carbon Database. Circular Ecology. 2019. Available online: https://circularecology.com/embodied-carbon-footprint-database.html (accessed on 14 June 2023).
- RICS. Whole Life Carbon Assessment for the Built Environment. RICS. 2017. Available online: https://www.rics.org/globalassets/rics-website/media/upholding-professional-standards/sector-standards/building-surveying/whole-life-carbon-assessment-for-the-built-environment-1st-edition-rics.pdf (accessed on 9 June 2022).
- Gibbon, O.P.; Orr, J. How to Calculate Embodied Carbon. Institution of Structural Engineers. 2020. Available online: http://www.https://www.istructe.org/IStructE/media/Public/Resources/istructe-how-to-calculate-embodied-carbon.pdf (accessed on 24 March 2022).
- SteelConstruction.info. End of Life LCA and Embodied Carbon Data for Common Framing Materials, Steelconstruction.info. 2021. Available online: https://steelconstruction.info/End_of_life_LCA_and_embodied_carbon_data_for_common_framing_materials (accessed on 17 May 2023).
- Zhang, X.; Shen, L.; Zhang, L. Life cycle assessment of the air emissions during building construction process: A case study in Hong Kong. Renew. Sustain. Energy Rev. 2013, 17, 160–169. [Google Scholar] [CrossRef]
- Ding, G.K.C. Embodied Carbon in Construction, Maintenance and Demolition in Buildings. In Embodied Carbon in Buildings: Measurement, Management, and Mitigation, 1st ed.; Pomponi, F., De Wolf, C., Moncaster, A., Eds.; Springer International Publishing EEA: Cham, Switzerland, 2018; pp. 158–178. [Google Scholar] [CrossRef]
- Ge, J.; Luo, X.; Lu, J. Evaluation system and case study for carbon emission of villages in Yangtze River Delta region of China. J. Clean. Prod. 2017, 153, 220–229. [Google Scholar] [CrossRef]
- Wang, J.; Wu, H.; Duan, H.; Zillante, G.; Zuo, J.; Yuan, H. Combining life cycle assessment and Building Information Modelling to account for carbon emission of building demolition waste: A case study. J. Clean. Prod. 2018, 172, 3154–3166. [Google Scholar] [CrossRef]
- Gibbon, O.P.; Orr, J.J.; Archer-Jones, C.; Arnold, W.; Green, D. How to Calculate Embodied Carbon. The Institution of Structural Engineers. 2022. Available online: https://www.istructe.org/resources/guidance/how-to-calculate-embodied-carbon/ (accessed on 17 June 2022).
- Cousins, S. The 75 Percent Problem: Aluminium’s Carbon Footprint. 2021. Available online: https://ww3.rics.org/uk/en/modus/natural-environment/climate-change/the-75-per-cent-problem--aluminium-s-carbon-footprint-.html (accessed on 12 May 2023).
- Hopkinson, P.; Chen, H.-M.; Zhou, K.; Wang, Y.; Lam, D. Recovery and reuse of structural products from end-of-life buildings. Proc. Inst. Civ. Eng. Eng. Sustain. 2019, 172, 119–128. [Google Scholar] [CrossRef]
- Zhang, C.; Hu, M.; Di Maio, F.; Sprecher, B.; Yang, X.; Tukker, A. An overview of the waste hierarchy framework for analyzing the circularity in construction and demolition waste management in Europe. Sci. Total Environ. 2022, 803, 149892. [Google Scholar] [CrossRef] [PubMed]
- Blengini, G.A. Life cycle of buildings, demolition and recycling potential: A case study in Turin, Italy. Build. Environ. 2009, 44, 319–330. [Google Scholar] [CrossRef]


| Model | Building Component | Material | Material Details | Material Density (kN/m3) |
|---|---|---|---|---|
| CS1 |  | |||
| External Walls | Cladding Panels | Sandwiched Cladding Panels with Mineral Wool Insulation | 12.55 | |
| Columns | Steel | Metal—Steel 50-355/43-275 | 77.01 | |
| Beams | Steel | Metal—Steel 50-355/43-275 | 77.01 | |
| Foundation | Concrete Slab | Cast-in-Place Concrete with RC25/30 and RC28/35 Strengths | 23.61 | |
| CS2 | 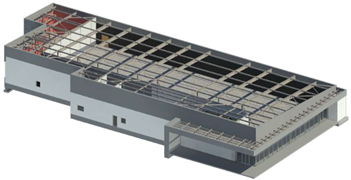 | |||
| External Walls | Poroton Brick | Clay Block—Poroton Block | 0.59 | |
| Cladding Panels | Sandwiched Cladding Panels with Mineral Wool Insulation | 12.55 | ||
| Columns | Steel | Metal—Steel 50-355/43-275 | 77.01 | |
| Beams | Steel | Metal—Steel 50-355/43-275 | 77.01 | |
| Foundation | Concrete Slab | Cast-in-Place Concrete with RC25/30 and RC28/35 Strengths | 23.61 | |
| CS3 |  | |||
| External Walls | Precast Concrete | 100 mm Thick Walls, Single-Skin Concrete Blocks | 23.61 | |
| Cladding Panels | Sandwiched Cladding Panels with Mineral Wool Insulation | 12.55 | ||
| Columns | Precast Concrete | Reinforced Concrete—Precast | 23.61 | |
| Beams | Glulam | Glue-Laminated Timber | 4.41 | |
| Foundation | Concrete Slab | Cast-in-Place Concrete with RC25/30 and RC28/35 Strengths | 23.61 | |
| CS4 | 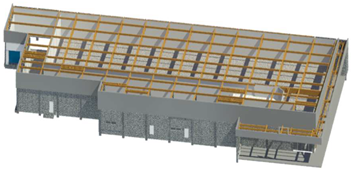 | |||
| External Walls | Precast Concrete | 100 mm Thick Walls, Single-Skin Concrete Blocks | 23.61 | |
| Cladding Panels | Sandwiched Cladding Panels with Mineral Wool Insulation | 12.55 | ||
| Columns | Glulam | Glue-Laminated Timber | 4.41 | |
| Beams | Glulam | Glue-Laminated Timber | 4.41 | |
| Foundation | Concrete Slab | Cast-in-Place Concrete with RC25/30 and RC28/35 Strengths | 23.61 | |
| Building Material | CEF Detail | CEF (kgCO2eq./kg) |
|---|---|---|
| Aluminium | Aluminium Extruded Profile, European Mix, Inc. Imports | 1.7063 |
| Aluminium Sheet, European Mix, Inc. Imports | 3.2906 | |
| Brick | Clay, Brick | 0.213 |
| Cement | Mortar or Screed (1:3 cement and sand mix) (CEM 1) | 0.2002 |
| Concrete | 100 mm Thick Walls, Single-Skin Concrete Blocks, Solid, High Density, Average Strength, Inc. Mortar | 0.0966 |
| 150 mm Thick Walls, Single-Skin AAC Concrete Blocks, Average Strength, Inc. Mortar | 0.2569 | |
| Concrete, RC25/30 with CEM 1 Cement | 0.1286 | |
| Concrete, RC28/35 with CEM 1 Cement | 0.1362 | |
| Precast Concrete Beams and Columns—Steel Reinforced with World-Average Steel | 0.247 | |
| Precast Hollow-Core Concrete Flooring, 150 mm, Prestressed Steel Reinforced with European Recycled Steel | 0.1711 | |
| Floor Paint | Paint, General | 2.91 |
| Glass | Glass Toughened 3 mm, Ex Frame | 1.6672 |
| Glulam | Timber, Glulam No Carbon Storage | 0.5121 |
| Timber, Laminated Veneer Lumber (No Carbon Storage) | 0.3898 | |
| Gypsum Wall Board | Plasterboard | 0.39 |
| Insulation | Mineral Wool | 1.28 |
| Paint | Paint, General | 2.91 |
| Plaster | General (Gypsum) | 0.13 |
| Plastic | PVC pipe | 3.23 |
| Plywood | Plywood | 1.1 |
| Poroton | Clay, Brick | 0.213 |
| Steel | Steel Pipe | 2.87 |
| Steel, Organic Coated Sheet | 3.06 | |
| Steel, Section (Primary) | 3.03 | |
| Steel, Sheet Hot-Rolled Coil | 2.28 | |
| Steel, Sheet Hot-Dip Galvanised Steel | 2.76 | |
| Vinyl | 2.85 | |
| Building Material | CEF (kgCO2eq./m2) | |
| Sandwiched Panels | 44.5284 | |
| Roof panels | 35.616 | |
| Tiles (Ceiling) | 17.2 | |
| Tiles (Floor) | 10.5 |
| Building Component | TEF (Mode) | TEF (kgCO2eq./kg/km) | |
|---|---|---|---|
| Basic Roofs Ceilings Curtain Walls | Internal Walls and Partitions Roof Fittings Windows | Road Transport Emissions, Average Laden | 0.0001065 |
| Basic Roofs Ceilings Electrical Cabling System External Doors External Wall Finishes External Walls Floor Finishes Floors/Slab | Ground-Bearing Slab Internal Doors Mechanical Duct System Plumbing and Piping System Screed Structural Columns Structural Foundations Structural Framing | Road Transport Emissions, Fully Laden | 0.00007524 |
| Building Component | TD (Mode) | TD (km) by Road | |
| Basic Roofs Ceilings Electrical Cabling System External Walls Floors/Slab Ground-Bearing Slab Internal Walls and Partitions | Mechanical Duct System Plumbing and Piping System Roof Fittings Screed Structural Columns Structural Foundations Structural Framing | Local Manufacturing | 50 |
| Ceilings External Wall Finishes External Walls Floor Finishes | Floors/Slab Internal Walls and Partitions Roof Fittings Screed | National Manufacturing | 300 |
| Basic Roofs Curtain Walls External Doors | External Walls Internal Doors Windows | European Manufacturing | 1500 |
| Stages | CEF (kgCO2eq.) |
|---|---|
| Demolition and Deconstruction Stage (C1) | |
| Bricks | 0.0048 d |
| Concrete | 0.0056 d |
| Steel | 0.020 d |
| Plastics, Glass, Plaster, Paint, Gypsum, Mineral Wool, Roof, Timber (Glulam), and Tiles | 3.400 bc |
| Transportation Stage (C2) | |
| Transportation of Waste Materials to Treatment Facilities and Landfill Sites: | |
| Aluminium | 0.0131 a |
| Bricks | 0.0015 d |
| Concrete | 0.0017 d |
| Steel | 0.040 d |
| Plastics, Glass, Plaster, Paint, Gypsum, Mineral Wool, Timber (Glulam), and Roof | 0.0054 bc |
| Tiles | 1.01 a |
| Processing of Waste—Recycling (C3) | |
| Aluminium | 1.07 a |
| Bricks | 0.0021 d |
| Concrete | 0.0024 d |
| Glass | 0.432 a |
| Steel and Plastics, Glass, Plaster, Paint, Gypsum, and Mineral Wool | 0.013 bc |
| Timber (Glulam) | 1.67 bc |
| Roof | 9.54 a |
| Disposal—Landfill (C4) | |
| Aluminium | 0.0034 a |
| Bricks | 0.0016 d |
| Concrete | 0.0014 d |
| Glass | 0.279 a |
| Steel, Plastics, Glass, Plaster, Paint, Gypsum, Mineral Wool, and Roof | 0.013 bc |
| Timber (Glulam) | 2.15 bc |
| Tiles | 4.63 a |
| Material Recovery and Benefit (D) | |
| Aluminium | −3.98 a |
| Bricks | −0.0207 d |
| Concrete | −0.0053 d |
| Glass | −0.39 d |
| Steel | −1.45 d |
| Timber (Glulam) | −0.524 bc |
| Roof | −17.43 a |
| Waste Material | Building Components |
|---|---|
| Type A | |
| Aluminium | Doors, Roof, Windows |
| Bricks | Walls |
| Concrete | Floors, Foundations, Walls |
| Glass | Doors, Windows, Curtain Walls |
| Steel | Structural Frames, Steel in Concrete, Iron Pieces, Roof |
| Timber | Ceilings, Structural Frames, Roof, Walls |
| Type B | |
| Gypsum | Ceilings, Walls |
| Mineral Wool | Walls, Roofs |
| Paint | Floors, Walls |
| Plaster | Walls |
| Plastics | Pipes, Other Plastic Materials |
| Tiles | Ceilings Floors, Walls |
| Waste Material | Demolition/ Dismantling | Treatment Option (%) | |
|---|---|---|---|
| Recycle | Landfill | ||
| Aluminium | Demolition | 80 c | 20 |
| Bricks | Demolition | 90 de | 10 |
| Concrete | Demolition | 90 e | 10 |
| Paint | Demolition | 100 | |
| Glass | Demolition | 50 e | 50 |
| Timber | Demolition | 90 e | 10 |
| Gypsum | Demolition | 100 | |
| Mineral Wool | Demolition | 100 | |
| Plaster | Demolition | 100 | |
| Plastics | Demolition | 100 | |
| Steel | Demolition | 92 ab | 8 |
| Tiles | Demolition | 100 | |
| Building Material | Weight (t) CS1 | Weight (t) CS2 | Weight (t) CS3 | Weight (t) CS4 |
|---|---|---|---|---|
| Aluminium | 16.69 | 16.77 | 10.24 | 10.24 |
| Bricks/Poroton | 26.95 | 403.74 | - | - |
| Concrete | 1476.30 | 1463.47 | 2045.25 | 1904.27 |
| Glass | 8.11 | 8.11 | 8.11 | 8.11 |
| Steel | 151.64 | 139.29 | 46.83 | 46.83 |
| Timber (Glulam) | 1.67 | 1.67 | 49.34 | 66.84 |
| Gypsum | 43.54 | 67.37 | 38.72 | 38.82 |
| Mineral Wool | 52.40 | 28.87 | 46.21 | 46.21 |
| Paint | 0.29 | 0.28 | 0.15 | 0.15 |
| Plaster | 0.32 | 0.31 | 2.55 | 2.55 |
| Plastics | 0.12 | 0.12 | 0.12 | 0.12 |
| Tiles | 60.30 | 60.30 | 61.64 | 61.64 |
| Total | 1838.33 | 2190.30 | 2309.16 | 2185.78 |
Disclaimer/Publisher’s Note: The statements, opinions and data contained in all publications are solely those of the individual author(s) and contributor(s) and not of MDPI and/or the editor(s). MDPI and/or the editor(s) disclaim responsibility for any injury to people or property resulting from any ideas, methods, instructions or products referred to in the content. |
© 2023 by the authors. Licensee MDPI, Basel, Switzerland. This article is an open access article distributed under the terms and conditions of the Creative Commons Attribution (CC BY) license (https://creativecommons.org/licenses/by/4.0/).
Share and Cite
Blay-Armah, A.; Mohebbi, G.; Bahadori-Jahromi, A.; Fu, C.; Amoako-Attah, J.; Barthorpe, M. Evaluation of Embodied Carbon Emissions in UK Supermarket Constructions: A Study on Steel, Brick, and Timber Frameworks with Consideration of End-of-Life Processes. Sustainability 2023, 15, 14978. https://doi.org/10.3390/su152014978
Blay-Armah A, Mohebbi G, Bahadori-Jahromi A, Fu C, Amoako-Attah J, Barthorpe M. Evaluation of Embodied Carbon Emissions in UK Supermarket Constructions: A Study on Steel, Brick, and Timber Frameworks with Consideration of End-of-Life Processes. Sustainability. 2023; 15(20):14978. https://doi.org/10.3390/su152014978
Chicago/Turabian StyleBlay-Armah, Augustine, Golnaz Mohebbi, Ali Bahadori-Jahromi, Charlie Fu, Joseph Amoako-Attah, and Mark Barthorpe. 2023. "Evaluation of Embodied Carbon Emissions in UK Supermarket Constructions: A Study on Steel, Brick, and Timber Frameworks with Consideration of End-of-Life Processes" Sustainability 15, no. 20: 14978. https://doi.org/10.3390/su152014978