


Forecasting Fruit Export Damages and Enhancing Food Safety through Risk Management

1
Department of Logistics, Stellenbosch University, Private Bag X1, Matieland, Stellenbosch 7602, South Africa
2
Department of Industrial Engineering, Stellenbosch University, Private Bag X1, Matieland, Stellenbosch 7602, South Africa
*
Author to whom correspondence should be addressed.
Sustainability 2023, 15(21), 15216; https://doi.org/10.3390/su152115216
Submission received: 14 September 2023
/
Revised: 14 October 2023
/
Accepted: 19 October 2023
/
Published: 24 October 2023
(This article belongs to the Topic New Insights in Agriculture: Sustainability, Digitalization and Food Safety)
Abstract
:This study underscores serious issues in the South African fruit export sector, notably highlighting the persistent fruit damage after 2016 that could boost microbial growth, jeopardising food safety. To enhance the supply chain and safeguard food, identifying and strategising the types of fruit damage during distribution is critical. The data bring to light intricate and varied trends in damage claims across different fruit types and years, indicating a need to understand each fruit type’s specific vulnerabilities and adjust handling and farming techniques accordingly to minimise losses after harvest. The analysis reveals key insights into seasonal patterns in fruit damage claims, with notable increases especially in January and February, and clear fluctuations throughout the year. Utilising this knowledge, stakeholders can optimise operations and formulate guidelines tailored to high-risk seasons for fruit handling and transportation. Looking forward, both SARIMA and linear regression models predict an increasing trend in damage claims, highlighting a pressing need for improved planning and risk management strategies. This proactive approach will be crucial in mitigating future damage claims and enhancing food safety amid the growing challenges posed by climate changes and shifting global standards and regulations.
1. Introduction
Climate change stands as one of the most pressing challenges of our time, with its effects reverberating through human and natural systems worldwide. As new insights on this topic emerge daily, it is evident that global disruptions caused by weather extremes will persist well into the future, leaving lasting impacts on physical, biological, human and managed systems [1]. Among the numerous industries vulnerable to these changes, the South African fruit export supply chain and marine cargo insurance face significant impacts. Surprisingly, however, there is a lack of research explicitly examining the effects of climate change on these critical components of global trade.
According to the Intergovernmental Panel on Climate Change (IPCC) estimates, human activities releasing greenhouse gases have caused global temperatures to rise by 1.1 °C since the pre-industrial era (1850–1900). The past decade (2011–2020) has seen a pronounced escalation in this warming trend [1]. This rise in temperatures poses a significant threat to various economic sectors, including the fruit export industry of South Africa [2]. To understand the impact of climate change on the marine cargo insurance industry in South Africa, Du Plessis et al. [3] analysed claims over the last decade. The results were alarming, revealing an increasing trend in weather-related cargo claims and extreme outlier years.
The South African fruit export supply chain plays a vital role in the country’s economy, annually exporting fruit valued at over USD 3 billion [4]. With the country’s favourable conditions for fruit production, this thriving industry contributes significantly to employment opportunities while strengthening trade relationships with over 100 countries worldwide. The supply chain, however, operates within stringent guidelines and protocols, especially concerning temperature control, due to the perishable nature of the products. Any temperature break in the cold chain can lead to non-conformance and potential food safety concerns, which can result in damage claims [5,6].
Despite the sensitive nature of the South African fruit export supply chain, a concerning trend emerges from global port statistics. Nearly 50% of ports worldwide currently lack strategies to mitigate the impacts of climate change [7,8]. Such a lack of preparedness, coupled with the known and projected climatic disruptions, creates a highly vulnerable supply chain with low levels of resilience [9].
This research delves into the vulnerabilities of South African fruit exports (as evidenced through damage claims) and its implications for food safety within the maritime supply chain. The main objective of the fruit export industry is to deliver fresh fruit in a safe condition for human consumption. However, when the fruit is rejected due to damages, it goes against this goal and leads to insurance claims. By carefully monitoring these claims for any patterns or trends, one can identify the root causes of these rejections, creating a valuable feedback loop for the industry. Armed with this information, one can take preventive measures to avoid future occurrences of damaged fruit and improve the overall delivery process.
Although there is an existing body of research documenting the implications of temperature fluctuations on fruit damage during distribution [5,6,10,11], what sets this study apart is its unique risk-based viewpoint on fruit exports and food safety through a risk transfer mechanism—which has not been thoroughly explored in previous research. By addressing this critical aspect, the research contributes valuable insights to understanding the complexities and potential solutions for ensuring food safety during the export process.
The structure of the remaining sections is as follows: Section 2 provides a literature review covering three main topics central to this research. Section 3 outlines the methodology and conceptual framework, while Section 4 presents the analysis and results. This is followed by a discussion in Section 5, a conclusion in Section 6 and an overview of potential future work in Section 7.
2. Literature Review
Through a literature overview, this section presents a concise summary of the main topics covered in this article, namely (1) South African fruit exports and food safety, (2) South African ports and (3) maritime supply chain risk management. This section aims to provide readers with a broad understanding of these topics and the theoretical framework supporting the research. Firstly, it delves into the significant impact of weather-related risks on the fresh food system, including the cold chain, and highlights the growing concern over food safety and security. Secondly, it focuses on South African ports, which are vital in the global logistics network [3]. It addresses the vulnerability of these ports to weather-related risks and extreme weather events, leading to disruptions and congestion in the supply chain—further affecting the cold chain. Lastly, this section explores the concept of maritime supply chain risk management, including using marine cargo insurance as a risk transfer mechanism. It outlines a layer model for maritime transportation risk management, incorporating risk identification and evaluation into maritime logistics networks. By the end of this section, readers should have gained a general understanding of the core topics and theoretical framework that set the stage for the subsequent research questions.
2.1. South African Fruit Exports
In South Africa, the fruit industry annually exports approximately 3.2 million tons (or USD 3.3 billion) of fruit [4]. Out of this, only the highest quality surplus fruit, accounting for roughly 70% of the total fresh fruit produced, is exported to nearly 110 countries, creating a thriving industry that provides employment opportunities for many [12,13,14].
The fruit export industry in South Africa is prospering and witnessing substantial growth. According to the National Department of Agriculture, Forestry and Fisheries [15], the agricultural sector (including forestry and fisheries) has experienced an average annual growth rate of 7.6% since 1994, confirming this upward trend. South Africa’s favourable conditions make it suitable for fruit production, leading to cultivation in various parts of the country. During the 2018–2019 season, more than 250 million cartons of fresh fruit were exported to major destinations, including the European Union (35.43%), Asia (20.62%), the United Kingdom (14.04%), the Middle East (12.74%) and the Russian Federation (6.89%) [16].
When exporting fruit, it is crucial to control time and temperature factors in the supply chain. Failure to do so can result in the fruit not meeting market requirements, leading to a decline in quality, shelf life and food safety. This, in turn, can lead to price reductions, rejection or loss of market [10,14]. The series of refrigeration steps implemented throughout the supply chain to maintain perishable food at the appropriate temperature is known as the cold chain [17]. Maintaining specific temperatures within the cold chain and continuously monitoring temperature within reefer containers are essential for preserving the quality of the fruit [5,11,18].
Although different types of fruit have distinct cold chain handling processes, the handling process after loading the fruit into the reefer container is the same for all types [6]. The Perishable Products Export Control Board (PPECB), established in 1926 and currently managed by the Department of Agriculture, Land Reform and Rural Development (DALRRD), oversees all South African perishable product exports. They establish export protocols and guidelines, including ideal temperature ranges for each perishable product, and ensure exporters adhere to quality standards.
Research conducted by Goedhals-Gerber et al. [6] examined temperature breaks in the fruit export cold chain at the Port of Cape Town. They found that 41.5% of temperature breaks occurred at the port but did not investigate the specific causes of these breaks. A subsequent study in 2017 revealed that 81% of temperature breaks within the fruit export cold chain via the Port of Cape Town occurred at the Port of Cape Town. Factors such as external ambient temperatures, weather-related delays (e.g., high winds, fog, waves), vessel ranging and strong ocean currents were identified as the dominant causes of these breaks [11].
In 2020, a further study on the export of navel oranges through the Port of Cape Town found temperature breaks during port operations, some lasting over 9 h. While the study did not investigate the root causes of these breaks, it highlighted weather exposure, transportation delays, port congestion and inspection delays as potential reasons [5,19].
Controlling the time and temperature factors throughout the fruit export supply chain is crucial to ensuring high-quality produce comply with country-specific food safety regulations and avoid rejections at the port of import, which leads to potential damage claims. Mutumbo [20] state that rising natural hazards and extreme weather events have led to additional risks in ports and shipping operations, potentially affecting the fruit export supply chain [6]. Many exporters rely on marine cargo insurance to mitigate potential risks, as discussed briefly in the subsequent sections.
Food Safety
Food safety and security is a growing concern, and discussions around it have increased in recent years [21,22,23]. While progress has been made in fresh food governance through international collaboration and advancements in science and technology, the literature now confirms that climate change has a negative impact on fresh food safety [24]. Globally, foodborne diseases make nearly one out of every ten people sick and cause over 400,000 deaths each year, and climate change is likely to exacerbate this problem [25]. Predictions indicate that climate change events will reduce food production, increase food contamination and contribute to global food price increases from 3% to 84% by 2050, leading to food insecurity and malnutrition [26].
Refrigeration plays a vital role in ensuring food safety [27]. Perishable food, such as fruit, must be maintained in a chilled or frozen state throughout the entire supply chain. Insufficient refrigeration that fails to keep perishable food within the required temperature range can promote the growth of harmful pathogens and spoilage microorganisms, rendering the product unfit for human consumption [17]. Consequently, when cases of inadequate refrigeration of perishable food are identified and reported, it becomes necessary to reject the food shipment to address concerns about food safety.
Decision makers must consider the direct and indirect impacts of climate change and variability on food safety hazards throughout the entire food chain, including food distribution [25]. Climate change (and unpredictability) can cause food safety hazards at various stages of the fresh food value chain, from primary production to consumption [24]. For instance, rising temperatures, changes in rainfall patterns, drought stresses and extreme weather events can increase the risks of food contamination and the occurrence of foodborne diseases [25]. Transportation and warehousing can also create challenges in maintaining the cold chain due to slow transfers (weather-related delays), disruptions, poor insulation and inadequate refrigeration. This impacts the quality and safety of fresh food [24]. There exists a significant variation in the effectiveness of cold chains among countries; developing nations are generally less equipped to manage potential risks impacting the cold chain [17], a situation compounded by the limited information available on temperature abuse in these countries [28].
In conclusion, the significant impact of climate change events on the fresh food system, including the cold chain, necessitates the involvement of all stakeholders in implementing preventive measures. The risks posed by climate change events extend beyond the safety of fresh food to the entire supply chain, potentially leading to further losses and compromised safety. With food safety (quality) and security (supply) being critical concerns, decision makers must address climate change’s direct and indirect effects on food safety hazards throughout the cold chain. This includes identifying sources and mitigating temperature breaches/failures during transportation, which are anticipated to increase due to climate change events.
2.2. South African Ports
The efficient functioning of port cities is vital for the global economy, especially in developing nations [7,8,29]. Ports serve as critical nodes in the global supply chain, facilitating about 80% of trade volume and 70% of trade value through maritime transportation [7]. However, ports face high vulnerability to the impacts of weather extremes due to their geographical location, as demonstrated by the devastating effects of extreme weather events [7,8,29,30]. Climate change directly affects port infrastructure, services and operations [7].
South Africa plays a crucial role in the global logistics network, with its major ports connecting sub-Saharan Africa to other continents. However, the country’s logistics network is vulnerable to disruptions caused by extreme weather events, including floods, storms and droughts [20]. On average, South African ports experience one weather-related incident daily, a significant driver of congestion at these ports [31,32,33,34].
With 3000 km of coastline, South Africa is home to eight commercial ports operated by Transnet Port Terminals, ensuring efficient connectivity of the country’s economy with trading partners [35,36]. Climate change poses potential impacts on these ports, such as rising atmospheric and water temperatures, strong winds, high waves, rising sea levels and heavy rainfall [35]. Port congestion, which leads to supply chain delays, is driven by adverse weather affecting ship and cargo operations, accidents (including strikes), sudden trade demand surges and land-side transport congestion [33]. South African container terminals are located at the Ports of Cape Town, Port Elizabeth, Ngqura and Durban (see Figure 1).
The Western Cape is responsible for almost 80% of all South African fruit exports. In 2022, exports of 4.2 million tons (or nearly 70%) were shipped from the Port of Cape Town. Durban and Port Elizabeth are the other larger export cities, both shipping just under 10% this year [37].
In their 2021 study, Dube et al. examined flood trends and their impact in the Western Cape over the past 120 years. They found that regions of Cape Town (the 10th most populous city in Africa) are frequently subjected to the detrimental effects of floods. The infrastructure, including railway lines, parking lanes, roads and the power supply and communication systems, are often severely impacted [38].
Fears are mounting that the impacts of these floods could exacerbate due to the rise in sea levels induced by climate change, affecting the city and its surrounding areas [20,38]. There is growing concern about the increased frequency and impact of the El Niño–Southern Oscillation in the Southern Hemisphere. Dube et al. [38] predict that this will likely result in a surge of coastal flooding incidents. Indeed, over the past four decades, flood occurrences have significantly increased compared to earlier periods [38]. Figure 2 shows the statistically significant rise in flood events in the Western Cape during their study period.
In addition, adverse weather conditions and powerful winds result in significant delays at the Port of Cape Town, and extreme weather conditions account for approximately 15% of the lost time at the Port of Cape Town [34,39,40]. Recent floods, including the 2022 event in Durban, have been attributed to climate change, resulting in significant operational impacts caused by heavy rainfall. In addition, these ports experience shutdowns of ship-to-shore (STS) gantries when wind speeds exceed 70 km/hour [40,41].
These impacts are not going unnoticed. In its 2020 evaluation, the World Bank ranked the Port of Cape Town notably low in the global container port performance index, obtaining 347th out of 351. The situation saw little improvement by 2022, with the port ranking 344 out of 348 [4,23]. This poor ranking is attributed to ongoing congestion issues at the port caused by outdated infrastructure and equipment, a lack of adequate staff and weather-related disruptions [4].
Climate change’s impacts are being felt with increasing severity, particularly in developing countries, such as South Africa [42]. These nations typically lack the necessary resources and infrastructure to effectively adapt to these changes, often resulting in poor responses [38]. Studies forecast increased wind velocity around the Southern African Coast throughout the year due to climate change [43]. In addition, there is a noticeable increase in the frequency and intensity of extreme weather events reported in South Africa by multiple authors [38,44,45].
In summary, South African ports face weather-related risks, resulting in congestion and disruptions in the supply chain. Extreme weather events and higher wind velocities create challenges for maintaining efficient port operations. Moreover, the frequency and intensity of these events are projected to increase, raising concerns about their potential future impact on fresh fruit exports and overall long-term food safety and security.
2.3. Maritime Supply Chain Risk Management
In his 1999 paper on ‘Principles of food safety Risk management’, Jùrgen Schlundt emphasised the significance of risk management in ensuring food system safety. His steps align with the general process for managing supply chain risks, including risk identification, assessment, mitigation and monitoring/review [46,47,48]. Guerin [24] further highlights the importance for organisations to understand and effectively engage with these risks by allocating capital toward risk mitigation. This was echoed by Robertson et al. [21] in their holistic risk management perspectives for food safety. The general mechanisms for risk mitigation encompass prevention, reduction (training and education), risk transfer (insurance) and bearing the risk internally by the company itself [49].
Marine cargo insurance is a commonly used method for transferring risk, providing coverage for the physical loss or damage of goods during transportation and storage [50]. Risk managers gain valuable bottom-up insights into risk management by examining marine cargo insurance claims [3]. In their paper on data-driven analytics for cargo loss, Wu et al. [51] presented a ‘business analytics for cargo loss severity’ framework, which was incorporated and adapted into the conceptual framework for this research in Section 3.
As ports play a crucial role in the global distribution of goods (as evidenced in Section 2.2), it is essential to analyse potential risks in the maritime transportation process. Therefore, Blecker and Kersten [49] developed a layer model for maritime transportation risk management to integrate risk management procedures into maritime logistics networks. This model focuses on risk identification and evaluation, comprising four layers, and forms the theoretical foundation of this research (see Figure 3).
The layers are described as follows:
- Layer 1. Disruptive factors: This layer identifies and defines the events that initiate a chain of events, which can be internal (known and prepared for) or external (a combination of known and prepared for and known and unprepared for).
- Layer 2. Processes: Relevant processes related to the system being analysed are listed in this layer, acting as a link between Layers 1 and 3.
- Layer 3. Basic events: This layer lists non-redundant events, and the occurrence probability is determined by assessing the processes in Layer 2, as defined through the interactions between Layers 1 and 2.
- Layer 4. Consequences: This user-defined layer includes monetary and non-monetary quantifiers to assess the impact of the identified events.
This section developed the theoretical background for the risk associated with food safety and security along with the expected future increase in climate change events.
3. Methodology
In 2019, the World Health Organization (WHO) emphasised the importance of obtaining precise quantitative estimates regarding the potential effects of climate change on food safety [25]. They stressed the urgent need for action to minimise predictable hazards.
To respond to these concerns, this research uses the theoretical perspectives from Section 2.3 to investigate marine cargo insurance claims for fruit damage. It focuses on research questions in Table 1, aiming to enhance understanding of distribution factors damaging South African fruit exports and related food safety risk management.
To address the research questions, the authors meticulously studied historical claims data from two major marine insurance companies in South Africa. These companies combined represent approximately 35% of the non-life insurance market and are among the country’s top five marine insurance companies. The authors utilised a consolidated, desensitised, original dataset containing 17,727 unique claims over ten years from 1 January 2013 to 31 December 2022. This set of data served as a basis for the analysis.
Datasets included the following information: (1) the date of loss and (2) the description of the loss. The description field’s variations (being in an open-text format that allowed free-text descriptions for each claim) led to the use of a keyword analysis formula on the dataset. During the pre-processing phase, a range of keywords such as weather, rain, hail, wind, storm, water, flood, delay, damage, temperature, variation and deterioration were searched. However, due to limited results from certain keywords, the list was refined to: delay, damage and temperature. The keywords with few results were categorised under ‘damage’. The subsequent analysis aimed to extract two primary details from the claim descriptions in the dataset: (1) the type of damage and (2) the type of fruit damaged in each claim.
After collecting and organising this data, a master dataset was created as the foundation for analysing the research questions. It consisted of 441 unique damage claims related to fruit. A sample post-processed master dataset is provided in Table 2, and Table 3 shows the ratio of fruit damage claims to overall claims. This trend is further examined in Section 4.
This study’s conceptual framework, illustrated in Figure 4, was developed using the discussion from Section 2.3. This framework guided the analysis and interpretation of the findings.
The master dataset was analysed using Excel® to address research questions 1, 2 and 3. For research question 4, which focuses on forecasting future damages, assistance was provided by Stellenbosch University’s Centre for Statistical Consultation, employing Statistica 14.
4. Analysis and Results
This section presents the analysis and results corresponding to each research question in Table 1, Section 3.
4.1. Research Question 1—What Type of Distribution Damage Affected Fruit over the Period under Investigation?
This section examines the variations in fruit damage during transport, essential for devising strategies to mitigate harm and boost supply chain efficacy and food safety. Mitigating physical damage, proven by Rolfe and Daryaei [53] to also diminish contaminant exposure, extends shelf life and underscores the need for meticulous handling and cold chain maintenance to deliver fruit in peak condition to consumers.
To analyse research question 1, the master dataset was filtered and categorised into three main groups: damage, delay and temperature. Each claim was examined using keyword filters to determine the best-fitting group. In cases where a more specific description was unavailable, the claim was assigned to the damage group by default. Due to the nature of agricultural practices, output volumes can vary from season to season or due to orchard renewal programs. To ensure validity of the research outcomes, some compensation for large-scale volume fluctuations should be included. To normalise for volume changes over the years, each year’s total fruit export volume was indexed to the volume of the base year, 2013. The percentages indicated are calculated using the annual number of claims per category divided by the total claims for that category and then adjusted using the normalisation factor. This indicates the distribution of claims across the years examined. The results of this analysis are presented in Table 4 as a heat map, and visual representations can be found in Figure 5.
Focusing on damage-related claims, which fluctuated throughout the years, these claims notably exceeded the average of the category in 2018 (10%), 2019 (21%), 2020 (10%) and 2022 (10%), which indicates a changing situation. The sharp surge in 2019 could reflect particular challenges faced in transportation mechanisms or quality controls during that year. Subsequent years, while showing a decline from the peak, remained high, indicating that challenges with damage persisted.
The delay category started at 4% in 2013, considerably below the average. However, from 2018 onwards, every year exceeded the average, culminating in a significant peak of 19% in 2022. This consistent rise over the latter part of the decade might point to recent challenges in transportation logistics or increased sensitivity in detecting and reporting delays.
Temperature-related claims experienced an irregular pattern. Years that experienced notable increases include 2017 (13%), 2019 (16%), 2020 (12%), 2021 (11%) and 2022 (9%). The pronounced fluctuations may hint at periodic challenges with maintaining the cold chain’s temperature, possibly due to changes in the temperature control equipment (or related challenges), transportation routes, or handling practices during these years.
During the study period, fruit distribution damage trends raised concerns. The heatmap visually confirms significant changes post-2016, with persistently high figures suggesting continued fruit damage problems. However, it is essential to consider additional factors, such as the impact of weather conditions in specific years and any other potential factors that could influence the number of claims in a particular year. Rolfe et al. [53] emphasised that such damages increase microbial growth risks, affecting food safety.
4.2. Research Question 2—Are Certain Types of Fruit More Vulnerable to Distribution Damage Than Others?
This section explores the varying susceptibilities of different fruits to damage (and potential spoilage). Recognising these vulnerabilities could enable farmers and cold chain operators to adapt their methods to minimise harm, leading to safer, fresher produce. Research by the Food and Agriculture Organization of the United Nations underscores the importance of understanding these specificities, as modifying practices accordingly can substantially reduce post-harvest losses and increase food safety [54].
The dataset was filtered and then categorised into the different fruit groups, as discussed in Section 3. Each claim was examined using keyword filters to determine the fruit group. In the few cases where more than one type of fruit was detected, the claim was assigned to the other fruit group by default. To again account for volume variations year-on-year, each fruit group’s export volumes were indexed to the base year, 2013. The percentages indicated in Table 5 and Figure 6 are calculated using the annual number of claims per fruit category divided by the total claims for that fruit category for the year and then adjusted through the normalisation factor. This indicates the distribution of claims across the analysed years.
The dataset, adjusted for volume increases, presents an insightful analysis of fruit damage claims between 2013 and 2022, categorised into citrus fruits, grapes, pome fruits, stone fruits and other fruits. Over this period, citrus fruits, which include varieties like clementines and oranges, had notable variations in the claim rate. The year 2019 was particularly concerning, registering a claim rate of 42%—far exceeding the average. Similarly, the claim percentages for 2017 and 2020 were above average. Over the past decade, grapes had a stable claim rate between 2013 and 2016. However, starting from 2018, there has been a steady increase in claims, culminating in 14% in 2021 and reaching a high of 21% in 2022. Pome fruits, mainly apples and pears, consistently surpassed the average between 2017 and 2020; the highest being 22% in 2018. Stone fruits like nectarines and peaches recorded elevated claims in 2014 and 2017 at 28% and 18%, respectively, which stood out. Lastly, the category of other fruits, encompassing litchis, mangos and pineapples witnessed higher-than-average claims in 2018 and 2020 at 12% and 31%, respectively. Please see Section 7 for suggested future work on this topic.
4.3. Research Question 3—Is There a Seasonal Pattern in Fruit Damage Claims?
Understanding seasonal patterns in fruit damage claims can reveal potential risk factors like handling, transportation and weather-related influences that affect food quality and safety during specific times of the year. Recent studies, such as the Food and Agriculture Organization’s 2021 report, emphasise recognising seasonal trends to optimise resources, mitigate risks and increase profits [55]. This section analyses the master dataset from 2013 to 2022, identifying key monthly seasonal patterns in fruit damage claims. It is important to note that the input data reflects the reported date of loss associated with the claim. This analysis aims to inform strategies and policies to enhance food safety and quality during high-risk seasons, contributing to the overall resilience of the agricultural sector.
The dataset is presented in Table 6, and a graphical representation in Figure 7. The percentages indicate the monthly proportion of fruit-related claims out of Company A + B’s total claims for that month. This highlights the monthly trends over the years in fruit claims development. The researchers would have preferred to normalise for total claims variations across all insurance companies to balance any long-term trends in other insurance markets; however, this data was not available to the researchers.
The dataset analysis reveals several key insights regarding seasonal patterns in fruit damage claims as a percentage of total claims for that month from the original dataset. The first notable observation is an increasing growth trend in damage claims over the years, most noticeably in January and February. This increase might indicate specific fruit type vulnerabilities, changes in handling, transportation, weather conditions impacting the freshness or quality of the produce, increased demand leading to quicker and potentially rougher shipping methods, variations in packaging materials or techniques, fluctuations in quality control measures or changes in regulations or standards.
Secondly, there are evident seasonal fluctuations throughout the years. June to September tends to have escalating claims, with substantial peaks observed in August and September across several years (e.g., 19.1% in August 2018 and 22.1% in September 2019). Equally, December to February initially saw relatively low claims, but a consistent increase is noticeable in later years, notably in February 2022 at 11.3%. March to May generally sees moderate damage claims, with minor variations year-on-year, suggesting a relatively stable situation in this period. A spike in claims was anticipated in April 2022 due to the Durban storms. However, two factors affected this: (1) As mentioned in Section 2.2, in 2022, 70% of fruit was exported via the Port of Cape Town, and (2) general storm damage claims in Durban would have largely overshadowed any fruit-related claims. A final important insight is the presence of sudden, significant fluctuations in certain months, such as August 2019 (19.1%) and September 2019 (22.1%). Interestingly, there are declines in certain months, specifically October and April, where the number of claims has reached zero in several instances.
4.4. Research Question 4—How Can Historical Damage Claims Data Be Used to Forecast Future Damage?
In food safety, accurate forecasting is a powerful tool for risk mitigation and, thus, the integrity of the cold chain. The potential to predict future damages allows for early interventions, preserving food quality and ensuring a continuous supply. The application of predictive modelling, using historical data as illustrated by a study by Rejeb et al. [56], effectively enhances food safety.
Two primary statistical techniques were explored to address the third research question of whether historical data can be employed to forecast future situations. Section 4.4.1 delves into using the seasonal autoregressive integrated moving average (SARIMA) model. Following this, Section 4.4.2 focuses on regression analysis, a different approach that provides additional insights into the relationships between the variables.
4.4.1. SARIMA Forecasting
To forecast monthly damage claims to fruit, one needs a model that can use time series data to forecast these potential liabilities. The model should be able to predict the volume of claims and consider the seasonal volatility inherent to the type of monthly claims. The seasonal autoregressive integrated moving average (SARIMA) model offers this solution.
This model is an extension of the ARIMA (autoregressive integrated moving average) model, which considers seasonality in the data, as evidenced in research question 3. SARIMA is particularly useful for time series data exhibiting trend and seasonality [58]. It can handle trends and seasonality, making it versatile for real-world time series data.
SARIMA has several components. The AR (autoregressive) component captures the relationship between an observation and its previous ones. The integrated (I) component involves differencing observations to make the time series stationary, ensuring consistent mean and variance. Differencing over a lag of 1 means subtracting the prior observation from the current one. The MA (moving average) component relates an observation to the residual error from a moving average model applied to past data. In addition, SARIMA has seasonal counterparts to these components: seasonal autoregressive (SAR), seasonal integrated (SI) and seasonal moving average (SMA), emphasising periodic patterns in the data and residuals.
To apply a SARIMA model, one needs to identify and then specify the order of each component (p, d, q) for the non-seasonal part and (P, D, Q, S) for the seasonal part, where:
- p: order of AR term.
- d: number of differencing required to make the series stationary.
- q: order of the MA term.
- P: seasonal order of the AR term.
- D: seasonal differencing.
- Q: seasonal order of the MA term.
- S: number of observations in each season.
The order of the data are the months in sequence and the analysis of damage prediction started with a data transformation phase. Due to the variance instability of the damage for prediction purposes (see Figure 8), a log transformation was applied, a commonly used method for stabilising variance and making the data more suitable for linear modelling (see Figure 9).
The rough regression on the monthly data summary suggested a decent level of predictability for the model with an R-Square value of 0.2384, meaning the regression model explains 23.84% of the variation in the data. The F-Statistic (F(1,118) = 36.944) and the corresponding p-value (p < 0.00000) demonstrated that our model is statistically significant.
Following the regression analysis, several diagnostic tests were performed to check the validity of the model assumptions. The normal probability plot of residuals suggested that the residuals can be assumed to be normally distributed according to the Shapiro–Wilk test with a p-value of 0.827. The p-value is much larger than the significance level of 0.05, suggesting no evidence to reject the null hypothesis that the residuals are normally distributed (see Figure 10).
The Durbin–Watson test showed a result of 1.086, indicating positive autocorrelation in the residuals, a conclusion echoed by a serial correlation estimate of 0.455, which shows that the residuals are seriously autocorrelated at lag 1. This, coupled with the Breusch–Pagan test pointing to heteroskedasticity with a p-value of 0.00, lends weight to the consideration of a model addressing these serial correlations. Both tests suggest SARIMA’s potential to address the observed concerns in the residuals.
The next step was to address zeros in the damage data. The transformation ln(Damage + 1) was used. Refer to the resultant plot of variables in Figure 11. To control for the non-stationary nature of the data, a first-difference transformation (where ‘d’ is substituted by the differencing order) was executed before performing the spectral analysis (see Figure 12). This transformation helped eliminate any potential trends in the data, which could have otherwise led to misleading results in the spectral analysis.
Moreover, the stationarity of the series was tested using the augmented Dickey–Fuller (ADF) test. For the original logarithmically transformed series, the ADF test statistic was −1.11 with a p-value of 0.26 at four lags without considering an intercept, failing to reject the null hypothesis of a unit root and indicating non-stationarity. Consequently, after applying first-differencing the ADF test yielded a test statistic of −9.12 with a significant p-value of 0.01 at three lags, allowing us to reject the null hypothesis and affirming that the differenced series is stationary and suitable for SARIMA modelling.
Autocorrelation (Figure 13) and partial autocorrelation plots (Figure 14) suggested seasonality. The periodogram analysis further affirmed this, which detected a 6-month seasonality, enhanced by Parzen weights for clarity (see Figure 15).
In light of the detected seasonality and serial correlation, a SARIMA model was fitted to the monthly data, specifically a SARIMA (1,1,1)(1,0,0)6 model. The model fit revealed a mean square residual of 0.47404. Each of the model’s parameters, p(1) and q(1), were statistically significant (see Table 7). While not statistically significant, the Ps(1) coefficient has a small p-value. This model is the best fit found for the monthly logged data.
Upon reflecting on potential outliers and their impact on the model, an intervention analysis was conducted considering a possible outlying observation at time 82 as a spike in the data or abrupt, temporary intervention. Despite the discernible presence of this spike, the intervention analysis demonstrated it to be non-significant, thereby not necessitating an explicit model in the SARIMA context. Consequently, the forecasts derived from the SARIMA(1,1,1)x(1,0,0)6 model remain reliable and are not significantly affected by this non-significant intervention.
After the model fit, the residuals were analysed by inspecting their autocorrelation function (Figure 16) and partial autocorrelation function (Figure 17). The Ljung–Box–Pierce portmanteau Q-test on the residual autocorrelations and the tests on the partial autocorrelations indicate that the residuals can be assumed to be white noise.
Finally, the SARIMA model was used to forecast ‘Damage’ for the next two years (see Figure 18). These forecasts provide insights into future patterns and help with planning and decision making.
The model predicts damage values, captured in the ‘FORC DAMAGE’ column (see Table 8), ranging approximately from 3.87 to 4.72 over the forecast period (cases 121 to 144). This provides a forecasted range of potential damage magnitudes that can be expected. The damage values in ‘FORC DAMAGE’ are calculated using X = exp(Y) − 1, where Y is the ln(DAMAGE + 1). This transformation helps in interpreting the forecasts in their original scale.
To check the forecasting accuracy of the SARIMA model, the data was cut-off at time point t = 108 (December 2021) and the same model fitted to the shorter series. The last twelve months is then forecasted. The forecasted ln(DAMAGE + 1) series until t = 120 yield a MAE of 0.9233, an RMSE of 0.7687 and a MAPE of 47.47%, indicating reasonable average accuracy, control over prediction errors and a robust initial framework, respectively. This groundwork provides substantial potential for enhancing predictive accuracy in future research and iterations of fruit damage forecasting.
In summary, the SARIMA model predicts a consistent uptrend in damage over the forecasted cases with slight fluctuations. The transformed ‘FORC DAMAGE’ values provide monthly actionable forecasts that can be more directly used for planning and risk management regarding fruit damage claims.
4.4.2. Regression Analysis
Regression analysis is a powerful statistical method widely used in time-series datasets for forecasting [59]. In a time-series context, the goal is to analyse sequential data points, ordered by time, to identify underlying patterns or trends. Regression analysis models the relationship between a dependent variable (the variable to be predicted) and one or more independent variables (the predictors) that are believed to influence the dependent variable.
A linear regression analysis was conducted to investigate the relationship between the year and the total number of fruit damage claims and provide insights into potential future damage claims. Figure 19 presents the scatterplot of fruit damage claims over ten years, and Table 9 the regression summary statistics.
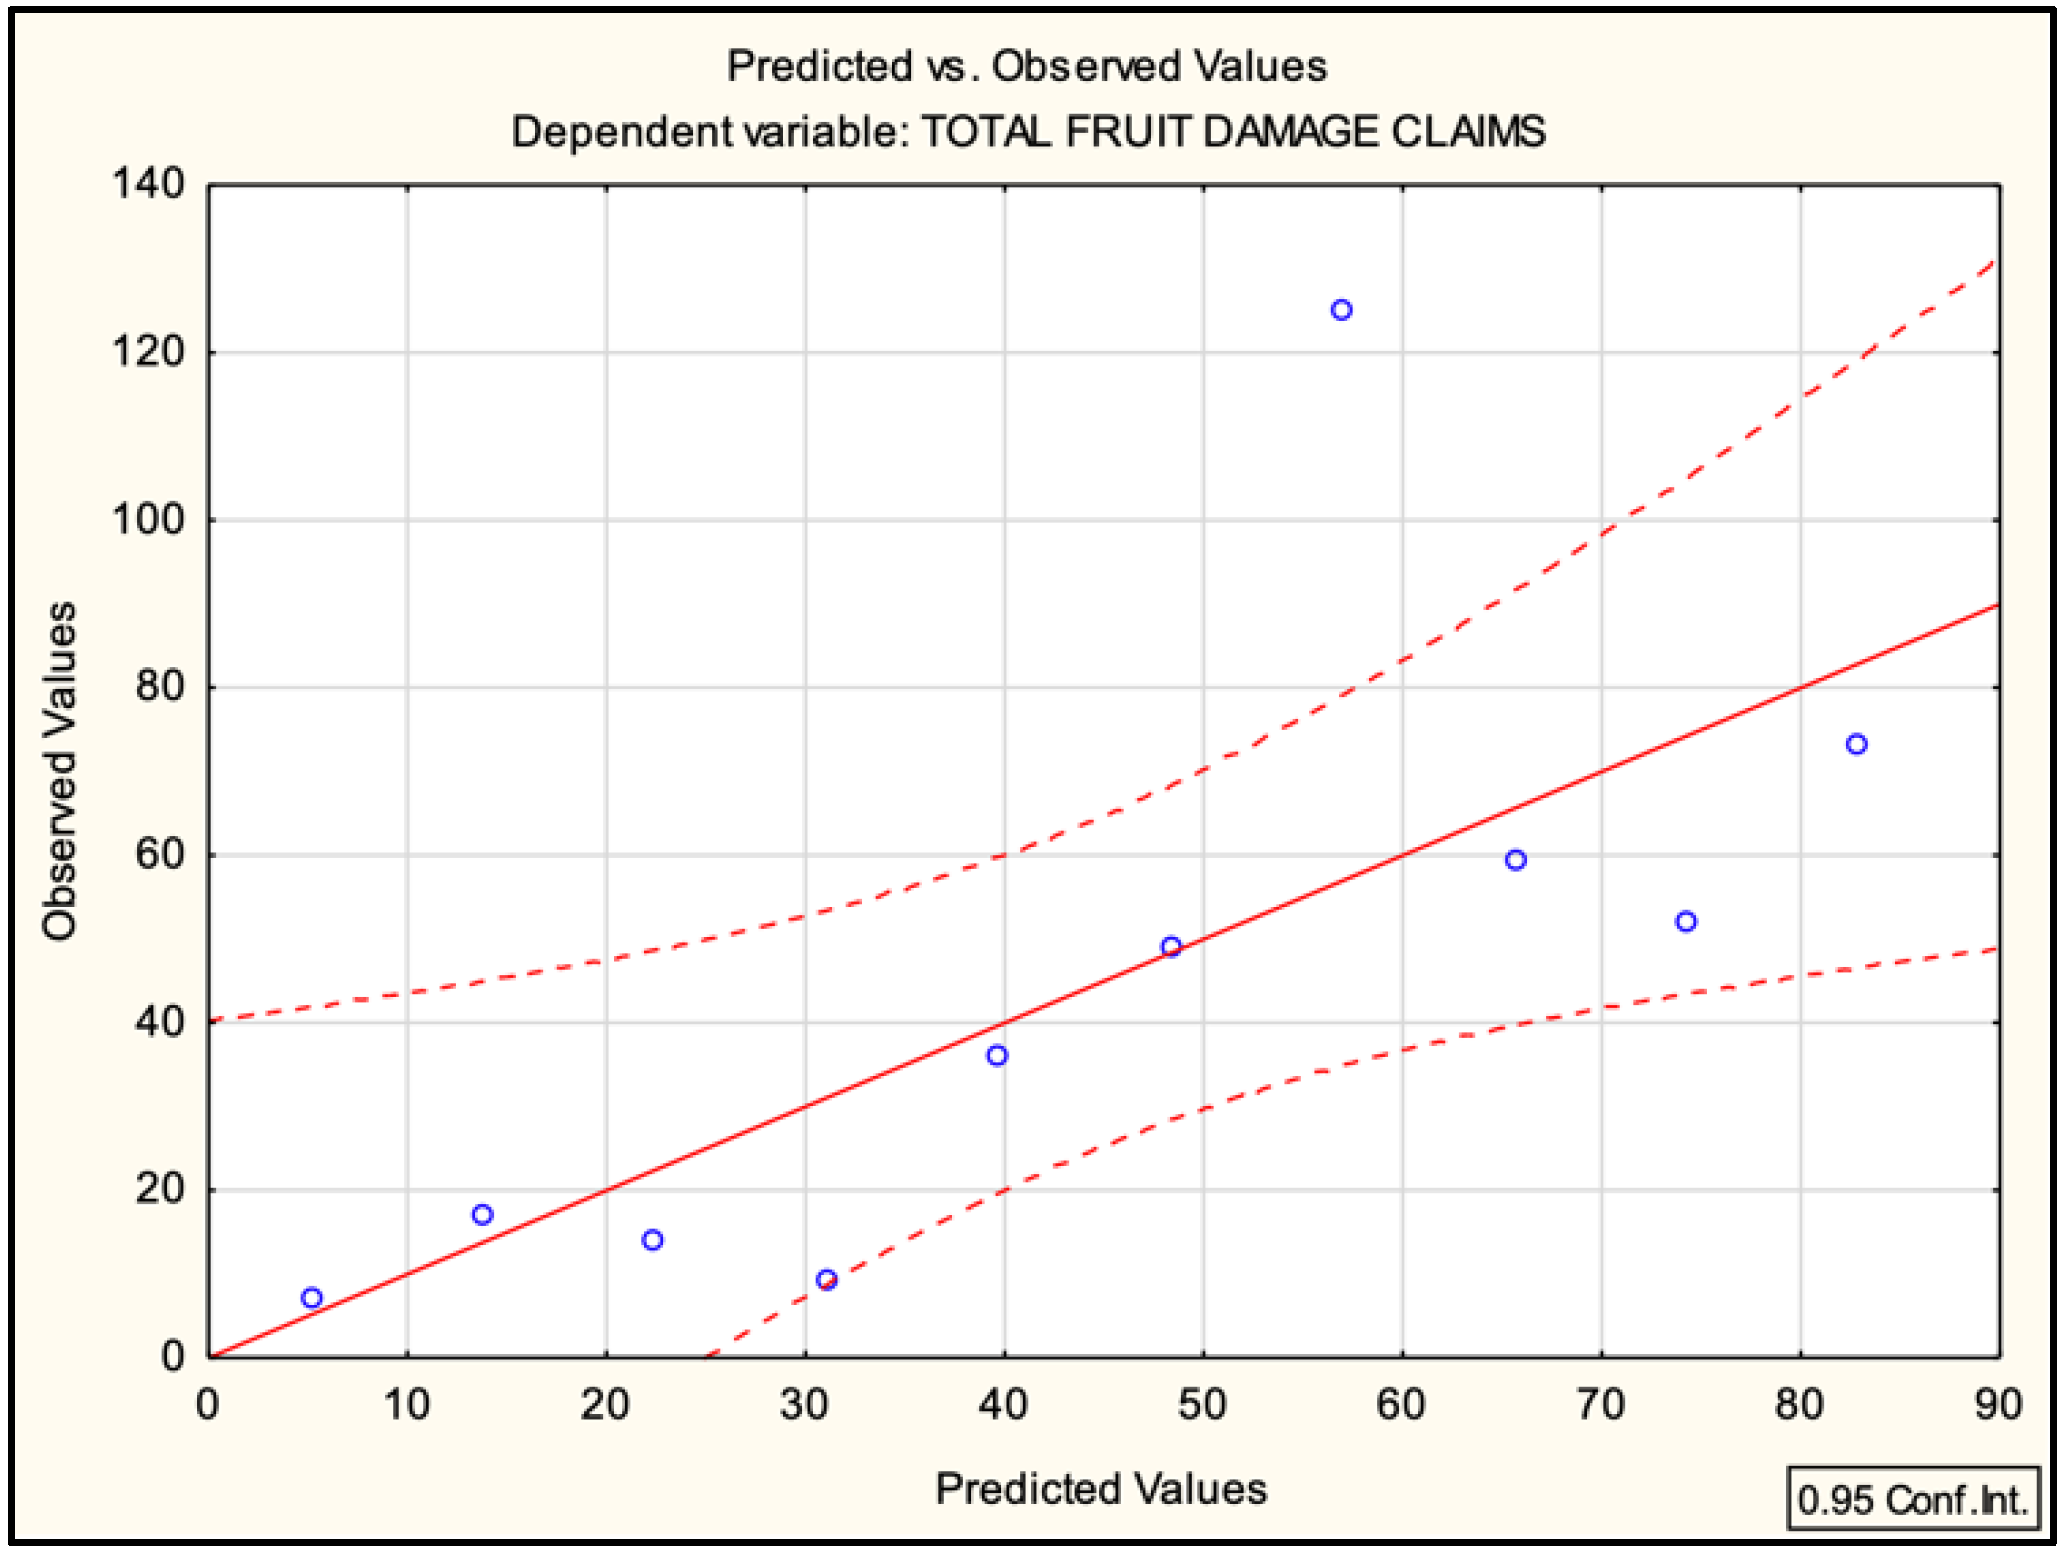
The regression model demonstrated a strong positive correlation (R = 0.716) between the year and the claims, accounting for 51.3% of the variability (R2 = 0.513). Statistically significant results (F(1,8) = 8.4157, p < 0.0199) support the validity of the relationship, indicating it is likely not a result of random chance. Figure 20 presents the predicted versus the observed values at a 0.95 confidence interval.
In practical terms, this translates to an average increase of 8.6364 units in fruit damage claims per year. Forecasted data are presented in Table 10. The standard error indicates the typical deviation from the regression line, and the confidence interval for the slope adds further assurance to these conclusions.
The model’s statistical significance at the 95% confidence level, coupled with a p-value of 0.0199, strongly suggests that the observed relationship is substantive and not due to random fluctuations. To ensure the reliability of these findings, tests were conducted to verify key assumptions of linear regression, such as the independence and constant variance of residuals. Specifically, the Durbin–Watson statistic (1.912180) found no significant autocorrelation and the Breusch–Pagan test (BP = 0.45, p = 0.50) detected no heteroskedasticity, validating the model’s robustness.
In conclusion, the insights from both SARIMA and regression, in line with the recommendations by Rejeb et al. [56], can be adeptly integrated into planning and risk management. This proactive approach aids in mitigating fruit damage claims, further enhancing food safety.
5. Discussion
Climate change’s impact on various global systems and industries constitutes a complex and pressing issue, with the South African fruit export supply chain and marine cargo insurance sectors facing significant challenges that affect food safety. This study examined these vulnerabilities through a unique risk-based perspective.
International research findings highlight that human activities have led to a rise of 1.1 °C in global temperatures since the pre-industrial era, with a marked escalation in the past decade. This warming severely affects South Africa’s economy, particularly its vital fruit export industry, which contributes over USD 3 billion annually and employs a significant portion of the workforce. Du Plessis et al. [3] revealed an alarming increase in weather-related cargo claims in South Africa, including extreme outlier years, indicating the marine cargo insurance industry’s vulnerabilities. Similarly, the International Union of Marine Insurance has reported a rising trend in such claims worldwide.
Discussions covered climate change, South African fruit exports, food safety and an analysis of marine insurance claims for fruit damage. Nearly half of the world’s ports lack strategies to mitigate climate change impacts, resulting in a highly vulnerable and low-resilience supply chain [7]. According to industry experts, South Africa experienced significant logistical challenges in 2019 due to a surge in fruit exports, with increased demands for cold storage and refrigerated trucks, further exacerbated by port congestion from extreme weather damage, labour slowdowns and container buildup, ultimately harming fruit quality, safety and sales (M Marais 2023, personal communication, 02 August) [4]. This aligns with the overall trend revealed in the analysis of fruit damage during distribution from 2013 to 2022, showing increased damage claims after normalising for volume, peaking at 21% in 2019. Concurrently, the table grape industry was recovering from the 2018–19 drought’s impact on quality, which saw increased damage claims (M Marais 2023, personal communication, 02 August). In South Africa, the agricultural sector is significantly impacted by climate variations, affecting crop yields, quality and food safety. The repercussions of climate change on food production, agricultural livelihoods and food security have emerged as top national policy concerns, with unstable conditions elevating risks of contamination and spoilage [55].
The complexities deepened further In 2022 when the EU made abrupt changes to the importation requirements for South African citrus, including mandatory cold treatment at short notice for implementation (M Marais 2023, personal communication, 02 August). This coincides with a spike in delay-related claims in 2022. In addition, the forecast for South Africa’s orange production in 2022–23 has been reduced by 1% to 1.63 million metric tons, reflecting weather-related damages and the varying impact of weather conditions on different regions (M Marais 2023, personal communication, 02 August) [37].
From 2017 to 2022, claims related to temperature showed significant deviations above the average, indicating that weather-related events could have affected the fruit export supply chain. This observation aligns with Du Plessis et al.’s [3] findings, which also reported a similar upward trend in weather-related marine cargo insurance claims during this timeframe. The findings emphasise the importance of properly handling and transporting fruit to minimise damage and enhance supply chain efficiency and food safety. These insights emphasise the vital interaction among weather conditions, logistical difficulties and regulatory alterations, accentuating the necessity for a supply chain that is both adaptive and resilient to particular weather conditions and shifting international standards. Consequently, recognising types of fruit damage during distribution enables the enhancement of strategies, amplifying supply chain efficiency and food safety. Fewer damages translate to a safer product for consumers.
The analysis of fruit damage from 2013 to 2022 categorised the claims into five key groups: citrus fruits (30% of total claims), grapes (29%), other fruits (27%), pome fruits (10%) and stone fruits (4%). Citrus fruits had the most significant portion due to a higher market volume. After normalising for volume, the trend was relatively moderate for most of the years except for 2019, which witnessed a significant surge. The damage rate for table grapes after normalising for volume has steadily increased over the years, especially from 2019 onwards, with a peak of 21% in 2022. The different fruit groups exhibited varied patterns, suggesting complex and multi-faceted influences on damage susceptibility. The dataset revealed intricate and varied trends in fruit damage claims across types and years, potentially reflecting factors from susceptibility variations to industry practices. Acknowledging the unique vulnerabilities of each fruit type is paramount, as validated by research from the Food and Agriculture Organization of the United Nations [55]. Understanding specific fruit vulnerabilities and adapting farming and handling methods can significantly reduce post-harvest losses, thereby minimising fruit damage and ensuring safe food products for consumers.
The analysis of fruit damage claims from 2013 to 2022 reveals key seasonal patterns that may inform risk mitigation and quality enhancement strategies. An increasing trend in fruit claims, relative to all claims, is noted, particularly in January and February, possibly reflecting changes in handling or transportation. There are apparent seasonal fluctuations, with June to September experiencing escalating fruit-related claims, peaking in August and September. December to February initially had low claims but showed consistent growth in later years, which coincides with the growth in table grape claims. The months of March to May maintained moderate and relatively stable levels. Sudden spikes were observed in particular months like August 2018 and September 2019, with corresponding declines in October and April over time. Some of these patterns align with Cape Town’s winter storms from June to August due to cold fronts and low-pressure systems and the area’s intense wind conditions that persist for days during the summer months (December to February) [34]. By accurately allocating resources during perilous seasons and potentially devising season-specific fruit handling, storage and transport guidelines, stakeholders can optimise operations and mitigate risks, with these findings proffering a crucial comprehension of the seasonal dynamics in fruit damage claims, thereby fortifying the agricultural sector’s resilience and enhancing overall food safety.
In the forecasted cases 121 to 144, the SARIMA model predicts values between approximately 3.87 to 4.72 per month, a notable uptrend. Concurrently, the linear regression analysis revealed a strong positive correlation between years and total fruit damage claims and predicted a statistically significant increase of 8.6 units in claims annually. Both the SARIMA and regression models indicate an ascending trend in damage claims. These insights can be effectively harnessed for improved planning and risk management. This proactive stance can help mitigate fruit damage claims, enhancing food safety.
Our findings emphasise the urgent need for targeted policies, preventive strategies and comprehensive investigation into the underlying causes to minimise future damage claims. Attention must be directed towards developing resilience strategies in the maritime supply chain and implementing risk management practices to ensure the continued success and safety of South Africa’s fruit export industry in the face of escalating weather-related challenges.
6. Conclusions
Our marine insurance claims data analysis reveals an uptrend in fruit damage reports over the past decade. While our dataset does not enable a direct linkage in every instance of this growth to particular causes, owing to limitations in the description of claims, it is noteworthy that this trend correlates with the period of escalated climate change impact, as documented in various studies [1,38,60] and the troubling rise in weather-related cargo insurance claims in South Africa, as detailed by Du Plessis et al. [3].
Global climate change has been associated with increased temperatures and unpredictable weather patterns, which can harm fruit quality during farming operations, transportation and storage, directly affecting food safety [53]. Furthermore, there are reports of increased port operation disruptions due to extreme weather events, which could potentially affect the handling and storage of perishable goods [20,31,33,34,38].
While climate change presents a compelling potential explanation for the observed increase in fruit damage claims, we acknowledge that other contributing factors could also be at play. These might include changes in agricultural practices, new fruit varieties more prone to damage or even changes in the insurance industry’s reporting or claim assessment practices. Therefore, further research is necessary, using more detailed datasets, to isolate the specific factors contributing to this trend.
This study underscores the necessity of a comprehensive approach to managing risks in the fruit supply chain, which may increasingly need to include mitigation and adaptation strategies for climate change. Such measures are paramount to ensuring food safety and maintaining a consistent, quality food supply.
7. Future Work
Based on the extensive findings concerning the interplay between climate change, South African fruit exports, marine cargo insurance and food safety, there is a pressing need for targeted future work to reduce fruit damage and enhance food safety. The key areas to explore and the corresponding actions include:
- Investigating climate change impact: The observed 1.1 °C increase in global temperatures and its effects on weather-related cargo claims calls for in-depth studies to understand how climate change directly affects fruit damage. This includes assessing extreme weather events, temperature fluctuations and their impacts on transportation, handling and storage. Collaboration with meteorological agencies and climate experts will enable more accurate predictions and adaptive strategies.
- Developing resilience strategies in maritime supply chains: Nearly half the world’s ports lack climate change mitigation strategies. Research must be directed towards innovative solutions and technologies that bolster port and transportation resilience against extreme weather events. This involves creating guidelines, tools and risk management practices applicable globally and then tailored to specific regions.
- Analysing fruit categories and damage susceptibility: The categorisation of damage claims across different fruit types highlights the need for tailored preventive measures. Further investigations into each fruit category’s specific vulnerabilities, market volume and handling practices can lead to targeted strategies to minimise future damage.
- Enhancing data collection and forecasting models: SARIMA and regression models predicted an upward trend in claims. Future work must focus on continuous data collection and annual updates to enhance accuracy and insights for insurers and the supply chain sectors. In addition, the quality and level of detail included in the claim descriptions should be addressed.
- Evaluating handling and transportation practices: The detailed analysis of fruit damage claims has shown clear patterns and seasonal fluctuations. Future work should conduct audits and on-site evaluations of handling and transportation practices to identify areas for improvement, implement best practices and use new technologies to enhance supply chain efficiency and food safety.
- Interdisciplinary research to isolate contributing factors: The complex interplay between climate change events, agricultural practices, fruit varieties and insurance practices requires an interdisciplinary approach. Engaging experts across fields will allow for a nuanced understanding of the contributing factors and the development of comprehensive solutions.
- Applying FAR models to supply chain management: Investigate the utility of Functional AutoRegressive (FAR) models, proven effective in short-term traffic flow forecasting [61], for predictive management in fruit export logistics. Focus on leveraging FAR models to anticipate maritime transport conditions, optimise logistics and enhance decision making across the supply chain, with an eye toward reducing climate-related damage of exported fruits.
In conclusion, the significant uptrend in fruit damage reports over the past decade, correlated with escalated climate change impacts, demands a multi-faceted and proactive approach. The above future work suggestions aim to foster a comprehensive and targeted response to this complex issue, safeguarding South Africa’s vital fruit export industry and contributing to the global goals of food safety and climate resilience.
Author Contributions
F.d.P.: Conceptualisation, Methodology, Validation, Formal Analysis, Investigation, Writing—Original Draft, Visualisation. L.L.G.-G.: Validation, Writing—Review and Editing, Supervision. J.v.E.: Validation, Writing—Review and Editing, Supervision. All authors have read and agreed to the published version of the manuscript.
Funding
This research received no external funding.
Institutional Review Board Statement
Ethical clearance to conduct the research was obtained from the University of Stellenbosch, Social, Behavioural and Education Research Ethics Committee (project ID 24735).
Informed Consent Statement
Not applicable.
Data Availability Statement
Data sharing does not apply to this article.
Acknowledgments
We would like to thank D Nel from the Centre for Statistical Analysis at Stellenbosch University for his assistance with the statistical analysis; Company A + B kindly shared their data for analysis; M Marais for her invaluable insights and expertise that greatly enriched our research.
Conflicts of Interest
The authors declare no conflict of interest.
References
- IPCC. AR6 Synthesis Report: Summary for Policymakers; Intergovernmental Panel on Climate Change: Geneva, Switzerland, 2023; Available online: https://www.ipcc.ch/report/sixth-assessment-report-cycle/ (accessed on 21 August 2023).
- Zembe, A.; Nemakonde, L.D.; Chipangura, P. A Policy Coherence Framework for Food Security, Climate Change Adaptation and Disaster Risk Reduction in South Africa. SSRN Electron. J. 2022, 95, 103877. [Google Scholar] [CrossRef]
- Du Plessis, F.; Goedhals-Gerber, L.; van Eeden, J. Trends in weather-related marine cargo insurance claims: A South African perspective. J. Transp. Supply Chain. Manag. 2023, 17, 12. [Google Scholar] [CrossRef]
- Fresh Fruit Portal. World Bank Report Ranks South African Ports at Bottom of the List; Fresh Fruit Portal: Santiago, Chile, 2021; Volume 27, pp. 1–7. Available online: https://www.freshfruitportal.com/news/2021/05/26/world-bank-report-ranks-south-african-ports-at-bottom-of-the-list/ (accessed on 21 August 2023).
- Goedhals-Gerber, L.L.; Khumalo, G. Identifying temperature breaks in the export cold chain of navel oranges: A Western Cape case. Food Control 2020, 110, 107013. [Google Scholar] [CrossRef]
- Goedhals-Gerber, L.L.; Haasbroek, L.; Freiboth, H.; Van Dyk, F.E. An analysis of the influence of logistics activities on the export cold chain of temperature sensitive fruit through the Port of Cape Town. J. Transp. Supply Chain. Manag. 2015, 9, a201. [Google Scholar] [CrossRef]
- Asariotis, R.; Benamara, H.; Mohos Naray, V. Port Industry Survey on Climate Change Impacts and Adaptation; UNCTAD: Geneva, Switzerland, 2018. [Google Scholar] [CrossRef]
- Becker, A.; Inoue, S.; Fischer, M.; Schwegler, B. Climate Change Impacts on International Seaports: Knowledge, Perceptions, and Planning Efforts among Port Administrators. Clim. Change 2012, 110, 5–29. [Google Scholar] [CrossRef]
- Lee, B.; Preston, F.; Gemma, G. Preparing for High-Impact, Low-Probability Events: Lessons from Eyjafjallajökull; Chatham House: London, UK, 2012; ISBN 978 1 86203 253 8. [Google Scholar]
- Goedhals-Gerber, L.L.; Fedeli, S.; van Dyk, F.E. Identifying temperature breaks in pome fruit export cold chains from South Africa to the Netherlands: A Western Cape case. J. Transp. Supply Chain. Manag. 2021, 15, a626. [Google Scholar] [CrossRef]
- Goedhals-Gerber, L.L.; Stander, C.; Van Dyk, F.E. Maintaining cold chain integrity: Temperature breaks within fruit reefer containers in the Cape Town Container Terminal. S. Afr. Bus. Rev. 2017, 21, 362–384. [Google Scholar]
- van Lin, M.; van den Bos, A.; Sterras, N. The Current State of Fruit & Vegetable Agro-Processing in South Africa. 2018. Available online: https://www.agroberichtenbuitenland.nl/documenten/rapporten/2019/01/07/the-current-state-of-fruit--vegetable-agro-processing-in-south-africa (accessed on 21 August 2023).
- SA Fruit Journal. Fruit Journal. 2020. Available online: https://www.safj.co.za/wp-content/uploads/2020/03/sa-fruit-journal-april-may-2020-web.pdf (accessed on 1 March 2023).
- Van Dyk, F.; Maspero, E. An analysis of the South African fruit logistics infrastructure. ORiON 2004, 20, 55–72. [Google Scholar] [CrossRef]
- DAFF. Economic Review of the South African Agriculture 2018/2019; Department of Agriculture, Fisheries and Forestry: Pretoria, South Africa, 2019.
- DALRRD. Fresh Food Trade SA. 2020. Available online: https://www.daff.gov.za/doaDev/sideMenu/internationalTrade/docs/tradeFacilitation/Fresh%20Food%20Trade%20SA%202020.pdf (accessed on 1 May 2020).
- Mercier, S.; Villeneuve, S.; Mondor, M.; Uysal, I. Time–Temperature Management Along the Food Cold Chain: A Review of Recent Developments. Compr. Rev. Food Sci. Food Saf. 2017, 16, 647–667. [Google Scholar] [CrossRef]
- du Plessis, M.; van Eeden, J.; Goedhals-Gerber, L. Carbon mapping frameworks for the distribution of fresh fruit: A systematic review. Glob. Food Secur. 2022, 32, 100607. [Google Scholar] [CrossRef]
- Khumalo, G.; Goedhals-Gerber, L.L.; Cronje, P.; Berry, T. The non-conformance of in-transit citrus container shipments to cold protocol markets: A systematic literature review. Food Control. 2021, 125, 107947. [Google Scholar] [CrossRef]
- Mutumbo, K.N.P. The Maritime Commons: Digital Repository of the World A holistic risk-oriented framework for port infrastructure adaption to climate change. 2017. Available online: https://commons.wmu.se/phd_dissertations/13/ (accessed on 21 August 2023).
- Robertson, R.; Beaven, A.; Coolbear, T.; Hill, J.; Kirk, T.; McCullough, G.; Piper, M.; Venter, P. Multi-faceted and holistic risk management for business-critical food-safety events causing major disruption to both small and large businesses—An illustrative model. Food Control. 2022, 134, 108714. [Google Scholar] [CrossRef]
- World Bank. New World Bank Country Classifications by Income Level: 2022–2023. 2022. Available online: https://blogs.worldbank.org/opendata/new-world-bank-country-classifications-income-level-2022-2023 (accessed on 21 August 2023).
- World Bank Group. The Container Port Performance Index 2022: A Comparable Assessment of Performance Based on Vessel Time in Port; World Bank: Washington, DC, USA, 2023. [Google Scholar] [CrossRef]
- Guerin, T.F. Roles of company directors and the implications for governing for the emerging impacts of climate risks in the fresh food sector: A review. Food Control. 2022, 133, 108600. [Google Scholar] [CrossRef]
- WHO. Climate Change and Implications for Food Safety; Future of Food Safety; WHO: Addis Ababa, Ethiopia, 2019. [Google Scholar]
- Tirado, M.C.; Clarke, R.; Jaykus, L.A.; McQuatters-Gollop, A.; Frank, J.M. Climate change and food safety: A review. Food Res. Int. 2010, 43, 1745–1765. [Google Scholar] [CrossRef]
- Göransson, M.; Nilsson, F.; Jevinger, A. Temperature performance and food shelf-life accuracy in cold food supply chains—Insights from multiple field studies. Food Control. 2018, 86, 332–341. [Google Scholar] [CrossRef]
- Ndraha, N.; Hsiao, H.I.; Vlajic, J.; Yang, M.F.; Lin, H.T.V. Time-temperature abuse in the food cold chain: Review of issues, challenges, and recommendations. Food Control. 2018, 89, 12–21. [Google Scholar] [CrossRef]
- Hanson, S.; Nicholls, R.; Ranger, N.; Hallegatte, S.; Corfee-Morlot, J.; Herweijer, C.; Chateau, J. A Global Ranking of Port Cities with High Exposure to Climate Extremes. Clim. Change 2011, 104, 89–111. [Google Scholar] [CrossRef]
- Levenson, E. Hurricane Ida vs Hurricane Katrina: Here’s How the Two Major Storms Compare; CNN: Atlanta, GA, USA, 2021; pp. 1–9. Available online: https://edition.cnn.com/2021/08/30/us/hurricane-ida-katrina-new-orleans/index.html (accessed on 21 August 2023).
- Danladi, C. Evaluating the Impact of extreme weather-related events on port safety resilience: A case study of the African Continent. ResearchGate 2020. [Google Scholar] [CrossRef]
- Freight News. Survey Reveals Extent of Delays Facing Africa’s Shippers. 2014. Available online: https://www.freightnews.co.za/article/survey-reveals-extent-delays-facing-africas-shippers (accessed on 4 June 2020).
- Nze, I.C.; Onyemechi, C. Port congestion determinants and impacts on logistics and supply chain network of five African ports. J. Sustain. Dev. Transp. Logist. 2018, 3, 70–82. [Google Scholar] [CrossRef]
- Potgieter, L.; Goedhals-Gerber, L.L.; Havenga, J. Risk Profile of Weather and System-Related Port Congestion for the Cape Town Container Terminal. S. Afr. Bus. Rev. 2020, 24, 26. [Google Scholar] [CrossRef]
- Phelp, D.; Rossouw, M.; Theron, A. Potential Impacts of Climate Change on Southern African Ports and Coast; CSIR: Brussels, Belgium, 2013. [Google Scholar]
- Transnet Port Terminals. Port Terminals 2019; Transnet: Johannesburg, South Africa, 2019. [Google Scholar]
- Fresh Plaza. South Africa Exports More Fruit Again in 2022. 2022. Available online: https://www.freshplaza.com/europe/article/9486644/south-africa-exports-more-fruit-again-in-2022/ (accessed on 21 August 2023).
- Dube, K.; Nhamo, G.; Chikodzi, D. Flooding trends and their impacts on coastal communities of Western Cape Province, South Africa. Geo. J. 2022, 87, 453–468. [Google Scholar] [CrossRef] [PubMed]
- Rosario, I. How the Port of CT Could Avoid Weather-Related Delays. 2019. Available online: https://www.ftwonline.co.za/article/how-port-ct-could-avoid-weather-related-delays (accessed on 4 June 2020).
- Rosario, I. Congestion at Durban—A Technical Evaluation. 2020. Available online: https://www.freightnews.co.za/article/congestion-durban-technical-evaluation (accessed on 4 June 2020).
- The Guardian. After the Relentless Rain, South Africa Sounds the Alarm on the Climate Crisis. 2022, pp. 1–12. Available online: https://www.theguardian.com/world/2022/apr/24/south-africa-floods-rain-climate-crisis-extreme-weather (accessed on 21 August 2023).
- UNFCCC. Climate Change: Impacts, Vulnerabilities and Adaptation in Developing Countries; United Nations Framework Convention on Climate Change: New York, NY, USA, 2007; p. 68. [Google Scholar] [CrossRef]
- Rossouw, M.; Theron, A. Investigation of Potential Climate Change Impacts on Ports and Maritime Operations around the Southern African Coast; SATC: Pretoria, South Africa, 2009; pp. 183–191. [Google Scholar] [CrossRef]
- Mpungose, N. An Analysis of Extreme Weather Events over the 1981–2018 Period: A South African-Based Study. 2021. Available online: https://globalhistory.org.uk/2021/11/an-analysis-of-extreme-weather-events-over-the-1981-2018-period-a-south-african-based-study/ (accessed on 11 April 2023).
- Munzhedzi, S.; Khavhagali, V.; Midley, G.; de Abreu, P.; Scorgie, S.; Braun, M.; Abdul, Z. Climate Information and Early Warning Systems. 2016. Available online: https://www.dffe.gov.za/sites/default/files/reports/ltasbook2of7_climateinformationandearlywarningsystemsforsupportingtheDRR.pdf (accessed on 21 August 2023).
- Grant, D.B.; Wong, C.Y.; Trautrims, A. Sustainable Logistics and Supply Chain Management: Principles and Practices for Sustainable Operations and Management; Kogan Page Publishers: London, UK, 2017. [Google Scholar]
- Ho, W.; Zheng, T.; Yildiz, H.; Talluri, S. Supply chain risk management: A literature review. Int. J. Prod. Res. 2015, 53, 5031–5069. [Google Scholar] [CrossRef]
- Schlundt, J. Principles of food safety Risk management. Food Control. 1999, 10, 299–302. [Google Scholar] [CrossRef]
- Blecker, T.; Kersten, W. Managing Risks in Supply Chains: How to Build Reliable Collaboration in Logistics; Erich Schmidt Verlag GmbH & Co KG: Berlin, Germany, 2006; Volume 1. [Google Scholar]
- Vishwanath, K.S. Insuring Cargoes: A Practical Guide to the Law and Practice; Witherby Insurance: Livingston, UK, 2010. [Google Scholar]
- Wu, P.J.; Chen, M.C.; Tsau, C.K. The data-driven analytics for investigating cargo loss in logistics systems. Int. J. Phys. Distrib. Logist. Manag. 2017, 47, 68–83. [Google Scholar] [CrossRef]
- Green Mile. Logistics. 2018. Available online: https://www.greenmiletr.com/logistics/ (accessed on 25 February 2023).
- Rolfe, C.; Daryaei, H. Intrinsic and Extrinsic Factors Affecting Microbial Growth in Food Systems BT—Food Safety Engineering; Demirci, A., Feng, H., Krishnamurthy, K., Eds.; Springer International Publishing: Cham, Switzerland, 2020; pp. 3–24. [Google Scholar] [CrossRef]
- Food and Agriculture Organization of the United Nations. Research on the Measurement of Post-Harvest Losses; Food and Agriculture Organization of the United Nations: Quebec, QC, Canada, 2021. [Google Scholar] [CrossRef]
- Food and Agriculture Organization of the United Nations. The Impact of Disasters and Crises on Agriculture and Food Security: 2021; Food and Agriculture Organization of the United Nations: Quebec, QC, Canada, 2021. [Google Scholar] [CrossRef]
- Rejeb, A.; Keogh, J.G.; Rejeb, K. Big data in the food supply chain: A literature review. J. Data Inf. Manag. 2022, 4, 33–47. [Google Scholar] [CrossRef]
- SARS. Trade Statistics Data. 2023. Available online: https://tools.sars.gov.za/tradestatsportal/data_download.aspx (accessed on 15 August 2023).
- Holton Wilson, J.; Keting, B.; John Galt Solutions, Inc. Business Forecasting with ForecastX, 6th ed.; Mc Graw Hill: New York, NY, USA, 2008. [Google Scholar]
- Pervez, A.; Ali, I. Robust Regression Analysis in Analyzing Financial Performance of Public Sector Banks: A Case Study of India. Ann. Data Sci. 2022. [Google Scholar] [CrossRef]
- Kruger, A.C.; Sekele, S.S. Trends in extreme temperature indices in South Africa: 1962–2009. Int. J. Climatol. 2013, 33, 661–676. [Google Scholar] [CrossRef]
- Shah, I.; Muhammad, I.; Ali, S.; Ahmed, S.; Almazah, M.M.A.; Al-Rezami, A.Y. Forecasting Day-Ahead Traffic Flow Using Functional Time Series Approach. Mathematics 2022, 10, 4279. [Google Scholar] [CrossRef]
Figure 1.
South African container ports. Source: [36].
Figure 1.
South African container ports. Source: [36].

Figure 2.
Flooding events in the Western Cape province 1900–2018. Source: [38].
Figure 2.
Flooding events in the Western Cape province 1900–2018. Source: [38].
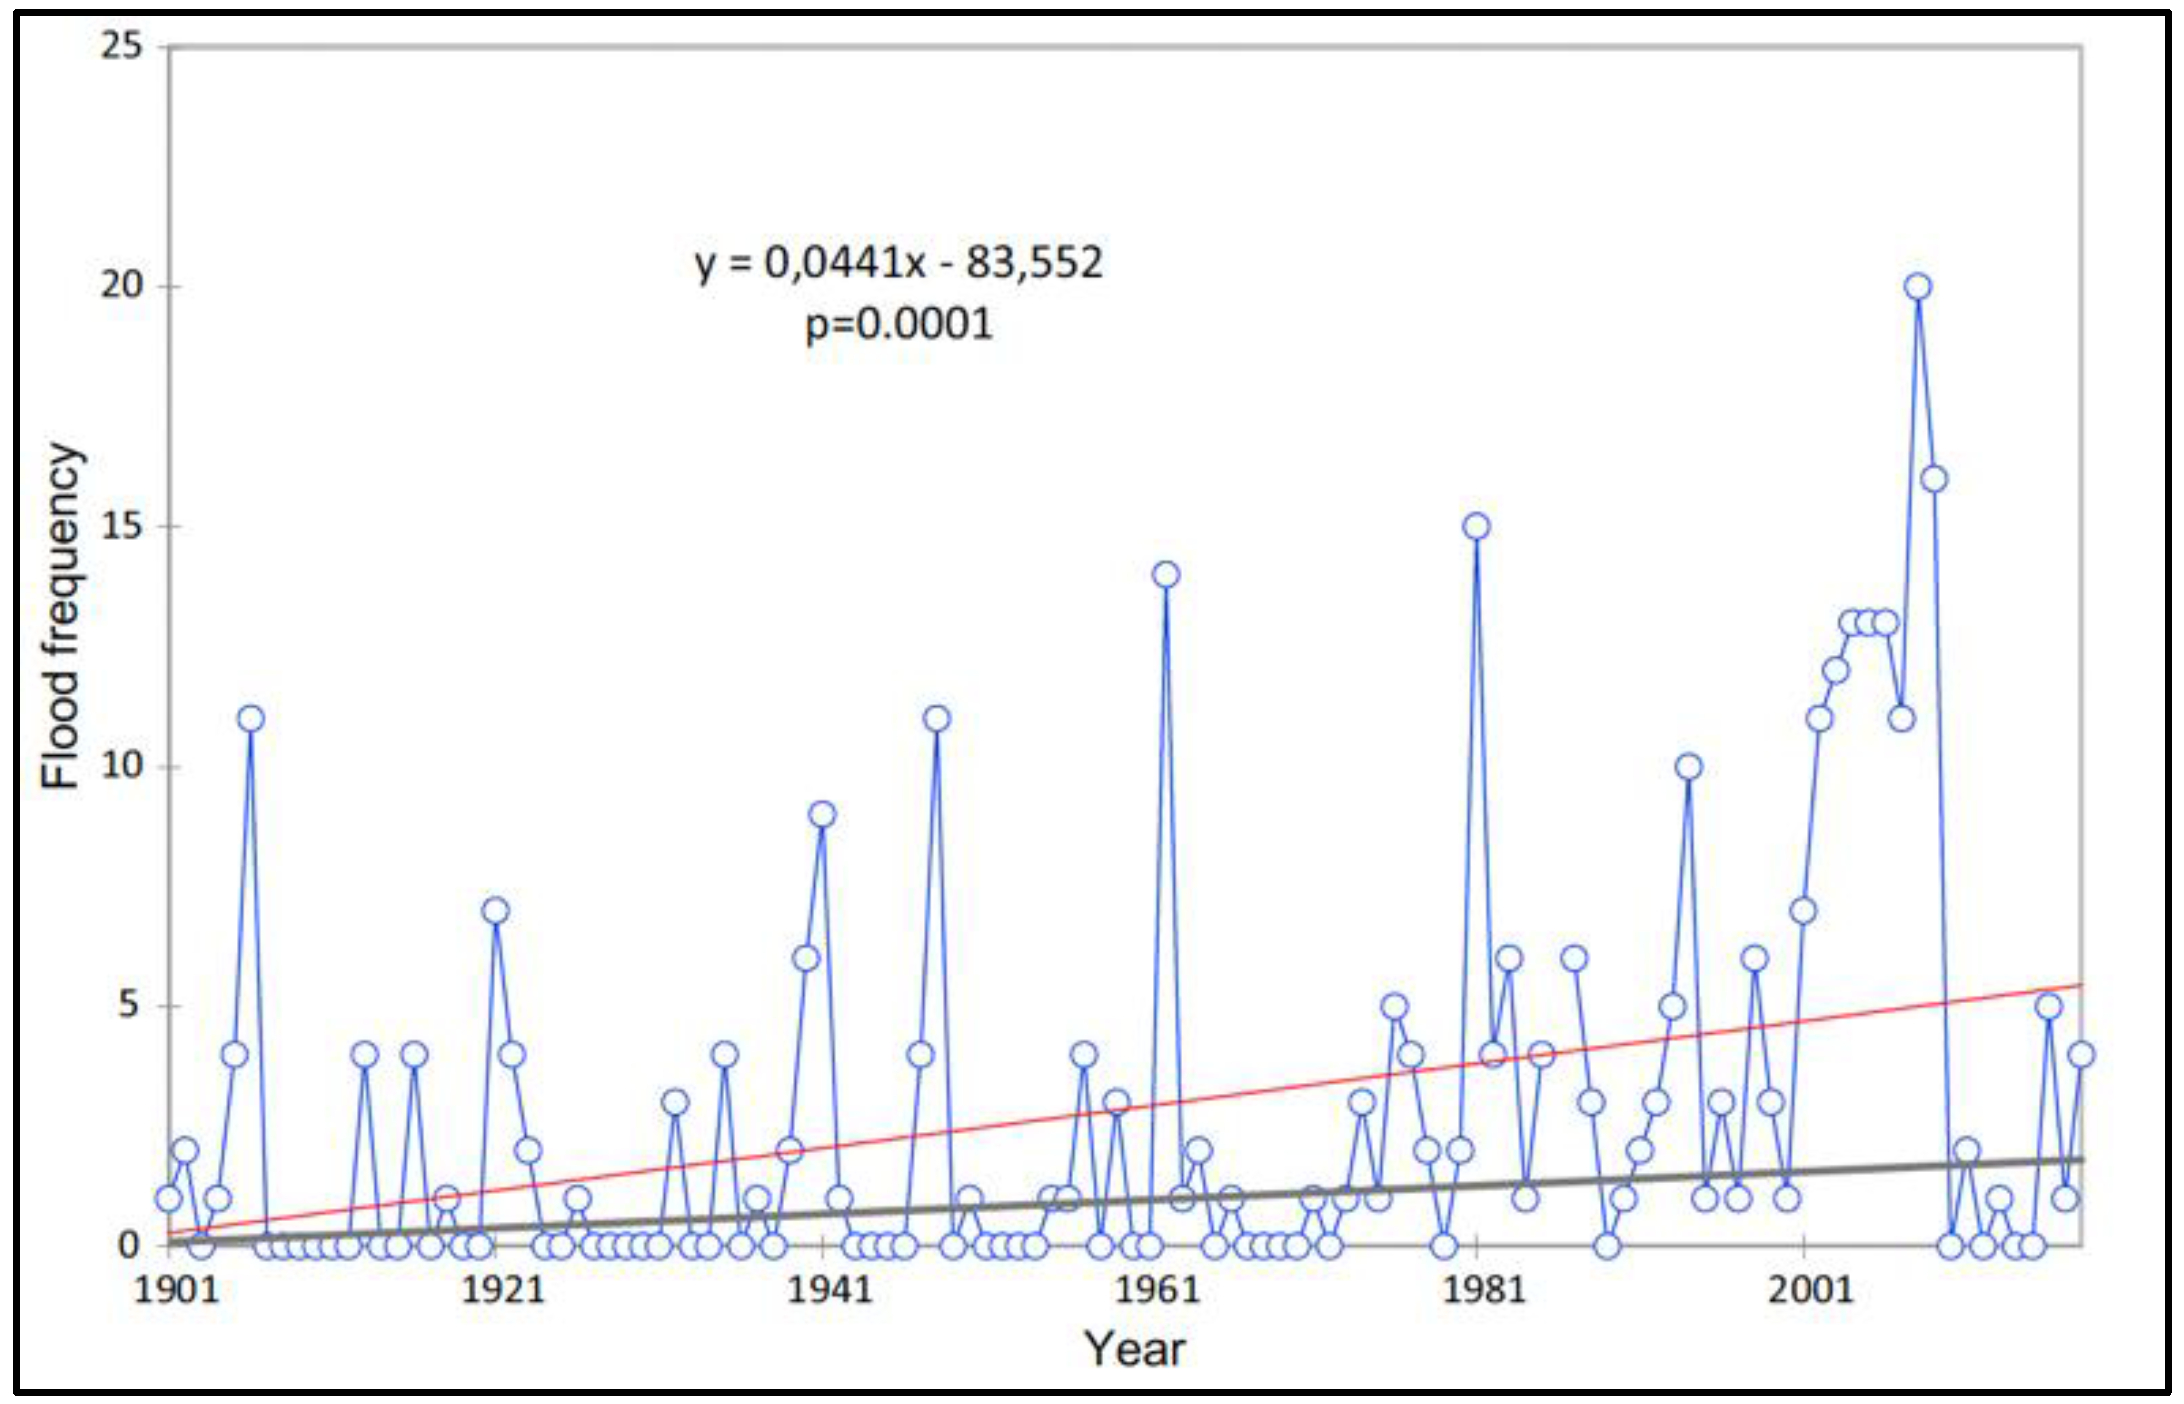

Figure 4.
Conceptual framework of the research. Source: Authors’ own creative. 1 [46,47,49], 2 [49], 3 [51].
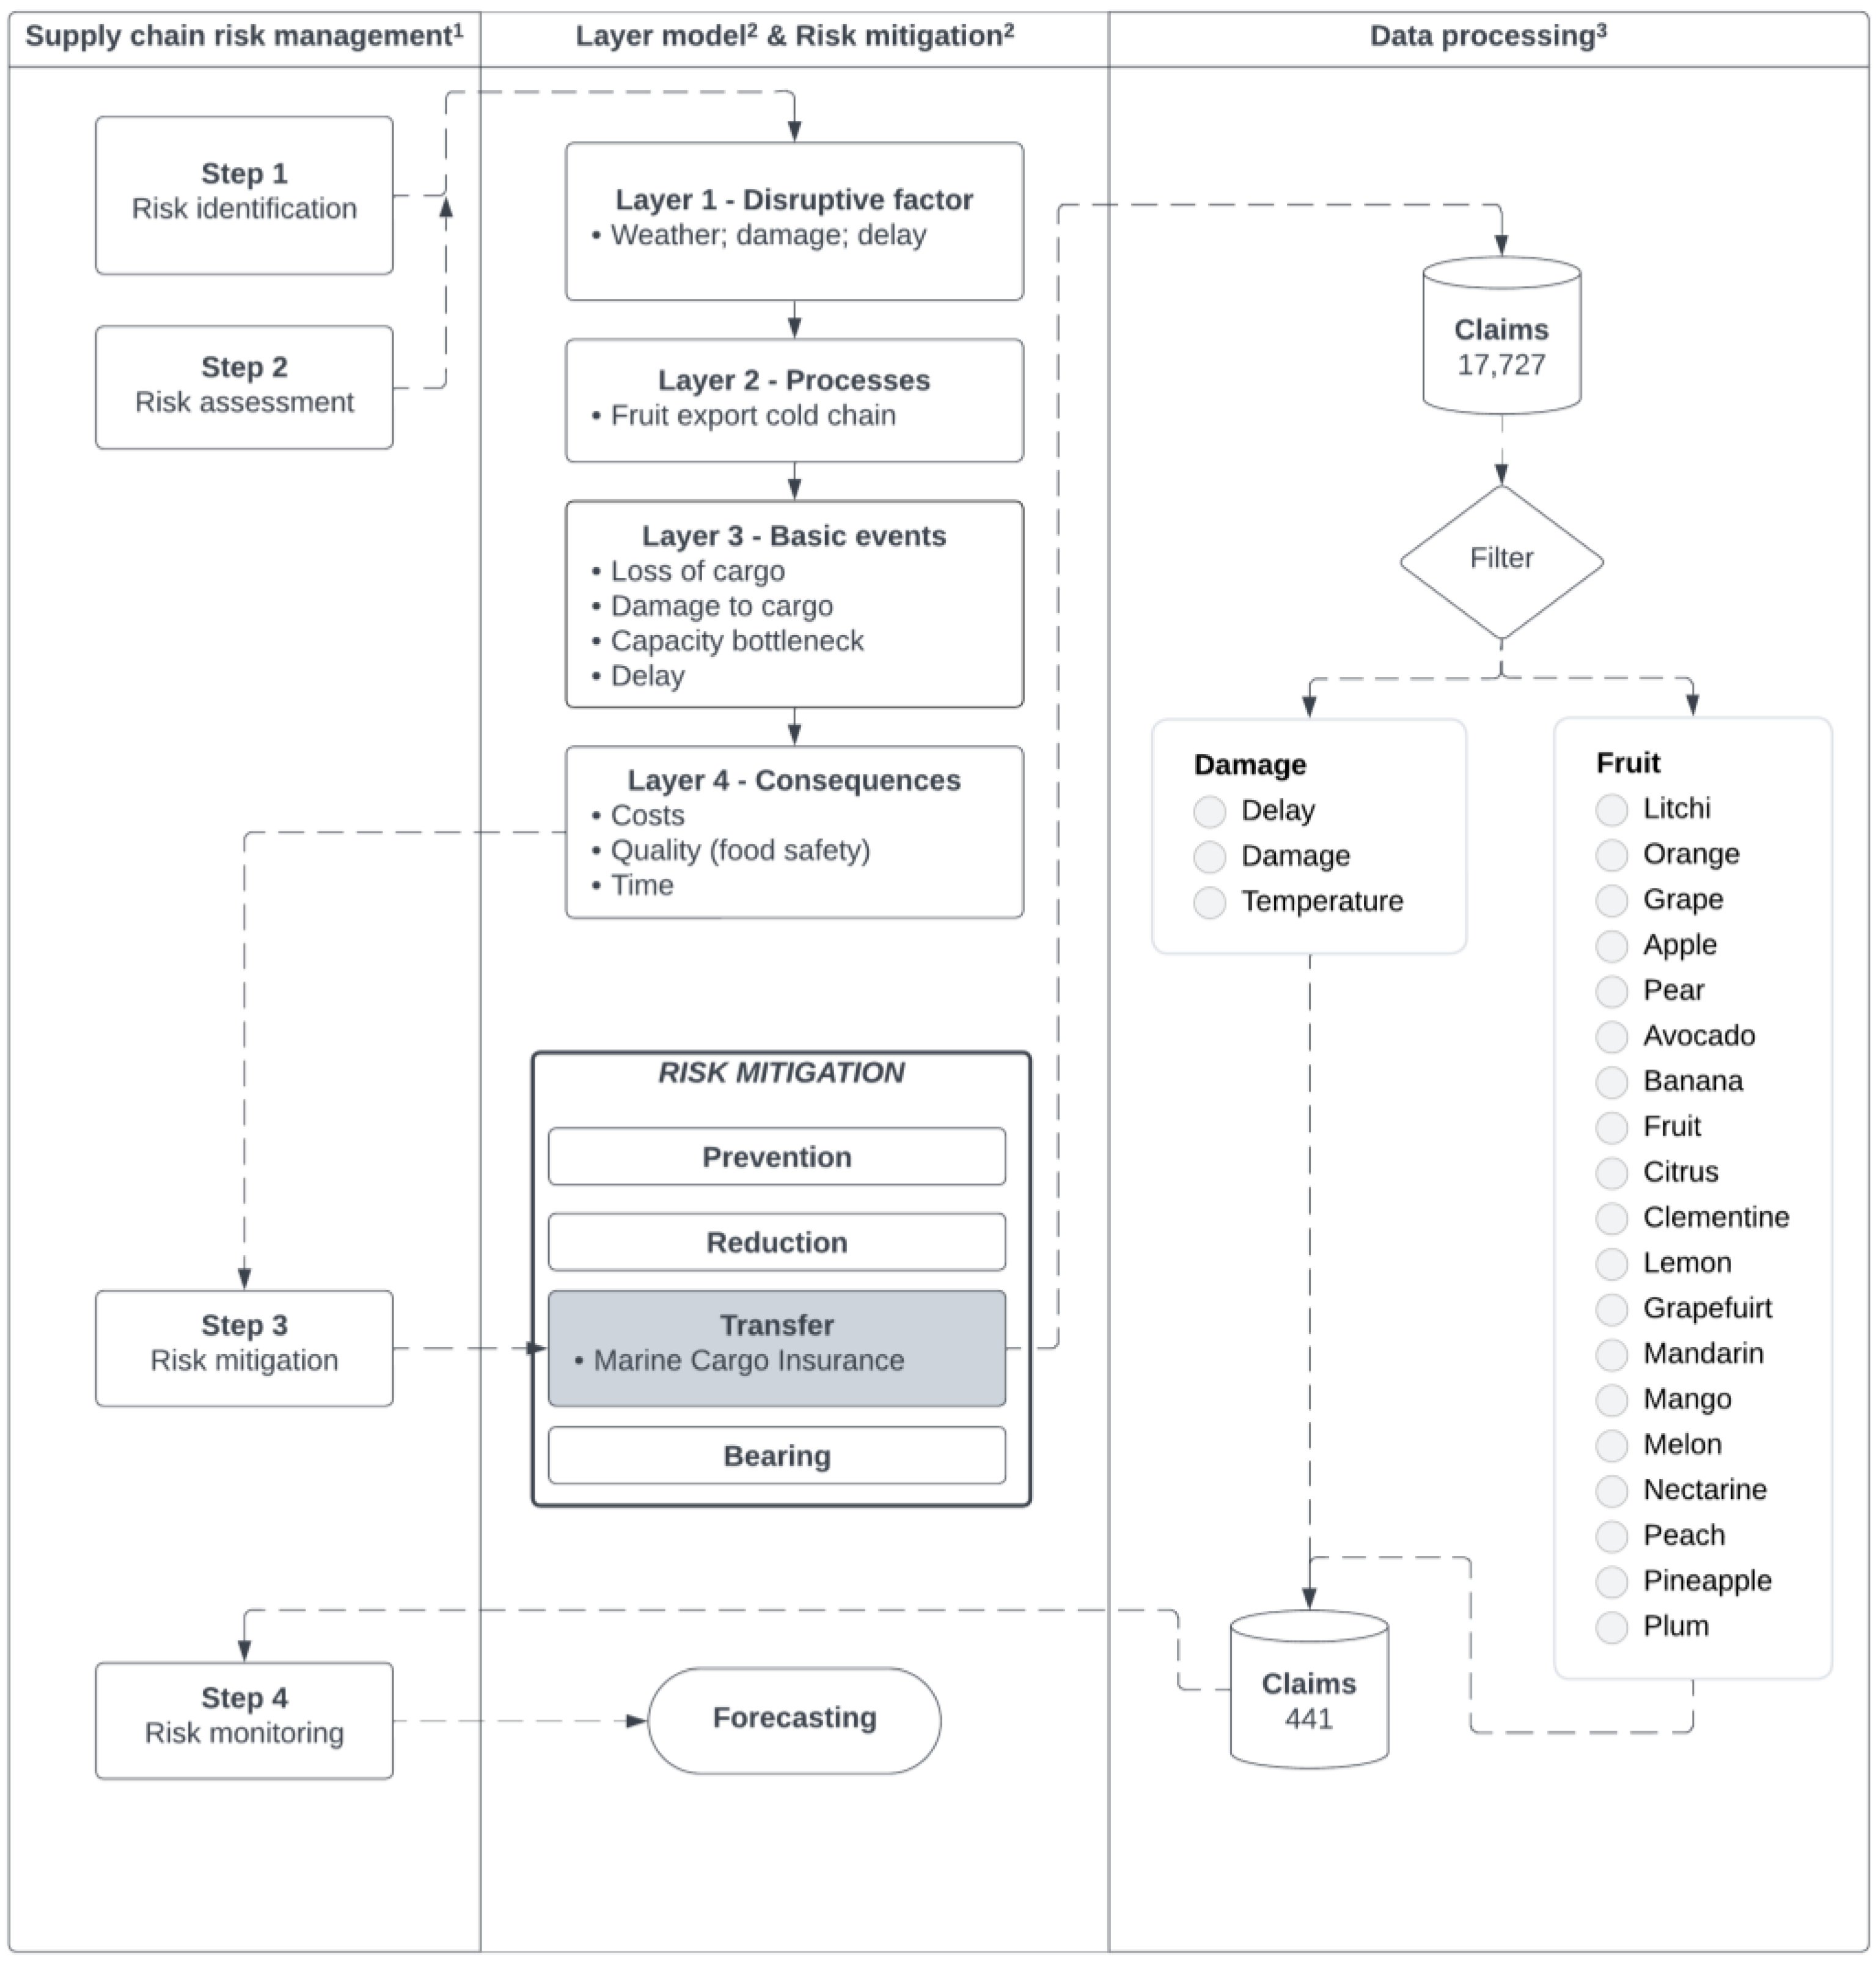
Figure 5.
Indexed claim distribution by category: 2013–2022.

Figure 6.
Indexed claim distribution by fruit group: 2013–2022.
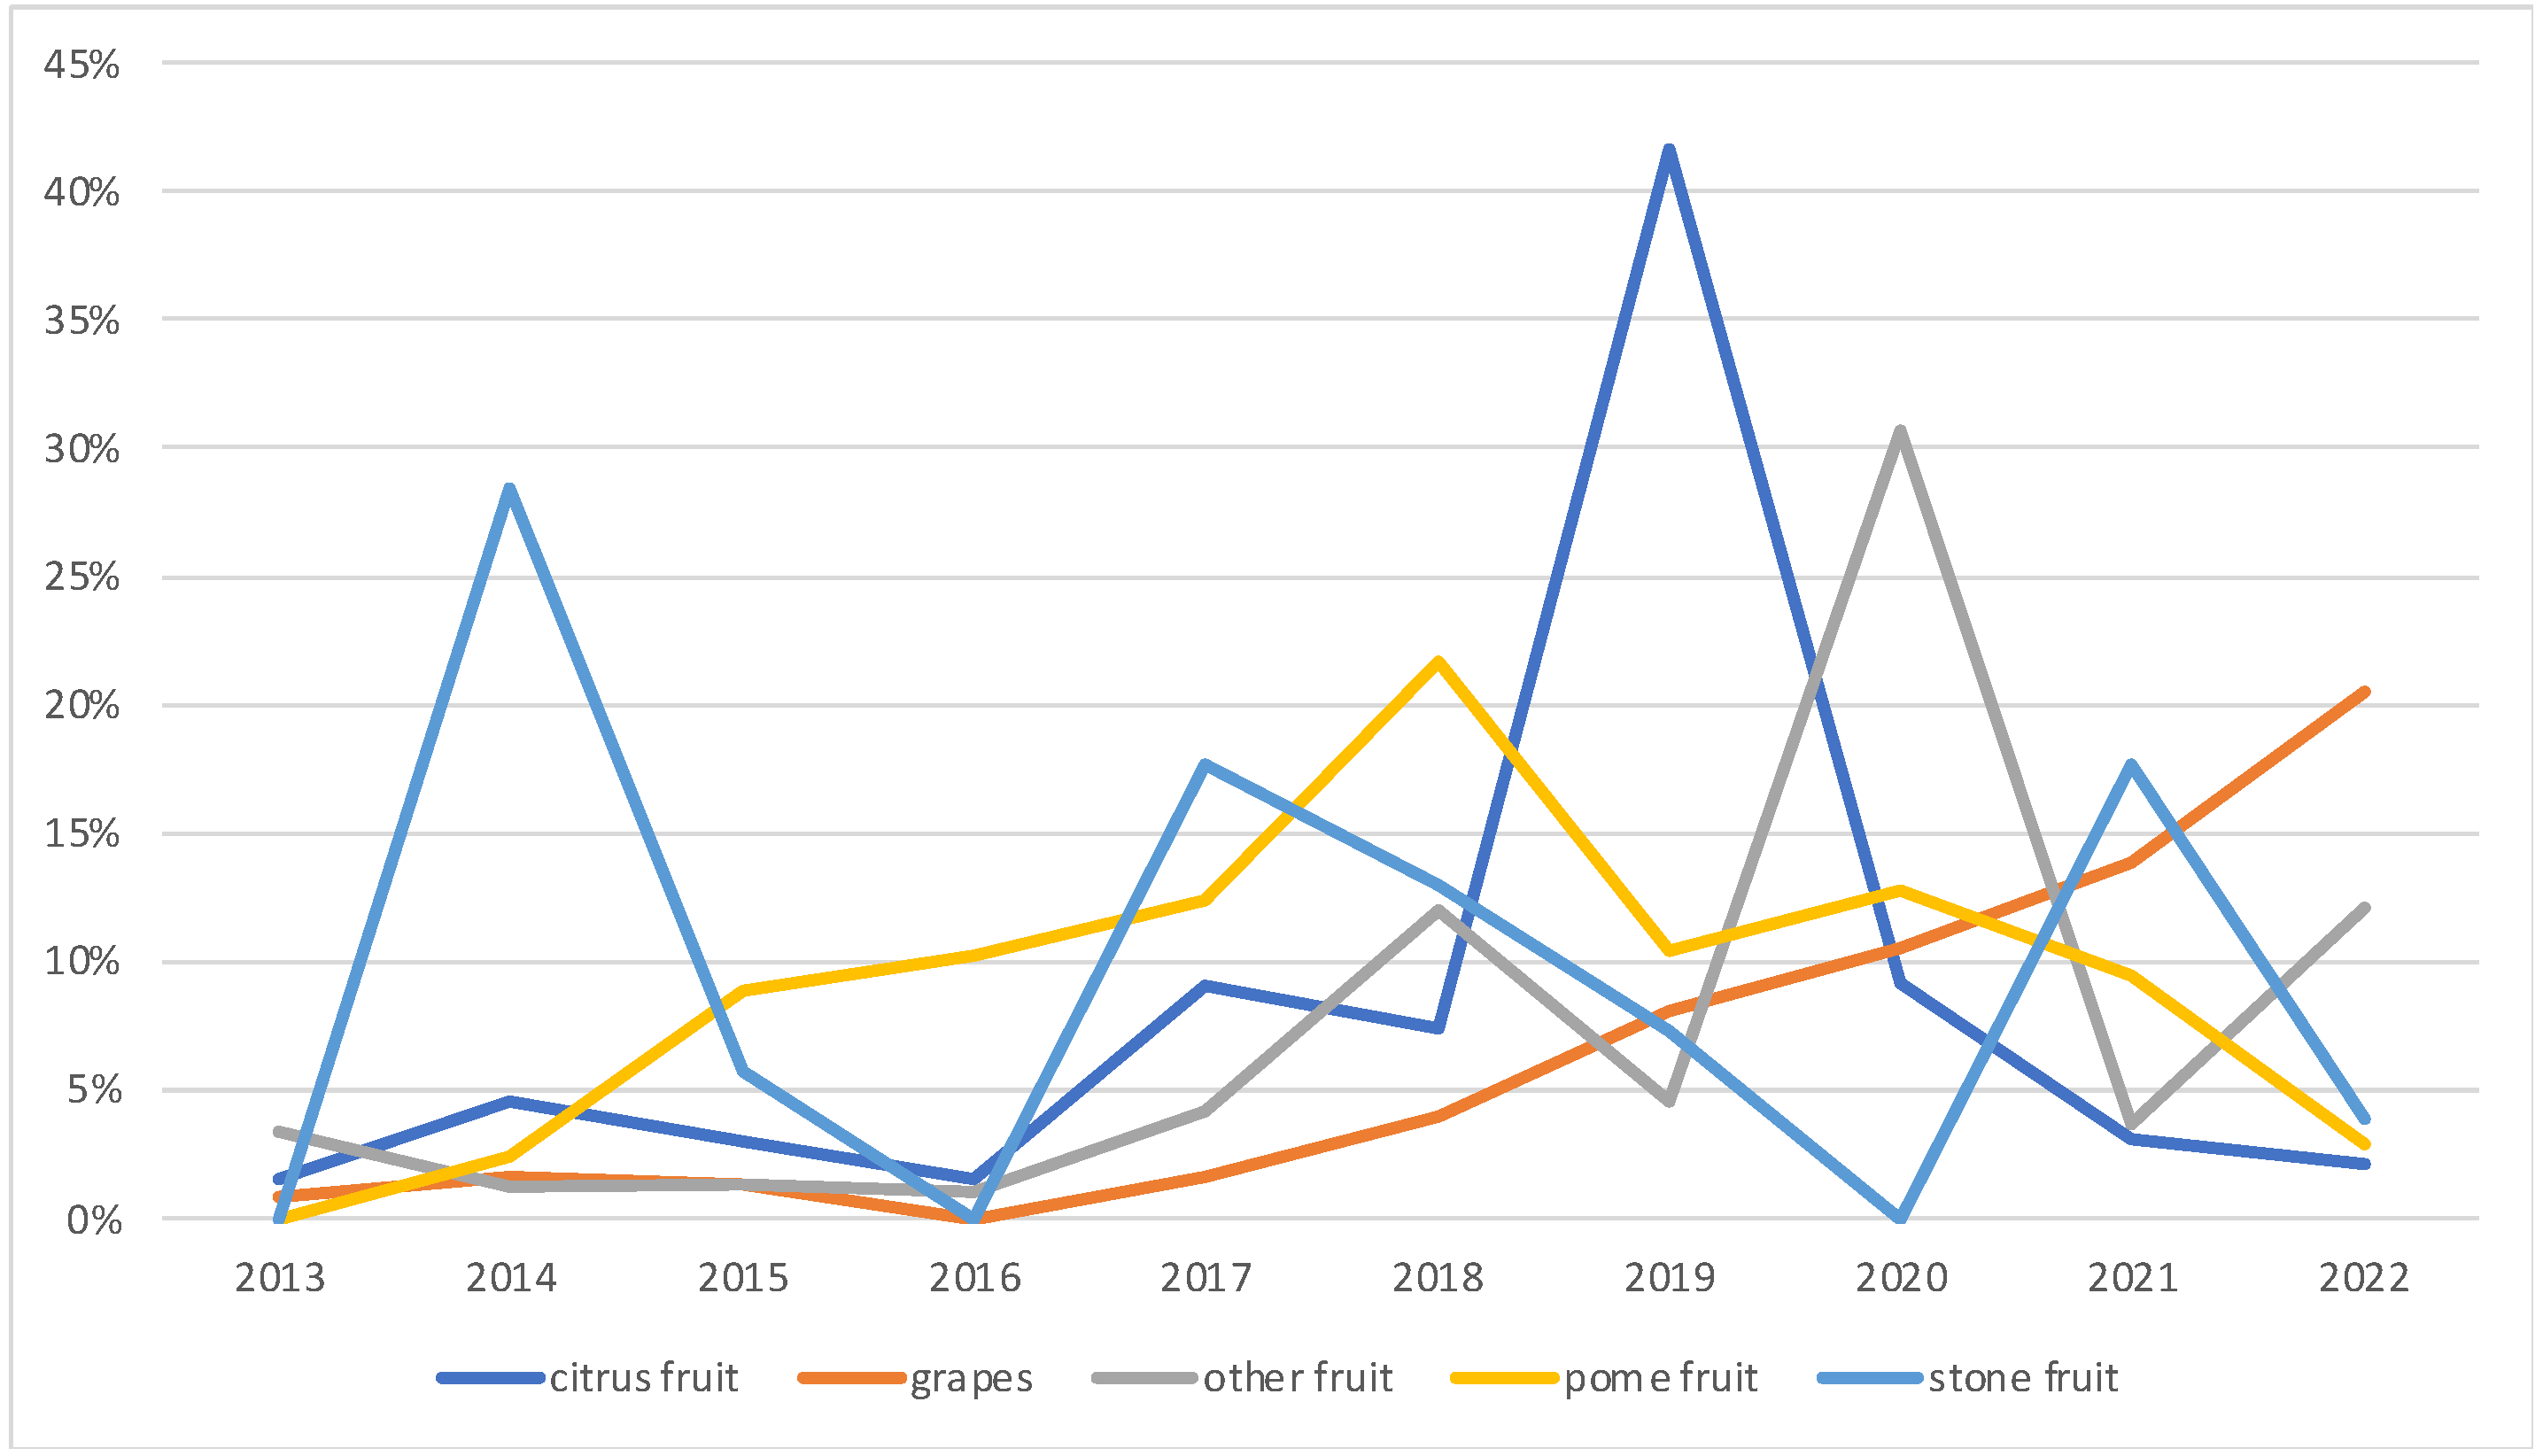
Figure 7.
Seasonality in fruit damage claims: 2013–2022.

Figure 8.
Two-dimensional scatterplot of fruit damage claims.
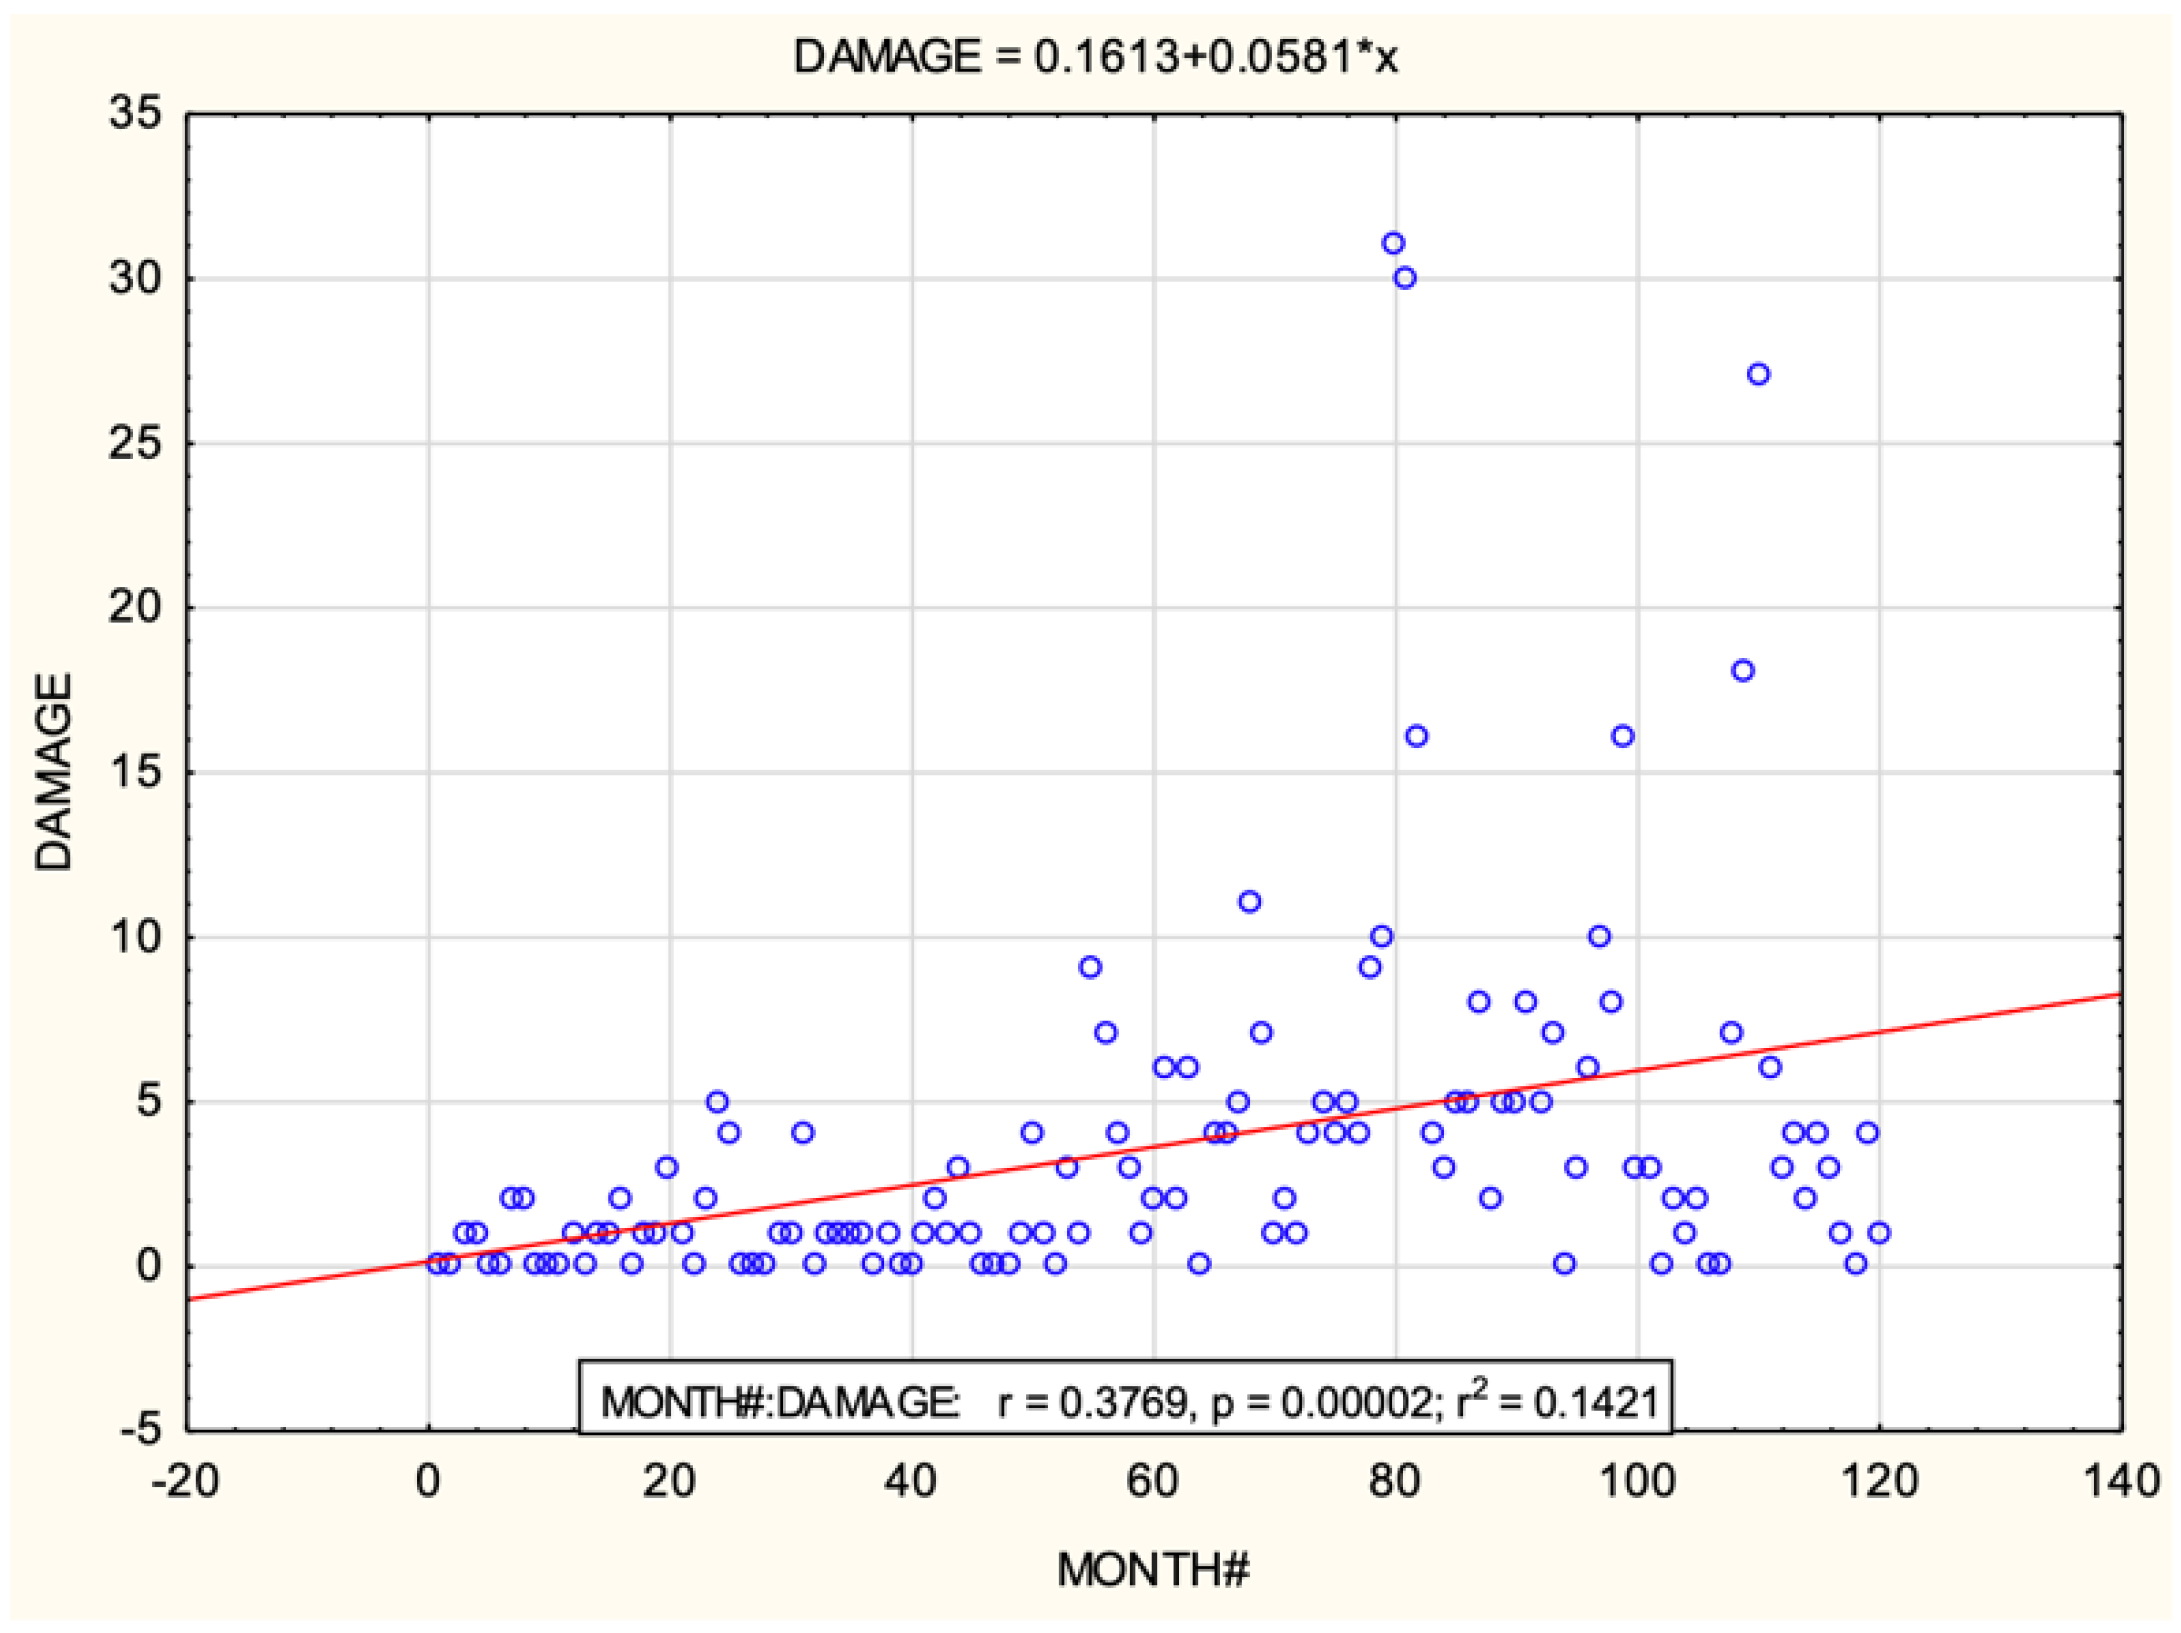
Figure 9.
Two-dimensional scatterplot of fruit damage claims after transformation.
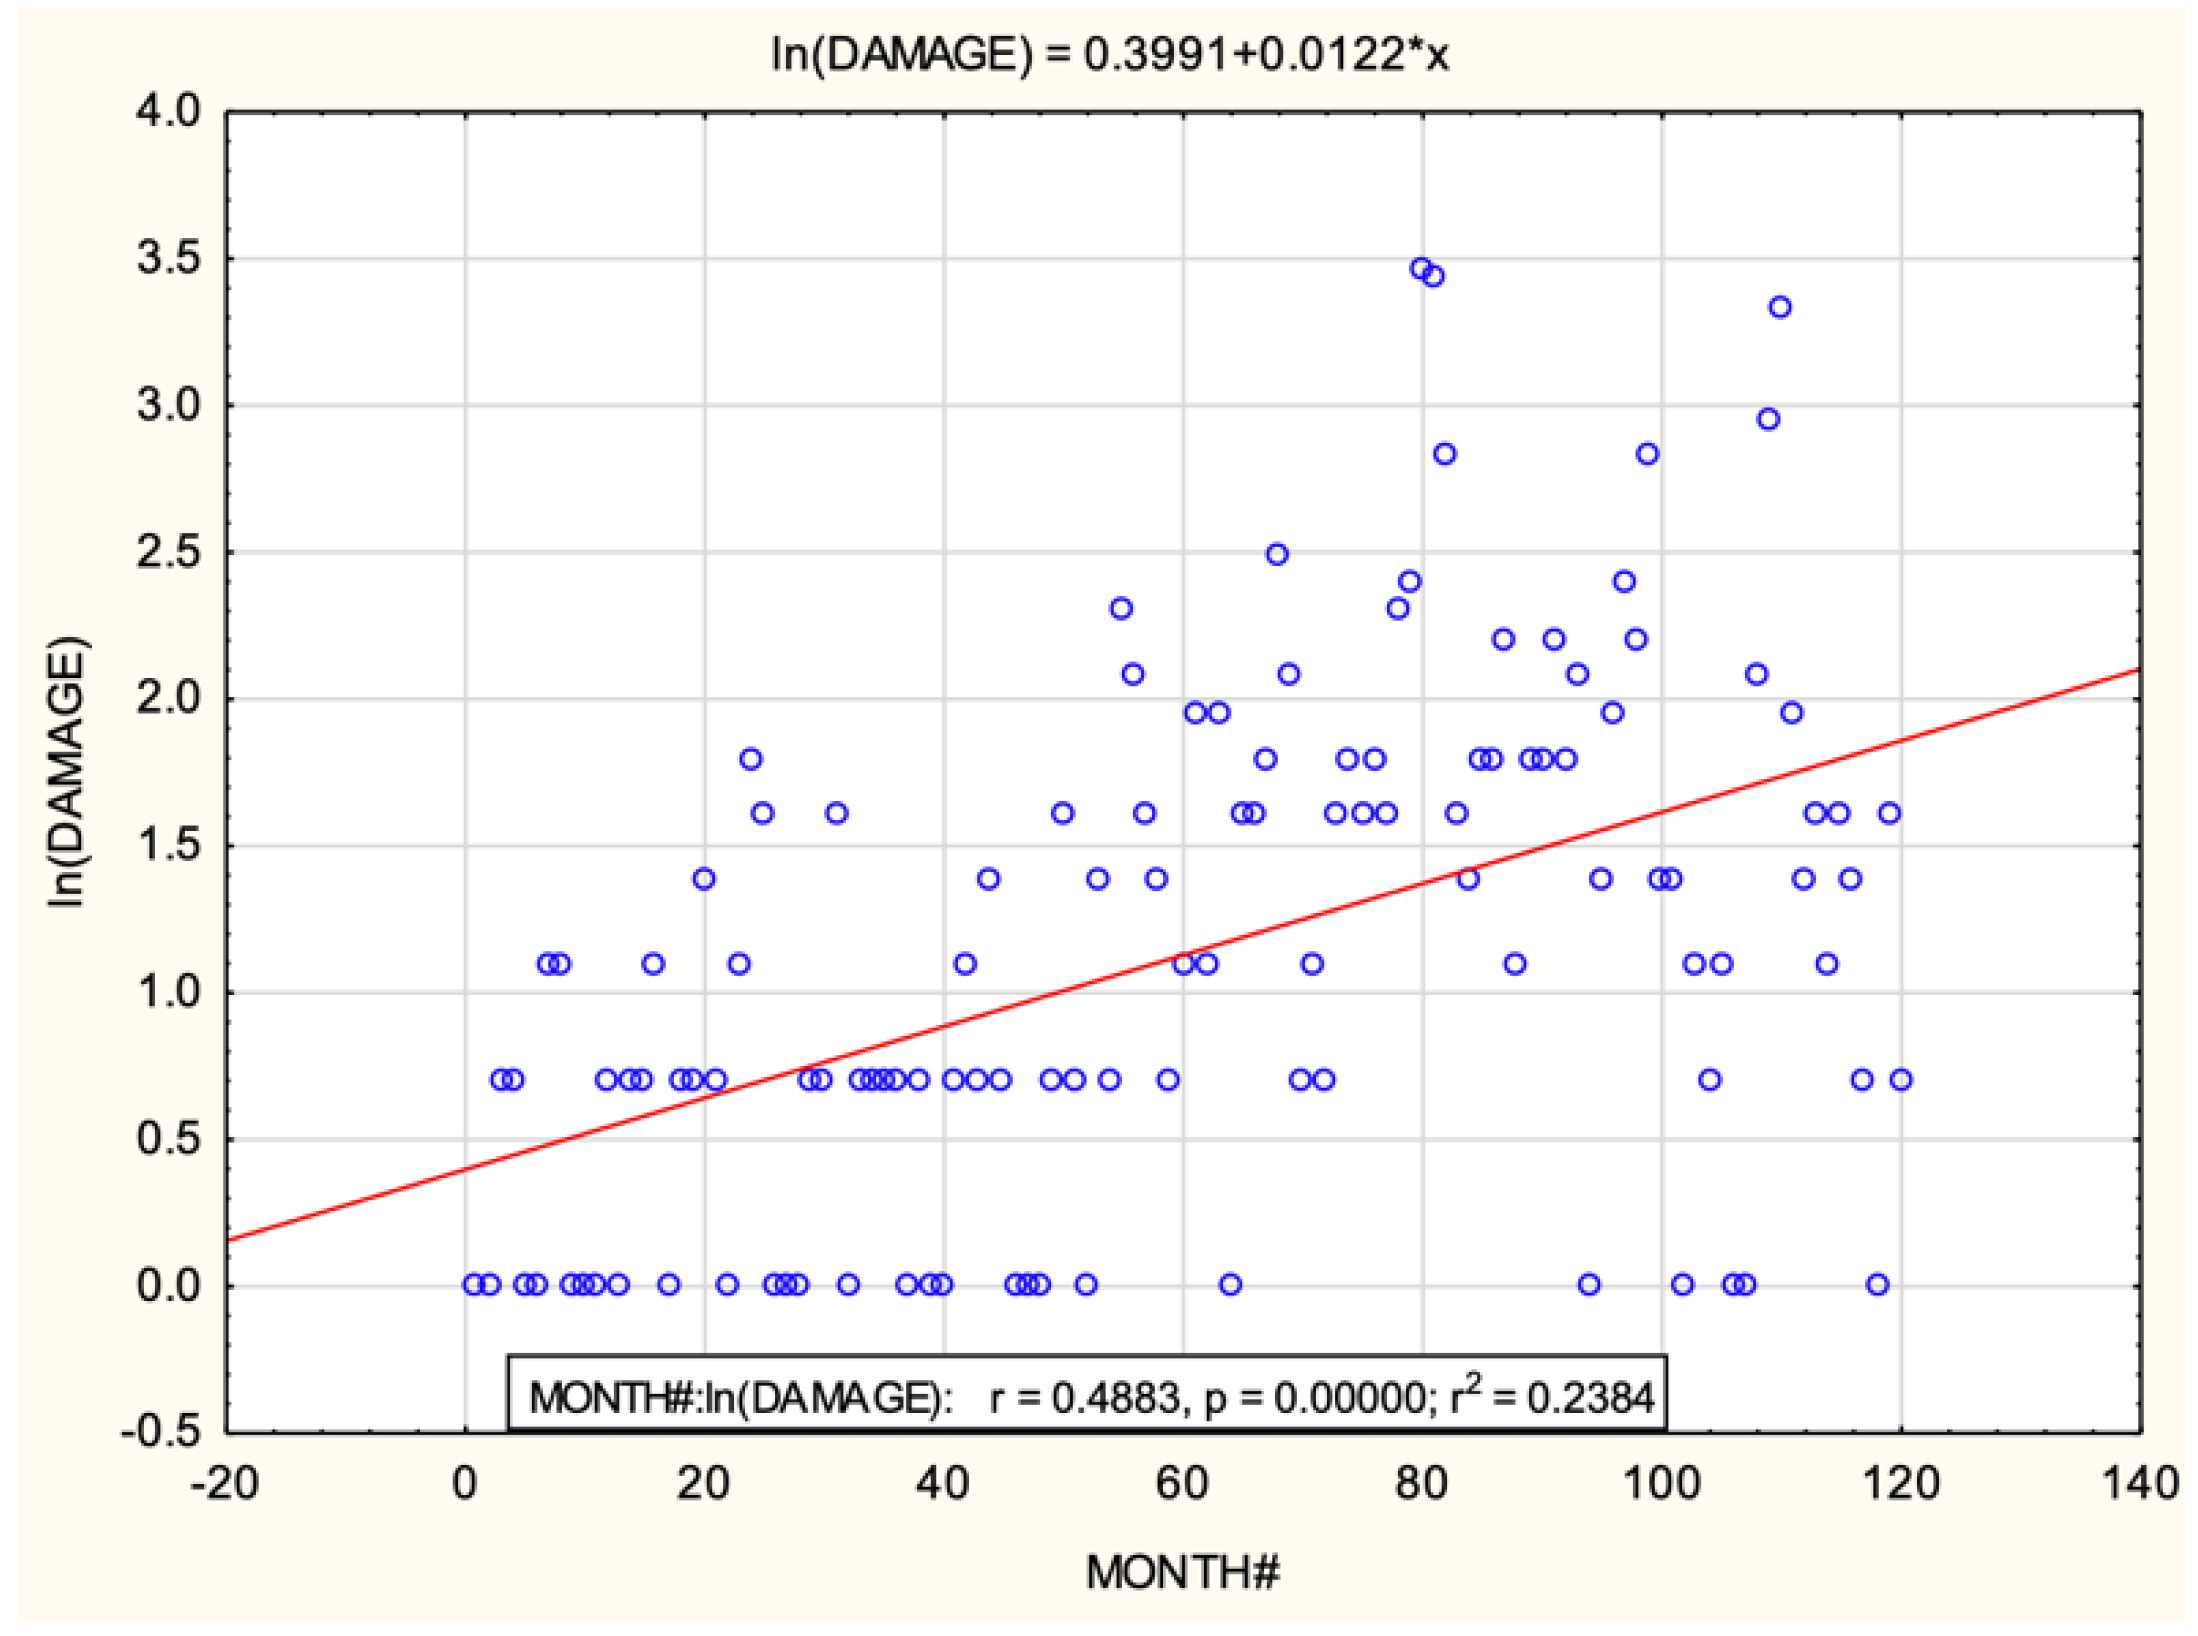
Figure 10.
Normal probability plot of residuals.

Figure 11.
Plot of variables.
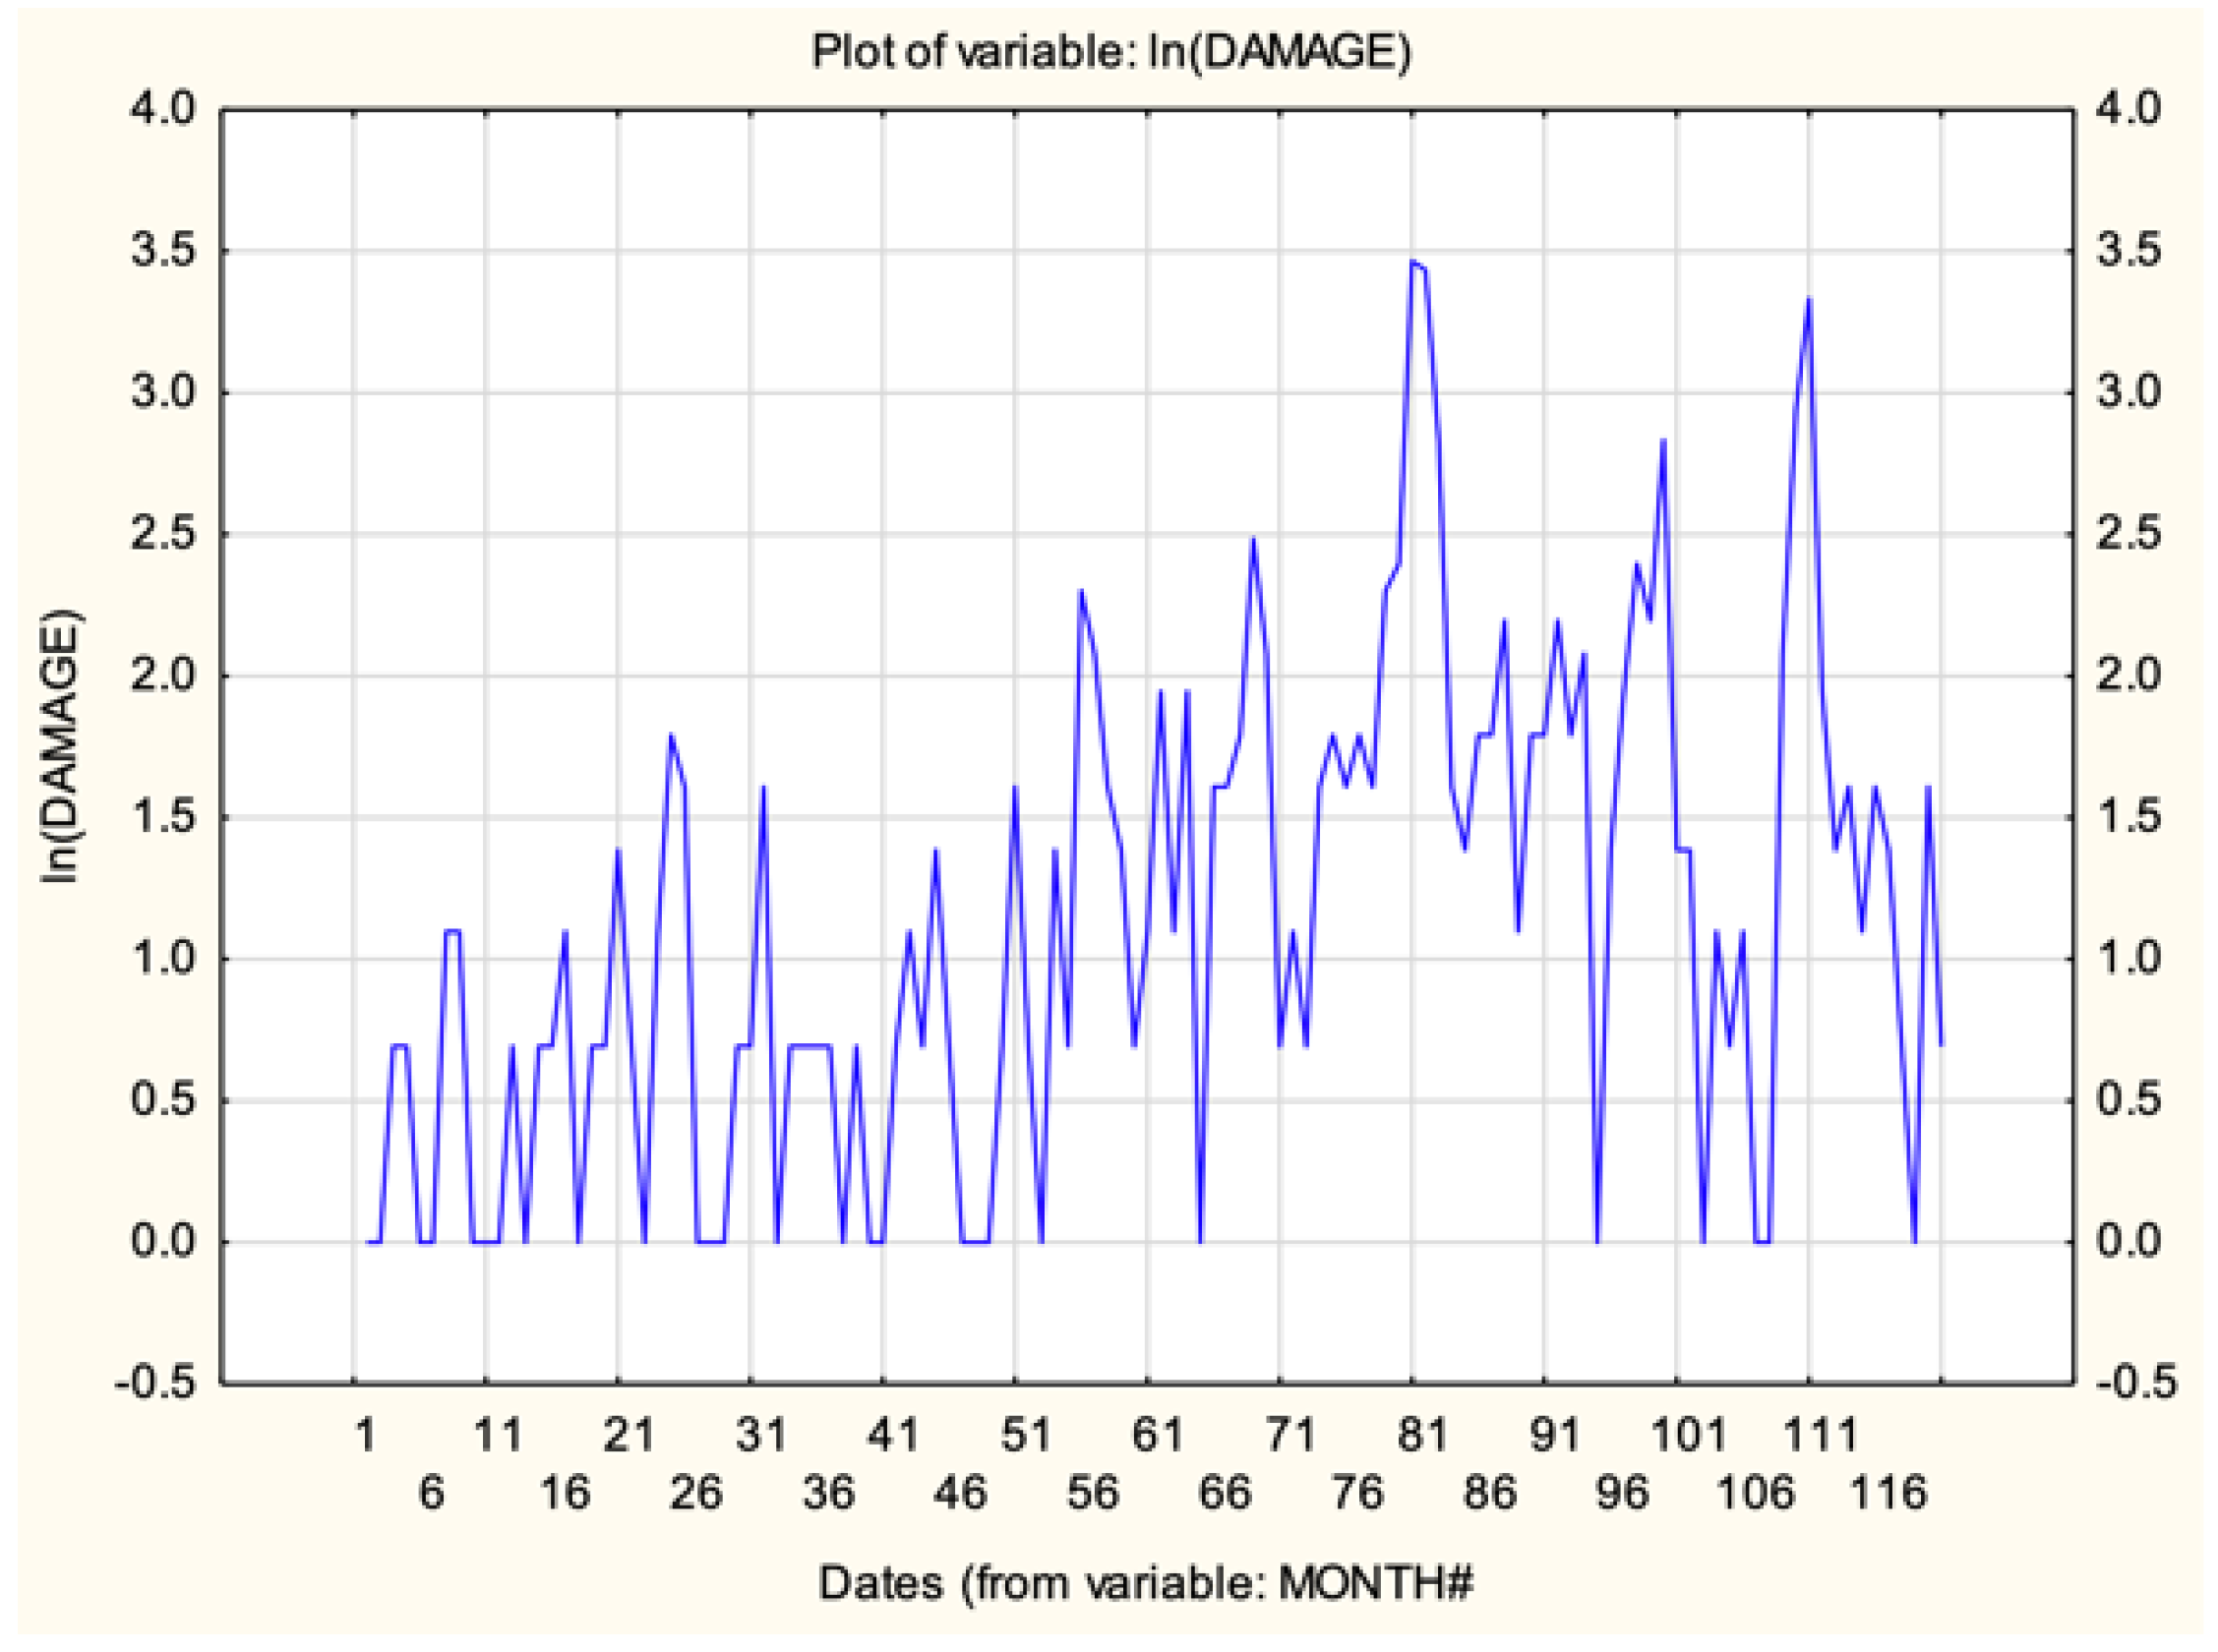
Figure 12.
Plot of variables after first order differencing.

Figure 13.
Autocorrelation function.
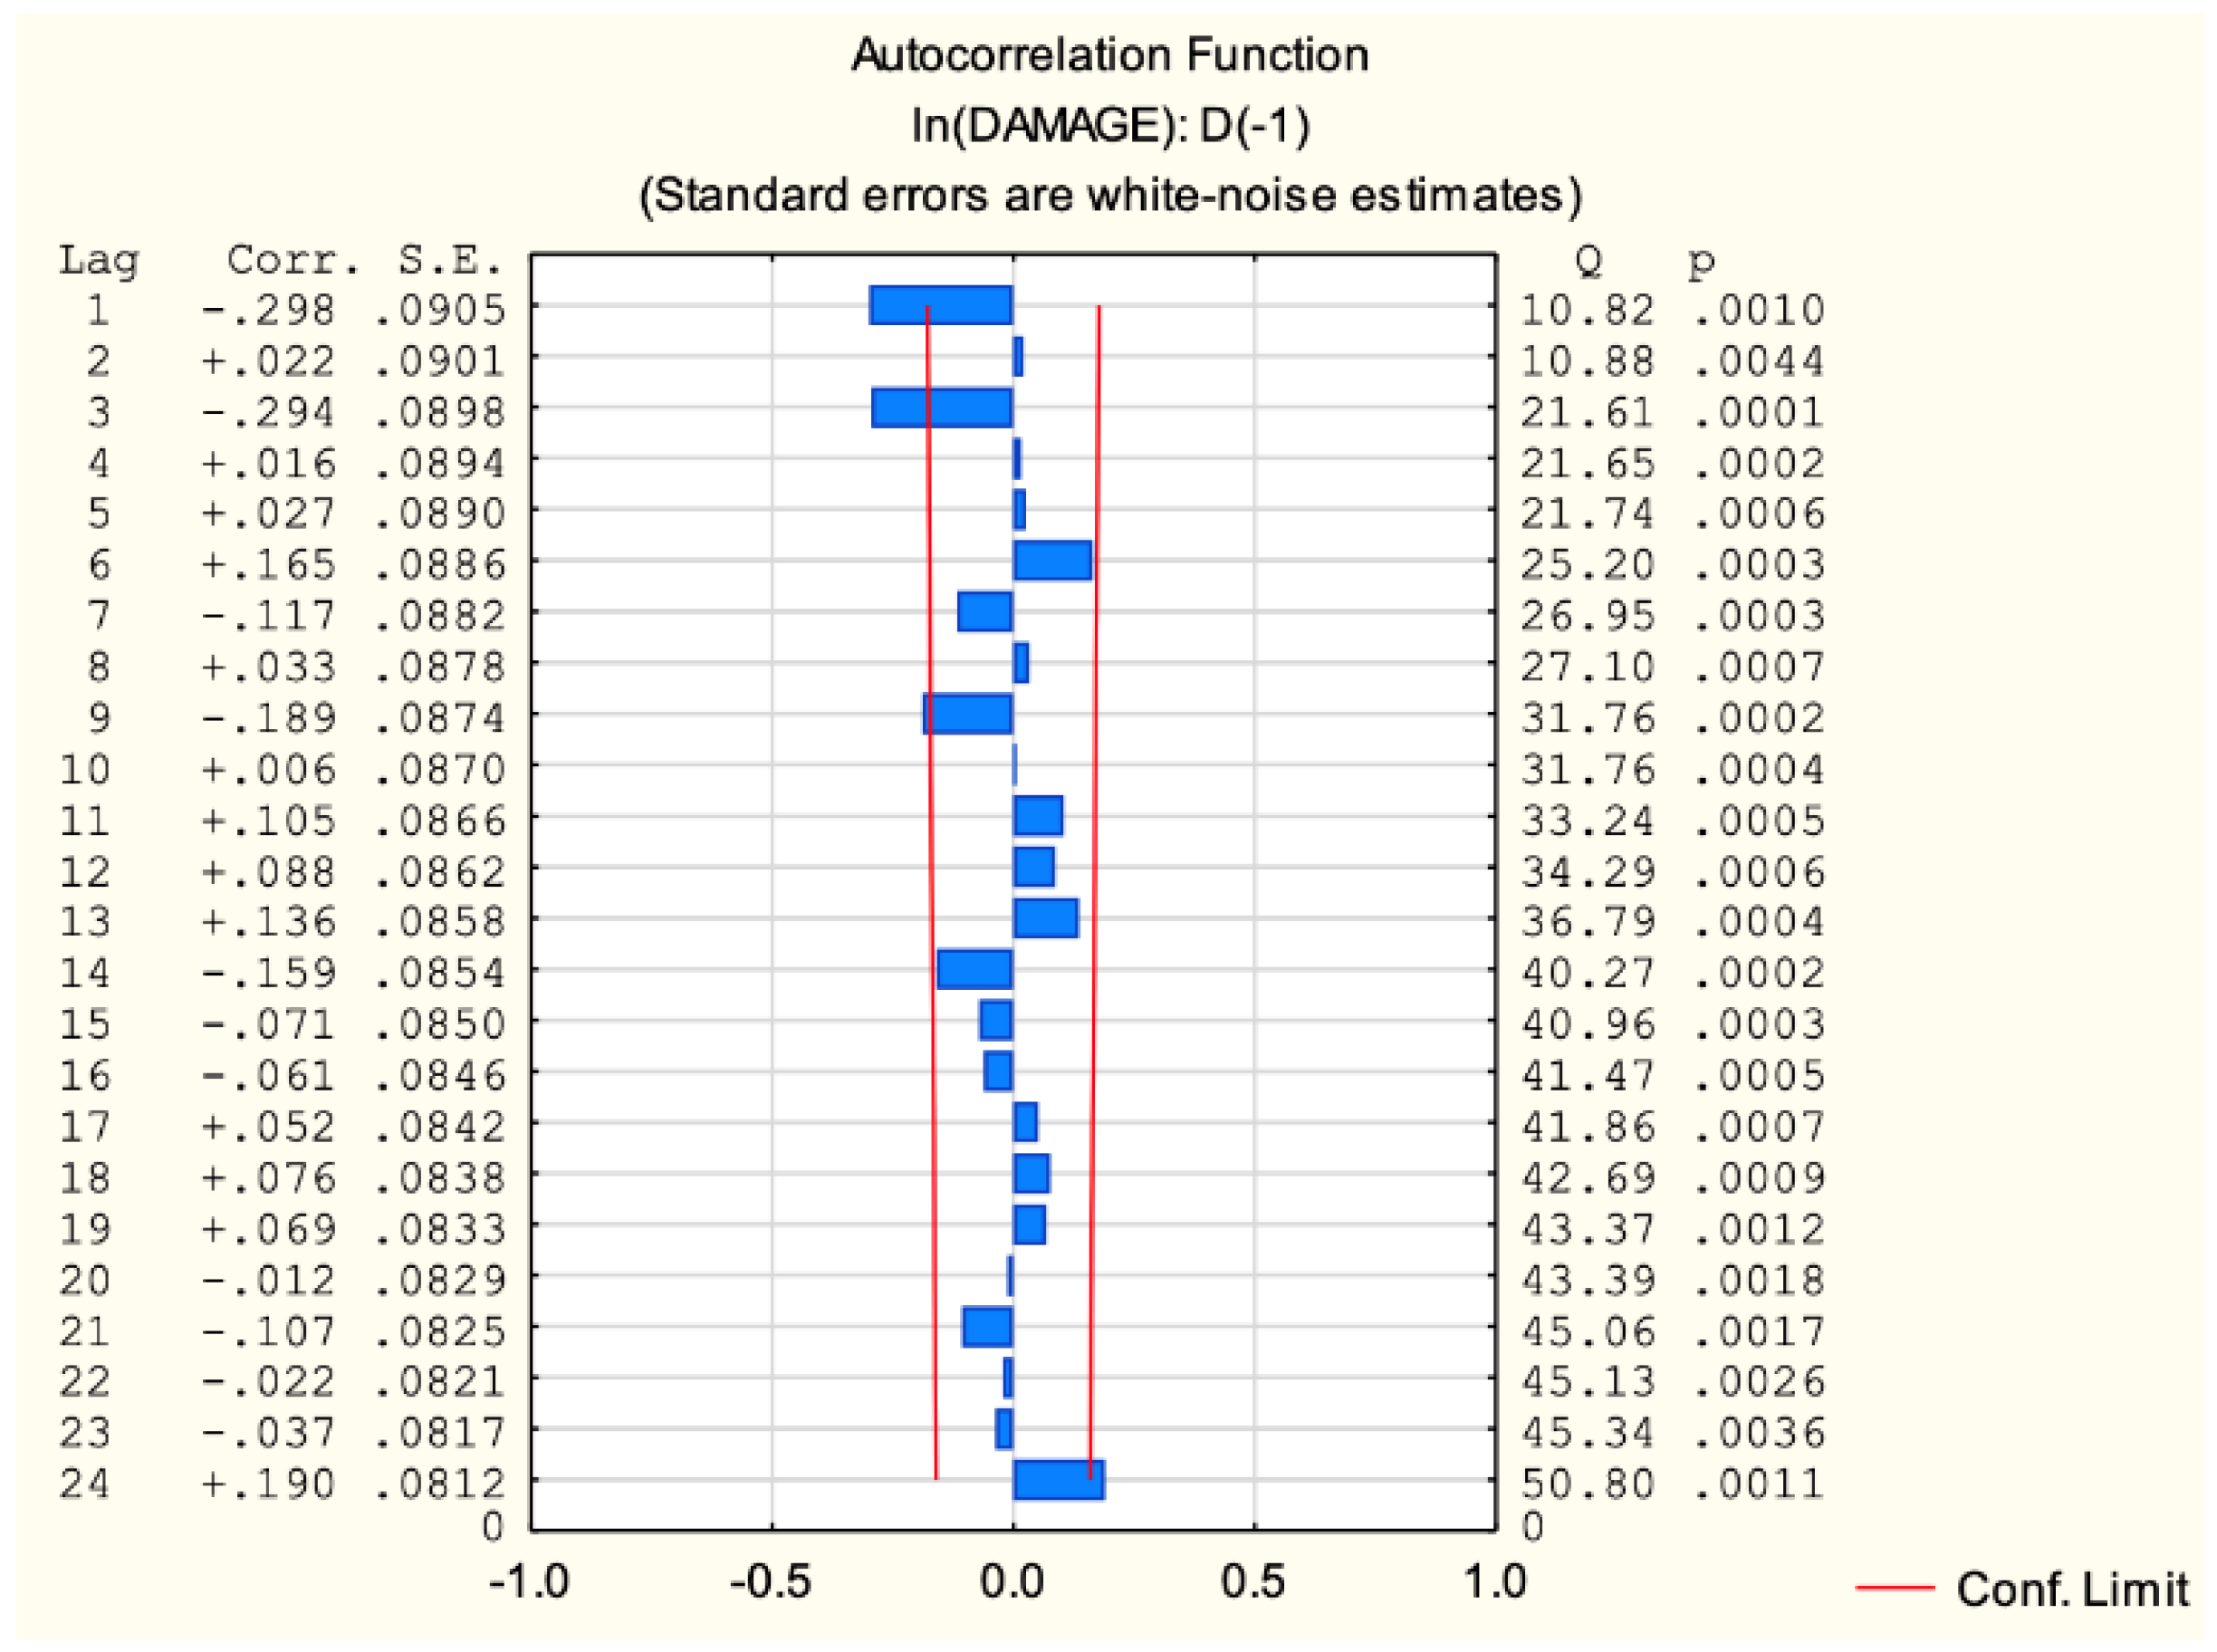
Figure 14.
Partial autocorrelation function.

Figure 15.
Spectral analysis after Parzen smoothing.
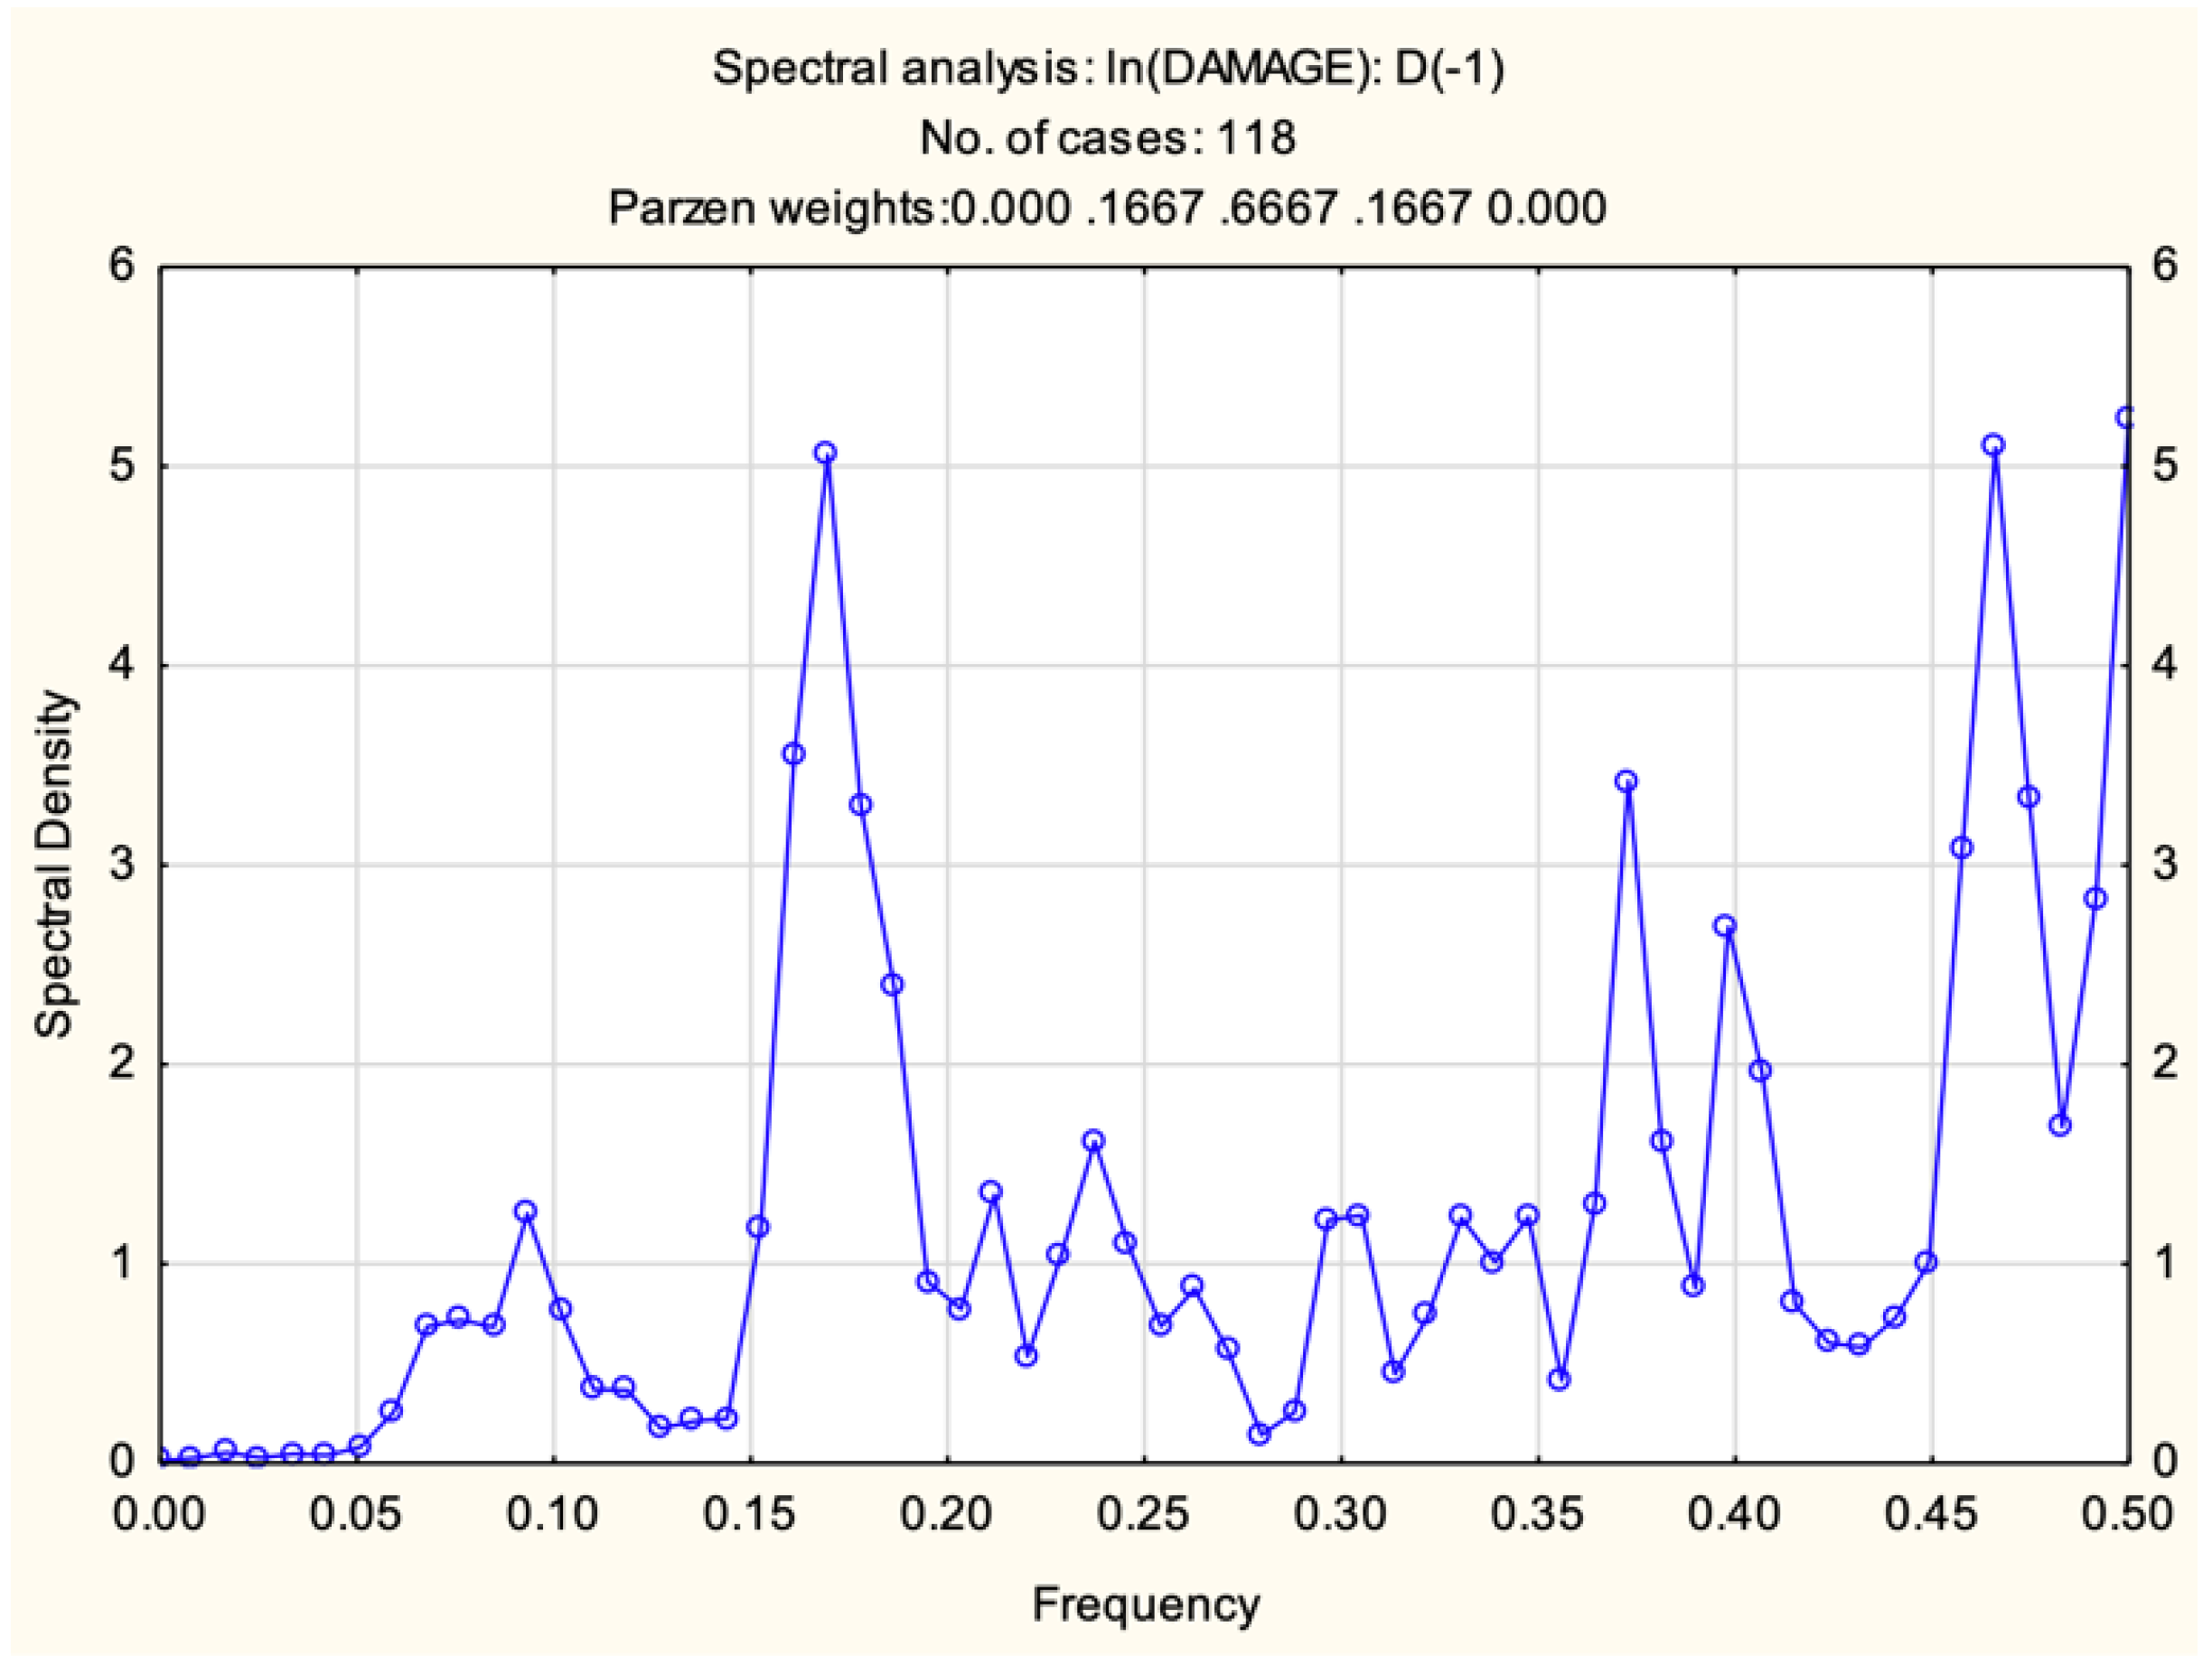
Figure 16.
Autocorrelation after model fit.
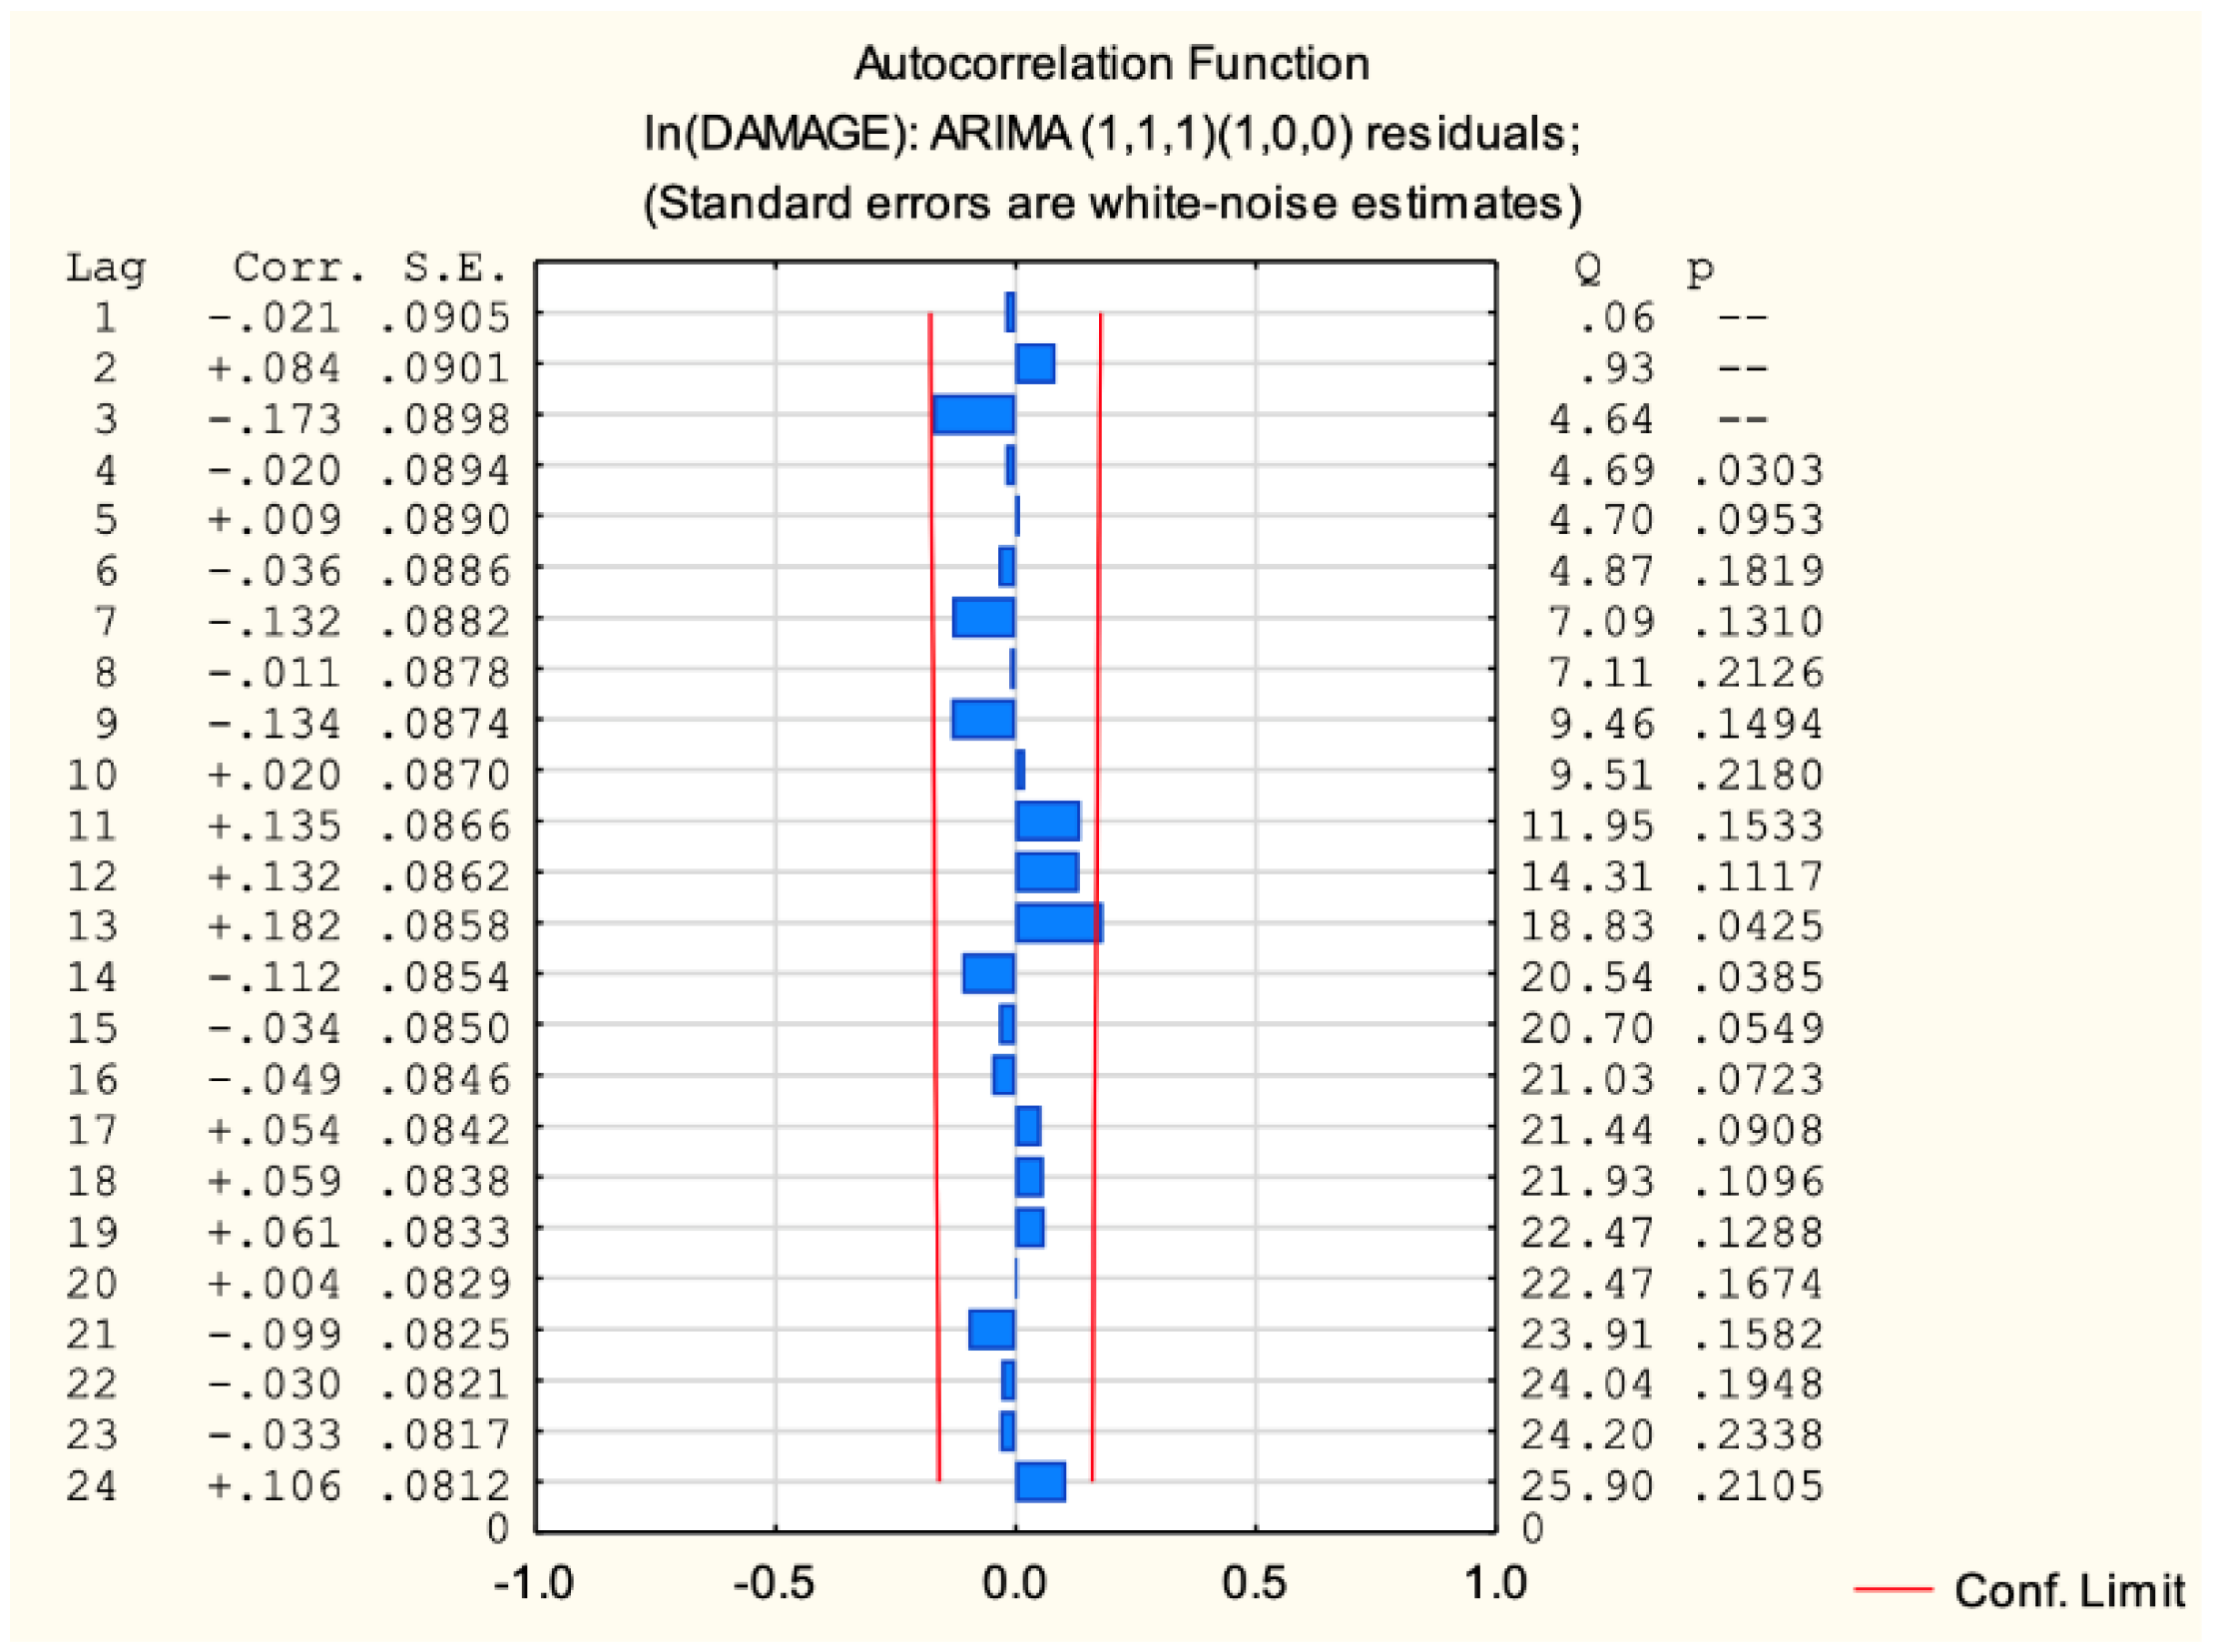
Figure 17.
Partial autocorrelation after model fit.
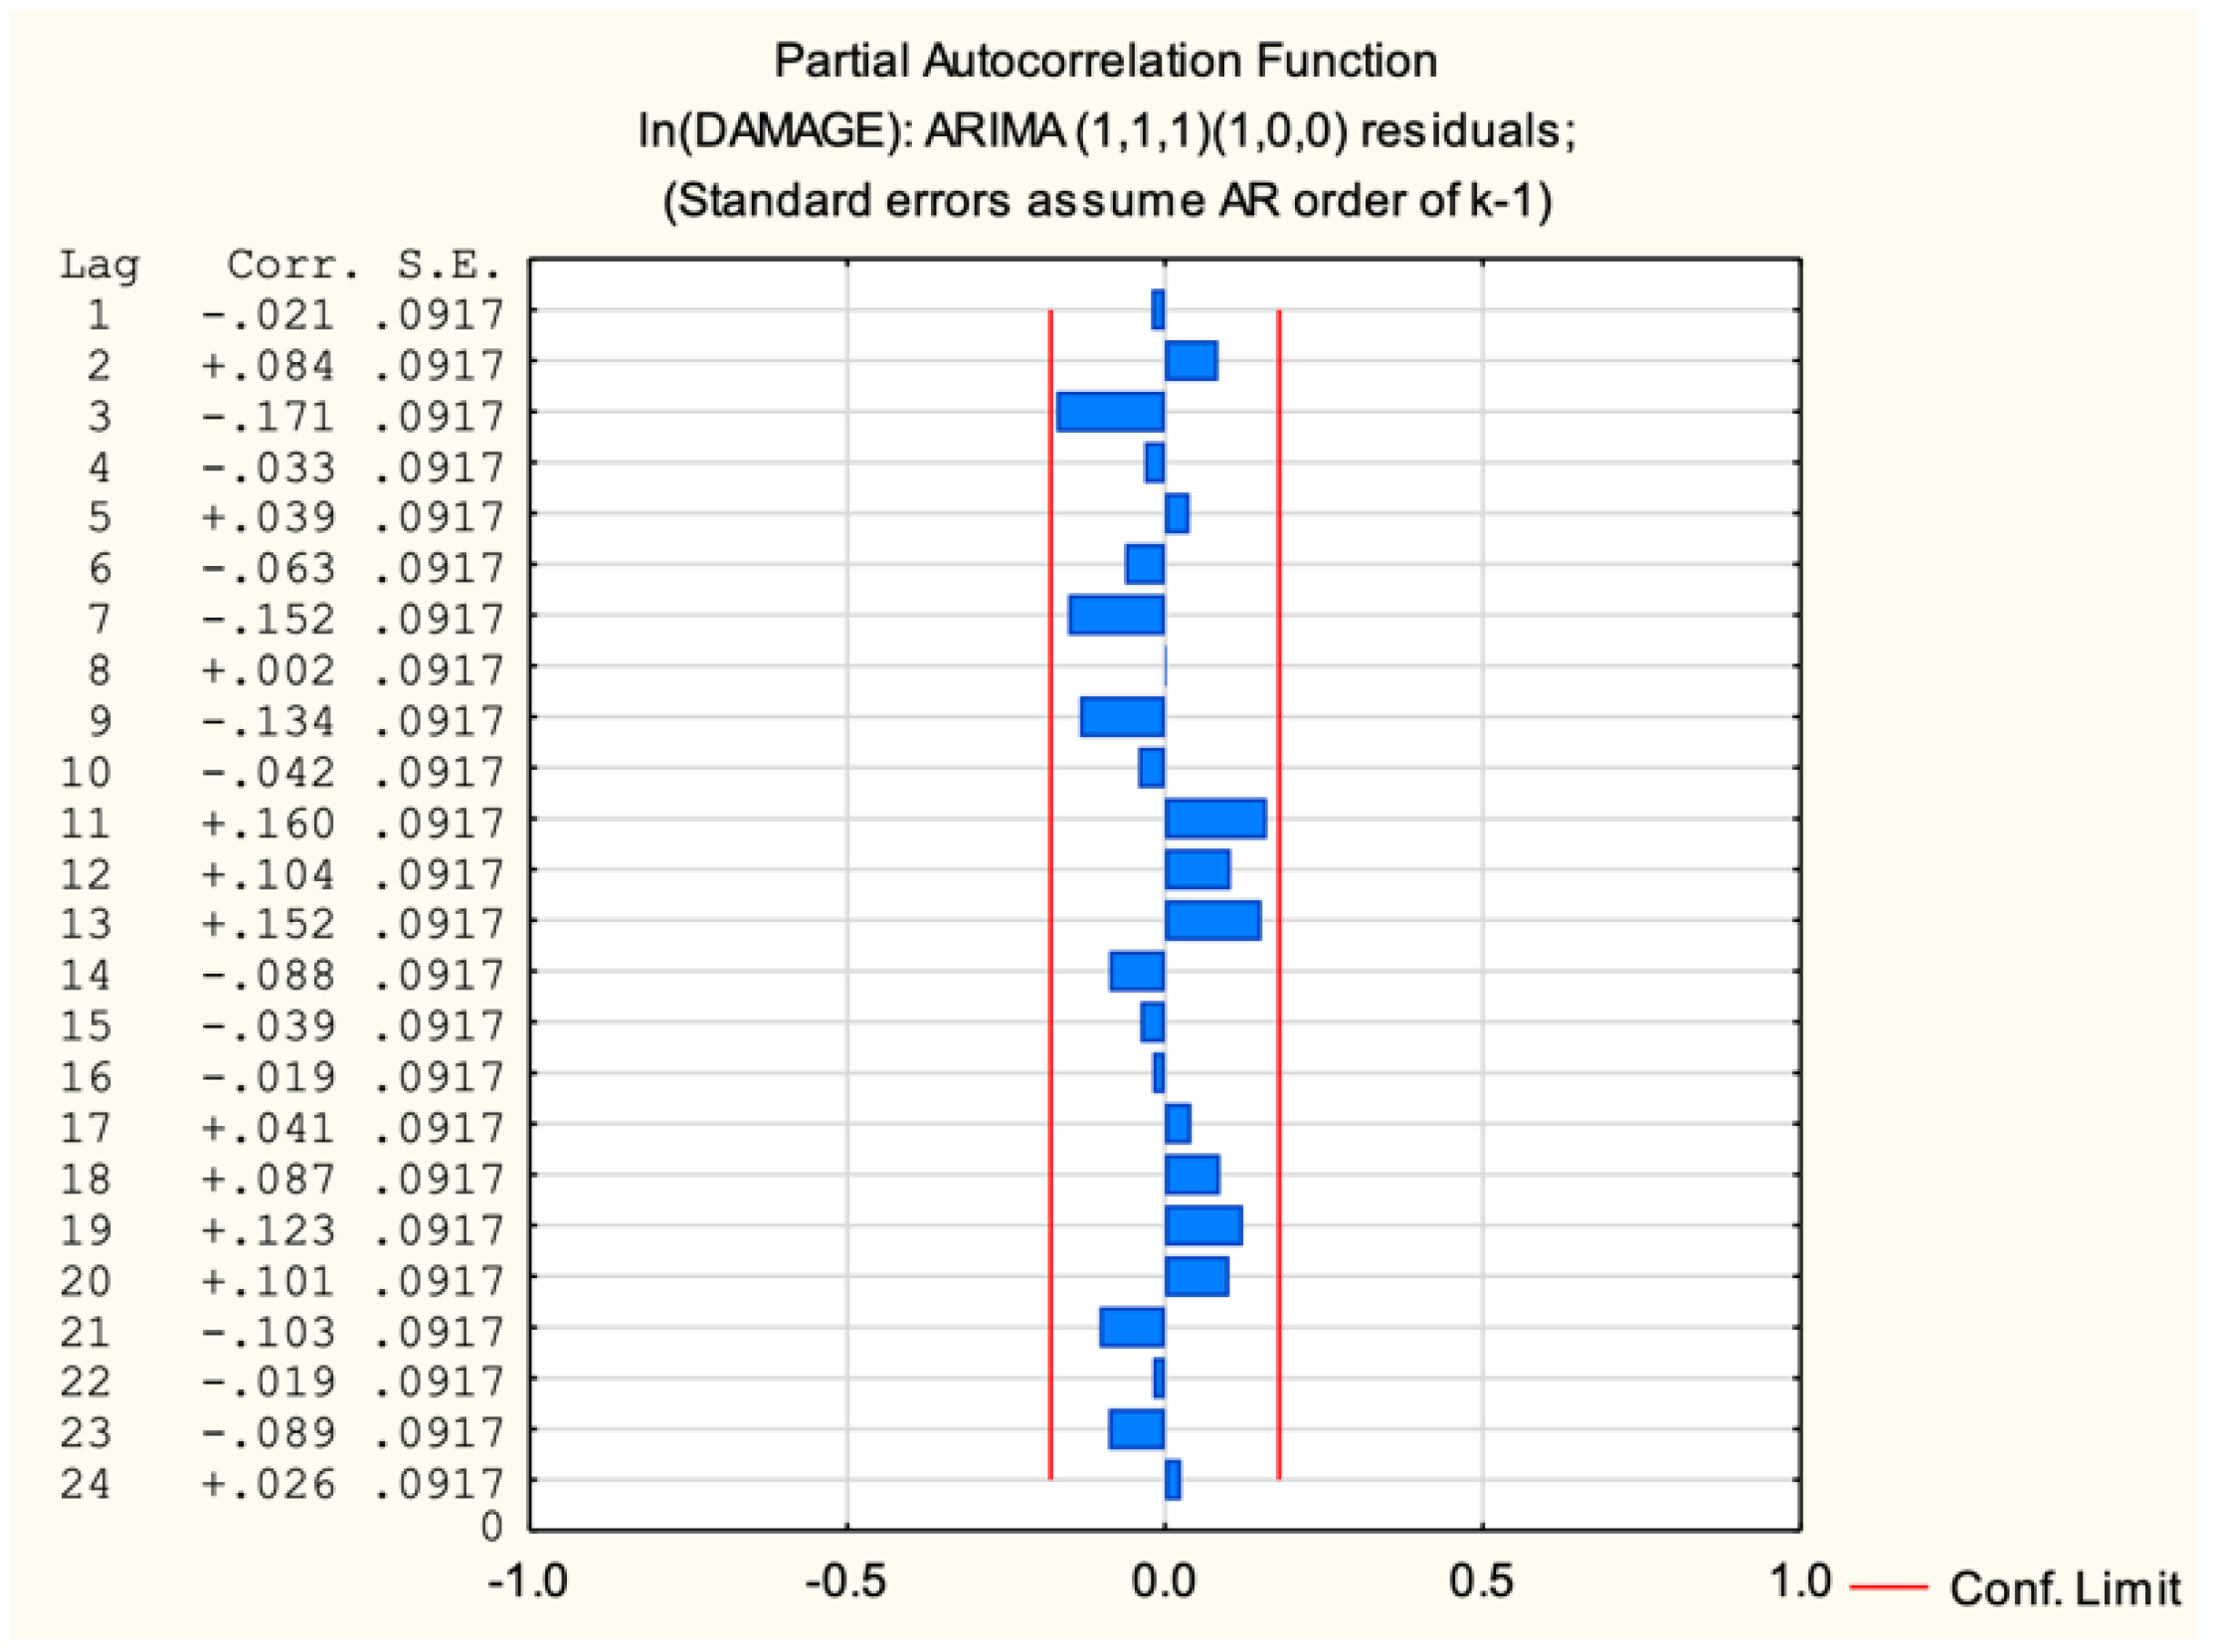
Figure 18.
SARIMA forecasting.
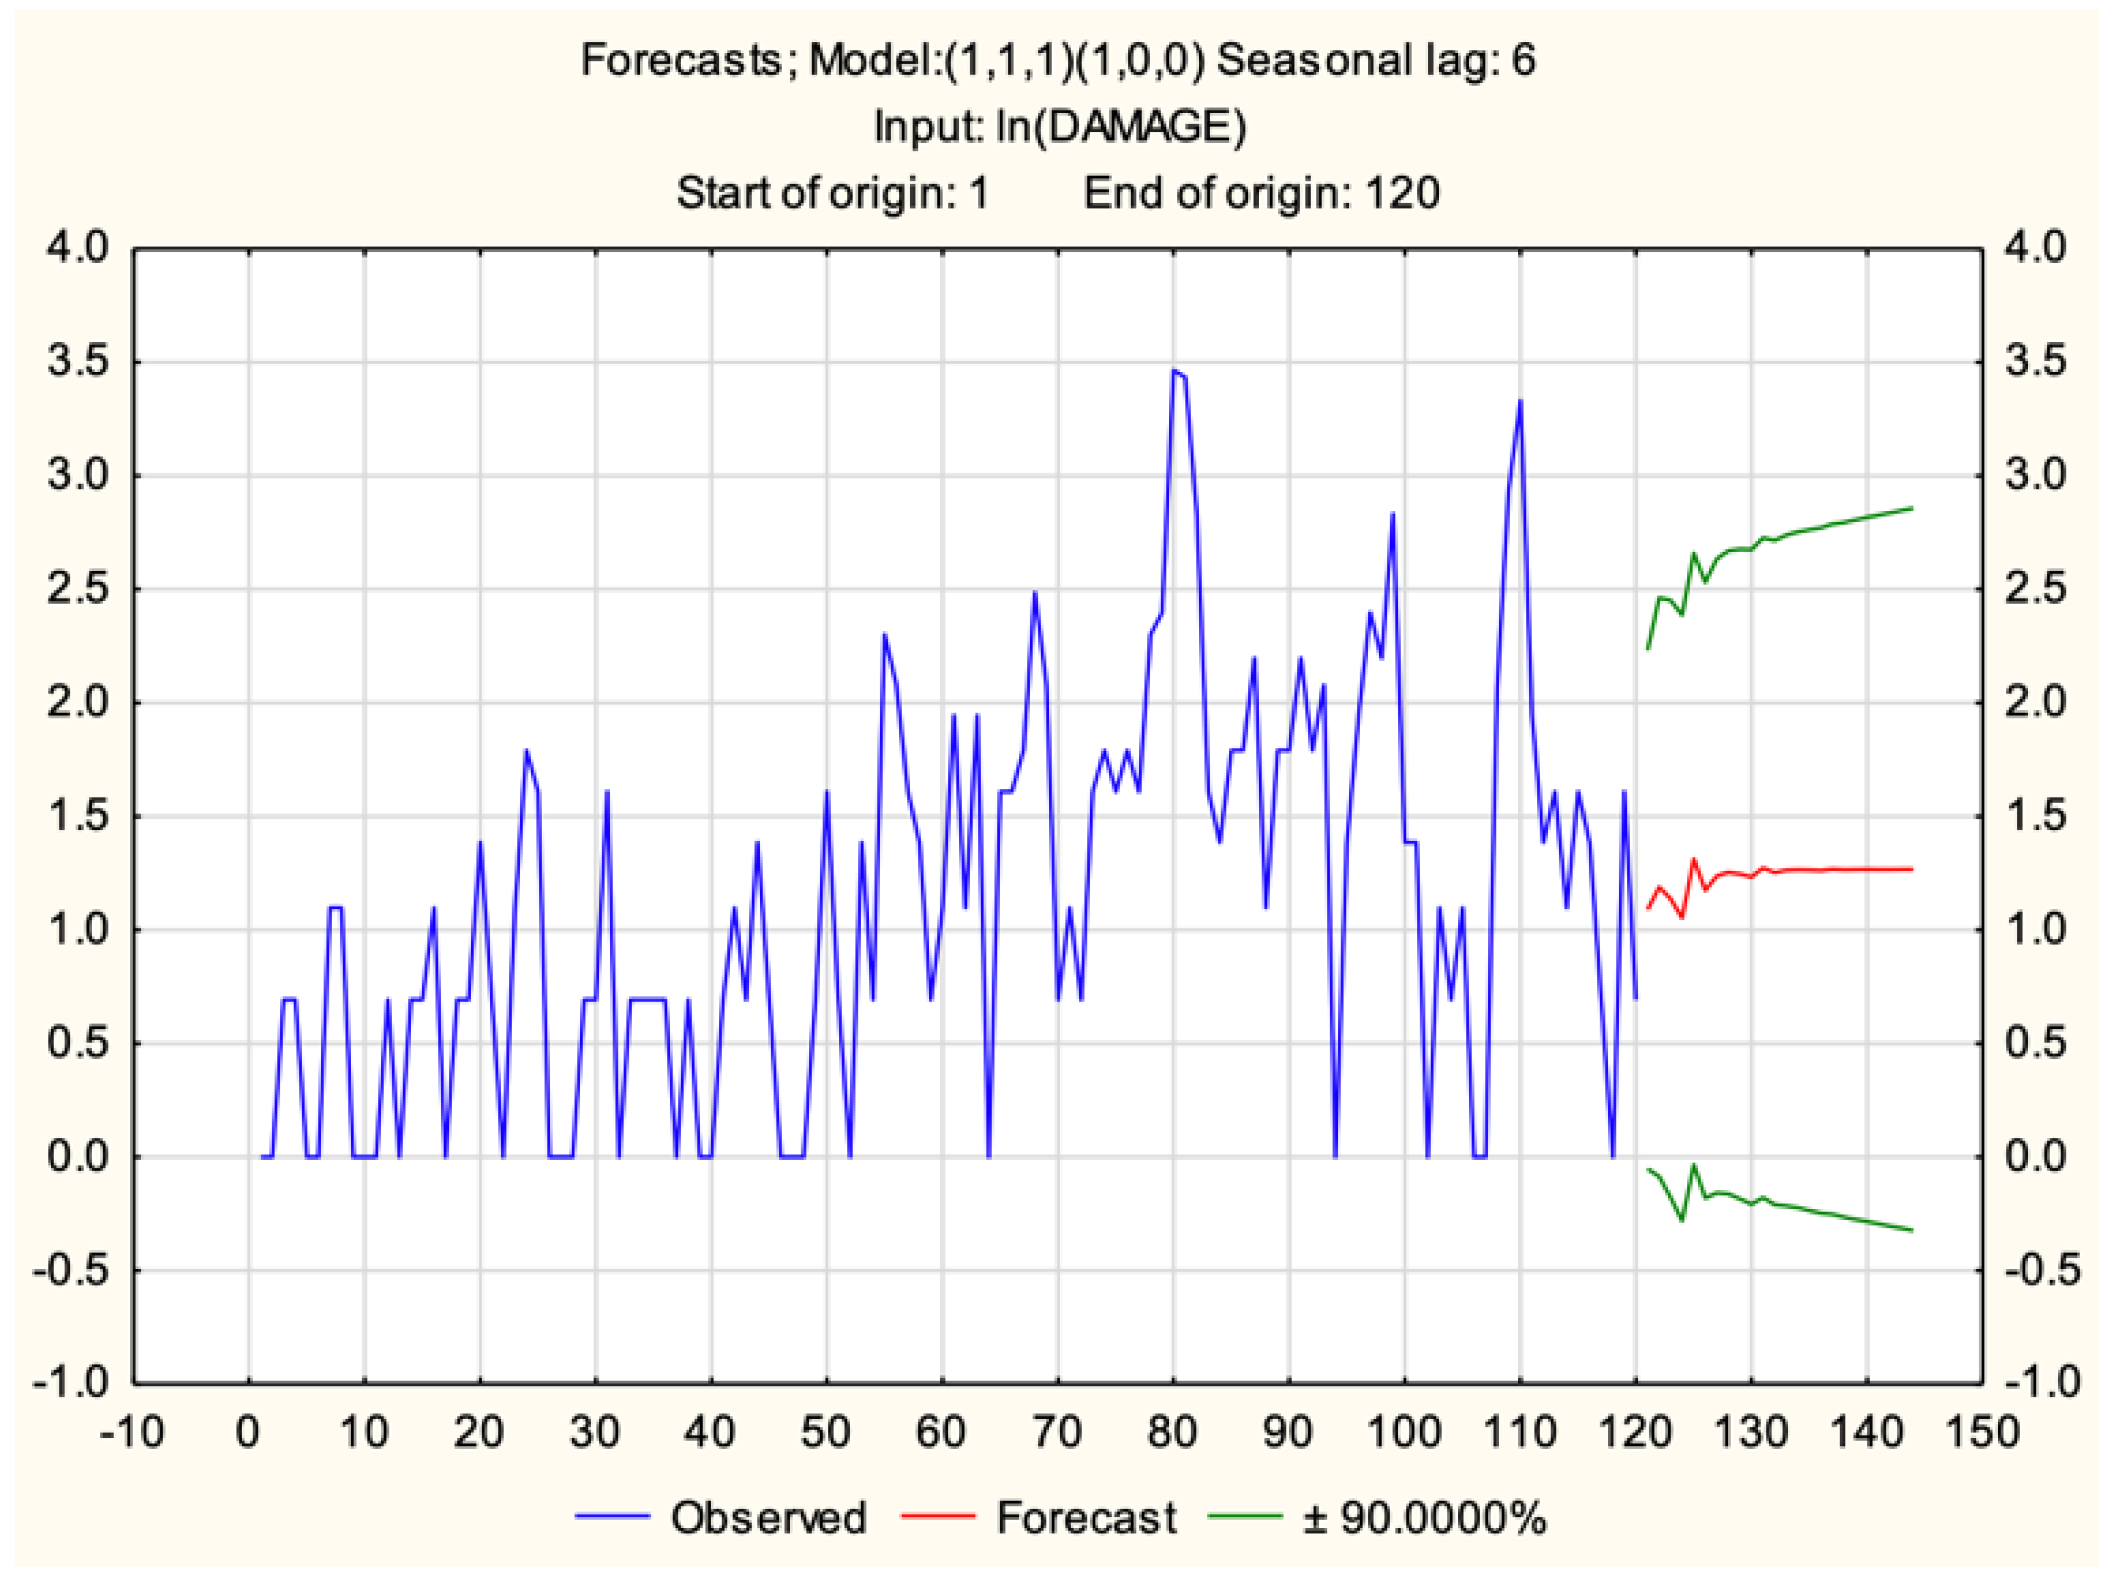
Figure 19.
Fruit damage claims scatterplot.
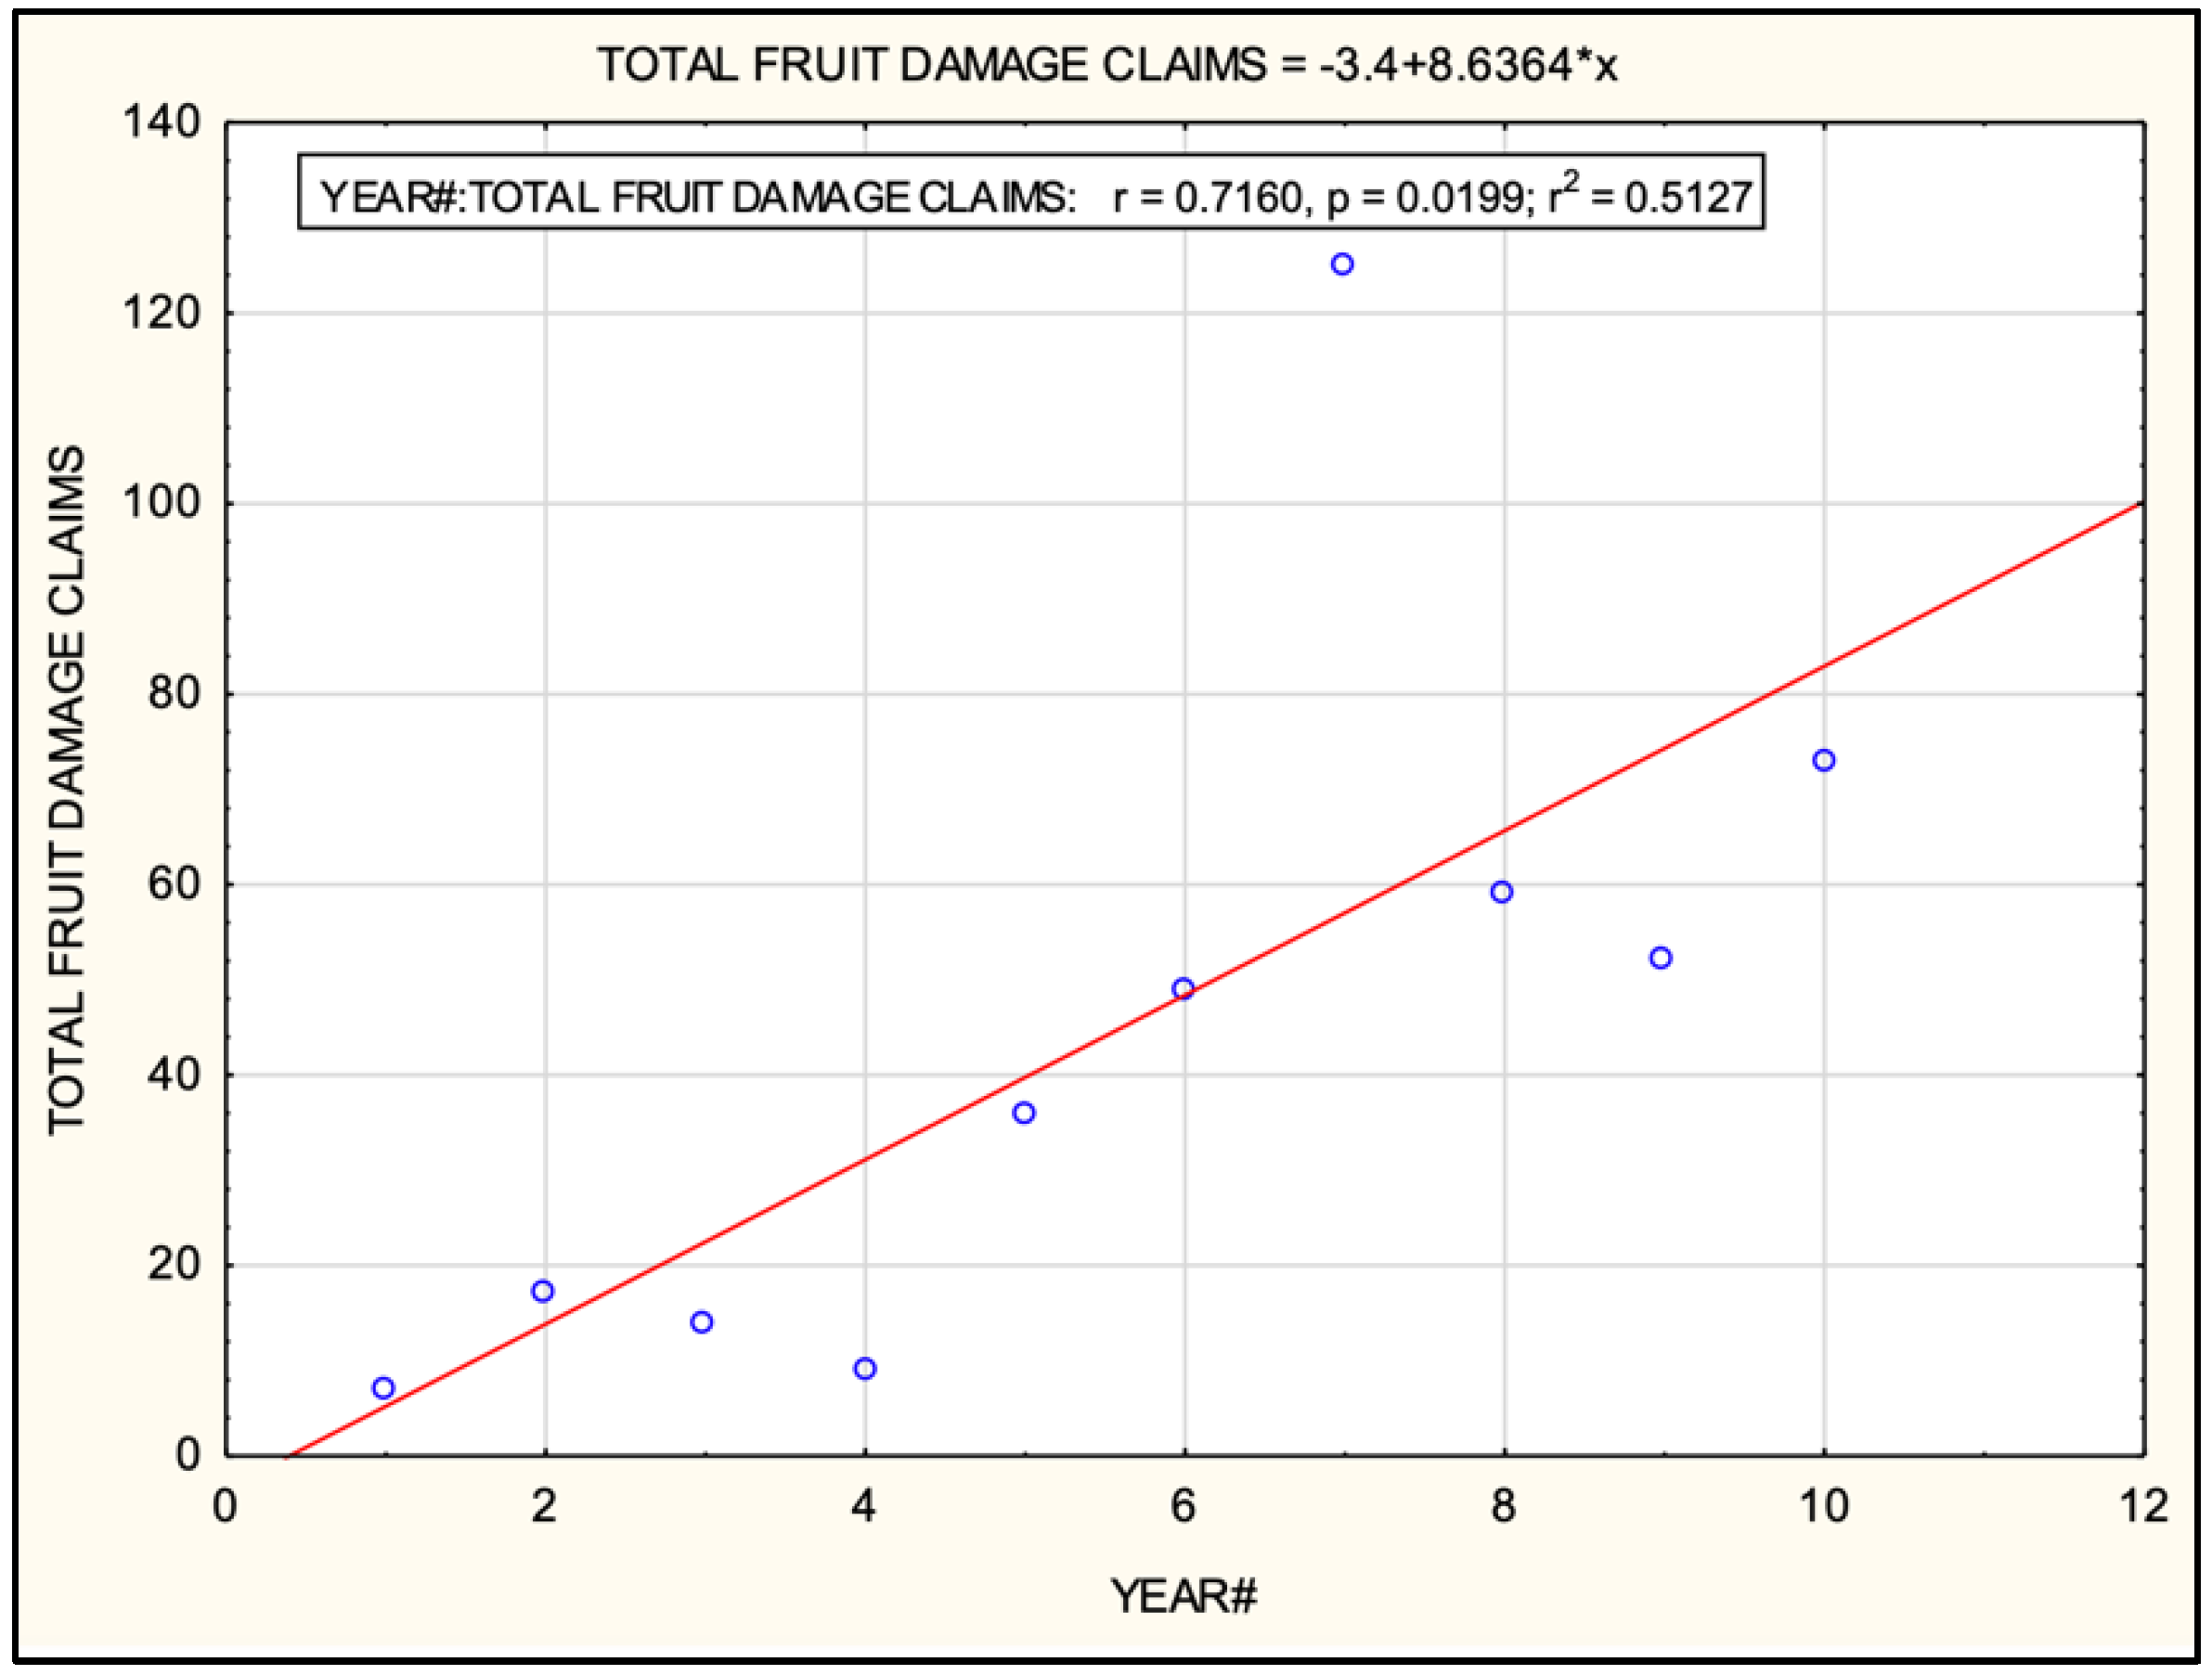
Figure 20.
Predicted versus observed values.

Table 1.
Research questions.
| Research Question | Justification and Potential Contribution | Previous Research |
|---|---|---|
| 1. What type of distribution damage affected fruit over the period under investigation? | By identifying the types of fruit damage during distribution, strategies can be developed to minimise these, enhancing supply chain efficiency and food safety. Fewer damages reduce potential exposure to bacteria or other contaminants, ensuring the fruit stays safe for consumption. Furthermore, intact fruits have a longer shelf life, reducing consumers’ chance of purchasing and eating spoiled or nearly spoiled fruit. | A study by [53] shows that reducing physical damage in fruits during transportation significantly decreases the chance of microbial growth, improving food safety. |
| 2. Are certain types of fruit more vulnerable to distribution damage than others? | Recognising more vulnerable types of fruit allows farmers and cold chain operators to adapt their practices to minimise damage, enhancing food safety. Reduced fruit damage means less exposure to contaminants and a lower risk of spoilage. This leads to safer, healthier food reaching the consumer, and the increased shelf life also reduces the likelihood of the consumer unknowingly purchasing and consuming spoiled fruit. | Research by [54] has shown that understanding the unique vulnerabilities of different fruit types and modifying farming and handling practices accordingly can significantly decrease post-harvest losses and enhance food safety. |
| 3. Is there a seasonal pattern in fruit damage claims? | A better understanding of seasonal patterns can help ensure food safety by allowing for better resource allocation during high-risk seasons, reducing potential damage and contamination. This could also lead to formulating policies or guidelines regarding handling, storing and transporting fruits during these seasons, further safeguarding food quality and safety. | The Food and Agriculture Organization of the United Nations [55] has demonstrated that recognising and responding to seasonal trends in agricultural yield and associated damage claims can notably boost food safety and overall quality. Farmers, processors, distributors and consumers can effectively plan ahead by leveraging this understanding of seasonal variations. This optimises resource utilisation and mitigates risks, ultimately leading to increased profits. This proactive approach grounded in seasonal trends significantly contributes to advancing food safety standards and improving quality in the agricultural sector. |
| 4. How can historical damage claims data be used to forecast future damage claims? | Accurate forecasting enables better planning and preparedness, thus minimising potential disruptions to the supply chain that could compromise food safety. For instance, early actions can be taken to ensure supply continuity and food quality preservation if there is an anticipated shortage or issue. Moreover, having a predictive model enables more robust risk management strategies to mitigate potential food safety risks. | A study by [56] has shown that predictive modelling based on historical data can effectively enhance food safety by enabling proactive measures and comprehensive risk management strategies. |
Table 2.
Sample master dataset.
| Date of Loss | Description | Damage | Fruit |
|---|---|---|---|
| 1 February 2013 | Vehicle overturned—glassware—Veh reg:XYZ123 | - | - |
| 2 March 2014 | Damages to cntnr XYZ—oranges as result of delay/congestion at port—severe storms ex vessel XYZ | storm; delay; damage | orange |
| 3 April 2015 | Damages to fresh oranges and lemons in cntnrs ABC&XYZ—delay in transit ex vessel ABC | delay; damage | orange; lemon |
Table 3.
Fruit damage claims as a percentage of Company A + B’s total claims (data and heat map).
| Year | 2013 | 2014 | 2015 | 2016 | 2017 | 2018 | 2019 | 2020 | 2021 | 2022 |
|---|---|---|---|---|---|---|---|---|---|---|
| All claims | 1693 | 1762 | 1836 | 1622 | 1729 | 1759 | 1759 | 1686 | 2042 | 1839 |
| Fruit damage claims | 7 | 17 | 14 | 9 | 36 | 49 | 125 | 59 | 52 | 73 |
| Percentage of claims | 0.4% | 1.0% | 0.8% | 0.6% | 2.1% | 2.8% | 7.1% | 3.5% | 2.5% | 4.0% |
Key: Green = lowest; Yellow = lower-middle; Orange = upper-middle; Red = highest values.
Table 4.
Indexed distribution of claims by category over the years (data and heat map). Source: SARS (2023).
Table 4.
Indexed distribution of claims by category over the years (data and heat map). Source: SARS (2023).
| Number of Claims | 2013 | 2014 | 2015 | 2016 | 2017 | 2018 | 2019 | 2020 | 2021 | 2022 | Total Claims by Type |
|---|---|---|---|---|---|---|---|---|---|---|---|
| damage | 4 | 14 | 11 | 8 | 22 | 38 | 99 | 42 | 33 | 49 | 320 |
| delay | 2 | 1 | 1 | 1 | 4 | 5 | 10 | 6 | 8 | 15 | 53 |
| temperature | 1 | 2 | 2 | 0 | 10 | 6 | 16 | 11 | 11 | 9 | 68 |
| Annual total | 7 | 17 | 14 | 9 | 36 | 49 | 125 | 59 | 52 | 73 | 441 |
| Factor to normalise for volume | 100 | 104 | 107 | 107 | 117 | 121 | 150 | 130 | 145 | 150 | - |
| Heatmap (after normalization) | 2013 | 2014 | 2015 | 2016 | 2017 | 2018 | 2019 | 2020 | 2021 | 2022 | |
| damage | 1% | 4% | 3% | 2% | 6% | 10% | 21% | 10% | 7% | 10% | - |
| delay | 4% | 2% | 2% | 2% | 6% | 8% | 13% | 9% | 10% | 19% | - |
| temperature | 1% | 3% | 3% | 0% | 13% | 7% | 16% | 12% | 11% | 9% | - |
| Annual total % | 2% | 4% | 3% | 2% | 7% | 9% | 19% | 10% | 8% | 11% | - |
(Green = lowest; Yellow = lower-middle; Orange = upper-middle; Red = highest values).
Table 5.
Indexed distribution of claims by fruit group over the years (data and heat map). Source: [57].
Table 5.
Indexed distribution of claims by fruit group over the years (data and heat map). Source: [57].
| Number of Claims | ||||||||||||
| Group | Fruit | 2013 | 2014 | 2015 | 2016 | 2017 | 2018 | 2019 | 2020 | 2021 | 2022 | Group total |
| citrus fruit | citrus; clementines; grapefruits; lemons; mandarins; oranges | 2 | 6 | 4 | 2 | 13 | 12 | 66 | 17 | 6 | 4 | 132 |
| grapes | table grapes | 1 | 2 | 2 | 0 | 3 | 9 | 13 | 20 | 27 | 50 | 127 |
| other fruit | litchis; mangos pineapples; other | 4 | 3 | 3 | 2 | 11 | 16 | 40 | 15 | 10 | 16 | 120 |
| pome fruit | apples; pears | 0 | 1 | 4 | 5 | 6 | 10 | 5 | 7 | 5 | 2 | 45 |
| stone fruit | nectarines; peaches; plums | 0 | 5 | 1 | 0 | 3 | 2 | 1 | 0 | 4 | 1 | 17 |
| Annual total | 7 | 17 | 14 | 9 | 36 | 49 | 125 | 59 | 52 | 73 | 441 | |
| Factor to normalise for volume | ||||||||||||
| Group | Fruit | 2013 | 2014 | 2015 | 2016 | 2017 | 2018 | 2019 | 2020 | 2021 | 2022 | |
| citrus fruit | citrus; clementines; grapefruits; lemons; mandarins; oranges | 100 | 100 | 102 | 97 | 109 | 123 | 120 | 140 | 147 | 146 | - |
| grapes | table grapes | 100 | 96 | 116 | 139 | 150 | 177 | 126 | 149 | 153 | 192 | - |
| other fruit | litchis; mangos pineapples; other | 100 | 201 | 187 | 168 | 220 | 111 | 730 | 41 | 225 | 111 | |
| pome fruit | apples; pears | 100 | 92 | 100 | 108 | 108 | 103 | 106 | 122 | 118 | 155 | - |
| stone fruit | nectarines; peaches; plums | 100 | 104 | 102 | 99 | 100 | 90 | 81 | 85 | 133 | 152 | - |
| Heatmap | ||||||||||||
| Group | Fruit | 2013 | 2014 | 2015 | 2016 | 2017 | 2018 | 2019 | 2020 | 2021 | 2022 | |
| citrus fruit | citrus; clementines; grapefruits; lemons; mandarins; oranges | 2% | 5% | 3% | 2% | 9% | 7% | 42% | 9% | 3% | 2% | - |
| grapes | table grapes | 1% | 2% | 1% | 0% | 2% | 4% | 8% | 11% | 14% | 21% | - |
| other fruit | litchis; mangos pineapples; other | 3% | 1% | 1% | 1% | 4% | 12% | 5% | 31% | 4% | 12% | - |
| pome fruit | apples; pears | 0% | 2% | 9% | 10% | 12% | 22% | 10% | 13% | 9% | 3% | - |
| stone fruit | nectarines; peaches; plums | 0% | 28% | 6% | 0% | 18% | 13% | 7% | 0% | 18% | 4% | - |
(Green = lowest; Yellow = lower-middle; Orange = upper-middle; Red = highest values).
Table 6.
Seasonal trends in claims as a percentage of Company A + B’s total claims (heat map).
| Year | 2013 | 2014 | 2015 | 2016 | 2017 | 2018 | 2019 | 2020 | 2021 | 2022 |
|---|---|---|---|---|---|---|---|---|---|---|
| Jan | 0% | 0% | 1% | 0% | 0% | 2% | 2% | 3% | 4% | 7% |
| Feb | 0% | 1% | 0% | 1% | 2% | 1% | 4% | 3% | 6% | 11% |
| Mar | 1% | 1% | 0% | 0% | 1% | 4% | 2% | 7% | 11% | 4% |
| Apr | 1% | 1% | 0% | 0% | 0% | 0% | 3% | 4% | 2% | 1% |
| May | 0% | 0% | 1% | 1% | 2% | 3% | 4% | 4% | 3% | 2% |
| Jun | 0% | 1% | 1% | 1% | 1% | 3% | 7% | 4% | 0% | 1% |
| Jul | 1% | 1% | 3% | 1% | 8% | 4% | 8% | 5% | 1% | 3% |
| Aug | 1% | 2% | 0% | 2% | 6% | 7% | 19% | 5% | 1% | 2% |
| Sep | 0% | 1% | 1% | 1% | 3% | 6% | 22% | 5% | 1% | 1% |
| Oct | 0% | 0% | 1% | 0% | 1% | 1% | 12% | 0% | 0% | 0% |
| Nov | 0% | 1% | 1% | 0% | 1% | 1% | 3% | 2% | 0% | 4% |
| Dec | 1% | 3% | 1% | 0% | 1% | 1% | 2% | 4% | 3% | 2% |
(Green = lowest; Yellow = lower-middle; Orange = upper-middle; Red = highest values).
Table 7.
Sarima (1,1,1)(1,0,0)6 model fit results.
| Paramet. | Param. | Asympt. Std.Err. | Asympt. t (116) | p | Lower 95% Conf | Upper 95% Conf |
|---|---|---|---|---|---|---|
| p(1) | 0.420922 | 0.099966 | 4.22333 | 0.000048 | 0.223521 | 0.618323 |
| q(1) | 0.924597 | 0.037381 | 24.73419 | 0 | 0.850558 | 0.998635 |
| Ps(1) | 0.155226 | 0.101211 | 1.53369 | 0.127828 | −0.045235 | 0.355687 |
Table 8.
SARIMA forecasts of fruit damage claims.
| Case No. | Forecast | Lower 90.00% | Upper 90.00% | Std.Err. | Forc Damage |
|---|---|---|---|---|---|
| 121 | 1.089763 | −0.051843 | 2.231369 | 0.688504 | 3.97357031 |
| 122 | 1.188694 | −0.08579 | 2.463177 | 0.768643 | 4.28279004 |
| 123 | 1.137321 | −0.177845 | 2.452486 | 0.793178 | 4.11840216 |
| 124 | 1.053391 | −0.280497 | 2.387279 | 0.80447 | 3.86735794 |
| 125 | 1.313179 | −0.032775 | 2.659134 | 0.811747 | 4.71797542 |
| 126 | 1.17514 | −0.180502 | 2.530781 | 0.817589 | 4.23859528 |
| 127 | 1.23847 | −0.157086 | 2.634026 | 0.841662 | 4.45032979 |
| 128 | 1.254569 | −0.161292 | 2.670431 | 0.853908 | 4.5063278 |
| 129 | 1.246908 | −0.183012 | 2.676827 | 0.862386 | 4.47956587 |
| 130 | 1.234011 | −0.207651 | 2.675673 | 0.869469 | 4.43497983 |
| 131 | 1.274392 | −0.178063 | 2.726848 | 0.875978 | 4.57652776 |
| 132 | 1.252988 | −0.209833 | 2.71581 | 0.88223 | 4.500789 |
| 133 | 1.262829 | −0.213618 | 2.739275 | 0.890447 | 4.53540793 |
| 134 | 1.265332 | −0.222754 | 2.753417 | 0.897467 | 4.54426883 |
| 135 | 1.264144 | −0.234753 | 2.763041 | 0.903987 | 4.54006227 |
| 136 | 1.262143 | −0.247187 | 2.771473 | 0.910279 | 4.53298519 |
| 137 | 1.268412 | −0.251155 | 2.787979 | 0.916453 | 4.55520148 |
| 138 | 1.265089 | −0.264594 | 2.794773 | 0.922554 | 4.54340948 |
| 139 | 1.266617 | −0.273588 | 2.806821 | 0.9289 | 4.54882629 |
| 140 | 1.267006 | −0.283392 | 2.817403 | 0.935047 | 4.55020557 |
| 141 | 1.266821 | −0.293595 | 2.827238 | 0.94109 | 4.54955122 |
| 142 | 1.266511 | −0.303817 | 2.836838 | 0.947067 | 4.54844881 |
| 143 | 1.267484 | −0.312675 | 2.847642 | 0.952996 | 4.5519033 |
| 144 | 1.266968 | −0.322952 | 2.856888 | 0.958883 | 4.550072 |
Table 9.
Regression summary statistics. * = standardized beta coefficient.
| Regression Summary for Dependent Variable: TOTAL FRUIT DAMAGE CLAIMS R = 7.1600293 R2 = 5.1266020 Adjusted R2 = 4.5174272 F(1,8)=8.4157 p < 0.01986 Std.Error of estimate: 27.040 | ||||||
| N = 10 | b* | Std.Err. of b* | b | Std.Err. of b | t(8) | p-Value |
| Intercept | −3.4000 | 18.4721 | −0.18 | 0.86 | ||
| Year# | 0.72 | 0.25 | 8.6364 | 2.9771 | 2.90 | 0.02 |
Table 10.
Forecasted fruit damage claims.
| Year | Damages | Type |
|---|---|---|
| 2013 | 7 | Observed |
| 2014 | 17 | Observed |
| 2015 | 14 | Observed |
| 2016 | 9 | Observed |
| 2017 | 36 | Observed |
| 2018 | 49 | Observed |
| 2019 | 125 | Observed |
| 2020 | 59 | Observed |
| 2021 | 52 | Observed |
| 2022 | 73 | Observed |
| 2023 | 94 | Forecasted |
| 2024 | 102 | Forecasted |
| 2025 | 111 | Forecasted |
| 2026 | 119 | Forecasted |
| 2027 | 128 | Forecasted |
Disclaimer/Publisher’s Note: The statements, opinions and data contained in all publications are solely those of the individual author(s) and contributor(s) and not of MDPI and/or the editor(s). MDPI and/or the editor(s) disclaim responsibility for any injury to people or property resulting from any ideas, methods, instructions or products referred to in the content. |
© 2023 by the authors. Licensee MDPI, Basel, Switzerland. This article is an open access article distributed under the terms and conditions of the Creative Commons Attribution (CC BY) license (https://creativecommons.org/licenses/by/4.0/).
Share and Cite
MDPI and ACS Style
du Plessis, F.; Goedhals-Gerber, L.L.; van Eeden, J. Forecasting Fruit Export Damages and Enhancing Food Safety through Risk Management. Sustainability 2023, 15, 15216. https://doi.org/10.3390/su152115216
AMA Style
du Plessis F, Goedhals-Gerber LL, van Eeden J. Forecasting Fruit Export Damages and Enhancing Food Safety through Risk Management. Sustainability. 2023; 15(21):15216. https://doi.org/10.3390/su152115216
Chicago/Turabian Styledu Plessis, Francois, Leila Louise Goedhals-Gerber, and Joubert van Eeden. 2023. "Forecasting Fruit Export Damages and Enhancing Food Safety through Risk Management" Sustainability 15, no. 21: 15216. https://doi.org/10.3390/su152115216
Note that from the first issue of 2016, this journal uses article numbers instead of page numbers. See further details here.