
Supply Chain Simulation of Manufacturing Shirts Using System Dynamics for Sustainability


School of Design and Engineering, Kanbar College, Thomas Jefferson University, Philadelphia, PA 19144, USA
*
Authors to whom correspondence should be addressed.
Sustainability 2023, 15(21), 15353; https://doi.org/10.3390/su152115353
Submission received: 10 October 2023
/
Revised: 19 October 2023
/
Accepted: 25 October 2023
/
Published: 27 October 2023
Abstract
:In supply chain management (SCM), goods and services flow from the raw materials stage to the end user with complexities and uncertainty at each stage. Computer modeling and simulation is a particularly useful method to examine supply chain operational issues because it can solve operational complexities that are challenging and time consuming to analyze. Manufacturing companies fear losing valuable time and assets during the manufacturing process; the inaccurate estimation of raw materials, human capital, or physical infrastructure not only leads to monetary loss for the manufacturing unit, but also has a detrimental effect on the environment. The purpose of this paper is to demonstrate that system dynamics modeling (SDM) in sustainable supply chain management (SSCM) can be applied to apparel manufacturing to optimize materials, labor, and equipment usage. Utilizing system dynamics (SD), the manufacturing unit can improve sustainability by reducing materials, labor, and equipment usage, which in turn reduces energy use. In our literature review, we did not identify any study addressing supply chain simulation of the manufacturing of shirts using SDM. We chose shirt manufacturing to demonstrate the model because of its relatively simple manufacturing process. In our study, we conclude that SDM simulation is an efficient way to optimize materials, labor, and equipment in apparel manufacturing. This leads to a more sustainable manufacturing process, as the model simulates different manufacturing supply chain scenarios in a risk-free environment, thereby minimizing waste and resources. Further, the outputs from the STELLA® model can be used as inputs into a subsequent life cycle assessment (LCA) model to determine the quantitative environmental impacts.
1. Introduction
System dynamics modeling (SDM) is a powerful tool and computer-aided simulation technique that can be applied to frame, understand, and discuss complex problems [1,2]. First called industrial dynamics [3], SDM was developed in the mid-1950s by Professor Jay W. Forrester at the Massachusetts Institute of Technology [3,4]. SDM originates from management and control engineering; this approach involves analyzing complex physical, biological, and social systems from the perspective of feedback and delays [5,6].
SDM starts with specifying the scope and boundary of the problem and then maps the problem in a visual environment as an interacting systems model that, through a visual programming protocol, can be used to execute quantitative simulations of different scenarios [7].
Supply chain management (SCM) involves managing the flow of goods and/or services from the material stage to the end user [8,9,10,11,12,13]. A well-designed SCM system delivers high-quality goods and services efficiently and reliably. It can be difficult to create an efficient supply chain due to uncertainties and variabilities in materials flow, labor, and equipment availability. To resolve this, managers must understand the causes and impacts of these uncertainties and variabilities and work to reduce or eliminate them. The tools currently available for analyzing uncertainty are based on traditional mathematical approaches, such as single-parameter or local sensitivity analyses [14] that do not take variability into account. Since simulations can cope with variability, they are crucial for analyzing supply chains. In SCM, companies can use computer simulations to study operational problems that are difficult to model or solve analytically. Through simulation, companies can analyze how an innovative inventory system, such as just-in-time (JIT), would perform and how much it would cost without implementing it [15].
Many countries rely heavily on the apparel manufacturing industry to contribute to their national economies [16,17]. Although it is truly global in nature [18], it is plagued with several sustainability problems [19,20,21]. Excessive water and energy consumption, chemical usage, waste generation, poor labor conditions, and a lack of supply chain transparency all contribute to the environmental and social impacts of the industry. These issues pose serious challenges for the industry and call for immediate attention and action. To create an ethical and sustainable apparel manufacturing process, these issues must be addressed [22,23,24].
To address and improve sustainability and efficiency in apparel manufacturing, identifying the factors leading to a low input–output ratio and high energy consumption in the manufacturing industry is essential. These factors include inefficient production techniques, poor SCM, inadequate energy management systems, material waste and inefficiency, a lack of employee training and awareness, and the absence of sustainable practices. By addressing these factors and implementing appropriate measures, manufacturers can improve their input–output ratio and reduce energy consumption, leading to a more efficient and sustainable manufacturing process [25,26,27,28].
Increased globalization of the apparel industry has led to many sustainable supply chain management issues. The sustainability of the supply chain in apparel manufacturing is heavily influenced by uncertainty and variability. To ensure that the entire process runs smoothly, understanding the influence of uncertainty and variability on supply chain sustainability is essential. Uncertainty refers to the lack of predictability or knowledge about future events, while variability represents the degree of change or inconsistency in processes. In the context of the supply chain, both uncertainty and variability can arise from factors such as demand fluctuations, supply disruptions, price volatility, and changing consumer preferences. Uncertainty and variability in the supply chain can significantly affect environmental, social, and economic sustainability efforts. Managing uncertainty effectively through accurate demand forecasting, efficient transportation planning, and strong supplier relationships is crucial for sustainability. Minimizing variability through robust quality control measures, efficient manufacturing processes, and waste reduction strategies also play a vital role. By addressing these challenges, the apparel manufacturing industry can enhance its supply chain sustainability and contribute to a more sustainable future [29,30,31,32,33,34].
Apparel manufacturing in SDM models embodies various characteristics that prioritize sustainability, efficiency, and responsibility. Through an integrated supply chain, sustainable materials, energy efficiency, waste reduction, ethical labor practices, and technology adoption, manufacturers can create a more sustainable and responsible manufacturing process [34,35,36].
While there are many issues that impact the apparel manufacturing supply chain as mentioned above, the focus of this paper is to demonstrate how SDM can be used as a decision-making tool to make sustainable decisions in shirt manufacturing when confronted with dynamic systems. Due to its relatively simple manufacturing process, we chose shirt manufacturing as the example, with a focus on optimizing material flow, labor, and equipment utilization throughout the process. We built an SDM model using STELLA® (Systems Thinking, Experimental Learning Laboratory with Animation) to model the supply chain manufacturing of shirts. To optimize material flow, labor, and equipment utilization, we ran simulations comparing the initial and optimal scenarios to demonstrate the sustainability benefits.
To demonstrate how this model can impact supply chain sustainability, we optimized the initial scenario and achieved a 14% decrease in fabric utilization, and a 33% decrease in equipment usage. This scenario led to a more sustainable supply chain, with a 24% increase in shipped products, while decreasing material inventory buildup by a factor of 3.5 over 15 days.
This paper is structured as follows. In Section 2, the study is justified, and its intended contribution is outlined, including a literature review and SDM approaches in sustainable supply chain management (SSCM). In Section 3, we outline the hypothesis and research questions in this study. In Section 4, we discuss the materials and methods used in this study. In Section 5, the simulation results are shown and then discussed in Section 6. The paper ends with conclusions and opportunities for future research also in Section 6.
2. Literature Review
This literature review focuses on system dynamics modeling, including its use for supply chain management and sustainable supply chain management. These sections are followed by a review of sustainable supply chain management in apparel manufacturing, and the use of system dynamics modeling in apparel manufacturing supply chains. The last subsection identifies the research gap and presents our proposed contribution.
2.1. System Dynamics Modeling and Its Applications in Supply Chain Management
SDM was originally developed in the context of SCM, but it has a broad range of applications. SDM is now used in both the public and private sectors to help analyze and design policies [3]. It is used in policy development and organizational planning [4,12], public policy and management [13], behavioral economics [14], dynamics with complex nonlinearities [15], modeling in biology and medicine [16], natural and social science theory development [17], energy and the environment [18], dynamic decision-making processes [19], software development/engineering [20], and supply chain management [21,22,23]. This approach applies to complex problems in managerial, social, ecological, or economic systems; in fact, it applies to any dynamic system characterized by interconnection, mutual dependence, information flow, and circularity [6].
Through system dynamics (SD) models, various aspects of business operations [24,25] have been studied, such as strategic management [26], the management of manufacturing resources and capabilities [25,27], and marketing capabilities [28].
Recently, SDM has re-emerged in SCM after a prolonged period of dormancy. Recent research on SDM in SCM centers on inventory management and policies, time efficiency, demand augmentation, supply chain planning and implementation, and global supply chain management [2].
Several different conceptual frameworks and models for analysis have been proposed recently for SCM [37]. SDM has been used rarely in those frameworks and models, but given supply chain complexity, it has recently gained popularity [38]. Supply chains include numerous actors who organize the flow of materials and goods by sharing information. A supply chain system’s dynamic behavior is determined by various factors, including uncertainties in customer demand, multiple suppliers, various logistic routes, and different inventory methods. Supply chains are governed by uncertainty; therefore, SD simulations are helpful [38,39].
Over the last two decades, SD simulation has gained more attention as a tool for analyzing SCM. Forrester [3] initiated SD modeling to simulate production–distribution system interactions, among various supply chain actors. In complex SD models, variables are linked by nonlinear relationships, and feedback loops lead to uncertain system behavior [40]. Angerhofer and Angelides [5] developed categories of SD models for inventory management, amplification of demand, supply chain redesign, and international SCM. The authors examined these areas from the perspective of identifying and solving problems, and enhancing modeling approaches by providing exemplar models and studies that illustrated the applicability of SD to decision-making [5].
SD is used to model forward and reverse supply chains. In both manufacturing and supply chain-related applications, reverse and closed-loop supply chains are prevalent because SD models are based on feedback loops. Due to the dominant motivation of economic value recovery and not social and environmental objectives, reverse and closed-loop supply chains are not considered sustainable [41,42]. The reverse and closed-loop supply chain may lead to a more sustainable manufacturing approach by restoring financial returns, protecting natural resources, reducing pollution, and considering the social implications of supply chains. Feedback loops in circular economies and closed-loop supply chains require new SSCM requirements [43,44]. To address these challenges, SDM and a system thinking perspective may be beneficial in assisting sustainable decision-making and understanding complex supply chain systems.
2.2. System Dynamics Modeling for Sustainable Supply Chain Management
In SCM, customer and stakeholder requirements arise from the economic, environmental, and social dimensions of sustainable development [8,9,10,11,12]. The SSCM concept combines sustainability and SCM [45,46,47]. As part of a sustainable supply chain, members are expected to meet environmental and social standards, as well as customer needs and related economic requirements, to remain in the chain [48,49,50,51].
The literature on SDM for sustainable operations and SCM is sparse compared to well-known modeling methodologies, such as multi-criteria decision-making (MCDM) or linear optimization. MCDM, also known as multiple-criteria decision analysis (MCDA), entails analyzing various options for an event or area of research, which can encompass a range of subjects, including social sciences, medicine, daily life, engineering, and more [52,53,54,55]. Linear optimization or linear programming is the process of optimizing a linear function, known as the objective function, subject to linear constraints, such as equality or inequality. It is extensively used in theoretical computer science [56,57]. Only a few conference proceedings that exclusively addressed SCM, sustainable manufacturing, or operations, could be determined [58,59,60,61,62], which integrated manufacturing in environmental, financial, and social domains using a broad conceptual approach and SD model. Although the model is not studied in depth, the authors defined key components within each domain and outlined possible flow and stock variables for building the model.
Kibira [58] presented an SD model framework for sustainable manufacturing to facilitate collaboration among researchers across the globe. It identifies four domains of relevant factors in the framework, including social, manufacturing, financial, and environmental. While the model is not analyzed in detail, it lists crucial components within each domain and identifies possible stock and flow variables for the model building. Likewise, Zhang [2] emphasized sustainable manufacturing and proposed a general framework for SD model development that incorporates sustainability metrics, considering the significance of systems thinking in engineering management.
Wofuru-Nyenke [63] presented an approach to classifying manufacturing supply chain models by categorizing them into simulation models, hybrid models, mathematical models, and variations [63]. The study found that while simulation models and hybrid models have increased in use, mathematical models are used more for modeling sustainable manufacturing supply chains.
2.3. Sustainable Supply Chain Management in Apparel Manufacturing
It is particularly crucial to implement SSCM in the apparel manufacturing industry, which is highly labor intensive, uses materials with environmental effects, and relies heavily on global sourcing [64,65,66,67]. Therefore, SSCM in the apparel manufacturing industry is a crucial area of research for both industry and academia [68,69]. SSCM issues in the apparel industry often center on corporate social responsibility [70,71,72], wages, fair treatment, workplace safety [73,74,75], carbon footprints [76], sustainable partnerships [77], sustainability education [78], and forecasting accuracy [79]. These issues have been studied from operational management [35,80,81,82,83,84] and strategic management [85,86,87,88] perspectives.
Manufacturing in apparel supply chains generates challenges, including energy and resources usage, labor rights, and waste creation. The literature has extensively explored sustainability in the manufacturing process. Pineda-Henson [89] explored green productivity to improve resource efficiency and waste reduction in sustainable manufacturing. The authors found that water consumption, energy consumption, and land ecotoxicology played key roles in green productivity [89]. Ghazinoory [90] explored the implementation of a clean manufacturing approach in Iran for the promotion of industrial sustainability. This research found that the apparel industry is most in need of cleaner production practices [90]. Jin Gam [91] presented a “cradle-to-cradle apparel design” approach for sustainable apparel manufacturing. Using the proposed model, the authors demonstrated colorfastness and reliable function [91].
Jordeva found that most apparel cutting waste generated during apparel manufacturing in Macedonia is disposed of in landfills and identified a lack of investment in recycling infrastructure [92]. Wickramasinghe studied manufacturing issues in the apparel manufacturing industry and found that cost reduction and quality enhancement were positive effects of total productive maintenance [93]. Pinheiro examined the textile solid waste generated in the garment manufacturing industry in Brazil and suggested reusing raw materials for sustainability [94]. Van der Velden used social life cycle assessment (S-LCA) to analyze the production system in apparel supply chains. According to the author, the S-LCA considers five social issues: wage standards, child labor, poverty, working hours, and health and safety issues [95]. Hirscher offered a consumer-engaged design strategy, which aims to engage consumers in social manufacturing through participatory design [96].
2.4. System Dynamics Modeling for Supply Chain Management in Apparel Manufacturing
SDM in apparel SCM is rarely used. We only identified a few papers using SDM in apparel manufacturing supply chains.
Bala [97] used an SDM of supply chains in the ready-made garment (RMG) industry in Bangladesh for policy analysis and simulated it for the sustainable shipment of garments. The study concluded that the proposed model can be efficiently applied to developing policy scenarios. It can also be used to create a better supply chain approach for sustainable growth for RMGs and to optimize the model for further research in the future [97]. Issa [98] examined the performance of the apparel supply chain involving mass customization, using an SDM. This study showed that, under mass customization, the various products, lead times, return policies, and quality levels had a significant impact on supply chain profitability [98]. Wilson [83] examined the role that the government can play, through its industrial policy, in enhancing competitiveness in apparel manufacturing in Trinidad and Tobago. Using SDM and simulation to analyze data for vertical policies, the study found that three interrelated elements affected apparel manufacturing: the market, apparel products, and productive resources [99].
Mehrjoo examined the fast fashion apparel industry because of its features, including products with a short life cycle, fluctuating demand, uncertainty, impulse buying, high competition for price, and global sourcing. To analyze the fast fashion apparel industry’s behavior and relationships, an SDM was developed for investigating the relationships and behavior of the fast fashion apparel industry with the supply chain [100]. Lidia [101] constructed a supply chain model for a small and medium-sized enterprise in Indonesia by utilizing SD. The purpose of using SD was to introduce a decision support system, which helped management to determine the most effective business strategies [101]. Corinna Cagliano [102] employed SD to simulate the warehouse operations of a leading fast fashion vertical retailer. The author demonstrated case scenario simulations of how warehouse policies can be defined to increase efficiency, reduce costs, reduce inventory, and reduce lead times [102].
Haddad [103] provided a case study on lean implementation at a garment manufacturer in Lebanon. The author constructed an SD model of the production process to simulate the long-term effects of complementary lean techniques on system performance, and concluded that SD models can be used as decision-making tools to mitigate undesirable impacts and ensure the sustainability of lean initiatives over time [103].
2.5. Identified Research Gap and the Study’s Proposed Contribution
The research gap identified in this literature review is that SDM in SCM is rarely used as a sustainability decision-making tool in apparel manufacturing. We identified a few papers that use SDM in the apparel manufacturing industry, in general. We did not identify any study specifically addressing supply chain simulation of sustainable manufacturing of apparel using SDM. To the best of our knowledge, our paper is the first to use SDM to simulate a supply chain for apparel manufacturing to make it more sustainable. Since apparel manufacturing is unavoidably accompanied by waste generation [67,104,105], our paper contributes by demonstrating how SDM can be used as a decision-making tool to make sustainable decisions in apparel manufacturing.
3. Hypothesis and Research Questions
Our hypothesis is that SDM in SSCM is an efficient way to optimize materials, labor, and equipment in apparel manufacturing. Furthermore, we hypothesize that this would lead to a more sustainable manufacturing process.
RQ1:
Can STELLA® be used to model shirt manufacturing supply chains?
RQ2:
Does the model allow for the simulation of the shirt manufacturing supply chain?
RQ3:
Can these simulations be used to optimize material, labor, and equipment usage?
RQ4:
Does the simulation output inform the development of a more sustainable supply chain management strategy?
4. Materials and Methods
4.1. SDM Software
Various SDM software packages are available. The most used software packages are: DYNANO 1.7.6, STELLA® 3.5.0, Powersim Studio 10, and Vensim® 10.1.0. Other products can also be used to construct models, including Anylogic 8.8.4, Goldsim 14.0, Berkeley Madonna 10, and SimGua 3.7 [106]. We chose STELLA® for our study because it offers a balance on the price, ease of use, and strength of the features compared to other software on the market.
STELLA® is a system dynamics software that uses four building blocks: stocks, flows, converters, and connectors (Figure 1). A stock is the measurable quantity of something (e.g., a material, a product, currency, people, etc.) that either grows or depletes over time. A flow is the mechanism by which the stock increases or decreases over time, by flowing the “measurable something” into or out of the stock. A converter takes input data and manipulates or converts them into an output signal that modulates the stocks and flows in a model. A connector (red arrow in Figure 1) allows information to pass between converters, stocks, and flows, to modify parameters in a model. The cloud in Figure 1 indicates the boundary of the system and identifies the scope of the model. Simulations only consider changes within the system boundary of the model.
The steps involved in building a STELLA® model for SCM are:
- Define the objective of the product’s supply chain.
- Establish the project scope by identifying its boundaries, inputs, and outputs.
- Define the functional unit as a specific number of goods produced per day.
- Create the STELLA® model using all four building blocks.
- Add equations with conditional statements to the flow, such as “if_then_else”.
- Create and add initial conditions for each stock and converter.
- Run the model and monitor the stocks and flows for the inputs given (i.e., a given scenario).
- Change the inputs and rerun the model for different scenarios until the material flows and waste are minimized.
4.2. Elements of SDM
Many factors must be considered while building an SDM. Below are the most essential elements:
- Appropriate units of measurement must be specified for each model variable to prevent formulation errors.
- Model equations must have self-consistent units. In other words, the left and right sides of each equation should reduce to the same units.
- All stocks within a flow chain must have the same units of measurement.
- Stocks must be defined with an initial value at time equals zero.
4.3. Supply Chain Model of the Manufacturing Process for Shirts
The SD model in this paper simulates the supply chain and manufacturing process of up to 1000 pieces of shirts that are produced and shipped in one day. Fabric consumption per shirt was chosen as a typical value for manufacturing women’s woven shirts. We chose 1000 pieces per day as an example for ease of calculation. Figure 2 is the SD model using STELLA®, simulating the manufacturing process for a shirt. In this model, fabric and garment fusing is transported into the factory to manufacture a shirt. (Fusing is small strips of fabric that stabilize and support panels of fabric in garment assembly). Fabric and fusing are then cut into pieces for subsequent assembly. In the cutting process, fabric and fusing waste occurs. After the cutting process, fusing is attached to the shirt panels. Tailors or sewing operators make shirts, using sewing machines, from unstitched shirt panels. Afterward, buttons are attached. Finishing department workers attach tags to the shirts. They also trim uncut thread tails, remove stains, and press the shirts. Once the shirts are tagged and finished, they are inspected for quality. Defective shirts are rejected during quality inspection. The shirts that pass the quality inspection are then packed and shipped.
4.4. Development of SDM Converters, Flow Equations, and Stock Equations for This Model
The next step in this model is to generate the equations for all the flows and stocks, along with all the initial values of the converters. This must be conducted for each of the 32 flows, converters, and stocks in this model. To demonstrate this, we isolated one specific stock in Figure 3, along with the flows and converters associated with that stock, Unstitched Shirt Panels with Fusing, in the model.
4.4.1. SDM Converters in Figure 3
As shown in the Cutting and Fusing Attachment flow in Figure 3, for the cutting and fusing attachment process to take place, labor is needed to cut the fabric and attach fusing to the shirt panels. The number of laborers depends on the rate at which they can cut the required number of shirt panels in one day. These numbers are inserted in the converters as input values. Similarly, for the Stitching flow, tailors are needed to sew the shirts. The number of tailors and the rate at which shirts are stitched in a day are entered into their converters, respectively. The converters used in Figure 3 are listed in Table 4.
4.4.2. SDM Flow Equations in Figure 3
Each flow equation in Table 5 is constructed as an “if_then_else” statement. So, for the Stitching flow #3, in Table 5, if the converters Stitching Rate and Tailors were two shirts per day/tailor and 500 tailors, respectively, then the maximum Stitching flow would be 1000 shirts per day. If the stock Unstitched Shirt Panels with Fusing were 800 shirts/day, then the maximum Stitching flow would be limited to 800 shirts/day. On the other hand, if the stock Unstitched Shirt Panels with Fusing were 1200 shirts/day, then the Stitching flow would be limited to its maximum rate of 1000 shirts/day.
4.4.3. SDM Stock Equation in Figure 3
Stock equations are mass balances of the flows in and out of the stock (Equation (1)).
Stock (t) = Stock (t − dt) + ∑ Inflows − ∑ Outflows
dt = the time step in the model run (here, 1 day)
t = a particular time point in the model run (here, 1–15 days)
Specifically, in Table 6, the inflow is Cutting and Fusing Attachment, and the two outflows are Stitching and Fabric and Fusing Cutting Waste Fraction.
Following this procedure, the remainders of the flows, stocks, and converters are developed and are described in Appendix A in Table A1, Table A2 and Table A3, respectively.
Based on the information provided in this section, we have demonstrated that STELLA® can be used to model the shirt manufacturing supply chain, answering RQ1, can STELLA® be used to model shirt manufacturing supply chains?
5. Simulation Results
5.1. Initial Simulation
Figure 4 depicts our initial simulation using this model. The converter values for this simulation are shown in Table 7. The results of all the values on the flows and stocks as a function of time, from 1 to 15 days, are shown in Table A4 and Table A5 in Appendix B.
As shown in Table A4 and Table A5, these conditions are not optimum because some stocks and flows are increasing with time, indicating the buildup of materials in the supply chain. This is due to “choke points” in the supply chain, where resource limitations prevent processing of the material at a sufficient rate, leading to material buildup.
Although these converter values do not lead to optimum supply chains, this demonstrates that the model can be used to stimulate the shirt manufacturing supply chain, answering RQ2, does the model allow for the simulation of the shirt manufacturing supply chain?
5.2. Optimized Simulation
Figure 5 depicts our optimized simulation using this model. The converter values for this simulation are shown in Table 8. The results of all the values on the flows and stocks as a function of time, from 1 to 15 days, are shown in Table A6 and Table A7 in Appendix C, along with the analysis of the optimized simulation.
As shown in Table A6 and Table A7, these conditions are optimum because all stocks and flows are now constant with time, indicating no buildup of materials in the supply chain and, therefore, no resource limitations preventing the processing of the material at an optimum rate.
The following algorithm was used to obtain the optimized converter values in Table 8.
- Starting with the final stock in the supply chain, determine if the stock is increasing or decreasing with time.
- Adjust the converters that impact the input flow to that stock and re-run the simulation.
- Repeat step 2 until the stock value remains unchanged with time.
- Move to the next upstream stock in the supply chain and repeat steps 1 through to 3 for that stock.
- Repeat this process until the initial flow at the beginning of the supply chain model is reached.
5.3. Analysis of Optimized Supply Chain for Sustainability
By following the algorithm described above, three specific interlinked converters, as shown in Table 9, have been chosen to optimize as a group, to alleviate material buildup in the supply chain.
As shown in this example in Table 9, the fabric yardage (material) was reduced by more than 14%; the stitching rate (equipment usage) was reduced by more than 33%; and the packers (labor) needed increased by 30%. We were able to increase the final shipped shirts by more than 24% (from 800 pieces to 998 pieces), achieving our target of shipping up to 1000 shirts in a more sustainable way. All the converter values are interlinked and are optimized as a group in the simulation, so that all the stocks in the model reach equilibrium values and do not increase or decrease over time.
The algorithm presented here adjusts the converter values to optimize material, labor, and equipment use, leading to a more sustainable supply chain, answering RQ3, can these simulations be used to optimize material, labor, and equipment usage?
6. Discussion on Simulation Results and Conclusions
As shown in our model, material flow optimization can be achieved depending on the units of production, thereby reducing waste, and saving costs and resources. Figure 5 shows the optimum scenario for this model, in which up to 1000 shirts are manufactured and shipped in one day. In this scenario, the use of materials, labor, and equipment is optimized, leading to a more sustainable manufacturing process. In comparison, Figure 4 shows an unbalanced, non-optimum scenario for the same model. The supply chain is not stable in Figure 4 because of an excess inflow of material in Fabric in Yards, excess equipment in Stitching Rate, and insufficient labor in Packers. This leads to the inefficient use of materials, labor, and equipment in the manufacturing process. The initial and optimized values for these three converters are shown in Table 9.
SDM can be particularly useful in situations where there is a need to make decisions when there is uncertainty, particularly in the apparel manufacturing industry, which is highly affected by uncertainties. By running multiple simulations and scenario analyses, supply chain managers can assess the potential impact of different strategies and identify potential bottlenecks or vulnerabilities within the system. Additionally, SDM can help identify the leverage points in the supply chain, those areas where a small intervention can have a significant impact on the overall system performance.
This can be especially valuable in optimizing inventory levels, improving customer service, or reducing costs. Despite its numerous advantages, the adoption of SDM in the apparel manufacturing supply chain has been relatively low. This can be attributed to various factors, including the complexity of building and maintaining SDM, the requirement for specialized skills and expertise, and the lack of awareness about the benefits of SDM. However, as supply chains continue to grow in complexity, recognition of the need for more sophisticated modeling approaches also grows. SDM offers a promising solution for understanding and managing these complex systems effectively. The same basic methodology demonstrated here can be applied to a wide range of manufacturing processes and supply chains, regardless of the product or the complexity of the manufacturing process.
Supply chain modeling can help organizations make better decisions, save money, improve productivity, and increase sustainability, by reducing materials, labor, and equipment usage, which in turn reduces energy use. Models such as these can be used to determine if a new inventory system, such as JIT, would perform well from a sustainability point-of-view and be cost effective, without having to implement the new system [22].
Our results suggest that SDM can be used in the apparel manufacturing supply chain to identify areas where resources can be optimized (materials, labor, equipment usage), to improve the efficiency and sustainability of the supply chain. The specific model shown here is an example of an efficient way to assist shirt manufacturing companies in making business decisions without fear of losing valuable time and assets, as the model simulates different manufacturing supply chain scenarios in a risk-free environment. In future work, outputs from models like this one can be used as inputs into subsequent life cycle assessment (LCA) models to determine the quantitative environmental impacts. Performing an SDM, as described in this paper, will inform the LCA goals and scoping stage and provide quantitative material flow inputs for the life cycle inventory stage of an LCA.
This analysis provides decision-makers with more accurate impact assessments on elements such as energy consumption, global warming gases, solid waste, etc. that affect overall sustainability strategies, answering RQ4, does the simulation output inform the development of a more sustainable supply chain management strategy?
Author Contributions
Conceptualization, G.K. and R.K.; methodology, G.K. and R.K.; writing—original draft preparation, G.K.; writing—review and editing, G.K. and R.K.; visualization, G.K.; supervision, R.K.; project administration, G.K.; funding acquisition, R.K. All authors have read and agreed to the published version of the manuscript.
Funding
This research received no external funding.
Institutional Review Board Statement
Not applicable.
Informed Consent Statement
Not applicable.
Data Availability Statement
Data is contained within the article.
Conflicts of Interest
The authors declare no conflict of interest.
Appendix A

Table A1.
Flows and flow equations in Figure 2.
Table A1.
Flows and flow equations in Figure 2.
| Serial Nos. | Name of the Flow | Equations | Unit |
|---|---|---|---|
| 1. | Fabric and Fusing Transport | (Fabric_in_Yards + Fusing_in_Yards)/(Fabric_Consumption_per_Piece+Fusing_Consumption_per_Piece) | Pieces/day |
| 2. | Cutting and Fusing Attachment | IF (Inhouse_Fabric_&_Fusing/DT) < (Cutting_&_Fusing_Attachment_Rate*Labor) THEN (Inhouse_Fabric_&_Fusing/DT) ELSE (Cutting_&_Fusing_Attachment_Rate*Labor) | Pieces/day |
| 3. | Fabric and Fusing Cutting Waste Fraction | (Cutting_&_Fusing_Attachment*Fabric_and_Fusing_Cutting_Waste_Fraction) | Pieces/day |
| 4. | Stitching | IF (Unstitched_Shirt_Panels_with_Fusing/DT) < (Stitching_Rate*Tailors) THEN (Unstitched_Shirt_Panels_with_Fusing/DT) ELSE (Stitching_Rate*Tailors) | Pieces/day |
| 5. | Buttoning | IF (Stitched_Shirt/DT) < (Buttoning_Rate*Buttoning_Labor) THEN (Stitched_Shirt/DT) ELSE (Buttoning_Rate*Buttoning_Labor) | Pieces/day |
| 6. | Tagging and Finishing | IF (Shirt_with_Buttons/DT) < (Finishing_and_Tagging_Rate*Finishing_and_Tagging_Labor) THEN (Shirt_with_Buttons/DT) ELSE (Finishing_and_Tagging_Rate*Finishing_and_Tagging_Labor) | Pieces/day |
| 7. | Quality Inspection | (Failed_Quality_Fraction*Tagging_and_Finishing) | Pieces/day |
| 8. | Packing | IF (Finished_Shirt/DT) < (Packing_Rate*Packers) THEN Finished_Shirt/DT ELSE (Packing_Rate*Packers) | Pieces/day |
| 9. | Shipping | IF (Packed_Shirt/DT) < (Shipment_Rate) THEN (Packed_Shirt/DT) ELSE (Shipment_Rate) | Pieces/day |
Table A2.
Stocks and stock equations in Figure 2.
Table A2.
Stocks and stock equations in Figure 2.
| Serial Nos. | Stock | Stock’s Variable Name | Equation of Stock | Unit |
|---|---|---|---|---|
| 1. | In-house Fabric and Fusing | In-house_Fabric_&_Fusing | Inhouse Fabric & Fusing (t) = Inhouse Fabric & Fusing (t − dt) + Fabric and Fus ing Transport (t) − Cutting and Fusing Attachment (t) | Pieces/day |
| 2. | Unstitched Shirt Panels with Fusing | Unstitched_Shirt_Panels_with_Fusing | Unstitched Shirt Panels with Fusing (t) = Unstitched Shirt Panels with Fusing (t − dt) + Cutting and Fusing Attachment (t) − Stitching (t) − Fabric and Cutting Fus- ing Waste (t) | Pieces/day |
| 3. | Stitched Shirt | Stitched_Shirt | Stitched Shirt (t) = Stitched Shirt (t − dt) + Stitching (t) − Buttoning (t) | Pieces/day |
| 4. | Shirt with Buttons | Shirt_with_Buttons | Shirt with Buttons (t) = Shirt with But tons (t − dt) + Buttoning (t) − Tagging and Finishing (t) | Pieces/day |
| 5. | Finished Shirt | Finished_Shirt | Finished Shirt (t) = Finished Shirt (t-dt) + Tagging and Finishing (t) − Packing (t) − Quality Inspection (t) | Pieces/day |
| 6. | Packed Shirt | Packed_Shirt | Packed Shirt (t) = Packed Shirt (dt − t) + Packing (t) − Shipping (t) | Pieces/day |
Table A3.
Converters in Figure 2.
Table A3.
Converters in Figure 2.
| Serial Nos. | Converter | Converter’s Variable Name | Unit |
|---|---|---|---|
| 1. | Fabric in Yards | Fabric_in_Yards | Yards/day |
| 2. | Fabric Consumption per Piece | Fabric_Consumption_per_Piece | Yards/pieces |
| 3. | Fusing in Yards | Fusing_in_Yards | Yards/day |
| 4. | Fusing Consumption per Piece | Fusing_Consumption_per_Piece | Yards/pieces |
| 5. | Cutting and Fusing Attachment Rate | Cutting_&_Fusing_Attachment_Rate | Pieces/day |
| 6. | Labor | Labor | Unitless |
| 7. | Fabric and Fusing Cutting Waste Fraction | Fabric_and_Fusing_Cutting_Waste Fraction | Unitless |
| 8. | Stitching Rate | Stitching_Rate | Pieces/day |
| 9. | Tailors | Tailors | Unitless |
| 10. | Buttoning Rate | Buttoning_Rate | Pieces/day |
| 11. | Buttoning Labor | Buttoning_Labor | Unitless |
| 12. | Finishing and Tagging Rate | Finishing_and_Tagging_Rate | Pieces/day |
| 13. | Finishing and Tagging Labor | Finishing_and_Tagging_Labor | Unitless |
| 14. | Failed Quality Fraction | Failed_Quality_Fraction | Unitless |
| 15. | Packing Rate | Packing_Rate | Pieces/day |
| 16. | Packers | Packers | Unitless |
| 17. | Shipment Rate | Shipment_Rate | Pieces/day |
Appendix B
Table A4.
Flow results for initial simulation.
| Serial Nos. | Fabric and Fusing Transport | Cutting and Fusing Attachment | Fabric and Fusing Cutting Waste | Stitching | Buttoning | Tagging and Finishing | Quality Inspection | Packing | Shipping |
|---|---|---|---|---|---|---|---|---|---|
| 1. | 1.25 K | 1 | 0.02 | 1 | 1 | 1 | 0.05 | 1 | 1 |
| 2. | 1.25 K | 1.2 K | 24 | 0.98 | 1 | 1 | 0.05 | 0.95 | 1 |
| 3. | 1.25 K | 1.2 K | 24 | 1.18 K | 0.98 | 1 | 0.05 | 0.95 | 0.95 |
| 4. | 1.25 K | 1.2 K | 24 | 1.18 K | 1.13 K | 0.98 | 0.049 | 0.95 | 0.95 |
| 5. | 1.25 K | 1.2 K | 24 | 1.18 K | 1.13 K | 1.13 K | 56.3 | 0.931 | 0.95 |
| 6. | 1.25 K | 1.2 K | 24 | 1.18 K | 1.13 K | 1.13 K | 56.3 | 800 | 0.931 |
| 7. | 1.25 K | 1.2 K | 24 | 1.18 K | 1.13 K | 1.13 K | 56.3 | 800 | 800 |
| 8. | 1.25 K | 1.2 K | 24 | 1.18 K | 1.13 K | 1.13 K | 56.3 | 800 | 800 |
| 9. | 1.25 K | 1.2 K | 24 | 1.18 K | 1.13 K | 1.13 K | 56.3 | 800 | 800 |
| 10. | 1.25 K | 1.2 K | 24 | 1.18 K | 1.13 K | 1.13 K | 56.3 | 800 | 800 |
| 11. | 1.25 K | 1.2 K | 24 | 1.18 K | 1.13 K | 1.13 K | 56.3 | 800 | 800 |
| 12. | 1.25 K | 1.2 K | 24 | 1.18 K | 1.13 K | 1.13 K | 56.3 | 800 | 800 |
| 13. | 1.25 K | 1.2 K | 24 | 1.18 K | 1.13 K | 1.13 K | 56.3 | 800 | 800 |
| 14. | 1.25 K | 1.2 K | 24 | 1.18 K | 1.13 K | 1.13 K | 56.3 | 800 | 800 |
| Final | 1.25 K | 1.2 K | 24 | 1.18 K | 1.13 K | 1.13 K | 56.3 | 800 | 800 |
Table A5.
Stock results for initial simulation.
| Serial Nos. | In-House Fabric and Fusing | Unstitched Shirt Panels with Fusing | Stitched Shirt | Shirt with Buttons | Finished Shirt | Packed Shirt |
|---|---|---|---|---|---|---|
| 1. | 1 | 1 | 1 | 1 | 1 | 1 |
| 2. | 1.25 K | 0.98 | 1 | 1 | 0.95 | 1 |
| 3. | 1.3 K | 1.18 K | 0.98 | 1 | 0.95 | 0.95 |
| 4. | 1.35 K | 1.18 K | 1.18 K | 0.98 | 0.95 | 0.95 |
| 5. | 1.4 K | 1.18 K | 1.23 K | 1.13 K | 0.931 | 0.95 |
| 6. | 1.45 K | 1.18 K | 1.28 K | 1.13 K | 1.07 K | 0.931 |
| 7. | 1.5 K | 1.18 K | 1.33 K | 1.13 K | 1.34 K | 800 |
| 8. | 1.55 K | 1.18 K | 1.38 K | 1.13 K | 1.61 K | 800 |
| 9. | 1.6 K | 1.18 K | 1.43 K | 1.13 K | 1.88 K | 800 |
| 10. | 1.65 K | 1.18 K | 1.48 K | 1.13 K | 2.14 K | 800 |
| 11. | 1.7 K | 1.18 K | 1.53 K | 1.13 K | 2.41 K | 800 |
| 12. | 1.75 K | 1.18 K | 1.58 K | 1.13 K | 2.68 K | 800 |
| 13. | 1.8 K | 1.18 K | 1.64 K | 1.13 K | 2.95 K | 800 |
| 14. | 1.85 K | 1.18 K | 1.69 K | 1.13 K | 3.22 K | 800 |
| Final | 1.9 K | 1.18 K | 1.74 K | 1.13 K | 3.49 K | 800 |
Appendix C
Table A6.
Flow results for optimized simulation.
| Serial Nos. | Fabric and Fusing Transport | Cutting and Fusing Attachment | Fabric and Fusing Cutting Waste Fraction | Stitching | Buttoning | Tagging and Finishing | Quality Inspection | Packing | Shipping |
|---|---|---|---|---|---|---|---|---|---|
| 1. | 1072 | 1072 | 0.02 | 1 | 1 | 1 | 0.05 | 1 | 1 |
| 2. | 1072 | 1072 | 21 | 0.98 | 1 | 1 | 0.05 | 0.95 | 1 |
| 3. | 1072 | 1072 | 21 | 1051 | 0.98 | 1 | 0.05 | 0.95 | 0.95 |
| 4. | 1072 | 1072 | 21 | 1051 | 1051 | 0.98 | 0.049 | 0.95 | 0.95 |
| 5. | 1072 | 1072 | 21 | 1051 | 1051 | 1051 | 53 | 0.0931 | 0.95 |
| 6. | 1072 | 1072 | 21 | 1051 | 1051 | 1051 | 53 | 998 | 0.931 |
| 7. | 1072 | 1072 | 21 | 1051 | 1051 | 1051 | 53 | 998 | 998 |
| 8. | 1072 | 1072 | 21 | 1051 | 1051 | 1051 | 53 | 998 | 998 |
| 9. | 1072 | 1072 | 21 | 1051 | 1051 | 1051 | 53 | 998 | 998 |
| 10. | 1072 | 1072 | 21 | 1051 | 1051 | 1051 | 53 | 998 | 998 |
| 11. | 1072 | 1072 | 21 | 1051 | 1051 | 1051 | 53 | 998 | 998 |
| 12. | 1072 | 1072 | 21 | 1051 | 1051 | 1051 | 53 | 998 | 998 |
| 13. | 1072 | 1072 | 21 | 1051 | 1051 | 1051 | 53 | 998 | 998 |
| 14. | 1072 | 1072 | 21 | 1051 | 1051 | 1051 | 53 | 998 | 998 |
| Final | 1072 | 1072 | 21 | 1051 | 1051 | 1051 | 53 | 998 | 998 |
Table A7.
Stock results for optimized simulation.
| Serial Nos. | In-House Fabric and Fusing | Unstitched Shirt Panels with Fusing | Stitched Shirt | Shirt with Buttons | Finished Shirt | Packed Shirt |
|---|---|---|---|---|---|---|
| 1. | 1 | 1 | 1 | 1 | 1 | 1 |
| 2. | 1072 | 0.98 | 1 | 1 | 0.95 | 1 |
| 3. | 1072 | 1051 | 0.98 | 1 | 0.95 | 0.95 |
| 4. | 1072 | 1051 | 1051 | 0.98 | 0.95 | 0.95 |
| 5. | 1072 | 1051 | 1051 | 1051 | 998 | 0.95 |
| 6. | 1072 | 1051 | 1051 | 1051 | 998 | 0.931 |
| 7. | 1072 | 1051 | 1051 | 1051 | 998 | 998 |
| 8. | 1072 | 1051 | 1051 | 1051 | 998 | 998 |
| 9. | 1072 | 1051 | 1051 | 1051 | 998 | 998 |
| 10. | 1072 | 1051 | 1051 | 1051 | 998 | 998 |
| 11. | 1072 | 1051 | 1051 | 1051 | 998 | 998 |
| 12. | 1072 | 1051 | 1051 | 1051 | 998 | 998 |
| 13. | 1072 | 1051 | 1051 | 1051 | 998 | 998 |
| 14. | 1072 | 1051 | 1051 | 1051 | 998 | 998 |
| Final | 1072 | 1051 | 1051 | 1051 | 998 | 998 |
Below is the analysis of the optimized simulation in Figure 5:
- Fabric and Fusing Transport (flow): Transporting the fabric and fusing into the factory is the first step in our simulated model for manufacturing shirts. In our simulated model, this flow is called Fabric and Fusing Transport. It refers to the rate that fabric and fusing are transported to the factory. To calculate this flow, four converters were used: Fabric in Yards, Fabric Consumption per Piece, Fusing in Yards, and Fusing Consumption per Piece. Fabric in Yards refers to the total fabric yardage required to manufacture up to 1000 shirts per day. Its value is 2144 yards/day. Fabric Consumption per Piece refers to the amount of fabric consumed to manufacture one shirt. Its value is two yards/piece. Fusing in Yards is the total fusing yardage required to manufacture up to 1000 shirts per day. Its value is 2.2 yards/day. Fusing Consumption per Piece is the amount of fusing consumed to manufacture one shirt. Its value is 0.002 yards/piece. The equation used for this flow is (Fabric_in_Yards+Fusing_in_Yards)/(Fabric_Consumption_per_Piece+Fusing_Consumption_per_Piece). (2144 + 2.2)/(2 + 0.002). The value of Fabric and Fusing Transport flow at its equilibrium is 1072 pieces/day.
- In-house Fabric and Fusing (stock): After transporting the fabric and fusing into the factory, the next step is inventory of the in-house fabric and fusing. In the model, this inventory is called In-house Fabric and Fusing. To calculate this stock, one stock, one inflow, and one outflow were used: In-house Fabric and Fusing, Fabric and Fusing Transport, and Cutting and Fusing Attachment, respectively. The equation for this stock is In-house Fabric and Fusing (t) = Inhouse Fabric and Fusing (t-dt) + Fabric and Fusing Transport (t) − Cutting and Fusing Attachment (t). In-house Fabric and Fusing = 1072 + 1072 − 1072. The value of Inhouse Fabric and Fusing stock at its equilibrium is 1072 pieces.
- Cutting and Fusing Attachment (flow): Once the fabric and fusing are in-house, the labor cuts the fabric into shirt panels using a cutting machine. Once the shirt panels are ready, fusing is cut and attached to the shirt. In the model, this process is called Cutting and Fusing Attachment. To calculate this flow, two converters and one previous stock were used, Cutting and Fusing Attachment Rate and Labor and Inhouse Fabric and Fusing, respectively. Cutting and Fusing Attachment Rate refers to the number of shirt panels cut and fused each day. Its value is 4000 pieces/day. Labor equals the amount of labor (in full-time equivalent employees) needed to cut and fuse up to 1000 shirt panels, valued at 0.3. The equation for this flow is IF (Inhouse_Fabric_&_Fusing/DT) < (Cutting_&_Fusing_Attachment_Rate*Labor) THEN (Inhouse_Fabric_&_Fusing/DT) ELSE (Cutting_&_Fusing_Attachment_Rate*Labor). IF (1072/1) < (4000*0.3) THEN (1072/1) ELSE (4000*3). IF (1072) < (1200) THEN (1072) ELSE (1200). The value of Cutting and Fusing Attachment flow at its equilibrium is 1072 pieces/day.
- Fabric and Cutting Fusing Waste (Flow): The process of cutting fabric into shirt panels produces fabric waste. The process of fusing cutting also produces fusing waste. To calculate Unstitched Shirt Panels with Fusing, the waste that occurred during the fabric and fusing attachment process must be considered. In the model, this process is called Fabric and Fusing Cutting Waste. To calculate this flow, one converter and a previous flow were used, Fabric and Fusing Cutting Waste Fraction and Cutting and Fusing Attachment, respectively. Fabric and Fusing Cutting Waste Fraction is the fraction of fabric and fusing waste generated from cutting, valued at 0.02. The equation of this flow is Cutting_&_Fusing_Attachment * Fabric_&_Fusing_Cutting_Waste_Fraction. (1072*0.02). The value of Fabric and Cutting Fusing Waste flow at its equilibrium is 21 pieces/day.
- Unstitched Shirt Panels with Fusing (stock): Unstitched shirt panels with fusing are now in inventory following the cutting and fusing attachment process and fabric and fusing cutting waste process. In the model, this stock is called Unstitched Shirt Panels with Fusing. To calculate this stock, one stock, one inflow, and two outflows were used. The equation for this stock is Unstitched Shirt Panels with Fusing (t) = Unstitched Shirt Panels with Fusing (t-dt) + Cutting & Fusing Attachment (t) − Stitching (t) − Fabric & Cutting Fusing Waste (t). 1051 + 1072 − 1051 − 21. The value of Unstitched Shirt Panels with Fusing stock at its equilibrium is 1051 pieces.
- Stitching (flow): Following cutting and fusing, shirt panels are sewn by in-house tailors. In the model, this process is called Stitching, which refers to the rate that shirts are sewn. This flow is calculated using two converters, Stitching Rate and Tailors, and one previous stock, Unstitched Shirt Panels with Fusing. The Stitching Rate is the number of shirts sewn by a tailor using a sewing machine per day, valued at 2 pieces/day. Tailors refer to the number of tailors required to sew shirts per day, valued at 530. Unstitched Shirt Panels with Fusing is the quantity of unstitched, cut shirt panels attached with fusing, valued at 1051 pieces. The equation of this flow is IF (Unstitched_Shirt_Panels_with_Fusing/DT) < (Stitching_Rate*Tailors) THEN (Unstitched_Shirt_Panels_with_Fusing/DT) ELSE (Stitching_Rate*Tailors). IF (1051/1) < (2*530) THEN (1051/1) ELSE (2*530) = IF (1051) < (1060) THEN (1051) ELSE (1060). The value of Stitching flow at its equilibrium is 1051 pieces/day.
- Stitched Shirt (stock): Once the shirts are stitched, an inventory of stitched shirts is the next step. In the model, this stock is called Stitched Shirt. It is a stock that refers to the number of shirts stitched by tailors. To calculate this stock, one stock, one inflow, and one outflow were used: Stitched Shirt, Stitching, and Buttoning, respectively. The equation for this stock is Stitched Shirt (t) = Stitched Shirt (t − dt) + Stitching (t) − Buttoning (t). 1051 + 1051 − 1051. The value of Stitched Shirt stock at its equilibrium is 1051 pieces.
- Buttoning (flow): The labor attaches buttons to shirts after they have been stitched. In the model, this process is called Buttoning, which refers to the rate at which shirts are buttoned. This flow is calculated using two converters, Buttoning Rate and Buttoning Labor, and one previous stock, Stitched Shirt. Buttoning Rate is the number of shirts buttoned per day by one laborer, valued at 75 pieces/day. Buttoning Labor is the amount of labor needed to attach buttons to shirts per day, valued at 15. The value of Stitched Shirt is 1051 pieces. The equation for this flow is IF (Stitched_Shirt/DT) < (Buttoning_Rate*Buttoning_Labor) THEN (Stitched_Shirt/DT) ELSE (Buttoning_Rate*Buttoning_Labor). IF (1051/1) < (75*15) THEN (1051/1) ELSE (75*15). IF (1051) < (1125) THEN (1051) ELSE (1125). The value of Buttoning flow at its equilibrium is 1051 pieces/day.
- Shirt with Buttons (stock): An inventory of buttoned shirts is created after the buttoning process. In the model, this stock is called Shirt with Buttons, which refers to the number of shirts with buttons attached. To calculate this stock, one stock, one inflow, and one outflow were used: Shirt with Buttons, Buttoning, and Tagging and Finishing, respectively. The equation for this stock is Shirt with Buttons (t) = Shirt with Buttons (t − dt) + Buttoning (t) − Tagging and Finishing (t). 1051 + 1051 − 1051. The value of Shirt with Buttons stock at its equilibrium is 1051 pieces.
- Tagging and Finishing (flow): Shirts are then tagged and finished by the laborers. In the model, this flow is called Tagging and Finishing, which refers to the rate that shirts are tagged and finished. This flow is calculated using two converters, Finishing and Tagging Rate and Labor, and one previous stock, Shirt with Buttons. Finishing and Tagging Rate is the number of shirts finished and tagged by one laborer per day. Brand tags are attached to the shirts as part of the tagging process. The finishing process includes uncut thread tails trimmed, stains removed, defective shirts altered and pressed, etc., valued at 105 pieces/day. Finishing and Tagging Labor is the amount of labor required to finish the shirts and add hand tags per day, valued at 11. The equation for this flow is IF (Shirt_with_Buttons/DT) < (Finishing_&_Tagging_Rate*Finishing_&_Tagging_Labor) THEN (Shirt_with_Buttons/DT) ELSE (Finishing_&_Tagging_Rate*Finishing_&_Tagging_Labor). IF (1051/1) < (105*11) THEN (1051/1) ELSE (105*11). IF (1051) < (1155) THEN (1051) ELSE (1151). The value of Tagging and Finishing flow at its equilibrium is 1051 pieces/day.
- Quality Inspection (flow): All tagged and finished shirts are put through a quality inspection process, wherein shirts that fail the quality test are rejected. In the model, this flow is called Quality Inspection. It refers to the rate at which shirts pass quality inspection. This flow is calculated using one converter, Failed Quality Fraction, and one flow, Tagging and Finishing. It describes the fraction of shirts rejected during inspection due to poor quality, valued at 0.05. The equation for this flow is Failed_Quality_Fraction * Tagging_and_Finishing. (0.05*1051). The value of Quality Inspection flow at its equilibrium is 53 pieces/day.
- Finished Shirt (stock): Finished shirts are in inventory after tagging, finishing, and quality inspection. In the model, this stock is called Finished Shirt. It refers to the number of shirts finished after they are tagged, finished, and passed through a quality inspection process. To calculate this stock, one stock, one inflow, and two outflows are used: Finished Shirt, Tagging and Finishing, Packing, and Quality Inspection, respectively. The equation for this stock is Finished Shirt (t) = Finished Shirt (t-dt) + Tagging and Finishing (t) − Packing (t) − Quality Inspection (t). 998 + 1051 − 998 − 53. The value of Finished Shirt stock at its equilibrium is 998 pieces.
- Packing (flow): Shirts are packed after they have been finished. In the model, this flow is called Packing. It refers to the rate that shirts are packed for shipping. This flow is calculated using two converters, Packing Rate and Packers, and one stock, Finished Shirt. Packing Rate indicates the number of shirts packed for shipping by one laborer per day, valued at 80 pieces/day. Packers indicates the amount of labor required to pack shirts per day, valued at 13. The equation for this flow is IF (Finished_Shirt/DT) < (Packing_Rate*Packers) THEN (Finished_Shirt/DT) ELSE (Packing_Rate*Packers). IF (998/1) < (80*13) THEN (998/1) ELSE (80*13). (998) < (1040) THEN (998) ELSE (1040). The value of Packing flow at its equilibrium is 998 pieces/day.
- Packed Shirt (stock): The next step is an inventory of packed shirts. In the model, this stock is called Packed Shirt. To calculate this stock, one stock, one inflow, and two outflows were used: Finished Shirt, Tagging and Finishing, Packing, and Quality Inspection, respectively. The equation for this stock is Packed Shirt (t) = Packed Shirt (dt − t) + Packing (t) − Shipping (t). 998 + 998 − 998. The value of Packed Shirt stock at its equilibrium is 998 pieces.
- Shipping (flow): The shirts are now ready for shipment. In the model, this flow is called Shipping. It refers to the rate that shirts are shipped. It is calculated by using one converter, Shipment Rate, and one stock, Packed Shirt. Shipment Rate is the number of shirts shipped per day, valued at 1000 pieces. The equation for this flow is IF (Packed_Shirt/DT) < (Shipment_Rate) THEN (Packed_Shirt/DT) ELSE (Shipment_Rate). IF (998/1) < (1000) THEN (998/1) ELSE (1000). IF (998) < (1000) THEN (998) ELSE (1000). The value of Shipping flow at its equilibrium is 998 pieces/day.
References
- Radzicki, M.J.; Taylor, R.A. Introduction to System Dynamics; US Department of Energy: Washington, DC, USA, 1997. Available online: http://www.systemdynamics.org/DL-IntroSysDyn/inside.htm (accessed on 20 June 2023).
- Zhang, H.; Calvo-Amodio, J.; Haapala, K.R. A conceptual model for assisting sustainable manufacturing through system dynamics. J. Manuf. Syst. 2013, 32, 543–549. [Google Scholar] [CrossRef]
- Forrester, J.W. Industrial dynamics. J. Oper. Res. Soc. 1997, 48, 1037–1041. [Google Scholar] [CrossRef]
- Radzicki, M.J.; Taylor, R.A. Origin of system dynamics: Jay W. Forrester and the history of system dynamics. In US Department of Energy’s Introduction to System Dynamics; US Department of Energy: Washington, DC, USA, 2008. [Google Scholar]
- Angerhofer, B.J.; Angelides, M.C. System dynamics modelling in supply chain management: Research review. In Proceedings of the 2000 Winter Simulation Conference Proceedings (Cat. No. 00CH37165), Orlando, FL, USA, 10–13 December 2000; pp. 342–351. [Google Scholar]
- Pérez-Pérez, J.F.; Parra, J.F.; Serrano-Garcia, J. A system dynamics model: Transition to sustainable processes. Technol. Soc. 2021, 65, 101579. [Google Scholar] [CrossRef]
- Richardson, G.P. Core of System Dynamics. In System Dynamics: Theory and Applications; Springer: New York, NY, USA, 2020; pp. 11–20. [Google Scholar]
- Dyllick, T.; Hockerts, K. Beyond the business case for corporate sustainability. Bus. Strategy Environ. 2002, 11, 130–141. [Google Scholar] [CrossRef]
- Elkington, J.; Rowlands, I.H. Cannibals with forks: The triple bottom line of 21st century business. Altern. J. 1999, 25, 42. [Google Scholar]
- Hill, T.; Hill, T. Manufacturing Strategy: Text and Cases; Springer: Berlin/Heidelberg, Germany, 2000; Volume 2. [Google Scholar]
- World Commission on Environment and Development. Our Common Future; Peterson’s: Colorado Springs, CO, USA, 1987. [Google Scholar]
- Carter, C.R.; Rogers, D.S. A framework of sustainable supply chain management: Moving toward new theory. Int. J. Phys. Distrib. Logist. Manag. 2008, 38, 360–387. [Google Scholar] [CrossRef]
- Ghufran, M.; Khan, K.I.A.; Thaheem, M.J.; Nasir, A.R.; Ullah, F. Adoption of Sustainable Supply Chain Management for Performance Improvement in the Construction Industry: A System Dynamics Approach. Architecture 2021, 1, 161–182. [Google Scholar] [CrossRef]
- Marino, S.; Hogue, I.B.; Ray, C.J.; Kirschner, D.E. A methodology for performing global uncertainty and sensitivity analysis in systems biology. J. Theor. Biol. 2008, 254, 178–196. [Google Scholar] [CrossRef]
- Schunk, D.; Plott, B. Using simulation to analyze supply chains. In Proceedings of the 2000 Winter Simulation Conference Proceedings (Cat. No. 00CH37165), Orlando, FL, USA, 10–13 December 2000; IEEE: Piscataway, NJ, USA, 2000; Volume 2, pp. 1095–1100. [Google Scholar]
- Dicken, P. Global Shift: Reshaping the Global Economic Map in the 21st Century; Sage: Thousand Oaks, CA, USA, 2003. [Google Scholar]
- Nayak, R.; Padhye, R. Introduction: The apparel industry. In Garment Manufacturing Technology; Elsevier: Amsterdam, The Netherlands, 2015; pp. 1–17. [Google Scholar]
- Bheda, R.; Narag, A.; Singla, M. Apparel manufacturing: A strategy for productivity improvement. J. Fash. Mark. Manag. Int. J. 2003, 7, 12–22. [Google Scholar] [CrossRef]
- Muthu, S.S. Handbook of Sustainable Apparel Production; CRC Press: Boca Raton, FL, USA, 2015. [Google Scholar]
- Chowdhury, N.R.; Chowdhury, P.; Paul, S.K. Sustainable practices and their antecedents in the apparel industry: A review. Curr. Opin. Green Sustain. Chem. 2022, 37, 100674. [Google Scholar] [CrossRef]
- Chowdhury, M.M.H.; Rahman, S.; Quaddus, M.A.; Shi, Y. Strategies to mitigate barriers to supply chain sustainability: An apparel manufacturing case study. J. Bus. Ind. Mark. 2023, 38, 869–885. [Google Scholar] [CrossRef]
- Shen, B.; Li, Q.; Dong, C.; Perry, P. Sustainability issues in textile and apparel supply chains. Sustainability 2017, 9, 1592. [Google Scholar] [CrossRef]
- Bubicz, M.E.; Barbosa-Póvoa, A.P.F.D.; Carvalho, A. Social sustainability management in the apparel supply chains. J. Clean. Prod. 2021, 280, 124214. [Google Scholar] [CrossRef]
- Köksal, D.; Strähle, J.; Müller, M.; Freise, M. Social sustainable supply chain management in the textile and apparel industry—A literature review. Sustainability 2017, 9, 100. [Google Scholar] [CrossRef]
- Rathore, B. Future of textile: Sustainable manufacturing & prediction via chatgpt. Eduzone Int. Peer Rev./Ref. Multidiscip. J. 2023, 12, 52–62. [Google Scholar]
- Jiang, L.; Folmer, H.; Bu, M. Interaction between output efficiency and environmental efficiency: Evidence from the textile industry in Jiangsu Province, China. J. Clean. Prod. 2016, 113, 123–132. [Google Scholar] [CrossRef]
- Fatima, A.; Tufail, M. Improving Efficiency of Apparel Manufacturing Through the Principles of Resource Management. Cloth. Text. Res. J. 2023, 41, 225–235. [Google Scholar] [CrossRef]
- Mukherjee, K. Energy use efficiency in the Indian manufacturing sector: An interstate analysis. Energy Policy 2008, 36, 662–672. [Google Scholar] [CrossRef]
- Oelze, N. Sustainable supply chain management implementation—Enablers and barriers in the textile industry. Sustainability 2017, 9, 1435. [Google Scholar] [CrossRef]
- Freise, M.; Seuring, S. Social and environmental risk management in supply chains: A survey in the clothing industry. Logist. Res. 2015, 8, 2. [Google Scholar] [CrossRef]
- Awudu, I.; Zhang, J. Uncertainties and sustainability concepts in biofuel supply chain management: A review. Renew. Sustain. Energy Rev. 2012, 16, 1359–1368. [Google Scholar] [CrossRef]
- Sreedevi, R.; Saranga, H. Uncertainty and supply chain risk: The moderating role of supply chain flexibility in risk mitigation. Int. J. Prod. Econ. 2017, 193, 332–342. [Google Scholar] [CrossRef]
- Barnett, V.; O’Hagan, A. Setting Environmental Standards: The Statistical Approach to Handling Uncertainty and Variation; CRC Press: Boca Raton, FL, USA, 1997. [Google Scholar]
- Merschmann, U.; Thonemann, U.W. Supply chain flexibility, uncertainty and firm performance: An empirical analysis of German manufacturing firms. Int. J. Prod. Econ. 2011, 130, 43–53. [Google Scholar] [CrossRef]
- Shen, B. Sustainable fashion supply chain: Lessons from H&M. Sustainability 2014, 6, 6236–6249. [Google Scholar]
- Zimon, D.; Domingues, P. Proposal of a concept for improving the sustainable management of supply chains in the textile industry. Fibres Text. East. Eur. 2018, 26, 8–12. [Google Scholar] [CrossRef]
- Herrmann, F.F.; Barbosa-Povoa, A.P.; Butturi, M.A.; Marinelli, S.; Sellitto, M.A. Green supply chain management: Conceptual framework and models for analysis. Sustainability 2021, 13, 8127. [Google Scholar] [CrossRef]
- Hillier, F.S. Introduction to Operations Research; McGrawHill: New York, NY, USA, 2001. [Google Scholar]
- Shamsuddoha, M. Integrated supply chain model for sustainable manufacturing: A system dynamics approach. In Sustaining Competitive Advantage via Business Intelligence, Knowledge Management, and System Dynamics; Emerald Group Publishing Limited: Bingley, UK, 2015; pp. 155–399. [Google Scholar]
- Forrester, J.W. System dynamics, systems thinking, and soft OR. Syst. Dyn. Rev. 1994, 10, 245–256. [Google Scholar] [CrossRef]
- Wee Kwan Tan, A.; Kumar, A. A decision-making model for reverse logistics in the computer industry. Int. J. Logist. Manag. 2006, 17, 331–354. [Google Scholar] [CrossRef]
- Poles, R. System Dynamics modelling of a production and inventory system for remanufacturing to evaluate system improvement strategies. Int. J. Prod. Econ. 2013, 144, 189–199. [Google Scholar] [CrossRef]
- Ghisellini, P.; Cialani, C.; Ulgiati, S. A review on circular economy: The expected transition to a balanced interplay of environmental and economic systems. J. Clean. Prod. 2016, 114, 11–32. [Google Scholar] [CrossRef]
- Genovese, A.; Acquaye, A.A.; Figueroa, A.; Koh, S.L. Sustainable supply chain management and the transition towards a circular economy: Evidence and some applications. Omega 2017, 66, 344–357. [Google Scholar] [CrossRef]
- Santos, M.J. Theoretical contributions towards rethinking corporate social responsibility. Manag. Res. J. Iberoam. Acad. Manag. 2014, 12, 288–307. [Google Scholar]
- Fontes, C.H.d.O.; Freires, F.G.M. Sustainable and renewable energy supply chain: A system dynamics overview. Renew. Sustain. Energy Rev. 2018, 82, 247–259. [Google Scholar]
- Rebs, T.; Brandenburg, M.; Seuring, S. System dynamics modeling for sustainable supply chain management: A literature review and systems thinking approach. J. Clean. Prod. 2019, 208, 1265–1280. [Google Scholar] [CrossRef]
- Kaveh, A.; Vazirinia, Y. Optimization of tower crane location and material quantity between supply and demand points: A comparative study. Period. Polytech. Civ. Eng. 2018, 62, 732–745. [Google Scholar] [CrossRef]
- Andersen, M.; Skjoett-Larsen, T. Corporate social responsibility in global supply chains. Supply Chain Manag. Int. J. 2009, 14, 75–86. [Google Scholar] [CrossRef]
- Saberi, S.; Kouhizadeh, M.; Sarkis, J.; Shen, L. Blockchain technology and its relationships to sustainable supply chain management. Int. J. Prod. Res. 2019, 57, 2117–2135. [Google Scholar] [CrossRef]
- Abdelkafi, N.; Täuscher, K. Business models for sustainability from a system dynamics perspective. Organ. Environ. 2016, 29, 74–96. [Google Scholar] [CrossRef]
- Triantaphyllou, E.; Triantaphyllou, E. Multi-Criteria Decision Making Methods; Springer: Berlin/Heidelberg, Germany, 2000. [Google Scholar]
- Majumder, M.; Majumder, M. Multi criteria decision making. In Impact of Urbanization on Water Shortage in Face of Climatic Aberrations; Springer: Singapore, 2015; pp. 35–47. [Google Scholar]
- Wang, J.-J.; Jing, Y.-Y.; Zhang, C.-F.; Zhao, J.-H. Review on multi-criteria decision analysis aid in sustainable energy decision-making. Renew. Sustain. Energy Rev. 2009, 13, 2263–2278. [Google Scholar] [CrossRef]
- Taherdoost, H.; Madanchian, M. Multi-criteria decision making (MCDM) methods and concepts. Encyclopedia 2023, 3, 77–87. [Google Scholar] [CrossRef]
- Karloff, H. Linear Programming; Springer Science & Business Media: Berlin/Heidelberg, Germany, 2008. [Google Scholar]
- Gass, S.I. Linear Programming: Methods and Applications; Courier Corporation: North Chelmsford, MA, USA, 2003. [Google Scholar]
- Kibira, D.; Jain, S.; McLean, C. A system dynamics modeling framework for sustainable manufacturing. In Proceedings of the 27th Annual System Dynamics Society Conference, Albuquerque, NM, USA, 26–30 July 2009; Volume 301, pp. 1–22. [Google Scholar]
- Jain, S.; Kibira, D. A framework for multi-resolution modeling of sustainable manufacturing. In Proceedings of the 2010 Winter Simulation Conference, Baltimore, MD, USA, 5–8 December 2010; IEEE: Piscataway, NJ, USA, 2010; pp. 3423–3434. [Google Scholar]
- Jain, S.; Lindskog, E.; Johansson, B. Supply chain carbon footprint tradeoffs using simulation. In Proceedings of the 2012 Winter Simulation Conference (WSC), Berlin, Germany, 9–12 December 2012; IEEE: Piscataway, NJ, USA, 2012; pp. 1–12. [Google Scholar]
- Jain, S.; Lindskog, E.; Andersson, J.; Johansson, B. A hierarchical approach for evaluating energy trade-offs in supply chains. Int. J. Prod. Econ. 2013, 146, 411–422. [Google Scholar] [CrossRef]
- Jain, S.; Sigurðardóttir, S.; Lindskog, E.; Andersson, J.; Skoogh, A.; Johansson, B. Multi-resolution modeling for supply chain sustainability analysis. In Proceedings of the 2013 Winter Simulations Conference (WSC), Washington, DC, USA, 8–11 December 2013; IEEE: Piscataway, NJ, USA, 2013; pp. 1996–2007. [Google Scholar]
- Wofuru-Nyenke, O.K.; Briggs, T.A.; Aikhuele, D.O. Advancements in sustainable manufacturing supply chain modelling: A review. Process Integr. Optim. Sustain. 2023, 7, 3–27. [Google Scholar] [CrossRef]
- Bentahar, O.; Benzidia, S. Sustainable supply chain management: Trends and challenges. HAL Post-Print 2018, hal-02511038. [Google Scholar] [CrossRef]
- Choi, T.-M.; Cai, Y.-J. Impacts of lead time reduction on fabric sourcing in apparel production with yield and environmental considerations. Ann. Oper. Res. 2020, 290, 521–542. [Google Scholar] [CrossRef]
- Choi, T.-M.; Cai, Y.-J.; Shen, B. Sustainable fashion supply chain management: A system of systems analysis. IEEE Trans. Eng. Manag. 2018, 66, 730–745. [Google Scholar] [CrossRef]
- Asif, A. An overview of sustainability on apparel manufacturing industry in Bangladesh. Sci. J. Energy Eng. 2017, 5, 1–12. [Google Scholar] [CrossRef]
- Li, Y.; Zhao, X.; Shi, D.; Li, X. Governance of sustainable supply chains in the fast fashion industry. Eur. Manag. J. 2014, 32, 823–836. [Google Scholar] [CrossRef]
- Morana, R.; Seuring, S. A three level framework for closed-loop supply chain management—Linking society, chain and actor level. Sustainability 2011, 3, 678–691. [Google Scholar] [CrossRef]
- Amatulli, C.; De Angelis, M.; Korschun, D.; Romani, S. Consumers’ perceptions of luxury brands’ CSR initiatives: An investigation of the role of status and conspicuous consumption. J. Clean. Prod. 2018, 194, 277–287. [Google Scholar] [CrossRef]
- Perry, P.; Towers, N. Determining the antecedents for a strategy of corporate social responsibility by small-and medium-sized enterprises in the UK fashion apparel industry. J. Retail. Consum. Serv. 2009, 16, 377–385. [Google Scholar] [CrossRef]
- Perry, P.; Towers, N. Conceptual framework development: CSR implementation in fashion supply chains. Int. J. Phys. Distrib. Logist. Manag. 2013, 43, 478–501. [Google Scholar] [CrossRef]
- Mair, S.; Druckman, A.; Jackson, T. Investigating fairness in global supply chains: Applying an extension of the living wage to the Western European clothing supply chain. Int. J. Life Cycle Assess. 2018, 23, 1862–1873. [Google Scholar] [CrossRef] [PubMed]
- Mair, S.; Druckman, A.; Jackson, T. Higher wages for sustainable development? Employment and carbon effects of paying a living wage in global apparel supply chains. Ecol. Econ. 2019, 159, 11–23. [Google Scholar] [CrossRef]
- Clarke-Sather, A.; Cobb, K. Onshoring fashion: Worker sustainability impacts of global and local apparel production. J. Clean. Prod. 2019, 208, 1206–1218. [Google Scholar] [CrossRef]
- Morgan, E.; Foxon, T.J.; Tallontire, A. ‘I prefer 30°’?: Business strategies for influencing consumer laundry practices to reduce carbon emissions. J. Clean. Prod. 2018, 190, 234–250. [Google Scholar] [CrossRef]
- Ma, K.; Wang, L.; Chen, Y. A collaborative cloud service platform for realizing sustainable make-to-order apparel supply chain. Sustainability 2017, 10, 11. [Google Scholar] [CrossRef]
- Garcia, S.; Cordeiro, A.; de Alencar Nääs, I.; Neto, P.L.d.O.C. The sustainability awareness of Brazilian consumers of cotton clothing. J. Clean. Prod. 2019, 215, 1490–1502. [Google Scholar] [CrossRef]
- Choi, T.-M. Incorporating social media observations and bounded rationality into fashion quick response supply chains in the big data era. Transp. Res. Part E Logist. Transp. Rev. 2018, 114, 386–397. [Google Scholar] [CrossRef]
- Na, Y.; Na, D.K. Investigating the sustainability of the Korean textile and fashion industry. Int. J. Cloth. Sci. Technol. 2015, 27, 23–33. [Google Scholar] [CrossRef]
- Atilgan, T. Eco-labelling applications in the textile & apparel sector in Turkey. Fibres Text. East. Eur. 2007, 15, 14. [Google Scholar]
- Yang, Y.; Han, H.; Lee, P.K. An exploratory study of the mechanism of sustainable value creation in the luxury fashion industry. Sustainability 2017, 9, 483. [Google Scholar] [CrossRef]
- Li, Y.; Luo, Y.; Wang, Y.; Wang, L.; Shen, M. Decomposing the decoupling of water consumption and economic growth in China’s textile industry. Sustainability 2017, 9, 412. [Google Scholar] [CrossRef]
- Li, B.; Wu, K. Environmental management system adoption and the operational performance of firm in the textile and apparel industry of China. Sustainability 2017, 9, 992. [Google Scholar] [CrossRef]
- Chi, T. Building a sustainable supply chain: An analysis of corporate social responsibility (CSR) practices in the Chinese textile and apparel industry. J. Text. Inst. 2011, 102, 837–848. [Google Scholar] [CrossRef]
- Dabija, D.-C.; Pop, N.A.; Postelnicu, C. Ethics of the garment retail within the context of globalization and sustainable development. Ind. Textilă 2016, 67, 270–279. [Google Scholar]
- Shi, X.; Qian, Y.; Dong, C. Economic and environmental performance of fashion supply chain: The joint effect of power structure and sustainable investment. Sustainability 2017, 9, 961. [Google Scholar] [CrossRef]
- Nagurney, A.; Yu, M. Sustainable fashion supply chain management under oligopolistic competition and brand differentiation. Int. J. Prod. Econ. 2012, 135, 532–540. [Google Scholar] [CrossRef]
- Pineda-Henson, R.; Culaba, A.B. A diagnostic model for green productivity assessment of manufacturing processes. Int. J. Life Cycle Assess. 2004, 9, 379–386. [Google Scholar] [CrossRef]
- Ghazinoory, S. Cleaner production in Iran: Necessities and priorities. J. Clean. Prod. 2005, 13, 755–762. [Google Scholar] [CrossRef]
- Jin Gam, H.; Cao, H.; Farr, C.; Heine, L. C2CAD: A sustainable apparel design and production model. Int. J. Cloth. Sci. Technol. 2009, 21, 166–179. [Google Scholar] [CrossRef]
- Jordeva, S.; Tomovska, E.; Trajković, D. Current state of pre-consumer apparel waste management in Macedonia. Fibres Text. East. Eur. 2015, 23, 13–16. [Google Scholar]
- Wickramasinghe, G.; Perera, A. Effect of total productive maintenance practices on manufacturing performance: Investigation of textile and apparel manufacturing firms. J. Manuf. Technol. Manag. 2016, 27, 713–729. [Google Scholar] [CrossRef]
- Pinheiro, E.; Francisco, A. Management and characterization of textile solid waste in a local productive arrangement. Fibres Text. East. Eur. 2016, 4, 8–13. [Google Scholar] [CrossRef]
- Van der Velden, N.M.; Vogtländer, J.G. Monetisation of external socio-economic costs of industrial production: A social-LCA-based case of clothing production. J. Clean. Prod. 2017, 153, 320–330. [Google Scholar] [CrossRef]
- Hirscher, A.-L.; Niinimäki, K.; Armstrong, C.M.J. Social manufacturing in the fashion sector: New value creation through alternative design strategies? J. Clean. Prod. 2018, 172, 4544–4554. [Google Scholar] [CrossRef]
- Bala, B.; Islam, M.; Ghosh, S.; Hossain, M.; Hoque, A.; Saha, S. Modelling of supply chain of ready-made garments in Bangladesh. Syst. Res. Behav. Sci. 2020, 37, 38–55. [Google Scholar] [CrossRef]
- Issa, M.; Elgholmy, S.; Shetab, A.; Fors, M.N. A system dynamics model of apparel supply chain under mass customization. In Proceedings of the International Conference on Industrial Engineering and Operations Management, Toronto, ON, Canada, 23–25 October 2019. [Google Scholar]
- Wilson, S. Building apparel manufacturing competitiveness through policy—A system dynamics approach. J. Fash. Mark. Manag. Int. J. 2020, 24, 277–302. [Google Scholar] [CrossRef]
- Mehrjoo, M.; Pasek, Z.J. Risk assessment for the supply chain of fast fashion apparel industry: A system dynamics framework. Int. J. Prod. Res. 2016, 54, 28–48. [Google Scholar] [CrossRef]
- Lidia, M.W.; Arai, T.; Ishigaki, A.; Yudoko, G. Applying system dynamics approach to the fast fashion supply chain: Case study of an SME in Indonesia. Asian J. Technol. Manag. 2012, 5, 42–52. [Google Scholar]
- Corinna Cagliano, A.; DeMarco, A.; Rafele, C.; Volpe, S. Using system dynamics in warehouse management: A fast-fashion case study. J. Manuf. Technol. Manag. 2011, 22, 171–188. [Google Scholar] [CrossRef]
- Haddad, M.; Otayek, R. Assessing the Sustainment of a Lean Implementation Using System Dynamics Modeling: A Case Study of Apparel Manufacturing in Lebanon. Int. J. Syst. Dyn. Appl. (IJSDA) 2019, 8, 14–29. [Google Scholar] [CrossRef]
- Domina, T.; Koch, K. The textile waste lifecycle. Cloth. Text. Res. J. 1997, 15, 96–102. [Google Scholar] [CrossRef]
- Rathinamoorthy, R. Sustainable apparel production from recycled fabric waste. In Sustainable Innovations in Recycled Textiles; Springer: Singapore, 2018; pp. 19–52. [Google Scholar]
- Core System Dynamics Modeling Software. Available online: https://systemdynamics.org/tools/core-software/ (accessed on 21 June 2023).
Figure 1.
Four building blocks.
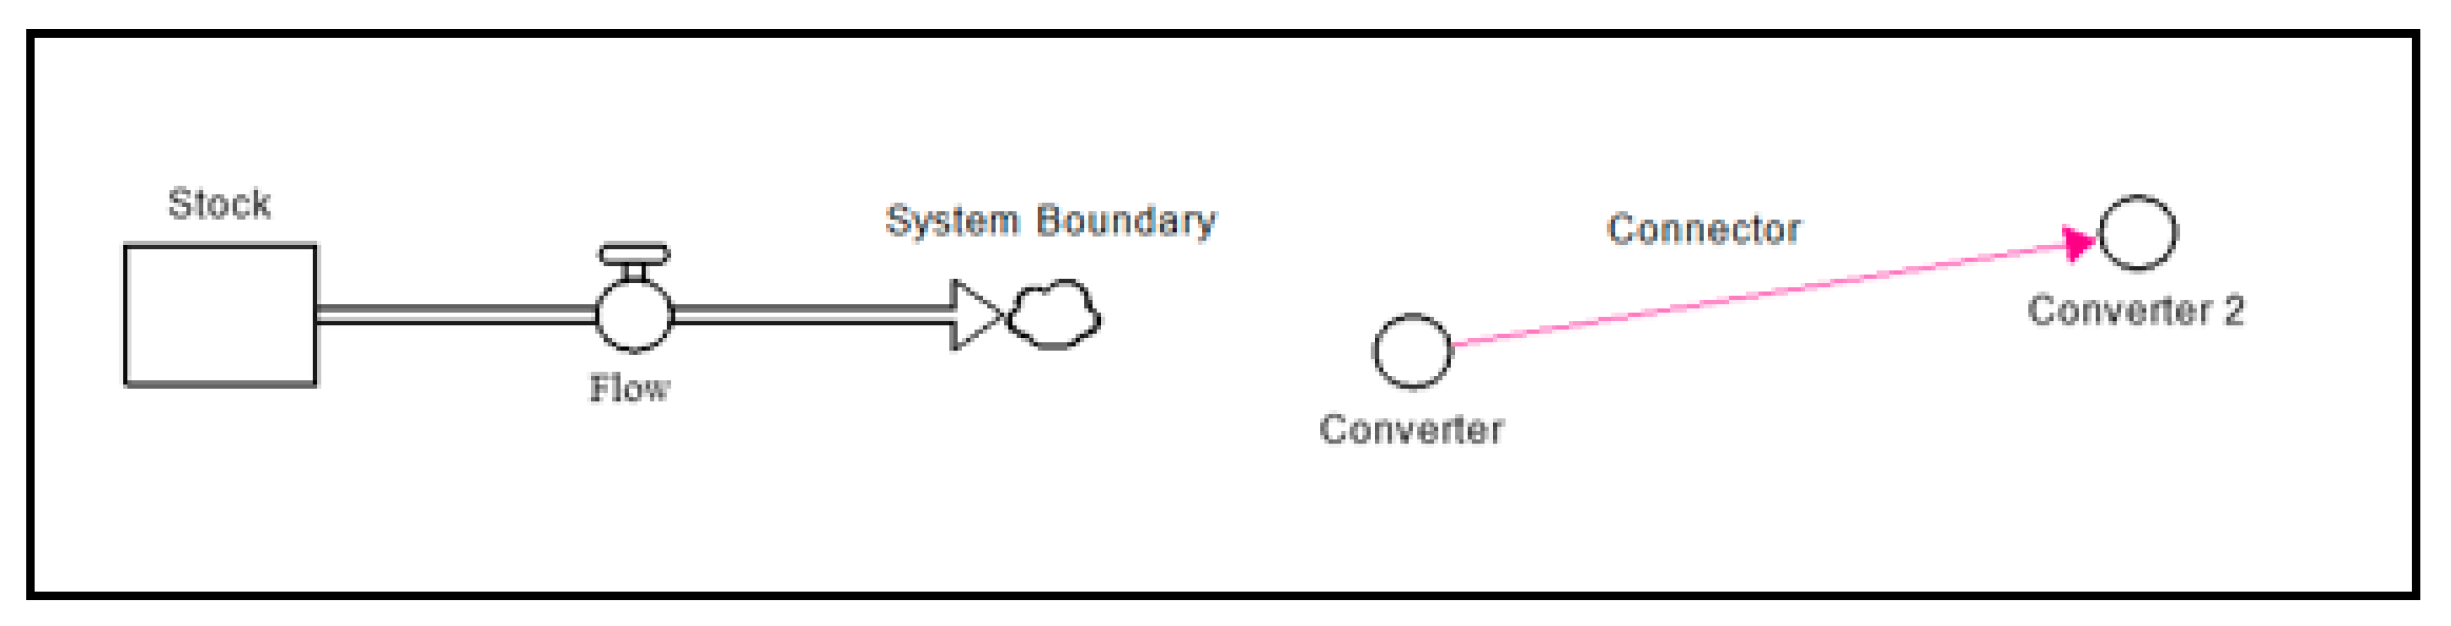
Figure 2.
Supply chain model of manufacturing process for shirts.
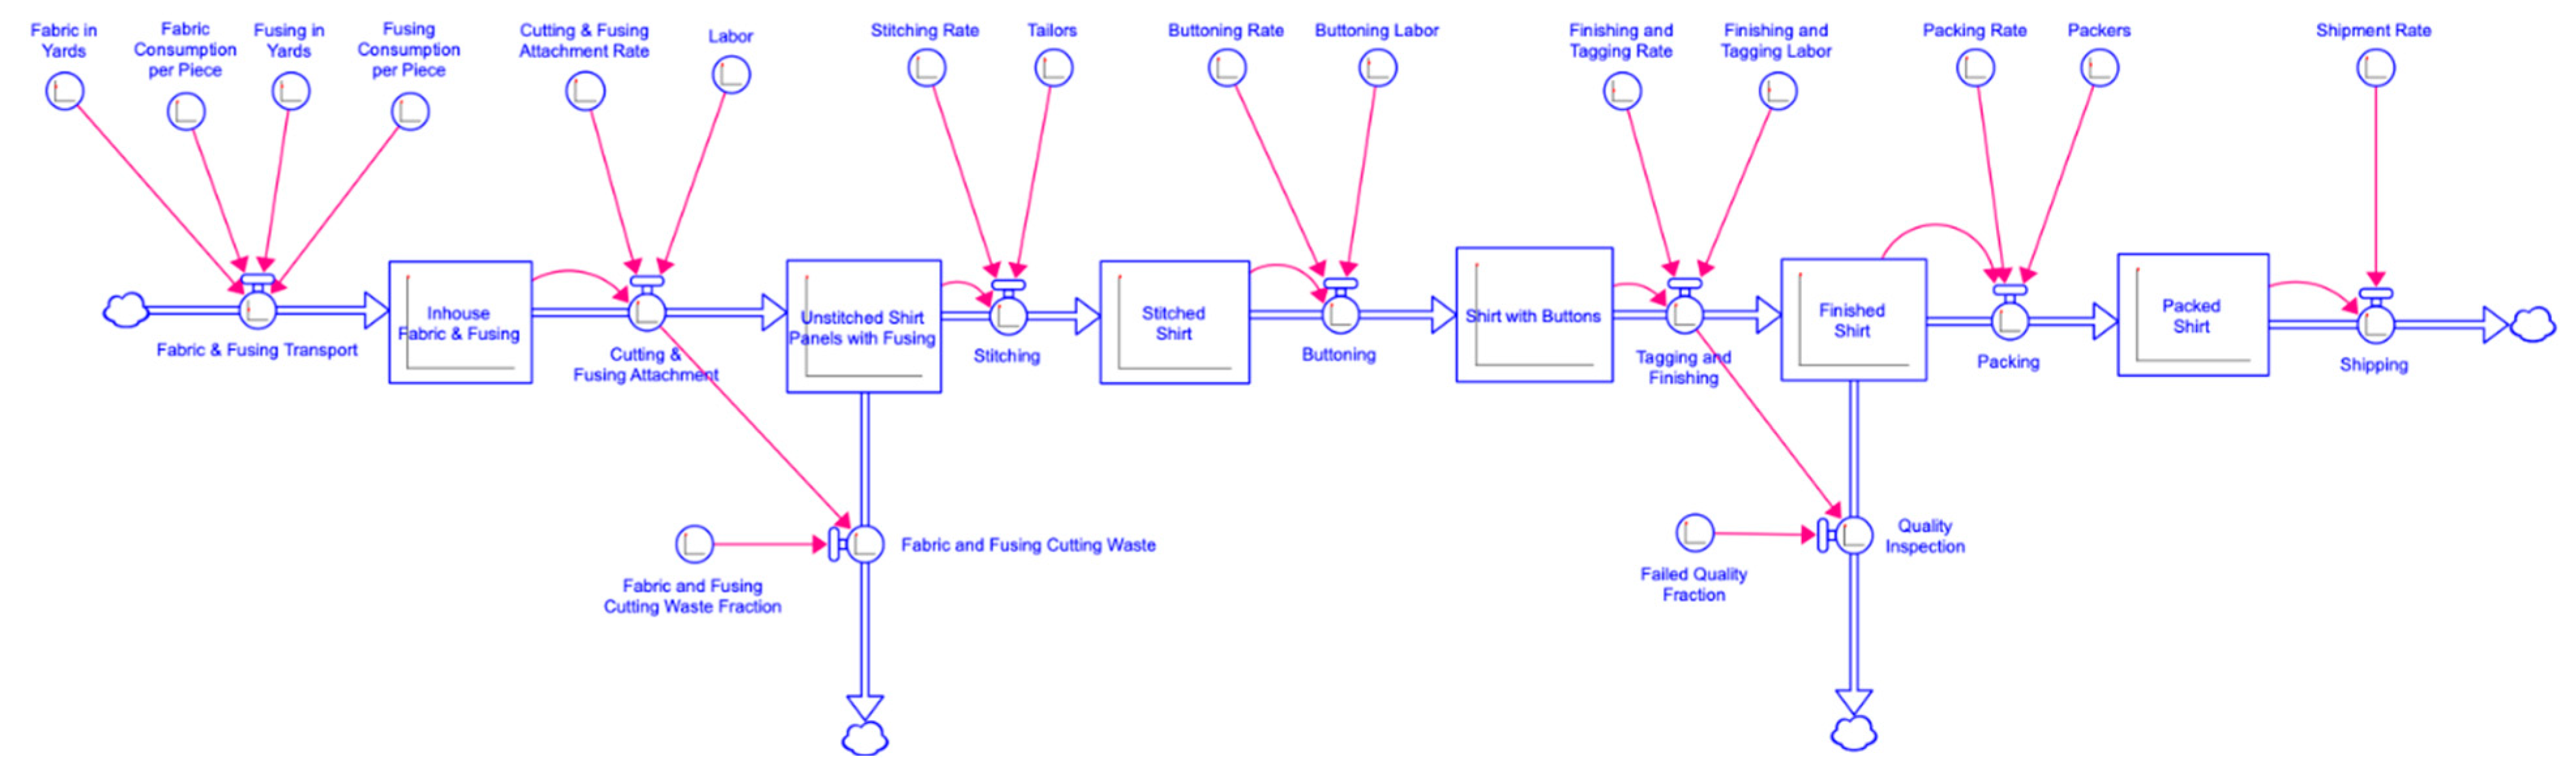
Figure 3.
Flows entering and exiting the stock, Unstitched Shirt Panels with Fusing.
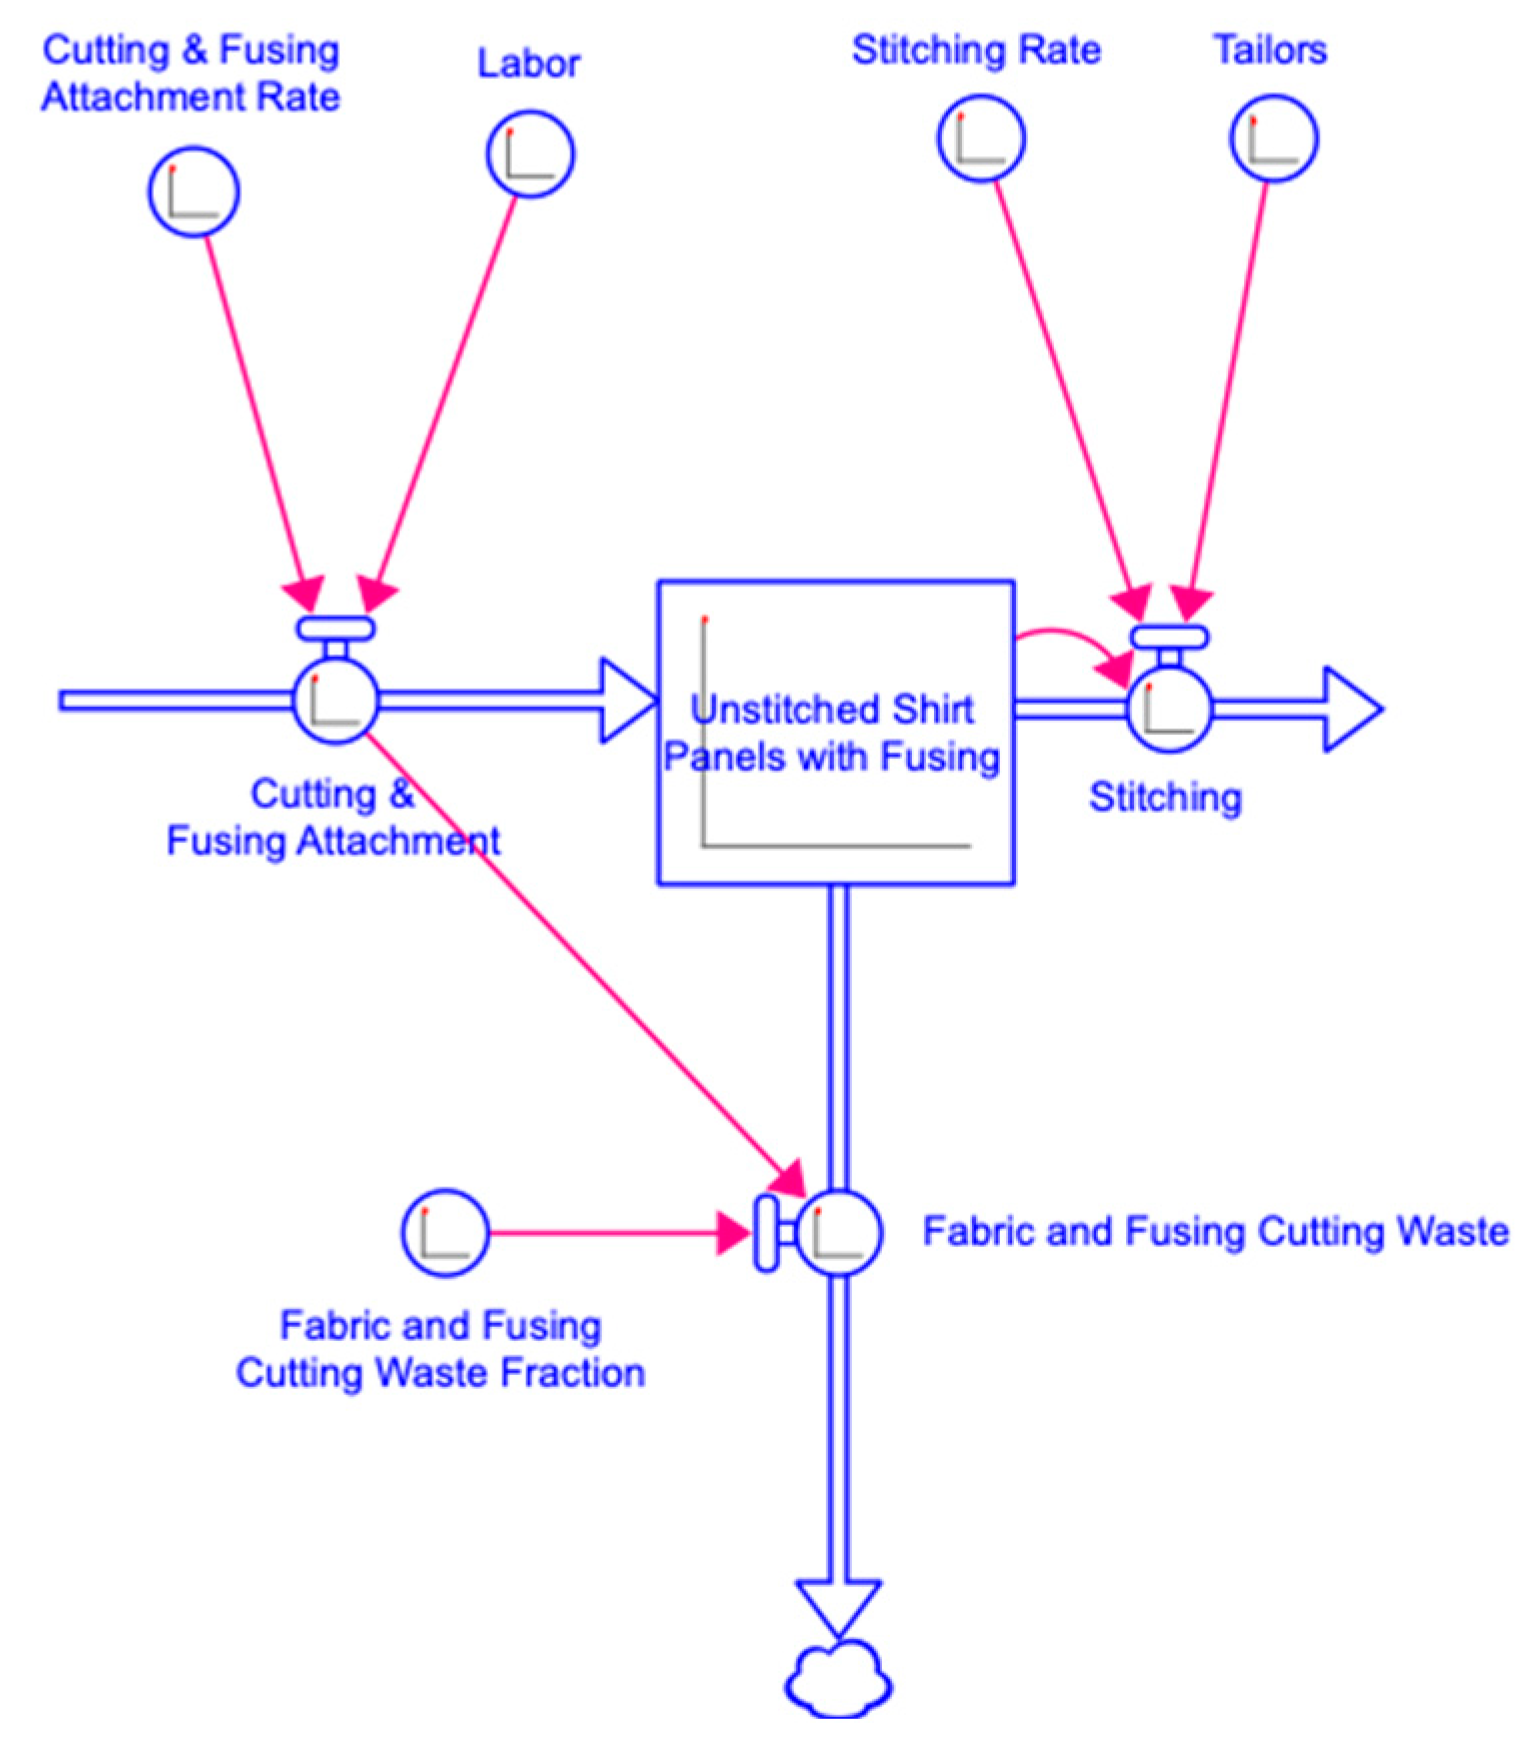
Figure 4.
Initial simulation.

Figure 5.
Optimized simulation.
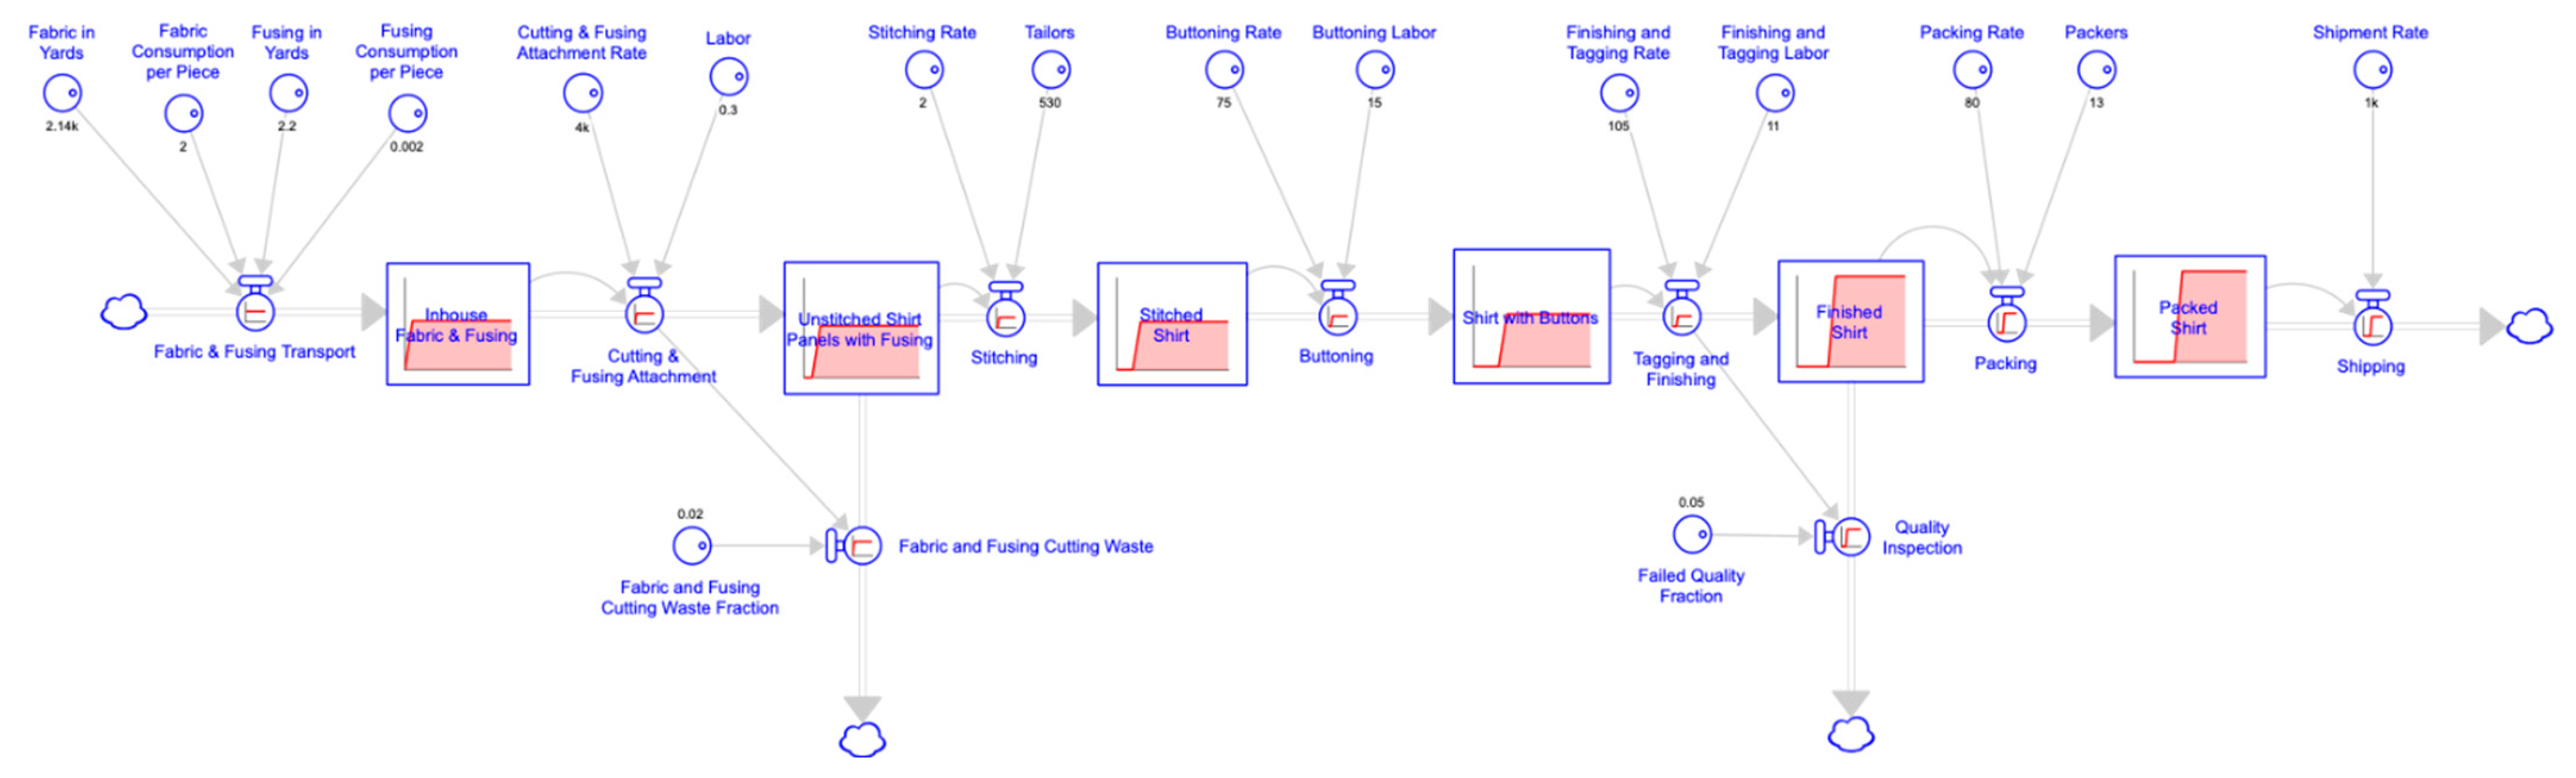
Table 1.
Stocks.
| Serial Nos. | Stocks (All Numbers Are per Day) | Description |
|---|---|---|
| 1. | Inhouse Fabric and Fusing | In-house quantity of fabric and fusing required to make up to 1000 shirts. |
| 2. | Unstitched Shirt Panels with Fusing | Quantity of unstitched, cut shirt panels attached with fusing. |
| 3. | Stitched Shirt | The number of shirts stitched. |
| 4. | Shirts with Buttons | The number of shirts with buttons attached. |
| 5. | Finished Shirt | The number of shirts finished after completing the tagging, finishing, and quality inspection. |
| 6. | Packed Shirt | The number of shirts packed for shipping. |
Table 2.
Converters.
| Serial Nos. | Converters | Description |
|---|---|---|
| 1. | Fabric Consumption per Piece | The amount of fabric consumed to manufacture one shirt. |
| 2. | Fabric in Yards | The fabric yardage required to manufacture up to 1000 shirts per day. |
| 3. | Fusing in Yards | The fusing yardage required to manufacture up to 1000 shirts per day. |
| 4. | Fusing Consumption per Piece | The amount of fusing consumed to manufacture one shirt. |
| 5. | Cutting and Fusing Attachment Rate | The number of shirt panels cut and fused per day. |
| 6. | Labor | The amount of labor (in full-time equivalent employees) required to cut shirt panels and attach fusing to the panels per day. |
| 7. | Cutting and Fusing | Waste fraction: the fraction of fabric and fusing waste generated from cutting. |
| 8. | Stitching Rate | The number of shirts sewn by a tailor using a sewing machine per day. |
| 9. | Tailors | The number of tailors required to sew up to 1000 shirts per day. |
| 10. | Buttoning Rate | The number of shirts buttoned per day by one laborer. |
| 11. | Buttoning Labor | The amount of labor needed to attach buttons to shirts per day. |
| 12. | Finishing and Tagging Rate | The number of shirts finished and tagged by one laborer per day. |
| 13. | Finishing and Tagging Labor | The amount of labor required to finish the shirts and add hand tags per day. |
| 14. | Failed Quality Fraction | The fraction of shirts rejected during inspection due to poor quality. |
| 15. | Packing Rate | The number of shirts packed for shipping by one laborer per day. |
| 16. | Packers | The amount of labor required to pack up to 1000 shirts per day. |
| 17. | Shipment Rate | The number of shirts shipped per day. |
Table 3.
Flows.
| Serial Nos. | Flows | Description |
|---|---|---|
| 1. | Fabric and Fusing Transport | The rate at which fabric and fusing are transported to the factory. |
| 2. | Cutting and Fusing Attachment | The rate at which shirt panels are cut and attached to the fusing. |
| 3. | Cutting and Fusing Waste | The rate of waste generation by cutting and fusing. |
| 4. | Stitching | The rate at which shirts are sewn. |
| 5. | Buttoning | The rate at which shirts are buttoned. |
| 6. | Tagging and Finishing | The rate at which shirts are finished and tagged. |
| 7. | Quality Inspection | The rate at which shirts pass quality inspection. |
| 8. | Packing | The rate at which shirts are packed for shipping. |
| 9. | Shipping | The rate at which shirts are shipped. |
Table 4.
Converters in Figure 3.
Table 4.
Converters in Figure 3.
| Serial Nos. | Converter | Converter’s Variable Name | Unit |
|---|---|---|---|
| 1. | Cutting and Fusing Attachment Rate | Cutting_&_Fusing_Attachment_Rate | Pieces/day |
| 2. | Labor | Labor | Unitless |
| 3. | Cutting and Fusing Waste Fraction | Cutting_&_Fusing_ Waste_Fraction | Unitless |
| 4. | Stitching Rate | Stitching_Rate | Pieces/day |
| 5. | Tailors | Tailor | Unitless |
Table 5.
Flows in Figure 3.
Table 5.
Flows in Figure 3.
| Serial Nos. | Name of the Flow | Equation | Unit |
|---|---|---|---|
| 1. | Cutting and Fusing Attachment | IF (Inhouse_Fabric_&_Fusing/DT) < (Cutting_&_Fusing_Attachment_Rate*Labor) THEN (Inhouse_Fabric_&_Fusing/DT) ELSE (Cutting_&_Fusing_Attachment_Rate*Labor) | Pieces/day |
| 2. | Fabric and Fusing Cutting Waste | (Cutting_&_Fusing_Attachment*Fabric_and_Fusing_Cutting_Waste_Fraction) | Pieces/day |
| 3. | Stitching | IF (Unstitched_Shirt_Panels_with_Fusing/DT) < (Stitching_Rate*Tailors) THEN (Unstitched_Shirt_Panels_with_Fusing/DT) ELSE (Stitching_Rate*Tailors) | Pieces/day |
Table 6.
Stock in Figure 3.
Table 6.
Stock in Figure 3.
| Serial Nos. | Name of the Stock | Equation of Stock | Unit |
|---|---|---|---|
| 1. | Unstitched Shirt Panels with Fusing (t) | Unstitched Shirt Panels with Fusing (t − dt) + Cutting and Fusing Attachment (t) − Stitching (t) − Fabric and Cutting Fusing Waste (t) | Pieces per day |
Table 7.
Converter inputs for initial simulation run.
| Serial Nos. | Converters | Initial Simulation’s Input Values |
|---|---|---|
| 1. | Fabric in Yards | 2500 |
| 2. | Fabric Consumption per Piece | 2 |
| 3. | Fusing in Yards | 2.2 |
| 4. | Fusing Consumption per Piece | 0.002 |
| 5. | Cutting and Fusing Attachment Rate | 4000 |
| 6. | Labor | 0.3 |
| 7. | Fabric and Fusing Cutting Waste Fraction | 0.02 |
| 8. | Stitching Rate | 3 |
| 9. | Tailors | 530 |
| 10. | Buttoning Rate | 75 |
| 11. | Buttoning Labor | 15 |
| 12. | Finishing and Tagging Rate | 105 |
| 13. | Finishing and Tagging Labor | 11 |
| 14. | Failed Quality Fraction | 0.05 |
| 15. | Packing Rate | 80 |
| 16. | Packers | 10 |
| 17. | Shipment Rate | 1000 |
Table 8.
Converter inputs for optimized simulation.
| Serial Nos. | Converters | Optimized Simulation Input Values |
|---|---|---|
| 1. | Fabric in Yards | 2144 |
| 2. | Fabric Consumption per Piece | 2 |
| 3. | Fusing in Yards | 2.2 |
| 4. | Fusing Consumption per Piece | 0.002 |
| 5. | Cutting and Fusing Attachment Rate | 4000 |
| 6. | Labor | 0.3 |
| 7. | Fabric and Fusing Cutting Waste Fraction | 0.02 |
| 8. | Stitching Rate | 2 |
| 9. | Tailors | 530 |
| 10. | Buttoning Rate | 75 |
| 11. | Buttoning Labor | 15 |
| 12. | Finishing and Tagging Rate | 105 |
| 13. | Finishing and Tagging Labor | 11 |
| 14. | Failed Quality Fraction | 0.05 |
| 15. | Packing Rate | 80 |
| 16. | Packers | 13 |
| 17. | Shipment Rate | 1000 |
Disclaimer/Publisher’s Note: The statements, opinions and data contained in all publications are solely those of the individual author(s) and contributor(s) and not of MDPI and/or the editor(s). MDPI and/or the editor(s) disclaim responsibility for any injury to people or property resulting from any ideas, methods, instructions or products referred to in the content. |
© 2023 by the authors. Licensee MDPI, Basel, Switzerland. This article is an open access article distributed under the terms and conditions of the Creative Commons Attribution (CC BY) license (https://creativecommons.org/licenses/by/4.0/).
Share and Cite
MDPI and ACS Style
Kaur, G.; Kander, R. Supply Chain Simulation of Manufacturing Shirts Using System Dynamics for Sustainability. Sustainability 2023, 15, 15353. https://doi.org/10.3390/su152115353
AMA Style
Kaur G, Kander R. Supply Chain Simulation of Manufacturing Shirts Using System Dynamics for Sustainability. Sustainability. 2023; 15(21):15353. https://doi.org/10.3390/su152115353
Chicago/Turabian StyleKaur, Gurinder, and Ronald Kander. 2023. "Supply Chain Simulation of Manufacturing Shirts Using System Dynamics for Sustainability" Sustainability 15, no. 21: 15353. https://doi.org/10.3390/su152115353
Note that from the first issue of 2016, this journal uses article numbers instead of page numbers. See further details here.