


Tracking Trash: Understanding Patterns of Debris Pollution in Knoxville’s Urban Streams
Department of Communication and Information, University of Tennessee, Knoxville, TN 37920, USA
Sustainability 2023, 15(24), 16747; https://doi.org/10.3390/su152416747
Submission received: 14 October 2023
/
Revised: 29 November 2023
/
Accepted: 10 December 2023
/
Published: 12 December 2023
(This article belongs to the Topic Aquatic Environment Research for Sustainable Development)
Abstract
:Urban streams and rivers often experience high levels of pollution from anthropogenic sources. Litter and plastic debris are of particular concern because they negatively impact ecosystem health, increase the risk of flooding, and limit human recreational opportunities. In the City of Knoxville, Tennessee, several urban streams are posted as impaired, with health and use advisories in place. Despite remediation efforts from local governance and charitable initiatives, urban stream pollution remains a pervasive issue in Knoxville. To support and inform local remediation actions and sustainable policy-making, this study seeks to model the relationship between meteorological and hydrological variables and anthropogenic debris pollution in three of Knoxville’s urban creeks. The study uses an innovative approach that includes the use of data from a local stream cleanup initiative. The results, which identify a number of significant relationships, are discussed as they relate to the locally specific context. The implications for local remediation actions and policy-making are discussed. Also, the limitations and directions for future study are presented.
1. Introduction
According to the 2020 Monitoring and Assessment Report by the Tennessee State Department of Environment and Conservation, just 8% of the state’s streams and rivers fully support their designated uses [1] (p. 46). The report highlights that although demands for extractive uses, such as irrigation and domestic water supply, are largely fulfilled, it is the widespread degradation of water quality that threatens uses linked to ecological functioning and human recreation. Specifically, the report finds that just 56% of Tennessee’s streams and rivers met the state’s permissible threshold for sustaining fish and other aquatic life, while just 44% adequately support recreational activities [1] (pp. 45–46). Alarmingly, these statistics are part of an ongoing trend of deteriorating conditions in Tennessee’s streams and rivers, with significant environmental and societal implications.
In urban settings, the degradation of stream and river water quality is of heightened concern due to its association with various critical factors. These include public health and safety risks [2], the reduction of community river connections [3], adverse effects on economic prosperity [4], and decreases in recreational prospects [5]. In Tennessee, municipal pollution sources are frequently cited as the primary drivers of urban waterway impairment, with 61% of municipal pollution directly attributable to urbanized (high population density) areas [1] (p. 82). In urbanized areas, municipal pollutions present pervasive management dilemmas for urban governance structures because they are often linked to non-point source pollution from stormwater runoff, which is challenging to regulate [6].
The City of Knoxville, which is Tennessee’s third-largest city by population, experiences significant municipal source pollution of its streams and rivers. Many of Knoxville’s streams transport anthropogenic substrates, harmful bacteria including Escherichia coli (E. coli), high sediment loads, and high nutrient loads from urbanized areas to the adjoining Tennessee River [7]. Accordingly, many of Knoxville’s streams and rivers are designated as impaired, with several public health advisories in place [8] (p. 2). Recognizing these issues, the City of Knoxville Municipality has enacted various policies and partnered with several local organizations to attempt to clean up local waterways (a summary of the policies and partnerships is available in Table 1).
While previous research has examined various aspects of pollution in Knoxville’s urban creeks, including nutrient, microbial, and fecal coliform transport [9,10], little research has sought to investigate the patterns of litter debris pollution. This is surprising because litter debris, henceforth referred to as refuse, represents a substantial local challenge [11,12], and a predominant focus of local remedial initiatives (as described in Table 1). In freshwater environments, refuse pollutants are of particular concern because they encompass plastic materials, which are known to impact aquatic ecosystem health [13,14], increase the likelihood and severity of flooding [15], and discourage community recreational uses [16].
Yet, to date, the study of plastic pollution in freshwater environments remains understudied [13,17,18,19]. While the literature regarding marine plastic pollution is more established, we know comparatively little about the drivers of freshwater plastic pollution. Urban areas are assumed to be the main source of freshwater plastic pollution owing to high anthropogenic activity [20]. However, beyond this simplistic conceptualization, there is a limited understanding of how environmental drivers support the movement of refuse materials from urban landscapes to freshwater systems. Initial evidence suggests that precipitation events, which drive surface water runoff, work to mobilize refuse materials and transport them into freshwaters [21,22,23,24]. However, this finding is inconsistent among urban contexts [20]. Even less is known regarding how additional meteorological variables, such as wind, and hydrological variables, such as river discharge rates, relate to the transport of refuse materials [23,25].
This existing knowledge gap is, in part, tied to the skewed focus of the literature, which has prioritized the study of microplastics, when compared to mesoplastics and macroplastics [17]. Yet, in urban freshwaters, which represent a primary point of entry for refuse materials [20], mesoplastics and macroplastics are commonplace, with anthropogenic litter often comprising plastic bottles, bags, and packaging [17,26]. Indeed, evidence suggests that mesoplastics and macroplastics represent a significant proportion of the plastic volume in freshwaters [27,28]. From a socio-ecological standpoint, mesoplastics and macroplastics are significant because, as conspicuous pollutants, they deter the recreational utilization of freshwater [16]. Moreover, they pose ecological threats through species ingestion [29] and plastic-species entanglements [18], before fragmenting into microplastics that present other pervasive challenges [30].
There is a critical need to better understand how environmental drivers relate to the transport of refuse materials to urban freshwaters. To begin to address this knowledge gap, this study investigates the role of hydrological and meteorological variables, which are known to relate to pollution characteristics in other urban contexts, and their relationship to refuse pollution in Knoxville’s streams. By identifying a number of significant relationships, this study makes a number of recommendations for sustainable development and sustainable urban planning. Finally, study limitations and directions for future research are discussed.
2. Materials and Methods
2.1. Study Area
Knoxville, which is located in eastern Tennessee, has a population of just over 190,000 residents. Surrounded by the Great Smoky Mountains to the east and the Cumberland Plateau to the west, Knoxville has a humid subtropical climate [31]. Knoxville has a small but dense urban center, which is positioned north of the city, near the main campus of the University of Tennessee and the downtown district. However, beyond this core, Knoxville exhibits much urban sprawl, with lower building density and height [32]. North and south Knoxville are split by the Tennessee River, which is formed at the nearby confluence of the Holston River and the French Broad River. From Knoxville, the Tennessee River flows southwest and eventually joins the Ohio River in western Kentucky.
The streams First Creek, Second Creek, and Third Creek each meander through the heart of north Knoxville’s most urbanized district. Each draining into the Tennessee River, these streams have been individually assessed by the State Department of Environment and Conservation and determined to be impaired [7] (p. 2). Table 2 describes the causes and potential sources of impairment for each stream.
Additionally, the Tennessee Division of Water Resources has placed each stream on the state bacteriological and fishing advisory list, meaning that fish should not be taken or consumed from these waters for risk of contamination [8] (p. 2). Each stream experiences sporadic flash flooding, which can impact recreational access to adjacent greenway trails and nearby property [33]. The City of Knoxville Municipality has erected notice signs along each creek warning against physical contact with the water. The Tennessee River in Knoxville also exhibits poor water quality. In addition to pollutants linked to agricultural sources, the Tennessee River exhibits alarming rates of plastic and microplastic pollution, which have been linked to adjacent landfill sites and litter from municipal source pollution [34].
2.2. Sampling
2.2.1. Creek Refuse Pollution
Data regarding the volume of refuse pollutants present in First Creek, Second Creek, and Third Creek between January 2021 and November 2022 were obtained from a local river cleanup initiative. The cleanup initiative collected and measured the volume of refuse materials present in each creek at its respective confluence with the Tennessee River. At each collection site, the cleanup initiative continuously deployed an Elastec Spill Containment Boom across the width of the creek confluence. The containment boom, which comprises a 10.1 cm floating barrier and a 15.2 cm subsurface curtain, works to prevent the flow of surface-moving debris from the creeks into the Tennessee River. The boom does not prevent the transport of refuse that is moving via suspension, saltation, or traction at depths below the subsurface curtain. Appendix A displays the deployment of the containment boom at Third Creek.
During the sampling period, the operations of the cleanup initiative were guided by the boat captain. Across the sampling period, 163 individual site collections were conducted. The collection procedure involved the use of a 7.3 m SeaArk boat to visit and visually inspect each site. At each site, the captain evaluated the extent of pollutant accumulation and determined whether the threshold for initiating a cleanup was met. The captain described this threshold as being met when the volume of pollutants present was expected to fill at least one 125 L container. When the captain deemed this threshold to be met, a full collection of visible refuse materials was conducted.
The collection methodology was consistent between all sites. The captain positioned the boat adjacent to the containment boom and used a 55 cm diameter net with a 2 cm diameter mesh and 3 m handle to collect all visible refuse pollutants. Due to the nature of the collection net, refuse materials smaller than 2 cm were not collected. A 3.6 m boom with an attached metal hook was used to reach refuse lodged in rock revetments positioned along the creek banks. Bycatch of natural matter and organic materials was discarded prior to placing the refuse pollutants into a 125 L container, which was lined with a bag. Once in the container, efforts were made to compress the items collected, and a container was considered full once there was no longer space to add additional items (Appendix B). A site collection was considered complete when no more pollutants were visible. As such, the duration of each site collection was variable, ranging from approximately 30 min to 90 min. Once collection was complete, the number of 125 L containers collected at each site was recorded in a Microsoft Excel workbook. In total, across the sampling period, 1,308,125 L bags were collected, representing a volumetric total of 163,500 L.
As it pertains to this study, it is notable that while sampling occurred at irregular intervals, the data collected describe the cumulative volume of pollutants amassed at the containment booms over time between the sample periods. Therefore, it is possible to determine the rate of pollutant accumulation by considering the volume amassed divided by the duration of accumulation.
2.2.2. Hydrological and Meteorological Variables
In this study, two meteorological (precipitation and windspeed) variables and two hydrological variables (tributary creek level and tributary creek flow rate) are considered. The descriptions of each variable and their data source are provided below.
Historic data regarding the meteorological variables of precipitation rate and windspeed were obtained from the National Oceanic and Atmospheric Administration’s (NOAA) weather monitoring at McGee Tyson Airport, Knoxville. As the closest NOAA weather station to the confluence sampling sites, the station is located approximately 10 miles southwest of the river sampling sites. For both precipitation and windspeed, the NOAA data are provided as a daily average. The precipitation rate is recorded in inches and the windspeed is recorded in miles per hour. The NOAA precipitation data are categorized into three types: rain, snow, and ice. As such, it was necessary to sum the total precipitation for each type to calculate the overall precipitation rate.
Historic data regarding the First Creek stream level (gauge height) and First Creek stream flow rate (discharge) were obtained from the City of Knoxville’s monitoring system located in First Creek [35]. Using an automated system, the monitoring station takes measurements of First Creek’s gauge height and discharge rate every 15 min. The stream level data are recorded in feet and the stream flow rate data are recorded in cubic feet per second. Data on the gauge height and discharge rate for Second Creek and Third Creek were unavailable for use in this study. However, due to the close geographic proximity of the three respective creeks, their similar hydrologic characteristics, and their similar spatial orientations within Knoxville’s urban district, it is likely that fluctuations in the gauge height and discharge rate of First Creek will be moderately reflective of the conditions in Second Creek and Third Creek [35].
2.3. Analyses
In this study, due to limitations in the procedural collection and abundance of data regarding refuse pollutant accumulation (see Section 4.1), a data aggregation approach was deployed to support statistical analyses and interpretation. In the analyses, pollutant data from First Creek, Second Creek, and Third Creek were grouped and assessed across monthly intervals. Similarly, precipitation, windspeed, creek level, and creek flow rate data were aggregated to the monthly level. Data were aggregated to the monthly level because this time period was short enough to provide a granular view of short- to mid-term fluctuations in the independent variables, while being long enough to encompass multiple sampling collections within the dependent variable dataset. This strategy allowed for the identification of more reliable conclusions and the detection of significant patterns, which might have been otherwise challenging to identify.
To explore the relationship between meteorological and hydrological variables and refuse pollutant accumulation, a dynamic regression model with autoregressive errors was implemented. Specifically, rainfall, windspeed, the creek level, and the creek flow rate were examined as independent variables, while refuse pollutant accumulation served as the dependent variable. After an initial examination of the model assumptions, multicollinearity was found to exist between the variables creek flow rate and creek level. Therefore, the variable creek level, as a less significant model term, was removed from the model. The subsequent model, which includes the three independent variables, rainfall, windspeed, and the creek flow rate, satisfied the model assumptions, with normally distributed residuals and without any identifiable outliers. Due to the incomplete time series data in the dependent variable dataset, a time-series model was not appropriate, so a stationary model was used. Consequently, the model is unable to support the identification of seasonal or time-series trends. The analysis was performed in IBM Corp. Released 2023. IBM SPSS Statistics for Windows, Version 29.0. IBM Corp: Armonk, NY, USA.
3. Results
Using a dynamic regression model analysis, the association between meteorological and hydrological variables and refuse pollutant accumulation was assessed. The model works to explain 63.6% of the variation in the dependent variable (R-Squared = 0.636).
The statistical model can be written as:
where is the refuse accumulation at time t, is the average rainfall for the month at time t, is the average monthly windspeed at time t, is the average monthly creek flow rate at time t, is the autoregressive error at time t, and is the normally distributed white noise series.
The model revealed that the intercept term (4.343) was statistically significant (t = 5.738, p < 0.001). The autoregressive term was found not to be significant (t = 1.462, p = 0.162), signifying that the previous value of refuse pollution does not exert a significant influence on the current value.
The variable rainfall emerged as a statistically significant predictor (t = 4.252, p < 0.001) of refuse pollutant accumulation, with an estimated coefficient of 14.256. This result indicates that for each one-inch increment increase in the daily precipitation rate, there was a corresponding increase in the rate of accumulation of refuse pollutants of 14.256 bags (where each bag represents a 125 L volume). The variable windspeed also demonstrated statistical significance (t = −2.945, p = 0.009), with an estimated coefficient of −0.371. This finding suggests that for every one mile per hour increment increase in windspeed, there was a corresponding decrease in the rate of accumulation of refuse pollutants of 0.371 bags. Finally, the variable creek flow rate displayed statistical significance (t = −3.060, p = 0.007), with an estimated coefficient of −0.003. This result suggests that for every one cubic foot per second increment increase in the stream flow rate, there was a corresponding decrease in the rate of accumulation of refuse pollutants of 0.003.
These results are described in Table 3 below.
4. Discussion
The urban streams of Knoxville, Tennessee, experience poor water quality predominantly because of municipal source pollution. As impaired waterways, these streams are unable to support critical socio-environmental functions and pose human health risks. To better understand the dynamics of this problem, this study endeavored to model the accumulation of refuse pollutants at the confluence of three urban tributaries of the Tennessee River in Knoxville. The results indicate that the hydrological variable creek flow rate and the meteorological variables precipitation rate and windspeed are related to the accumulation of anthropogenic pollutants.
Numerous studies have established a link between meteorological processes, including wind and rain, and the accumulation of anthropogenic pollutants in bodies of water [36,37,38]. However, from this body of evidence, it is clear that meteorological processes interact with other contextually dependent factors to produce divergent pollution outcomes between places. In urban areas, the spatial distribution and topological profiles of impervious surfaces relate to patterns of surface water runoff, which in turn influence the transport of pollutants to bodies of water [39,40]. Other factors, including the efficiency and capacity of a city’s stormwater system, work to further modify the relationship between meteorological conditions and riverine pollution [41]. Similarly, hydrological variables such as the stream level and flow rate are known to influence a river’s carrying capacity, which relates to the ability of the system to transport pollutants [42]. Like meteorological variables, hydrological variables interact with locally dependent factors, such as the formation and presence of channel blockages, including woody debris jams and refuse pollutant jams, to produce variable effects on pollutant transport [15,43]. Thus, considering the notion that stream pollution dynamics are highly contextually dependent, it was important to establish the locally specific relationship between hydrological and meteorological variables and refuse pollution in Knoxville.
In this study, precipitation was found to positively relate to the volume of anthropogenic pollutants collected. One explanation for this result is linked to the abundance of impervious surfaces and the moderately high relief urban landscape that surrounds the First Creek, Second Creek, and Third Creek, which work to increase the rates of surface water runoff and pollutant transport during rainfall events [10,44]. This finding is largely consistent with studies of refuse pollution in other urban contexts [45,46]. The pervasive nature of this challenge is acknowledged by the City of Knoxville municipality, which denotes the flash flooding of its urban environments as a current challenge in its sustainability goals [47]. Additionally, this finding indicates that while the City of Knoxville Municipality has invested in refuse pollutant remediation measures within the stream catchments [48], these measures are insufficient to moderate the significant local impacts of precipitation on stream pollution.
The finding adds to the existing research that has established links between precipitation events and increased nutrient and bacterial pollution in Knoxville’s urban creeks [9,10]. In this context, the local municipality may consider significant modifications to urban drainage, such as the implementation of practices and techniques consistent with Sustainable Urban Drainage Systems (SUDS) [49]. By seeking to mimic natural water systems, SUDS endeavor to alleviate the adverse impacts of non-point source pollution by increasing infiltration and reducing surface water runoff, and improving water retention and reuse [49,50].
In this study, while precipitation was found to relate positively to the volume of refuse pollutants collected, both windspeed and the stream flow rate were found to relate negatively to the volume of the refuse pollutants collected. On the face of it, these results are somewhat unintuitive and largely contradictory of the findings in other research contexts [51]. Research has demonstrated that higher windspeeds tend to support both the movement of refuse materials to streams and the transport of floating material once in the watercourse [20]. Similarly, higher discharge rates can work to increase refuse pollution rates by remobilizing materials previously trapped within features of the watercourse [52]. However, a number of additional factors are known to moderate these influences on pollution dynamics. As the stream flow rate increases, associated increases in the stream gauge height work to expose floating refuse to vegetative obstructions in the riparian zone [53]. Connectedly, increases in stream flow rates can support the formation of natural and anthropogenic material jams and blockages, which work to moderate rates of material transport [15,43]. Additionally, as it relates to the accumulation of refuse materials at the spill containment booms deployed at the collection sites, it is likely that increases in turbulence associated with higher windspeeds may decrease the efficiency of the booms in trapping refuse material [54]. However, further research is required to establish the role of windspeed and turbulence in moderating the efficiency of booms [55].
While the interpretation of the results of this study is limited by the relative infancy of the scientific literature regarding freshwater refuse pollution dynamics [14], the findings represent an important first step in supporting local remediation socio-environmental actions. Recognizing the remarkable success of other local socio-environmental actions, including the establishment of Knoxville’s Urban Wilderness [56], and Knoxville’s Urban Greenway Network [57], it is critical that improvements are made to local waterways to support positive socio-environmental outcomes. It is striking that Knoxville’s urban creeks are unable to support recreational activities such as fishing, paddling, and bathing, which are commonplace in other urban waterways [58,59]. The desire for such change is evident in the popularity of Knoxville’s still waters, including the lakes at Fort Dickerson and Augusta Quarry, which exhibit superior water quality and heavy recreational use [60].
As the findings of this study relate to supporting local remediation actions, such as those described in Table 1, it is notable that rainfall is distinguishable as the primary local determinant of refuse pollution dynamics. By monitoring local rainfall patterns and scheduling cleanup events to correspond with periods of high rainfall, local remediation initiatives can systematically operate during periods when high volumes of refuse pollutants are likely to be present, thus improving their efficiency. Although the variables windspeed and the stream flow rate were found to negatively relate to refuse pollutant accumulation, the aforementioned complexities in interpreting their respective influences on pollutant dynamics, and their relatively small influence on the accumulation of refuse pollutants, make their suitability for consideration by local initiatives less appropriate. Caution should be exercised when considering the generalizability of the study findings to other local and regional contexts because site-specific factors will influence the transferability of inferences.
4.1. Limitations and Direction for Future Research
A number of limitations are identifiable in this study. While this study focused on meteorological and hydrological variables, other variables are known to be important determinants of stream pollution dynamics. For instance, in urban environments, individuals experiencing unsheltered homelessness often seek refuge near waterways because such areas provide shaded spaces and access to water for essential functions such as drinking, washing, and cooking [61]. Unsheltered populations pose a risk to water quality by practicing open defecation [62], and through littering [63,64]. As a significant population of unsheltered individuals reside in Knoxville’s urban districts [65], future research should consider the role of this social variable in refuse pollution patterns, particularly as it pertains to seasonal fluctuations in unsheltered homelessness [66].
Another limitation relates to the use of secondary data regarding refuse pollutant accumulation, which were collected by a local cleanup initiative. Specifically, the data collection methodology was only semi-systematic, involving sampling at irregular intervals. Consequently, it was necessary to aggregate pollutant data among sites and across a monthly timescale, which reduced the granularity of inference and the identification of varying dynamics between streams. Future research, which is supported by superior and complete time-series data, should seek to develop a predictive model for pollution dynamics. The results of such analyses would present improved support for local policymaking and remediation initiatives. Similarly, this study only considered three independent variables. However, future research should continue to assess the rapidly evolving field of anthropogenic debris and plastic pollution dynamics in freshwaters, in order to better account for emerging variables of interest.
A further limitation is that this study only evaluated refuse materials that were retained at the spill containment booms and were sufficiently large enough to be collected via a net. It is important to emphasize that the containment booms do not block the downstream transport of all refuse materials. Instead, the booms work to block materials that are either floating or suspended in the upper water column. Furthermore, as refuse materials were collected using a net with a 2 cm mesh, materials smaller than 2 cm were not included in the analyses. Consequently, the results of this study are limited to modeling only the larger materials accumulated at the containment booms. Future research should seek to understand the relative efficiency of containment booms in preventing the downstream movement of refuse materials.
5. Conclusions
Maintaining and improving water quality is an important consideration for sustainable development [67]. Yet, in urban freshwater settings, anthropogenic refuse pollution receives little attention compared to other forms of pollution [28]. While it is established that refuse pollution threatens aquatic ecosystems [13], human recreational opportunities, and human health [28], we poorly understand the mechanisms that drive refuse pollution in urban freshwaters [18]. Specifically, there is a critical need to identify the environmental drivers that work to mobilize and transport refuse materials from urban landscapes to nearby freshwaters. The identification of such drivers is important for supporting sustainable decision-making [20].
In this context, this study endeavored to model the dynamics of refuse pollution in three urban creeks in Knoxville, Tennessee. The results indicate that the environmental variables precipitation, wind, and the creek flow rate relate to the accumulation of refuse pollution. These findings emphasize the importance of considering multiple environmental factors in the management of refuse pollution. While this study represents an essential first step, future research should seek to identify and investigate additional environmental factors that may relate to refuse pollution dynamics. As additional variables are identified, an enhanced understanding of refuse pollution dynamics can support the refinement of effective remedial strategies.
Funding
This research received no external funding.
Institutional Review Board Statement
Not applicable.
Informed Consent Statement
Not applicable.
Data Availability Statement
Data from the National Oceanic and Atmospheric Administration (NOAA) weather stations are available at the link. https://www.ncdc.noaa.gov/cdo-web/datatools/findstation, accessed on 21 September 2023. Creek data were made available upon request from the City of Knoxville Stormwater division by Ms Ogelsby at [email protected], accessed on 21 September 2023.
Acknowledgments
The author acknowledges the technical support provided by Rebecca Bergee.
Conflicts of Interest
The authors declare no conflict of interest.
Appendix A
Figure A1.
Deployment of the spill containment boom (yellow) across the confluence point of Third Creek and the Tennessee River.
Figure A1.
Deployment of the spill containment boom (yellow) across the confluence point of Third Creek and the Tennessee River.

Appendix B
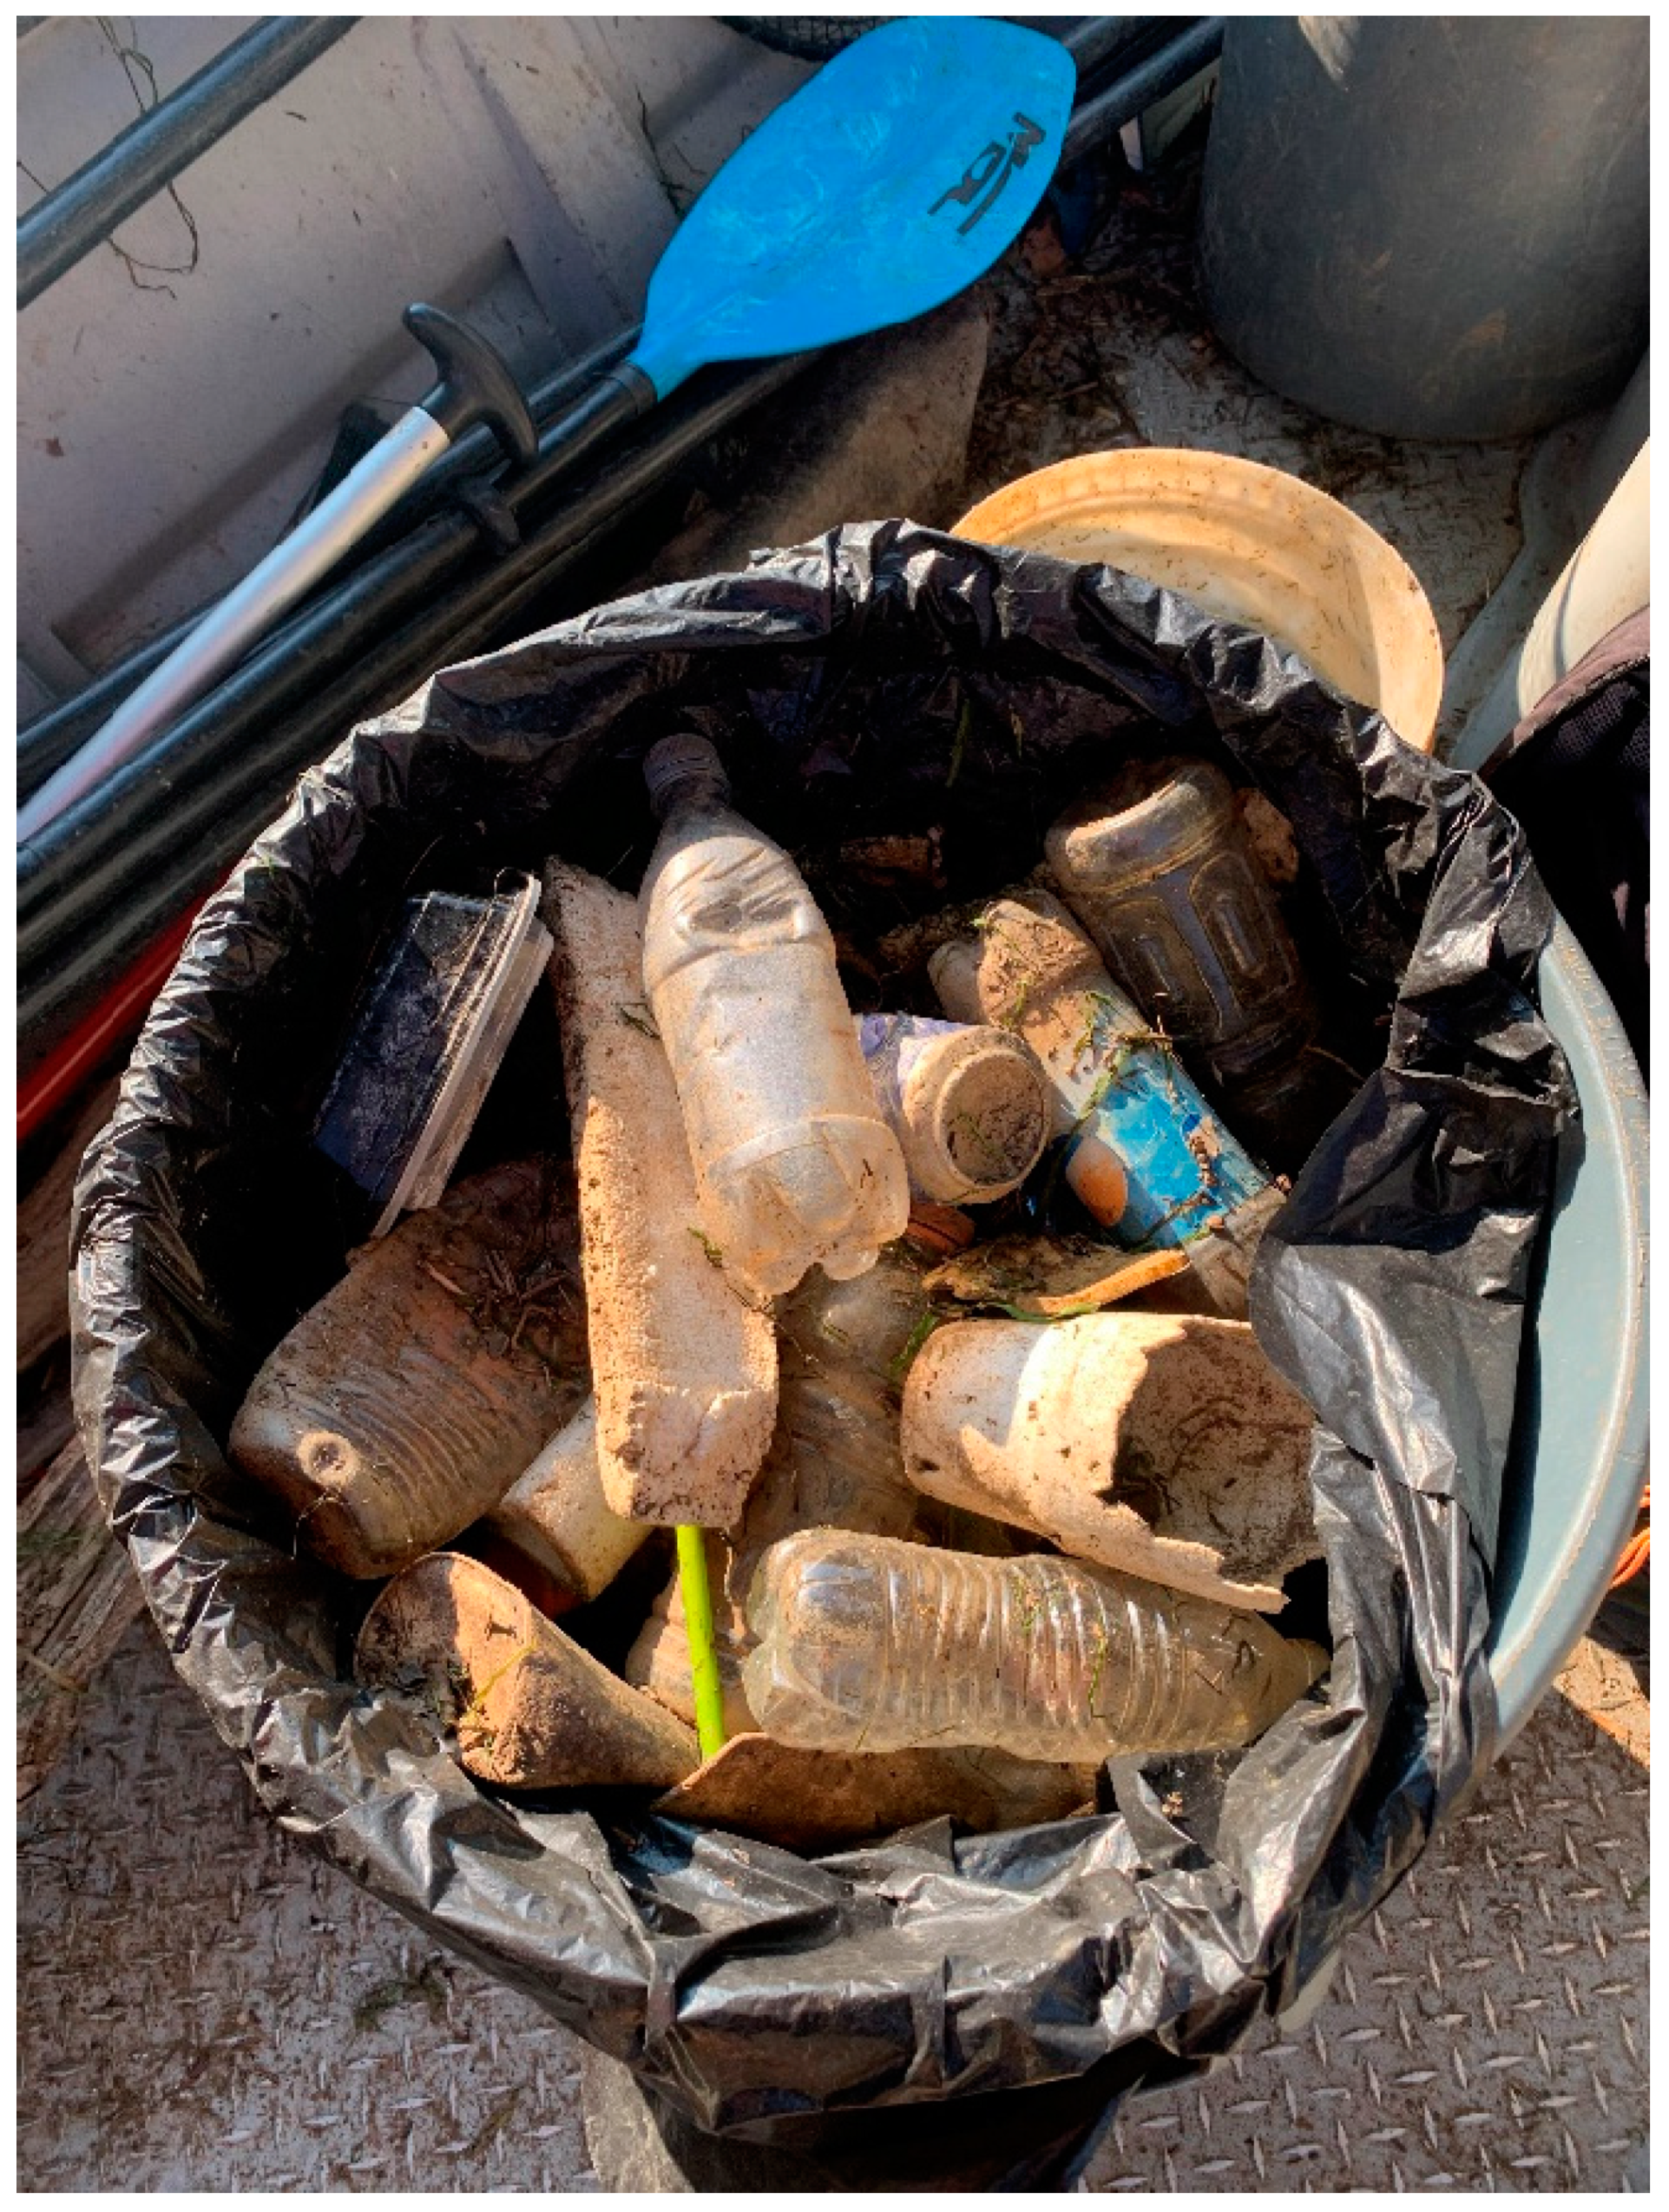
Figure A2.
Example of the refuse pollutants collected. Image taken from a September 2023 collection at Third Creek.
Figure A2.
Example of the refuse pollutants collected. Image taken from a September 2023 collection at Third Creek.
References
- Tennessee’s Clean Water Act Monitoring and Assessment Report; Tennessee Department of Environment and Conservation Division of Water Resources; 2020; p. 116. Available online: https://www.tn.gov/content/dam/tn/environment/water/watershed-planning/wr_wq_cwa-integrated-305b-2020.pdf (accessed on 10 October 2023).
- Zingraff-Hamed, A.; Bonnefond, M.; Bonthoux, S.; Legay, N.; Greulich, S.; Robert, A.; Rotgé, V.; Serrano, J.; Cao, Y.; Bala, R. Human–river encounter sites: Looking for harmony between humans and nature in cities. Sustainability 2021, 13, 2864. [Google Scholar] [CrossRef]
- Steinwender, A.; Gundacker, C.; Wittmann, K.J. Objective versus subjective assessments of environmental quality of standing and running waters in a large city. Landsc. Urban Plan. 2008, 84, 116–126. [Google Scholar] [CrossRef]
- Poor, P.J.; Pessagno, K.L.; Paul, R.W. Exploring the hedonic value of ambient water quality: A local watershed-based study. Ecol. Econ. 2007, 60, 797–806. [Google Scholar] [CrossRef]
- Breen, B.; Curtis, J.; Hynes, S. Water quality and recreational use of public waterways. J. Environ. Econ. Policy 2018, 7, 1–15. [Google Scholar] [CrossRef]
- Niemczynowicz, J. Urban hydrology and water management–present and future challenges. Urban Water 1999, 1, 1–14. [Google Scholar] [CrossRef]
- List of Impaired and Threatened Waters in Tennessee 2022. Available online: https://www.tn.gov/environment/program-areas/wr-water-resources/water-quality/water-quality-reports---publications.html (accessed on 10 October 2023).
- Posted Streams, Rivers, and Reservoirs in Tennessee; Tennessee Division of Water Resources; 2023. Available online: https://www.tn.gov/content/dam/tn/environment/water/watershed-planning/wr_wq_fish-advisories.pdf (accessed on 10 October 2023).
- Christian, L.; Epps, T.; Diab, G.; Hathaway, J. Pollutant concentration patterns of in-stream urban stormwater runoff. Water 2020, 12, 2534. [Google Scholar] [CrossRef]
- Epps, T.H.; Hathaway, J.M. Inter-event water quality variability and intra-event pollutant dynamics in context of effective impervious area. J. Sustain. Water Built Environ. 2021, 7, 04021013. [Google Scholar] [CrossRef]
- City of Knoxville. What’s with the Trash in the Creeks?—River Booms Explained. Available online: https://www.knoxvilletn.gov/blog/one.aspx?portalId=132035&postId=8933828&portletAction=viewpost (accessed on 1 September 2023).
- WVLT 8 News. Disturbing photo shows trash collecting in creeks near downtown Knoxville. 6 October 2020. Available online: https://www.wvlt.tv/2020/10/06/disturbing-photo-shows-trash-collecting-in-creeks-near-downtown-knoxville/ (accessed on 4 September 2023).
- Azevedo-Santos, V.M.; Brito, M.F.; Manoel, P.S.; Perroca, J.F.; Rodrigues-Filho, J.L.; Paschoal, L.R.; Gonçalves, G.R.; Wolf, M.R.; Blettler, M.C.; Andrade, M.C. Plastic pollution: A focus on freshwater biodiversity. Ambio 2021, 50, 1313–1324. [Google Scholar] [CrossRef]
- van Emmerik, T.; Schwarz, A. Plastic debris in rivers. Wiley Interdiscip. Rev. Water 2020, 7, e1398. [Google Scholar] [CrossRef]
- Honingh, D.; Van Emmerik, T.; Uijttewaal, W.; Kardhana, H.; Hoes, O.; Van de Giesen, N. Urban river water level increase through plastic waste accumulation at a rack structure. Front. Earth Sci. 2020, 8, 28. [Google Scholar] [CrossRef]
- Valois, A.E.; Milne, J.R.; Heath, M.W.; Davies-Colley, R.J.; Martin, E.; Stott, R. Community volunteer assessment of recreational water quality in the Hutt River, Wellington. N. Z. J. Mar. Freshw. Res. 2020, 54, 200–217. [Google Scholar] [CrossRef]
- Blettler, M.C.; Abrial, E.; Khan, F.R.; Sivri, N.; Espinola, L.A. Freshwater plastic pollution: Recognizing research biases and identifying knowledge gaps. Water Res. 2018, 143, 416–424. [Google Scholar] [CrossRef] [PubMed]
- Blettler, M.C.; Wantzen, K.M. Threats underestimated in freshwater plastic pollution: Mini-review. Water Air Soil Pollut. 2019, 230, 174. [Google Scholar] [CrossRef]
- Malizia, A.; Monmany-Garzia, A.C. Terrestrial ecologists should stop ignoring plastic pollution in the Anthropocene time. Sci. Total Environ. 2019, 668, 1025–1029. [Google Scholar] [CrossRef] [PubMed]
- Tasseron, P.; Begemann, F.; Joosse, N.; van der Ploeg, M.; van Driel, J.; van Emmerik, T. Amsterdam urban water system as entry point of river plastic pollution. Environ. Sci. Pollut. Res. 2023, 30, 73590–73599. [Google Scholar] [CrossRef] [PubMed]
- Cheung, P.K.; Hung, P.L.; Fok, L. River microplastic contamination and dynamics upon a rainfall event in Hong Kong, China. Environ. Process. 2019, 6, 253–264. [Google Scholar] [CrossRef]
- Haberstroh, C.J.; Arias, M.E.; Yin, Z.; Wang, M.C. Effects of urban hydrology on plastic transport in a subtropical river. Acs EsT Water 2021, 1, 1714–1727. [Google Scholar] [CrossRef]
- Bertoldi, C.; Lara, L.Z.; Fernandes, A.N. Revealing microplastic dynamics: The impact of precipitation and depth in urban river ecosystems. Environ. Sci. Pollut. Res. 2023, 30, 111231–111243. [Google Scholar] [CrossRef]
- Pinto, R.B.; Barendse, T.; van Emmerik, T.; van der Ploeg, M.; Annor, F.O.; Duah, K.; Udo, J.; Uijlenhoet, R. Exploring plastic transport dynamics in the Odaw river, Ghana. Front. Environ. Sci. 2023, 11, 183. [Google Scholar] [CrossRef]
- Lechthaler, S.; Waldschläger, K.; Stauch, G.; Schüttrumpf, H. The way of macroplastic through the environment. Environments 2020, 7, 73. [Google Scholar] [CrossRef]
- Oswald, S.B.; Ragas, A.M.; Schoor, M.M.; Collas, F.P. Quantification and characterization of macro-and mesoplastic items in the water column of the river Waal. Sci. Total Environ. 2023, 877, 162827. [Google Scholar] [CrossRef] [PubMed]
- Blettler, M.C.; Ulla, M.A.; Rabuffetti, A.P.; Garello, N. Plastic pollution in freshwater ecosystems: Macro-, meso-, and microplastic debris in a floodplain lake. Environ. Monit. Assess. 2017, 189, 581. [Google Scholar] [CrossRef] [PubMed]
- Winton, D.J.; Anderson, L.G.; Rocliffe, S.; Loiselle, S. Macroplastic pollution in freshwater environments: Focusing public and policy action. Sci. Total Environ. 2020, 704, 135242. [Google Scholar] [CrossRef] [PubMed]
- Hassan, Y.A.; Badrey, A.E.; Osman, A.G.; Mahdy, A. Occurrence and distribution of meso-and macroplastics in the water, sediment, and fauna of the Nile River, Egypt. Environ. Monit. Assess. 2023, 195, 1130. [Google Scholar] [CrossRef] [PubMed]
- Li, J.; Liu, H.; Chen, J.P. Microplastics in freshwater systems: A review on occurrence, environmental effects, and methods for microplastics detection. Water Res. 2018, 137, 362–374. [Google Scholar] [CrossRef] [PubMed]
- Howe, D.; Hathaway, J.; Ellis, K.; Mason, L. Spatial and temporal variability of air temperature across urban neighborhoods with varying amounts of tree canopy. Urban For. Urban Green. 2017, 27, 109–116. [Google Scholar] [CrossRef]
- Hass, A.L.; Ellis, K.N.; Reyes Mason, L.; Hathaway, J.M.; Howe, D.A. Heat and humidity in the city: Neighborhood heat index variability in a mid-sized city in the southeastern United States. Int. J. Environ. Res. Public. Health 2016, 13, 117. [Google Scholar] [CrossRef]
- Mason, L.R.; Ellis, K.N.; Hathaway, J.M. Urban flooding, social equity, and “backyard” green infrastructure: An area for multidisciplinary practice. J. Community Pract. 2019, 27, 334–350. [Google Scholar] [CrossRef]
- Fath, A. Effects of Microplastics. In Microplastic Compact: Worth Knowing for Everyone; Springer: Berlin/Heidelberg, Germany, 2022; pp. 17–34. ISBN 978-3-658-32866-5. [Google Scholar]
- City of Knoxville Stormwater Data. Available online: https://www.knoxvilletn.gov/government/city_departments_offices/engineering/stormwater_engineering_division/rainfall_data (accessed on 10 October 2023).
- Barboza, L.G.A.; Gimenez, B.C.G. Microplastics in the marine environment: Current trends and future perspectives. Mar. Pollut. Bull. 2015, 97, 5–12. [Google Scholar] [CrossRef]
- Driedger, A.G.; Dürr, H.H.; Mitchell, K.; Van Cappellen, P. Plastic debris in the Laurentian Great Lakes: A review. J. Great Lakes Res. 2015, 41, 9–19. [Google Scholar] [CrossRef]
- Luo, W.; Su, L.; Craig, N.J.; Du, F.; Wu, C.; Shi, H. Comparison of microplastic pollution in different water bodies from urban creeks to coastal waters. Environ. Pollut. 2019, 246, 174–182. [Google Scholar] [CrossRef] [PubMed]
- Chithra, S.; Nair, M.H.; Amarnath, A.; Anjana, N. Impacts of impervious surfaces on the environment. Int. J. Sci. Eng. Invent. 2015, 4, 27–31. [Google Scholar]
- Li, L.; Yu, Q.; Gao, L.; Yu, B.; Lu, Z. The effect of urban land-use change on runoff water quality: A case study in Hangzhou City. Int. J. Environ. Res. Public. Health 2021, 18, 10748. [Google Scholar] [CrossRef] [PubMed]
- Hou, X.; Qin, L.; Xue, X.; Xu, S.; Yang, Y.; Liu, X.; Li, M. A city-scale fully controlled system for stormwater management: Consideration of flooding, non-point source pollution and sewer overflow pollution. J. Hydrol. 2021, 603, 127155. [Google Scholar] [CrossRef]
- de Carvalho, A.R.; Garcia, F.; Riem-Galliano, L.; Tudesque, L.; Albignac, M.; Ter Halle, A.; Cucherousset, J. Urbanization and hydrological conditions drive the spatial and temporal variability of microplastic pollution in the Garonne River. Sci. Total Environ. 2021, 769, 144479. [Google Scholar] [CrossRef]
- Honingh, D. Riverine debris: Interactions between waste and hydrodynamics: Field measurements and laboratory experiments for the Cikapundung River, Bandung. 2018. Available online: http://resolver.tudelft.nl/uuid:f94cee62-3c42-4729-b5b5-5e4b2a6228a8 (accessed on 12 September 2023).
- Epps, T.; Hathaway, J. Using spatially-identified effective impervious area to target green infrastructure retrofits: A modeling study in Knoxville, TN. J. Hydrol. 2019, 575, 442–453. [Google Scholar] [CrossRef]
- Alvareda, E.; Lucas, C.; Paradiso, M.; Piperno, A.; Gamazo, P.; Erasun, V.; Russo, P.; Saracho, A.; Banega, R.; Sapriza, G. Water quality evaluation of two urban streams in Northwest Uruguay: Are national regulations for urban stream quality sufficient? Environ. Monit. Assess. 2020, 192, 661. [Google Scholar] [CrossRef]
- Rimondi, V.; Monnanni, A.; De Beni, E.; Bicocchi, G.; Chelazzi, D.; Cincinelli, A.; Fratini, S.; Martellini, T.; Morelli, G.; Venturi, S. Occurrence and quantification of natural and microplastic items in urban streams: The case of Mugnone Creek (Florence, Italy). Toxics 2022, 10, 159. [Google Scholar] [CrossRef]
- City of Knoxville Sustainability Goals. Available online: https://www.knoxvilletn.gov/government/city_departments_offices/sustainability/climate_change#:~:text=Climate%20change%20is%20real%20and,like%20the%20Great%20Smoky%20Mountains (accessed on 10 October 2023).
- City of Knoxville Stormwater Devices. Available online: https://www.knoxvilletn.gov/blog/one.aspx?portalId=132035&postId=13037416&portletAction=viewpost (accessed on 10 October 2023).
- Zhou, Q. A review of sustainable urban drainage systems considering the climate change and urbanization impacts. Water 2014, 6, 976–992. [Google Scholar] [CrossRef]
- La Rosa, D.; Pappalardo, V. Planning for spatial equity-A performance based approach for sustainable urban drainage systems. Sustain. Cities Soc. 2020, 53, 101885. [Google Scholar] [CrossRef]
- Roebroek, C.T.; Hut, R.; Vriend, P.; De Winter, W.; Boonstra, M.; Van Emmerik, T.H. Disentangling variability in riverbank macrolitter observations. Environ. Sci. Technol. 2021, 55, 4932–4942. [Google Scholar] [CrossRef] [PubMed]
- Castro-Jiménez, J.; González-Fernández, D.; Fornier, M.; Schmidt, N.; Sempéré, R. Macro-litter in surface waters from the Rhone River: Plastic pollution and loading to the NW Mediterranean Sea. Mar. Pollut. Bull. 2019, 146, 60–66. [Google Scholar] [CrossRef] [PubMed]
- van Emmerik, T.; Strady, E.; Kieu-Le, T.-C.; Nguyen, L.; Gratiot, N. Seasonality of riverine macroplastic transport. Sci. Rep. 2019, 9, 13549. [Google Scholar] [CrossRef] [PubMed]
- Lebreton, L.; Slat, B.; Ferrari, F.; Sainte-Rose, B.; Aitken, J.; Marthouse, R.; Hajbane, S.; Cunsolo, S.; Schwarz, A.; Levivier, A. Evidence that the Great Pacific Garbage Patch is rapidly accumulating plastic. Sci. Rep. 2018, 8, 4666. [Google Scholar] [CrossRef] [PubMed]
- Helinski, O.K.; Poor, C.J.; Wolfand, J.M. Ridding our rivers of plastic: A framework for plastic pollution capture device selection. Mar. Pollut. Bull. 2021, 165, 112095. [Google Scholar] [CrossRef] [PubMed]
- Lamphere, J.A. A green surge amidst conservative politics: The case of Knoxville, Tennessee. J. Urban Aff. 2023, 1–17. [Google Scholar] [CrossRef]
- Fitzhugh, E.C.; Bassett Jr, D.R.; Evans, M.F. Urban trails and physical activity: A natural experiment. Am. J. Prev. Med. 2010, 39, 259–262. [Google Scholar] [CrossRef]
- Lévêque, C. Cities and Their Waterways. In Reclaiming and Rewilding River Cities for Outdoor Recreation; Springer: Cham, Switzerland, 2021; pp. 9–16. [Google Scholar] [CrossRef]
- Rowlands, T.; Ryan, M.; Estreich, A.; Wright, I.A. ‘Swimmability’: A Key Element for Communities to Safely Engage with Australian Urban Rivers; IOP Conference Series: Earth and Environmental Science; IOP Publishing: Bristol, UK, 2019; Volume 344, p. 012016. [Google Scholar]
- Fitzhugh, E.C.; Gregory, D.; Sims, C. The Knoxville Urban Wilderness Trail System and Baker Creek Preserve Bike Park: A Profile of Users and Physical Activity. 2023. Available online: https://www.wate.com/wp-content/uploads/sites/42/2023/02/KUW-Trail-and-Bike-Park-User-Report-Jan-2023.pdf (accessed on 14 September 2023).
- DeMyers, C.; Warpinski, C.; Wutich, A. Urban water insecurity: A case study of homelessness in Phoenix, Arizona. Environ. Justice 2017, 10, 72–80. [Google Scholar] [CrossRef]
- Flanigan, S.; Welsh, M. Unmet Needs of Individuals Experiencing Homelessness Near San Diego Waterways. J. Health Hum. Serv. Adm. 2020, 43, 105–130. [Google Scholar] [CrossRef]
- Doerschlag, I. Water Pollution Resulting from Homeless Encampments in Creeks: Programs in Sacramento, Santa Cruz, and San Pablo. 2021. Available online: https://escholarship.org/uc/item/5fr6w243 (accessed on 15 September 2023).
- Rose, J. Cleansing public nature: Landscapes of homelessness, health, and displacement. J. Polit. Ecol. 2017, 24, 11–23. [Google Scholar] [CrossRef]
- City of Knoxville Homeless Resources. Available online: https://www.knoxvilletn.gov/government/city_departments_offices/housing_and_neighborhood_development/office_on_homelessness/homeless_faqs#:~:text=Although%20the%20number%20fluctuates%20throughout,were%20unsheltered%20(street%20homeless) (accessed on 10 October 2023).
- Colburn, G. Seasonal variation in family homeless shelter usage. Hous. Policy Debate 2017, 27, 80–97. [Google Scholar] [CrossRef]
- Alcamo, J. Water quality and its interlinkages with the Sustainable Development Goals. Curr. Opin. Environ. Sustain. 2019, 36, 126–140. [Google Scholar] [CrossRef]

Table 1.
Stream and river pollution remediation initiatives in the Knoxville area.
| Initiative Name | Primary Agency | City of Knoxville Municipality Affiliated | Function |
|---|---|---|---|
| Ijams River Rescue | Ijams Nature Center | Yes | Remove plastic debris from the Tennessee River, the Tennessee River’s shorelines, and its tributary creeks in Knoxville |
| Creek and Greenway Cleanup | Keep Knoxville Beautiful | Yes | Remove debris from Knoxville’s Third Creek Greenway using kayaks |
| Keep the Tennessee River Beautiful | River Cleanup | Yes | Remove plastic debris from the Tennessee River. Multiple volunteer days along the course of the Tennessee River and urban creeks in Knoxville |
| Cheers to Clean Water: Paddle Off and Cleanup | Water Quality Forum | Yes | Competitive boat race that encourages plastic debris cleanup along the route of Tennessee River in Knoxville |
Table 2.
Waterway impairment data taken from Tennessee’s List of Impaired and Threatened Waters [7].
Table 2.
Waterway impairment data taken from Tennessee’s List of Impaired and Threatened Waters [7].
| Stream Name | Impairment Cause | Potential Impairment Source |
|---|---|---|
| First Creek | Escherichia coli (E. coli) | Municipal (urbanized high-density area) |
| First Creek | Escherichia coli (E. coli) | Sanitary sewer overflows (collection system failures) |
| First Creek | Nutrients | Municipal (urbanized high-density area) |
| First Creek | Anthropogenic substrate alterations | Municipal (urbanized high-density area) |
| First Creek | Sedimentation/siltation | Municipal (urbanized high-density area) |
| Second Creek | Escherichia coli (E. coli) | Municipal (urbanized high-density area) |
| Second Creek | Escherichia coli (E. coli) | Sanitary sewer overflows (collection system failures) |
| Second Creek | Nutrients | Municipal (urbanized high-density area) |
| Second Creek | Anthropogenic substrate alterations | Municipal (urbanized high-density area) |
| Second Creek | Sedimentation/siltation | Municipal (urbanized high-density area) |
| Third Creek | Escherichia Coli (E. coli) | Municipal (urbanized high-density area) |
| Third Creek | Escherichia Coli (E. coli) | Sanitary sewer overflows (collection system failures) |
| Third Creek | Nutrients | Municipal (urbanized high-density area) |
| Third Creek | Anthropogenic substrate alterations | Municipal (urbanized high-density area) |
| Third Creek | Sedimentation/siltation | Municipal (urbanized high-density area) |
| Third Creek | Sedimentation/siltation | Site clearance for development or redevelopment |
Table 3.
Model summary spanning the combined model and variables rainfall, windspeed, and creek flow rate.
Table 3.
Model summary spanning the combined model and variables rainfall, windspeed, and creek flow rate.
| Coefficient | Standard Error | t | Sig. | |
|---|---|---|---|---|
| Combined Model | 4.343 | 0.757 | 5.738 | <0.001 |
| Autoregressive Term | 0.348 | 0.238 | 1.462 | 0.162 |
| Rainfall | 14.256 | 3.353 | 4.252 | <0.001 |
| Windspeed | −0.371 | 0.126 | −2.945 | 0.009 |
| Creek Flow Rate | −0.003 | 0.001 | −3.060 | 0.007 |
Disclaimer/Publisher’s Note: The statements, opinions and data contained in all publications are solely those of the individual author(s) and contributor(s) and not of MDPI and/or the editor(s). MDPI and/or the editor(s) disclaim responsibility for any injury to people or property resulting from any ideas, methods, instructions or products referred to in the content. |
© 2023 by the author. Licensee MDPI, Basel, Switzerland. This article is an open access article distributed under the terms and conditions of the Creative Commons Attribution (CC BY) license (https://creativecommons.org/licenses/by/4.0/).
Share and Cite
MDPI and ACS Style
Greeves, S. Tracking Trash: Understanding Patterns of Debris Pollution in Knoxville’s Urban Streams. Sustainability 2023, 15, 16747. https://doi.org/10.3390/su152416747
AMA Style
Greeves S. Tracking Trash: Understanding Patterns of Debris Pollution in Knoxville’s Urban Streams. Sustainability. 2023; 15(24):16747. https://doi.org/10.3390/su152416747
Chicago/Turabian StyleGreeves, Scott. 2023. "Tracking Trash: Understanding Patterns of Debris Pollution in Knoxville’s Urban Streams" Sustainability 15, no. 24: 16747. https://doi.org/10.3390/su152416747
Note that from the first issue of 2016, this journal uses article numbers instead of page numbers. See further details here.