
Seismic Responses of Aqueducts Using a New Type of Self-Centering Seismic Isolation Bearing
1
State Key Laboratory of Disaster Reduction in Civil Engineering, Tongji University, Shanghai 200092, China
2
College of Civil Engineering, Tongji University, Shanghai 200092, China
*
Author to whom correspondence should be addressed.
Sustainability 2023, 15(3), 2402; https://doi.org/10.3390/su15032402
Submission received: 14 December 2022
/
Revised: 20 January 2023
/
Accepted: 27 January 2023
/
Published: 29 January 2023
Abstract
:An aqueduct is a bridge-like structure that supports a canal passing over a river or low ground, and it is an important part of a water conveyance system. Aqueduct piers are extremely vulnerable to damage during strong earthquakes that can result in structural collapse. Further, excessive seismic displacement will also fracture an aqueduct’s rubber water-stop and interrupt the normal service of an aqueduct after an earthquake. Therefore, improving the seismic capacity and post-earthquake resilience of aqueducts is of great importance. In this paper, a new type of self-centering seismic isolation bearing, the inclined plane guide bearing (IPGB), is proposed for the seismic design of aqueducts, and it is studied both experimentally and numerically. Firstly, a typical aqueduct project and the setting of the IPGBs are introduced. Then, the test design, test cases, and test results of shaking table tests for two different pier-height aqueducts are presented. The seismic responses of the two models are studied, and the results show that the aqueduct that used IPGBs has a smaller bearing displacement and better post-earthquake resilience. Finally, a numerical simulation method applicable to aqueducts using IPGBs is proposed, and its accuracy is verified by comparing the results of the numerical simulation and the shaking table test.
1. Introduction
Water conveyance projects, such as the Valens Aqueduct in Turkey [1] and the South-to-North Water Diversion Project in China [2], can help alleviate water shortage problems in many large cities and promote sustainable economic development and ecological environmental protection. As an important part of a water conveyance system, an aqueduct is comprised of a superstructure with a large mass and piers with small lateral stiffnesses. The seismic safety of aqueducts in high seismic intensity areas has attracted researchers’ attention. Compared with bridges used for transportation, resuming normal service of aqueducts after strong earthquakes is more challenging. For a long-distance water conveyance system, if a certain part is damaged during an earthquake, and even if only a piece of the rubber water-stop is fractured, the normal service of the entire water conveyance system will be interrupted [3,4,5]. For example, several aqueducts were destroyed in the Lushan Earthquake and the Wenchuan Earthquake, and supplies of drinking water were interrupted. Therefore, the seismic design is very important for the seismic safety of aqueducts during strong earthquakes [6,7,8,9].
A series of studies have been carried out on aqueduct seismic issues, and they have primarily included the numerical modeling method for aqueducts during earthquakes [10,11,12,13,14,15], the interaction between the water and the aqueduct’s structure during earthquakes [16,17,18,19,20], the aqueduct’s seismic design method [20,21,22,23], etc. It has been shown that the seismic isolation method can significantly improve the seismic capacity of an aqueduct. Commonly used seismic isolation bearings, such as friction pendulum bearings (FPBs) and lead rubber bearings (LRBs) have satisfactory seismic isolation effects. However, the displacements and residual displacements of these bearings during strong earthquakes are much larger [24,25,26], resulting in damage to the rubber water-stop. Therefore, a newly developed self-centering seismic isolation bearing is applied to a typical aqueduct, and its seismic isolation effect is investigated in this paper.
It is well known that pier height significantly influences the seismic performance of a bridge. Therefore, the seismic performance of a taller pier aqueduct is different from that of a shorter pier aqueduct. Most past studies have focused on aqueducts with ordinary pier heights, such as the seismic performances and fragilities of shorter pier aqueducts [11,27,28,29,30,31,32,33,34]. However, the seismic performances of taller pier aqueducts are rarely investigated. In this paper, the seismic performances of aqueducts with two different pier heights are studied experimentally, and the test results are compared. The influence of pier height on the seismic performance of an aqueduct is investigated.
The seismic performances of aqueducts are investigated using the shaking table test method in this paper. In recent years, a series of shaking table tests were carried out to study the dynamic interaction between water and an aqueduct’s structure. Among them, Wang [35,36,37] studied the fluid structure coupling using shaking table tests, and the equivalent mass and load position of the water convection in U-shaped aqueducts were proposed quantitatively. Huang [38] and Duan [39] studied the tuned liquid damper (TLD) effect of an aqueduct during an earthquake using the shaking table test. It was shown that the shaking of the water and the breaking of the water waves had a TLD effect on the transverse dynamic response of the aqueducts. All of the shaking table tests noted above have focused on aqueducts with ordinary pier heights, and shaking table tests for tall-pier aqueducts have not been reported.
In this paper, an actual aqueduct project using a new type of self-centering seismic isolation bearing is taken as the research object, and a shaking table test is carried out to study the aqueduct’s seismic performance. The influence of pier height on the aqueduct’s seismic performance is also investigated.
2. An actual Aqueduct Project
2.1. Background Information
In this paper, an actual aqueduct project is taken as the research object, and the aqueduct’s seismic performance is studied using a new type of self-centering seismic isolation bearing. The aqueduct is located in a high seismic intensity area in southwest China, and the superstructure is a 30 m-span simply supported girder, as shown in Figure 1. The superstructure is a U-shaped reinforced concrete girder, and the substructure is a single-column hollow pier with a pile-group foundation. Typical cross-sections of the girder and the pier are shown in Figure 2.
The horizontal peak ground acceleration for the design earthquakeis 0.30 g, which has an exceedance probability of 10% in 50 years.
2.2. Bearing Settings
This paper adopts a new type of self-centering seismic isolation bearing to improve the seismic performance of an aqueduct, i.e., an inclined plane guide bearing (IPGB). It can be classified into two categories to meet the requirements of normal service, i.e., fixed and expansion bearings. During an earthquake, the shear pins of the fixed bearings are cut off, and all bearings become expansion bearings for seismic resistance.
An expansion IPGB consists of five components, and they are, from top to bottom, an upper plate, a spherical cap, an upper slider, a lower slider, and a lower plate, respectively. Details of the bearing’s structure are shown in Figure 3. The upper plate, spherical cap, and upper slider form a spherical bearing to meet the rotation requirement of the bearing.
Three inclined planes with inclination angles of −3°, 3°, and −3° are arranged from left to right beneath the bottom surface of the upper slider, and a polytetrafluoroethylene (PTFE) plate is fixed on each inclined plane. Three inclined planes of the same inclination angles are arranged on the top surface of the lower slider, and a stainless-steel plate is fixed on each inclined plane. Two guide plates are set on both lateral sides of the lower slider to limit the upper slider to moving only in the Y-direction. When the horizontal displacement of the bearing along the Y-direction is zero, the three inclined planes beneath the bottom surface of the upper slider and the three inclined planes on the top surface of the lower slider will come into contact with each other. When the upper slider moves to the positive Y-direction, the left and right inclined planes beneath the bottom surface of the upper slider and those on the top surface of the lower slider will come into contact. Simultaneously, the two middle inclined planes will be out of contact. When the upper slider moves to the negative Y-direction, the left and right inclined planes beneath the bottom surface of the upper slider and those on the top surface of the lower slider will be out of contact. Simultaneously, the two middle inclined planes will come into contact.
Similarly, three inclined planes are arranged beneath the bottom of the lower slider, and a PTFE plate is fixed on each inclined plane. The inclination angles are −3°, 3°, and −3°, from left to right. Three inclined planes of the same inclination angles are also arranged on the top surface of the lower plate, and a stainless-steel plate is fixed on each inclined plane. Two guide plates are set on both lateral sides of the lower plate to limit the lower slider to moving only in the X-direction. When the horizontal displacement of the bearing along the X-direction is zero, the three inclined planes beneath the bottom surface of the lower slider and the three inclined planes on the top surface of the lower plate will come into contact with each other. When the lower slider moves to the positive X-direction, the left and right inclined planes beneath the bottom surface of the lower slider and those on the top surface of the lower plate will come into contact. Simultaneously, the two middle inclined planes will be out of contact. When the lower slider moves to the negative X-direction, the left and right inclined planes beneath the bottom surface of the lower slider and those on the top surface of the lower plate will be out of contact. Simultaneously, the two middle inclined planes will come into contact.
The hysteresis curve of an IPGB is shown in Figure 4. In the figure,
where W is the vertical load, θ is the inclination angle of inclined planes, μ is the sliding friction coefficient of the inclined planes, and is the gap between the slider and the guide plate. To achieve the self-centering function, the following inequality should be satisfied:
3. Design of the Shaking Table Test
3.1. Test Model Design
Two models are designed: Model I is an aqueduct with piers of 20 m in height and Model II is an aqueduct with piers of 40 m in height.
To study the seismic performance of an aqueduct using IPGBs, only four identical expansion bearings are set under the U-shaped girder. For the aqueduct using IPGBs, the horizontal stiffness of the substructure is composed of the IPGB stiffness and the pier stiffness in series. The bearing stiffness is much less than the pier stiffness, and so the horizontal stiffness of the substructure is primarily controlled by the bearing stiffness. Therefore, the longitudinal and lateral stiffnesses are nearly the same, and the longitudinal and lateral seismic responses are similar, as well. Because the longitudinal flexural capacity of the pier section is smaller than the transverse flexural capacity, the pier is more easily destroyed under longitudinal earthquakes, and so only the aqueduct seismic performance in the longitudinal direction is studied in this paper.
According to the test conditions, the length similarity ratio of the test model is determined to be 1:16. According to the length similarity ratio, an ideal model can be designed. However, if the similarity ratio is completely satisfied, there will be some problems that are difficult to cope with. For example, the diameters of the steel bars and the thicknesses of some concrete components will be too small to be fabricated. Therefore, the ideal model needs to be reformed to a test model according to equivalence principles. For instance, the superstructure of the test model is a Q235 I-shaped steel beam with some additional mass blocks according to the stiffness and mass equivalence principles [40]. The pier section of the test model is a filled rectangle, as shown in Figure 5.
The similarity ratios of the elastic modulus, the density, and the length are chosen to be fundamental physical quantities. The other similarity ratios are derived according to the similarity law [40].
The pier of the test model is made of C40 concrete and HRB400 reinforcement, which is consistent with the material of the prototype structure, and so the elastic modulus and density similarity ratios are equal to 1. In addition, with the acceleration similarity ratio being equal to 1, the remaining physical quantities of the test model can be derived according to the similarity law [41], as shown in Table 1.
The density of the test model should be 16 times the actual density of the concrete, which is difficult to satisfy. The mass differences between the main components of the ideal and the actual test models are calculated, and additional mass blocks are designed to cover the shortage in density. The additional masses of the main components are listed in Table 2.
3.2. Test Scheme
In the test, the displacement of the pier and the bearing, the horizontal force of the bearing, the structural acceleration, and the reinforcement strain in the plastic hinge area of the pier bottom were measured. The additional mass blocks and the transducers of the test model are shown in Figure 6, and the photo of the test model is shown in Figure 7.
3.3. Earthquake Excitations and Test Cases
The test is carried out in the State Key Laboratory of Disaster Reduction in Civil Engineering of Tongji University. The test equipment is an MTS two-direction and three-degree-of-freedom shaking table. The parameters of the shaking table are as follows: the table size is 6 m × 4 m, the maximum displacement is +/−0.5 m, the rated acceleration is 1.5 g, and the working frequency is 0.1–50 Hz.
Three earthquake excitations, named SJ1, SJ2, and SJ3, are artificially generated and input along the longitudinal direction. The compressed acceleration time histories are shown in Figure 8. In the shaking table test, the peak ground acceleration (PGA) of the earthquake excitations are scaled from 0.1 g to 0.75 g. These excitations correspond to seismic intensities of frequent earthquakes, design earthquakes, and rare earthquakes, respectively. Several white noise cases with a PGA of 0.05 g are also arranged to determine the state of the test model. All of the test cases are listed in Table 3.
4. Analysis of Test Results
4.1. Test Phenomena
The material test results are: the average compressive strength of the concrete is 40 MPa, and the elastic modulus is 3.45 × 10⁴ MPa. The elastic modulus of the reinforcement is 2.08 × 10⁵ MPa, and the yield strength is 401 MPa.
In the test cases of frequent earthquakes, the bearing displacement of each test model is nearly zero, indicating that the IPGBs have not yet entered the seismic isolation state. In the test cases of PGA ≥ 0.3 g, the bearing displacement is visible and increases with the increase in PGA, which indicates that the IPGBs have entered the seismic isolation state for both design earthquakes and rare earthquakes.
After the test, there is no apparent residual crack in the aqueduct piers, indicating that the structure is basically in an elastic state.
4.2. Seismic Isolation Effect of IPGBs
The natural frequencies of each model in the white noise cases are shown in Table 4. It can be seen that structural natural frequencies of Model I and Model II decrease by 3.3% and 12.5%, respectively, by comparing the results of case 1 and case 14, respectively. The structural natural frequencies of Model I and Model II decrease by 6.7% and 18.8%, respectively, by comparing the results of case 1 and case 21, respectively. It is shown that the IPGB has an excellent seismic isolation effect and can protect the substructure of the aqueduct well during an earthquake.
The maximum acceleration responses of the two models are shown in Figure 9. The acceleration responses of the pier tops increase with the PGAs, and the pier acceleration responses of Model II are less than those of Model I because of the minor horizontal stiffness of Model II. The girder acceleration responses of the two test models are relatively close and there is little change.
The seismic isolation rate R can be calculated to show the seismic isolation effect of the bearing as follows:
where is the maximum acceleration of the girder and is the maximum acceleration at the pier top.
The seismic isolation rates of all the test cases are listed in Table 5. All of the values are greater than 60% and increase with the PGAs, implying the IPGB has a satisfactory seismic isolation effect. Generally, the seismic isolation rates of Model I are higher than those of Model II, especially when the PGA is ≥0.3 g. Hence, the pier height has a certain influence on the bearing seismic isolation effect.
4.3. Displacement Responses of the IPGBs
The maximum displacements and residual displacements of the IPGBs in all the cases are shown in Figure 10. The time histories and hysteresis curves of the IPGBs in Model I for case 20 and Model II for case 16 are shown in Figure 11 and Figure 12, respectively.
As shown in Figure 10, Figure 11 and Figure 12, the maximum bearing displacement increases with the PGAs, and the bearing displacement of Model II is larger than that of Model I. The bearing residual displacement of each model is less than 1 mm, which indicates the excellent post-earthquake resilience of the bearing.
4.4. Influence of Pier Height
As shown in Table 4, the natural frequencies of the two models are different, their reductions after rare earthquakes are also different, and the structural stiffness of Model II decreased significantly. Hence, it is demonstrated that the pier height has a significant influence on the aqueduct’s seismic performance.
Maximum reinforcement strains at the pier bottom for all the cases are shown in Figure 13. The reinforcement strain at the pier bottom of Model I remains nearly unchanged for cases of a PGA of ≥0.3 g. However, the reinforcement strain at the pier bottom for Model II increases with the PGA. The maximum reinforcement strains at the pier bottom for Model II are greater than 2000 με for the cases of a PGA of ≥0.6 g, and the pier has entered a slightly plastic state. It is demonstrated that the aqueduct’s seismic performances for Model I and Model II are quite different.
Displacement time histories at the top and half-height of the piers in Model I and Model II for cases 17 and 20 are shown in Figure 14 and Figure 15, respectively.
It can be seen that in Model I, the displacement time histories at the top and half-height of the pier are very similar and the maximum values of the two curves appear at nearly the same time. However, in Model II, the two time history curves are totally different and the maximum values of the two curves do not appear at the same time. The maximum displacement at the half-height of the pier typically appears earlier than that at the pier’s top. It is indicated that the aqueduct’s seismic performance in Model II is affected by the high-order mode of the pier.
5. Numerical Simulation Method
According to the shaking table test results, the IPGB has an excellent seismic isolation effect and post-earthquake resilience. However, as a new type of bearing, the hysteresis curve of the IPGB is very unique. To further study the seismic performance of the aqueduct using IPGBs, a reasonable numerical simulation method is necessary. In this section, the numerical simulation method for the aqueduct using IPGBs is proposed, and its accuracy is verified by comparing it with the experimental results.
The girder of the aqueduct is simulated by elastic beam elements. The simulation methods of the reinforced concrete pier include a fiber beam element [42,43], an elastic beam element with reduced stiffness [44], and an elastic beam element with a plastic hinge. The aqueduct in this paper adopts the seismic isolation system, and the pier has no residual cracks after the test, which indicates that the pier is basically in an elastic state during earthquakes, and so the elastic beam element with a reduced stiffness is used to simulate the pier in this paper. The pier stiffness is reduced according to the AASHTO specification [45]. The reinforcement ratio and the axial compression ratio of the pier are 0.03 and 0.32, respectively, and so the reduction coefficient of the pier stiffness is 0.6.
The displacement–force relation of an IPGB cannot be simulated by a single element in existing finite element software. An ideal elastic–plastic element and a friction element are connected in parallel to simulate the IPGB connection element in this paper, as shown in Figure 16. The pre-yield stiffness of the ideal elastic–plastic element is provided by the yield force of the ideal elastic-plastic element is provided by , and the yield force of the friction element is provided by .
Relevant past research [46] has shown that using a constant friction coefficient to simulate sliding friction can well estimate the displacement of bearings and a structure, and a constant friction coefficient is also convenient for further parameter analysis of an aqueduct that uses IPGBs. Therefore, the friction coefficient used in the paper is constant and the value is 0.03.
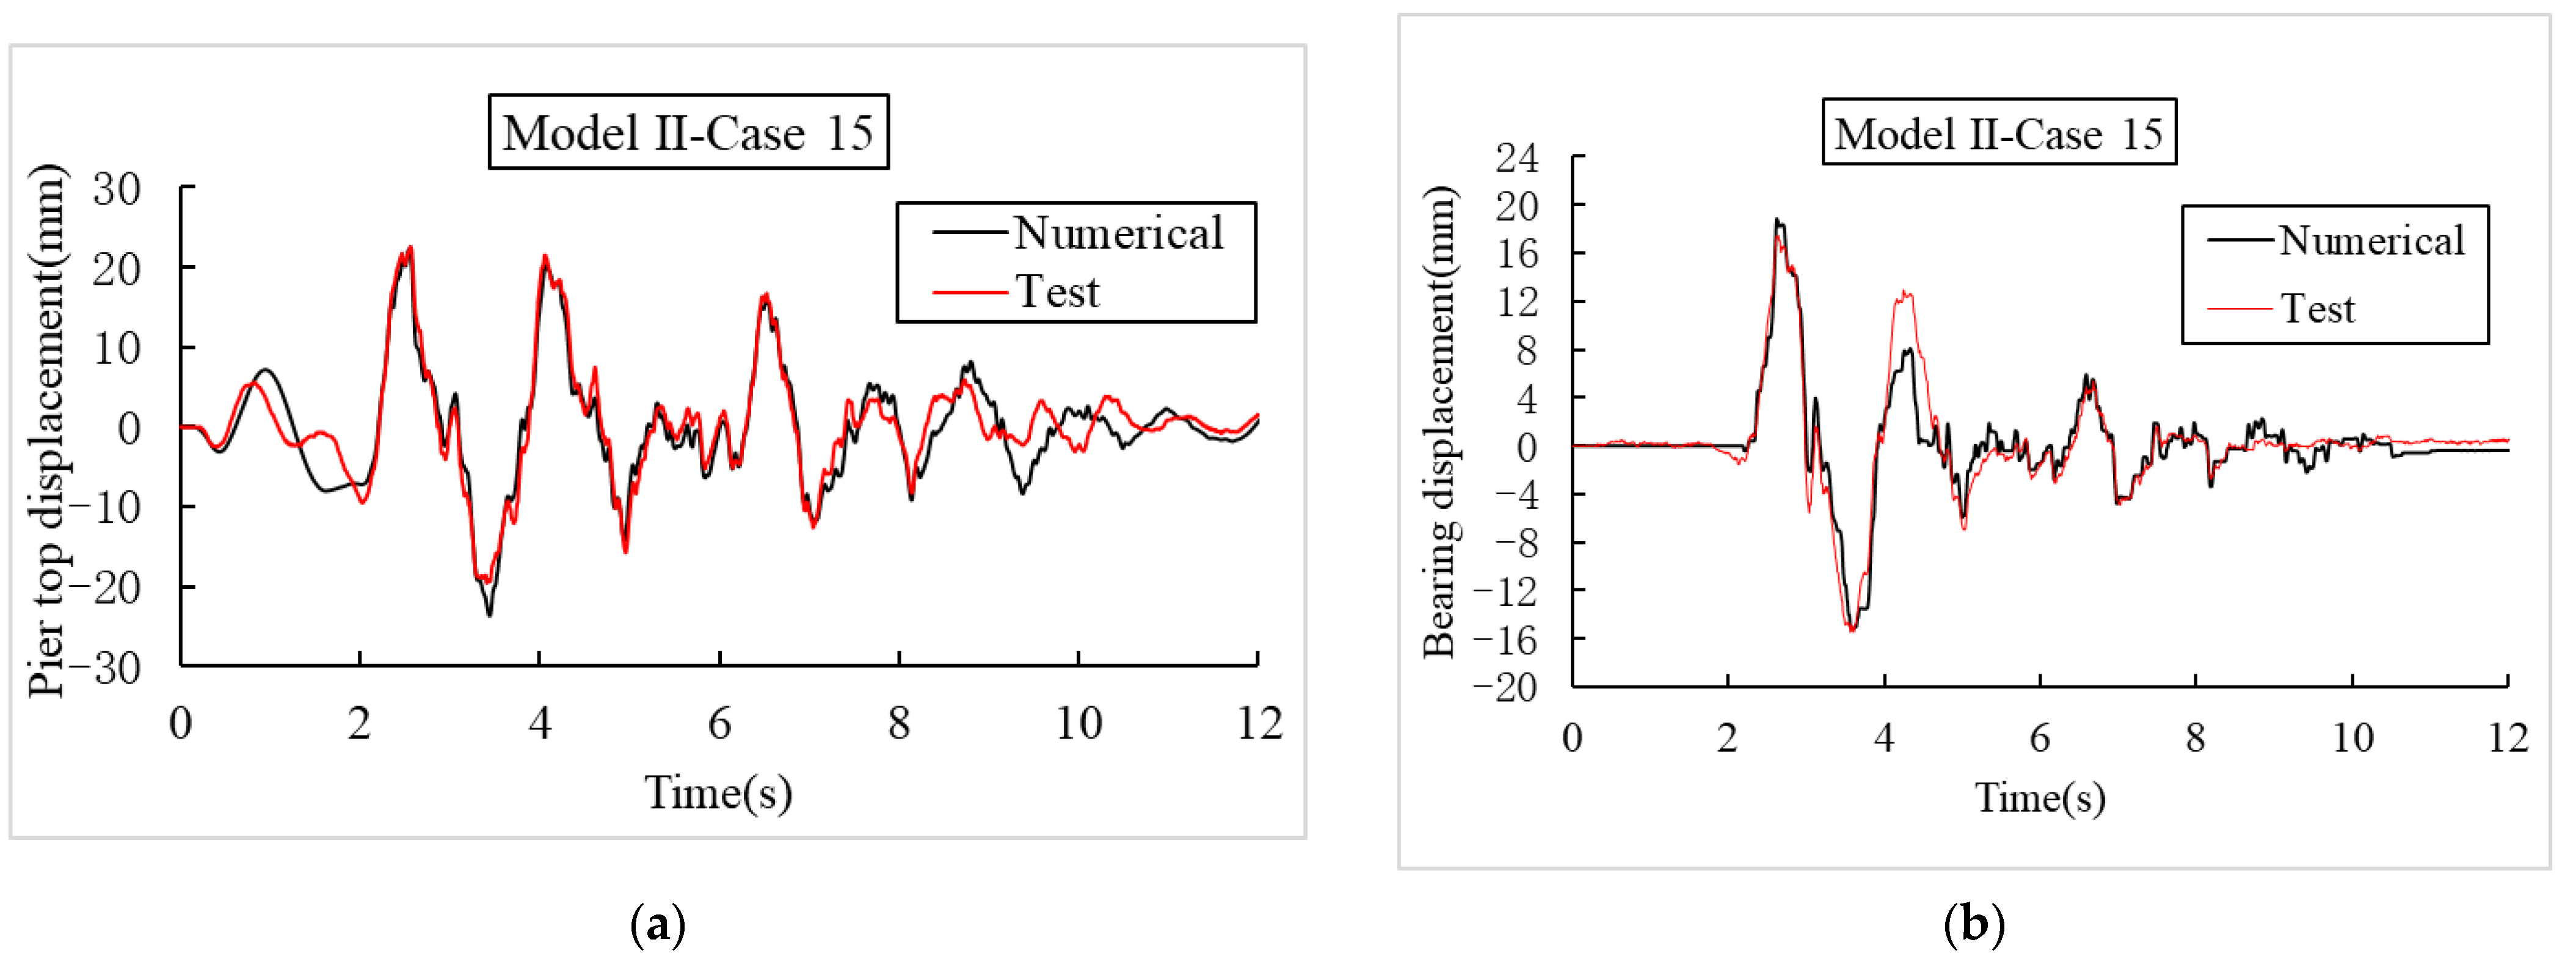
With the above method, finite element models of aqueducts using IPGBs are established in SAP2000 finite element software, as shown in Figure 17. The results calculated with numerical models are compared with the test results, as shown in Figure 18 and Figure 19, and the maximum values of the numerical simulation and test results, as well as the errors between them, are listed in Table 6.
As shown in Figure 18 and Figure 19, the simulation results of the time–history curve of the pier top displacement and the bearing displacement are highly coincident with the test results, and the simulation results of the bearing hysteresis curve are largely consistent with the test results. The maximum errors of pier-top displacement, bearing displacement, and bearing force are 3%, 6%, and 17%, respectively. The numerical simulation method proposed in this paper is applicable for aqueducts that use IPGBs with different pier heights in different test cases.
6. Conclusions
In this paper, a shaking table test is designed and carried out to study the seismic performance of an aqueduct that uses IPGBs, with the pier height and PGA as the parameters. Then, a numerical modeling method for aqueducts that use IPGBs is proposed, and its accuracy is verified by comparing the results of the numerical simulation method and the shaking table test. The main conclusions are as follows:
- The seismic isolation rate R is calculated to show the seismic isolation effect of the IPGB. The seismic isolation rate increases with the PGAs, and those of Model I are greater than those of Model II. The seismic isolation rates of both models are greater than 60%, indicating that the IPGBs have an excellent seismic isolation effect.
- The average bearing residual displacement of Model II is less than that of Model I, and the bearing residual displacements of both models are less than 1 mm. Therefore, the IPGBs have very good post-earthquake resilience, and the residual displacement of the bearing after the earthquake is minimal.
- The pier height has a distinct influence on the aqueduct’s seismic performance. When the PGA is ≥0.3 g, the reinforcement strain at the pier bottom in Model I does not increase with the PGAs. In contrast, the reinforcement strain at the pier bottom in Model II is positively correlated with the PGAs. The aqueduct’s seismic performance in Model II is affected by the high-order mode of the pier.
- The maximum errors of pier-top displacement, bearing displacement, and bearing force are 3%, 6%, and 17%, respectively, and the numerical simulation method proposed in this paper is applicable to aqueducts that use IPGBs.
Author Contributions
Methodology, T.P. and Y.D.; Validation, Y.D.; Investigation, Y.D.; Resources, T.P.; Data curation, Y.D.; Writing—original draft, Y.D.; Writing—review & editing, T.P. and Y.D.; Visualization, Y.D.; Supervision, T.P.; Project administration, T.P. All authors have read and agreed to the published version of the manuscript.
Funding
This work was supported in part by the Ministry of Science and Technology of China, grant number SLDRCE19-B-21, and the National Natural Science Foundation of China (grant numbers 51278372 and 51878489).
Institutional Review Board Statement
This study did not involve humans or animals.
Informed Consent Statement
This study did not involve humans or animals.
Data Availability Statement
The data presented in this study are available on request from the corresponding author. The data are not publicly available due to laboratory confidentiality principle.
Conflicts of Interest
The authors declare that they have no known competing financial interests or personal relationships that could have appeared to influence the work reported in this paper.
References
- Gonen, S.; Pulatsu, B.; Erdogmus, E.; Karaesmen, E.; Karaesmen, E. Quasi-Static Nonlinear Seismic Assessment of a Fourth Century A.D. Roman Aqueduct in Istanbul, Turkey. Heritage 2021, 4, 401–421. [Google Scholar] [CrossRef]
- Jieyuan, Z.; Huiting, L.; Tianchen, Z.; Wen, Z.; Lina, T.; Yan, Y.; Yunjun, Z.; Mingfang, T. Effects of Water and Soil Conservation in the Water Source Area of the Middle Route of the South to North Water Transfer Project. Resour. Environ. Yangtze Basin 2021, 30, 310–320. [Google Scholar]
- Seed, R.B.; Marachi, N.D. Seismic risk assessment for a lifeline aqueduct system. Dev. Geotech. Eng. 1987, 45, 415–426. [Google Scholar]
- Scira, M. Chains of damages and failures in a metropolitan environment: Some observations on the Kobe earthquake in 1995. J. Hazard. Mater. 2001, 86, 101–119. [Google Scholar]
- Pagano, A. Bayesian vulnerability assessment tool for drinking water mains under extreme events. Nat. Hazards 2014, 74, 2193–2227. [Google Scholar] [CrossRef]
- Chen, G.; Jin, D.; Mao, J.; Gao, H.; Wang, Z.; Jing, L.; Li, Y.; Li, X. Seismic damage and behavior analysis of earth dams during the 2008 Wenchuan earthquake, China. Eng. Geol. 2014, 180, 99–129. [Google Scholar] [CrossRef]
- Xu, J.; Wang, B.; Chen, H.; Liu, X. Longitudinal nonlinear pounding study of large-scale aqueduct under earthquake. J. Earthq. Eng. Eng. Vib. 2010, 30, 126–133. [Google Scholar]
- Yun-he, L.; Houqun, L. Aseismic Effect of Lead Rubber Bearing for Large Scaled Aqueduct. J. Hydraul. Eng. 2003, 34, 98–103. [Google Scholar]
- Davis, C.; O’Rourke, T. ShakeOut Scenario: Water System Impacts from a Mw 7.8 San Andreas Earthquake. Earthq. Spectra 2011, 27, 459–476. [Google Scholar] [CrossRef]
- Benjelloun, Y.; De Sigoyer, J.; Dessales, H.; Garambois, S.; Şahin, M. Construction history of the aqueduct of Nicaea (Iznik, NW Turkey) and its on-fault deformation viewed from archaeological and geophysical investigations. J. Archaeol. Sci. Rep. 2018, 21, 389–400. [Google Scholar] [CrossRef]
- Liu, Y.; Dang, K.; Dong, J. Finite element analysis of the aseismicity of a large aqueduct. Soil Dyn. Earthq. Eng. 2017, 94, 102–108. [Google Scholar] [CrossRef]
- Drei, A. Linear and non-linear modelling of the seismic behaviour of the stone masonry aqueduct of “Aguas Livres” in Lisbon. In Proceedings of the 1st International Symposium on Earthquake Resistant Engineering Structures (ERES’96), Thessaloniko, Greece, 30 October–1 November 1996. [Google Scholar]
- Drei, A.; Milani, G.; Sincraian, G. DEM numerical approach for masonry aqueducts in seismic zone: Two valuable Portuguese examples. Int. J. Mason. Res. Innov. 2017, 2, 1–29. [Google Scholar] [CrossRef]
- Mamaklı, F.S.; Hamamcıoğlu, T.M.; Aktaş, E.; Vardaroğlu, M. Conservation-Aimed Evaluation of a Historical Aqueduct in İzmir. J. Archit. Eng. 2019, 25, 04019014. [Google Scholar] [CrossRef]
- Beconcini, M.L.; Croce, P.; Marsili, F.; Muzzi, M.; Rosso, E. Probabilistic reliability assessment of a heritage structure under horizontal loads. Probabilistic Eng. Mech. 2016, 45, 198–211. [Google Scholar] [CrossRef]
- Rawat, A.; Matsagar, V.A.; Nagpal, A.K. Earthquake induced sloshing and hydrodynamic pressures in rigid liquid storage tanks analyzed by coupled acoustic-structural and Euler-Lagrange methods. Thin-Walled Struct. 2019, 134, 333–346. [Google Scholar] [CrossRef]
- Housner, G.W. Dynamic pressures on accelerated fluid containers. Bull. Seismol. Soc. Am. 1957, 48, 15–35. [Google Scholar] [CrossRef]
- Moslemi, M.; Farzin, A.; Kianoush, M.R. Nonlinear sloshing response of liquid-filled rectangular concrete tanks under seismic excitation. Eng. Struct. 2019, 188, 564–577. [Google Scholar] [CrossRef]
- Ibrahim, R.A. Liquid Sloshing Dynamics: Theory and Applications; Cambridge University Press: Cambridge, UK; New York, NY, USA, 2005. [Google Scholar]
- Gong, Y.; Li, Y.; Di, Q. Equivalent mechanical models of sloshing fluid in arbitrary-section aqueducts. Earthq. Eng. Struct. Dyn. 2012, 41, 1069–1087. [Google Scholar]
- Xia, F.Z.; Song, Y.; Jing, L.; Xiong, Y. Test Research on Dynamic Characteristics of Vibration Isolation System for Large-scale Aqueduct. South North Water Transf. Water Sci. Technol. 2009, 7, 59–61, 73. [Google Scholar]
- Junrong, H.; Ling, Y.; Shiping, L.; Lunwen, W. Study on seismic isolation design of beam aqueduct in high-intensity area. Water Resour. Plan. Des. 2019, 35, 140–146. [Google Scholar]
- Zhang, H.; Liu, L.; Dong, M.; Sun, H. Analysis of wind-induced vibration of fluid-structure interaction system for isolated aqueduct bridge. Eng. Struct. 2013, 6, 28–37. [Google Scholar] [CrossRef]
- Takahashi, Y. Damage of rubber bearings and dampers of bridges in 2011 Great East Japan Earthquake. In Proceedings of the International Symposium on Engineering Lessons Learned from the 2011 Great East Japan Earthquake, Tokyo, Japan, 1–4 March 2012. [Google Scholar]
- Liu, Y.; Tan, P.; Zhou, F.; Heisha, W.; Mercan, O. Seismic simulation shaking table test of high pier isolation continuous beam. China J. Highw. Transp. 2015, 28, 60–68, 94. [Google Scholar]
- Chen, Y.J.; Honglie, S.; Zhenfa, F. Study on seismic isolation of long span double deck steel truss continuous girder bridge. Appl. Sci. 2022, 12, 2567. [Google Scholar] [CrossRef]
- Zhang, W.W.; Jian, H.; Ying, C.; Xiuli, D. Simplified calculation formula for lateral seismic response of aqueduct structure considering fluid structure coupling. Eng. Mech. 2017, 34, 69–75. [Google Scholar] [CrossRef]
- Zhang, C.; Xu, J.; Wang, B.; Wu, C. Nonlinear random seismic response analysis of the double-trough aqueduct based on fiber beam element model. Soil Dyn. Earthq. Eng. 2021, 150, 106856. [Google Scholar] [CrossRef]
- Zhang, C.; Xu, J.; Qian, Y.; Zhang, J.; Wang, R.; Wang, B. Seismic reliability analysis of random parameter aqueduct structure under random earthquake. Soil Dyn. Earthq. Eng. 2022, 153, 107083. [Google Scholar] [CrossRef]
- Xu, X.Y.; Xuhui, L.; Jiang, L.; AliKhan, M.Y. Dynamic Damage Mechanism and Seismic Fragility Analysis of an Aqueduct Structure. Appl. Sci. 2021, 11, 11709. [Google Scholar] [CrossRef]
- Liu, Z.J.; Xing, F. Stochastic earthquake response and seismic reliability analysis of large-scale aqueduct structures. J. Yangtze River Sci. Res. Inst. 2012, 29, 77–81. [Google Scholar]
- Zeng, B.; Yanfu, X.; Zhangjun, L. Seismic Analysis of large-scale aqueduct structures based on the probability density evolution method. China Earthq. Eng. J. 2014, 36, 99–996. [Google Scholar]
- Zhang, W.; Bo, W.; Jianguo, X.; Liang, H. Solution to reliability of large aqueduct structures subjected to random earthquake ground motions. J. Hydroelectr. Eng. 2018, 37, 13–120. [Google Scholar]
- Chen, H.Q. Seismic safety of the south-to-north water transfer project. J. China Inst. Water Resour. Hydropower Res. 2003, 1, 19–24. [Google Scholar]
- Wang, H.; Li, C.; Zhao, L. Experimental Study on Dynamic Interaction between Large U-Shape Aqueduct and Water. KSCE J. Civ. Eng. 2021, 26, 1203–1213. [Google Scholar] [CrossRef]
- Wang, H.B.; Chunlei, L.; Kunhang, Z. Experimental study on liquid surface sloshing convection in U-shaped aqueduct. J. Water Resour. 2020, 51, 1453–1461. [Google Scholar]
- Wang, H.B.; Chunlei, L.; Can, Z.; Junrong, H. Shaking table test research on fluid structure coupling of large thin-walled aqueducts. J. Water Resour. 2020, 51, 653–663. [Google Scholar]
- Huang, Y.X.; Xiangdong, Q. Experimental study on TLD effect model of aqueduct under strong earthquake. J. Hehai Univ. Nat. Sci. Ed. 2014, 42, 547–552. [Google Scholar]
- Duan, Q.H.; Lou, M.L. Shaking Table Model Test for Vertical Seismic Response of Bent-Type Aqueduct. Adv. Mater. Res. 2011, 163, 4156–4164. [Google Scholar] [CrossRef]
- Krawinkler, H.; Moncarz, P.D. Theory and Application of Experimental Model Analysis in Earthquake Engineering; Tehcnical Report No. 82; Stanford University: Stanford, CA, USA, 1981. [Google Scholar]
- Cristiano, P.A.; Coutinho, C.P.; Baptista, A.J.; Rodrigues, J.D. Reduced scale models based on similitude theory: A review up to 2015. Eng. Struct. 2016, 119, 81–94. [Google Scholar]
- Zhong, J.; Longfei, S.; Tao, Y.; Xiaoxian, L.; Yixian, W. Probabilistic seismic demand model of UBPRC columns conditioned on Pulse-Structure parameters. Eng. Struct. 2022, 270, 114829. [Google Scholar] [CrossRef]
- Zhong, J.; XiangLin, Z.; Qiaofei, W.; LinWei, J.; Min, H.; XinZhi, D. Seismic fragility and resilience assessment of bridge columns with dual-replaceable composite link beam under near-fault GMs. Structures 2023, 474, 12–24. [Google Scholar] [CrossRef]
- AASHTO. Guide Specifications for Seismic Isolation Design, 4th ed.; American Association of State Highway and Transportation Officials: Washington, DC, USA, 2014. [Google Scholar]
- AASHTO. Guide Specifications for LRFD Seismic Bridge Design, 2nd ed.; American Association of State Highway and Transportation Officials: Washington, DC, USA, 2011. [Google Scholar]
- Dao, N.D.; Ryan, K.L.; Sato, E.; Sasaki, T. Predicting the displacement of triple pendulum bearings in a full-scale shaking experiment using a three-dimensional element. Earthq. Eng. Struct. Dyn. 2013, 42, 1677–1695. [Google Scholar] [CrossRef]
Figure 1.
The elevation of a typical aqueduct structure (unit: meters).

Figure 2.
Cross-sections of the girder and the pier (unit: mm).
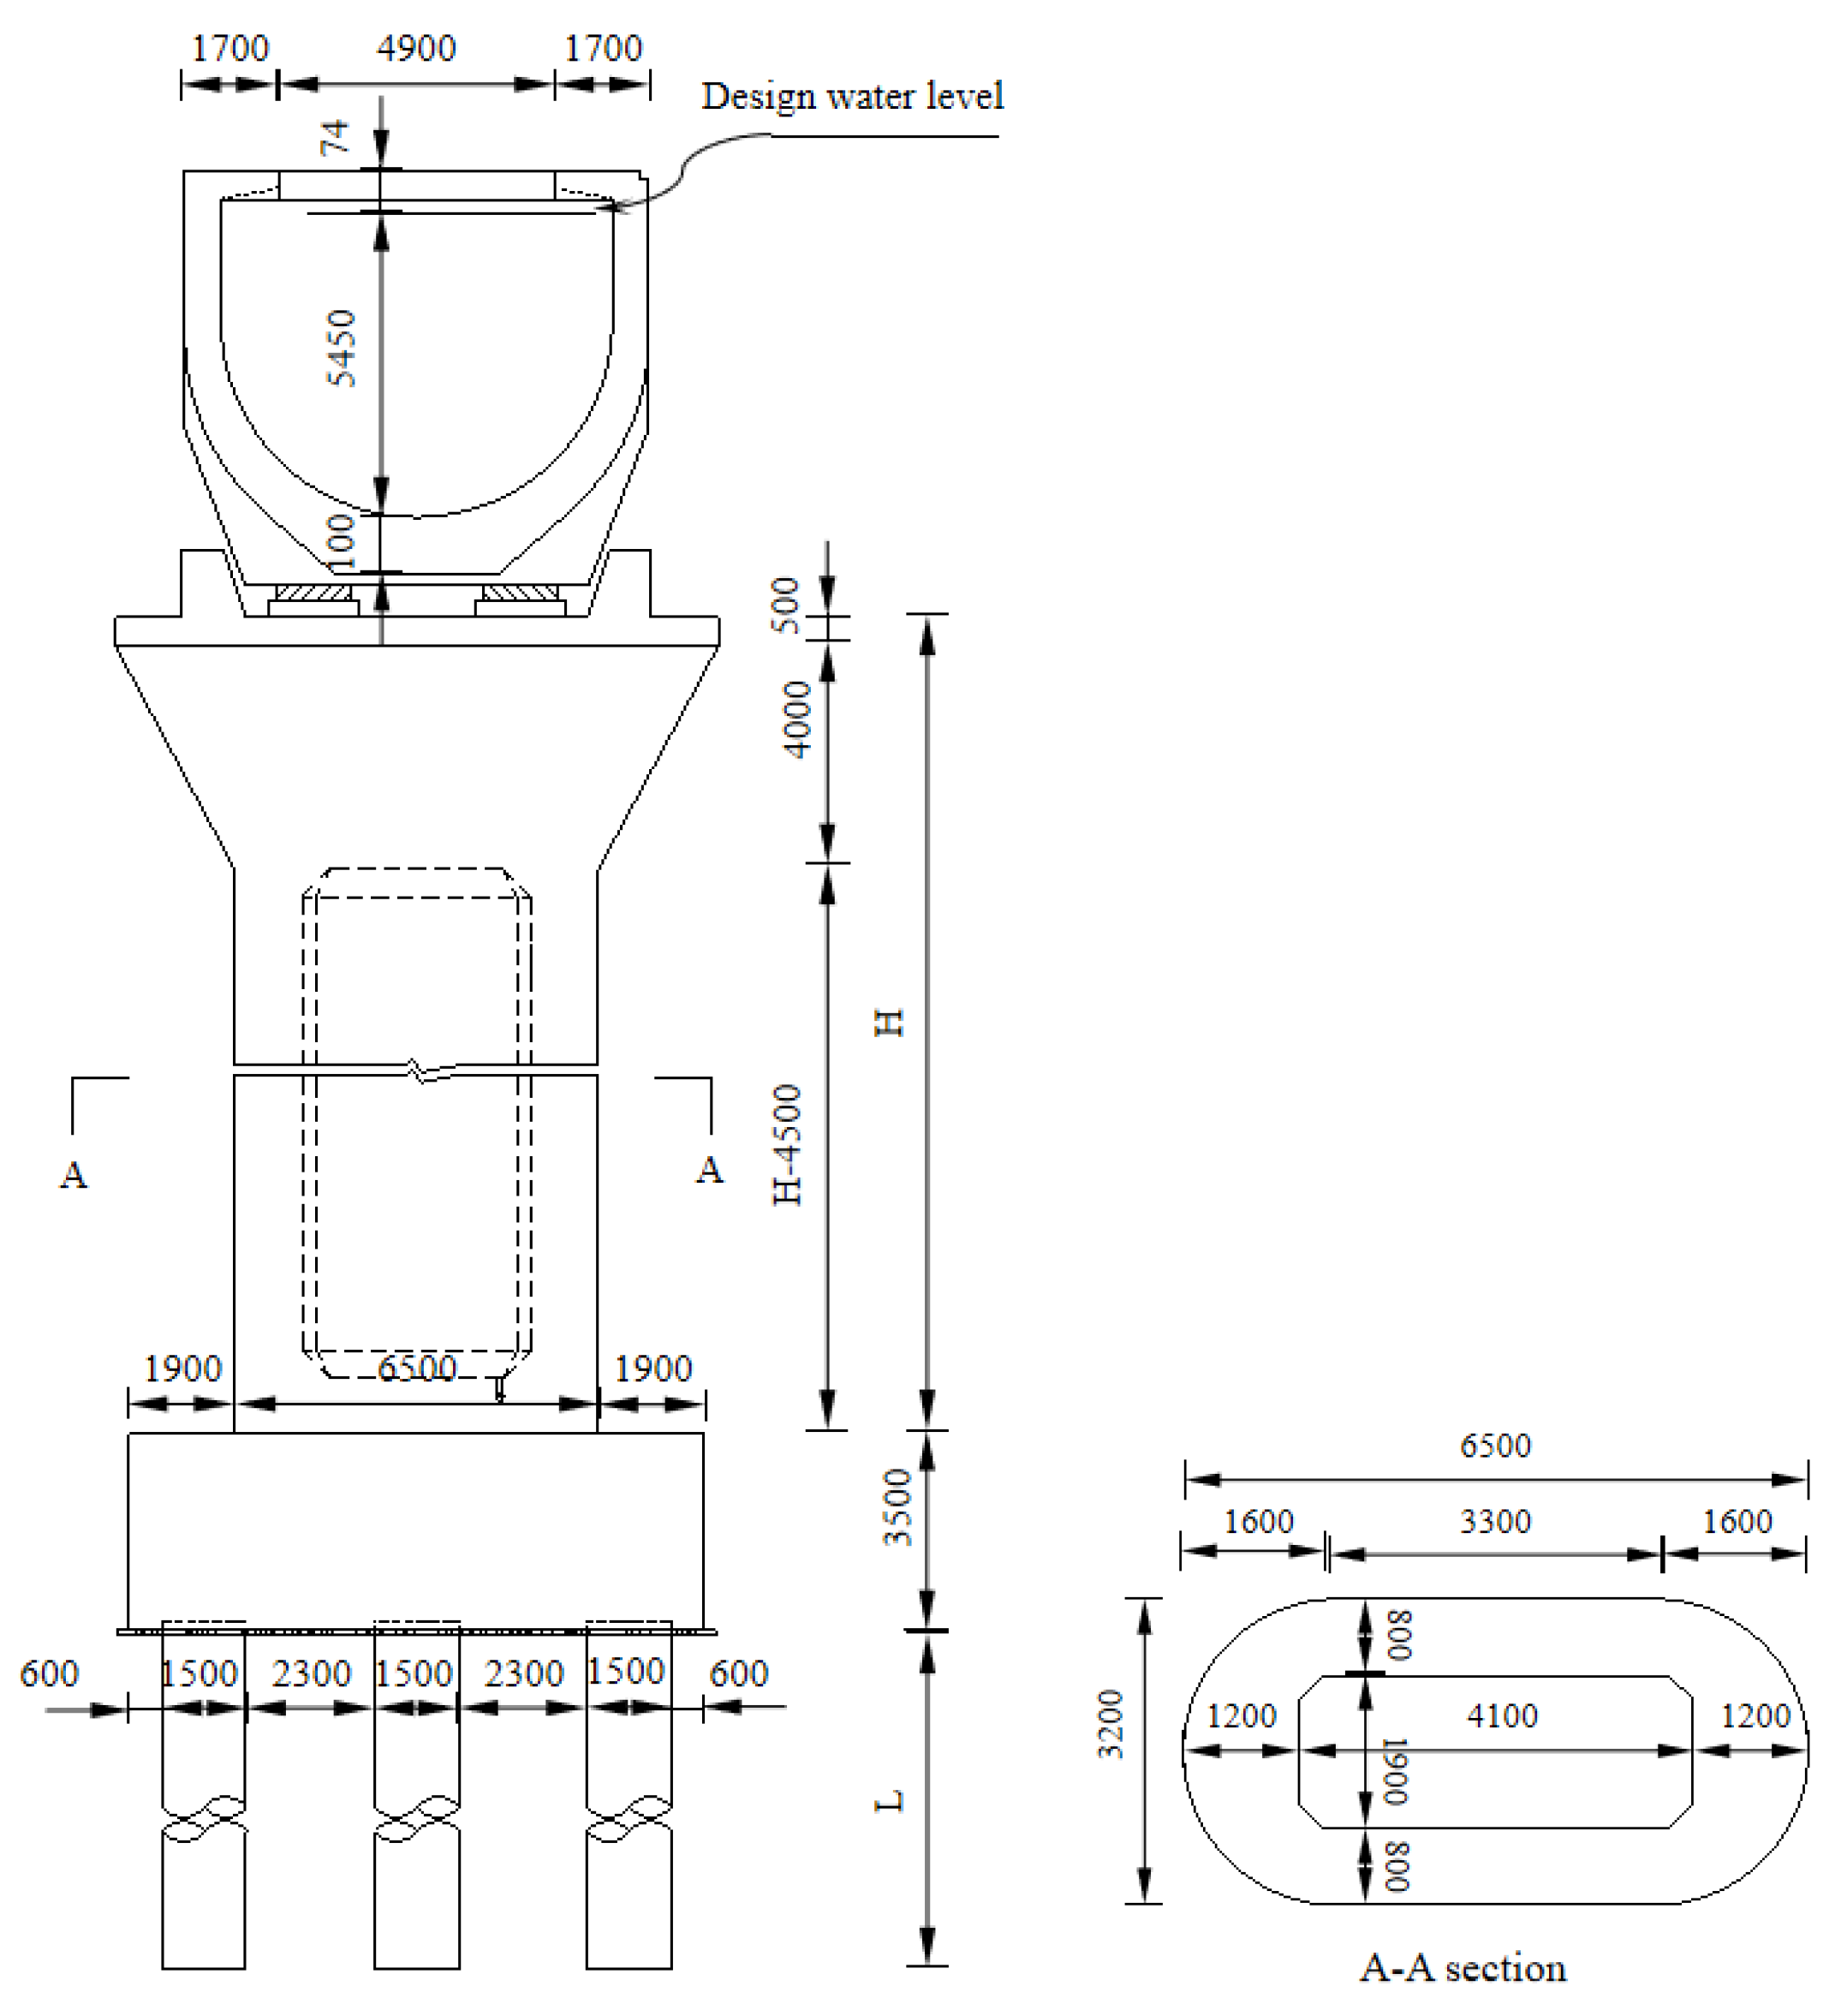
Figure 3.
Components of the IPGB. (a) Details of the IPGB’s structure. (b) IPGB photos.

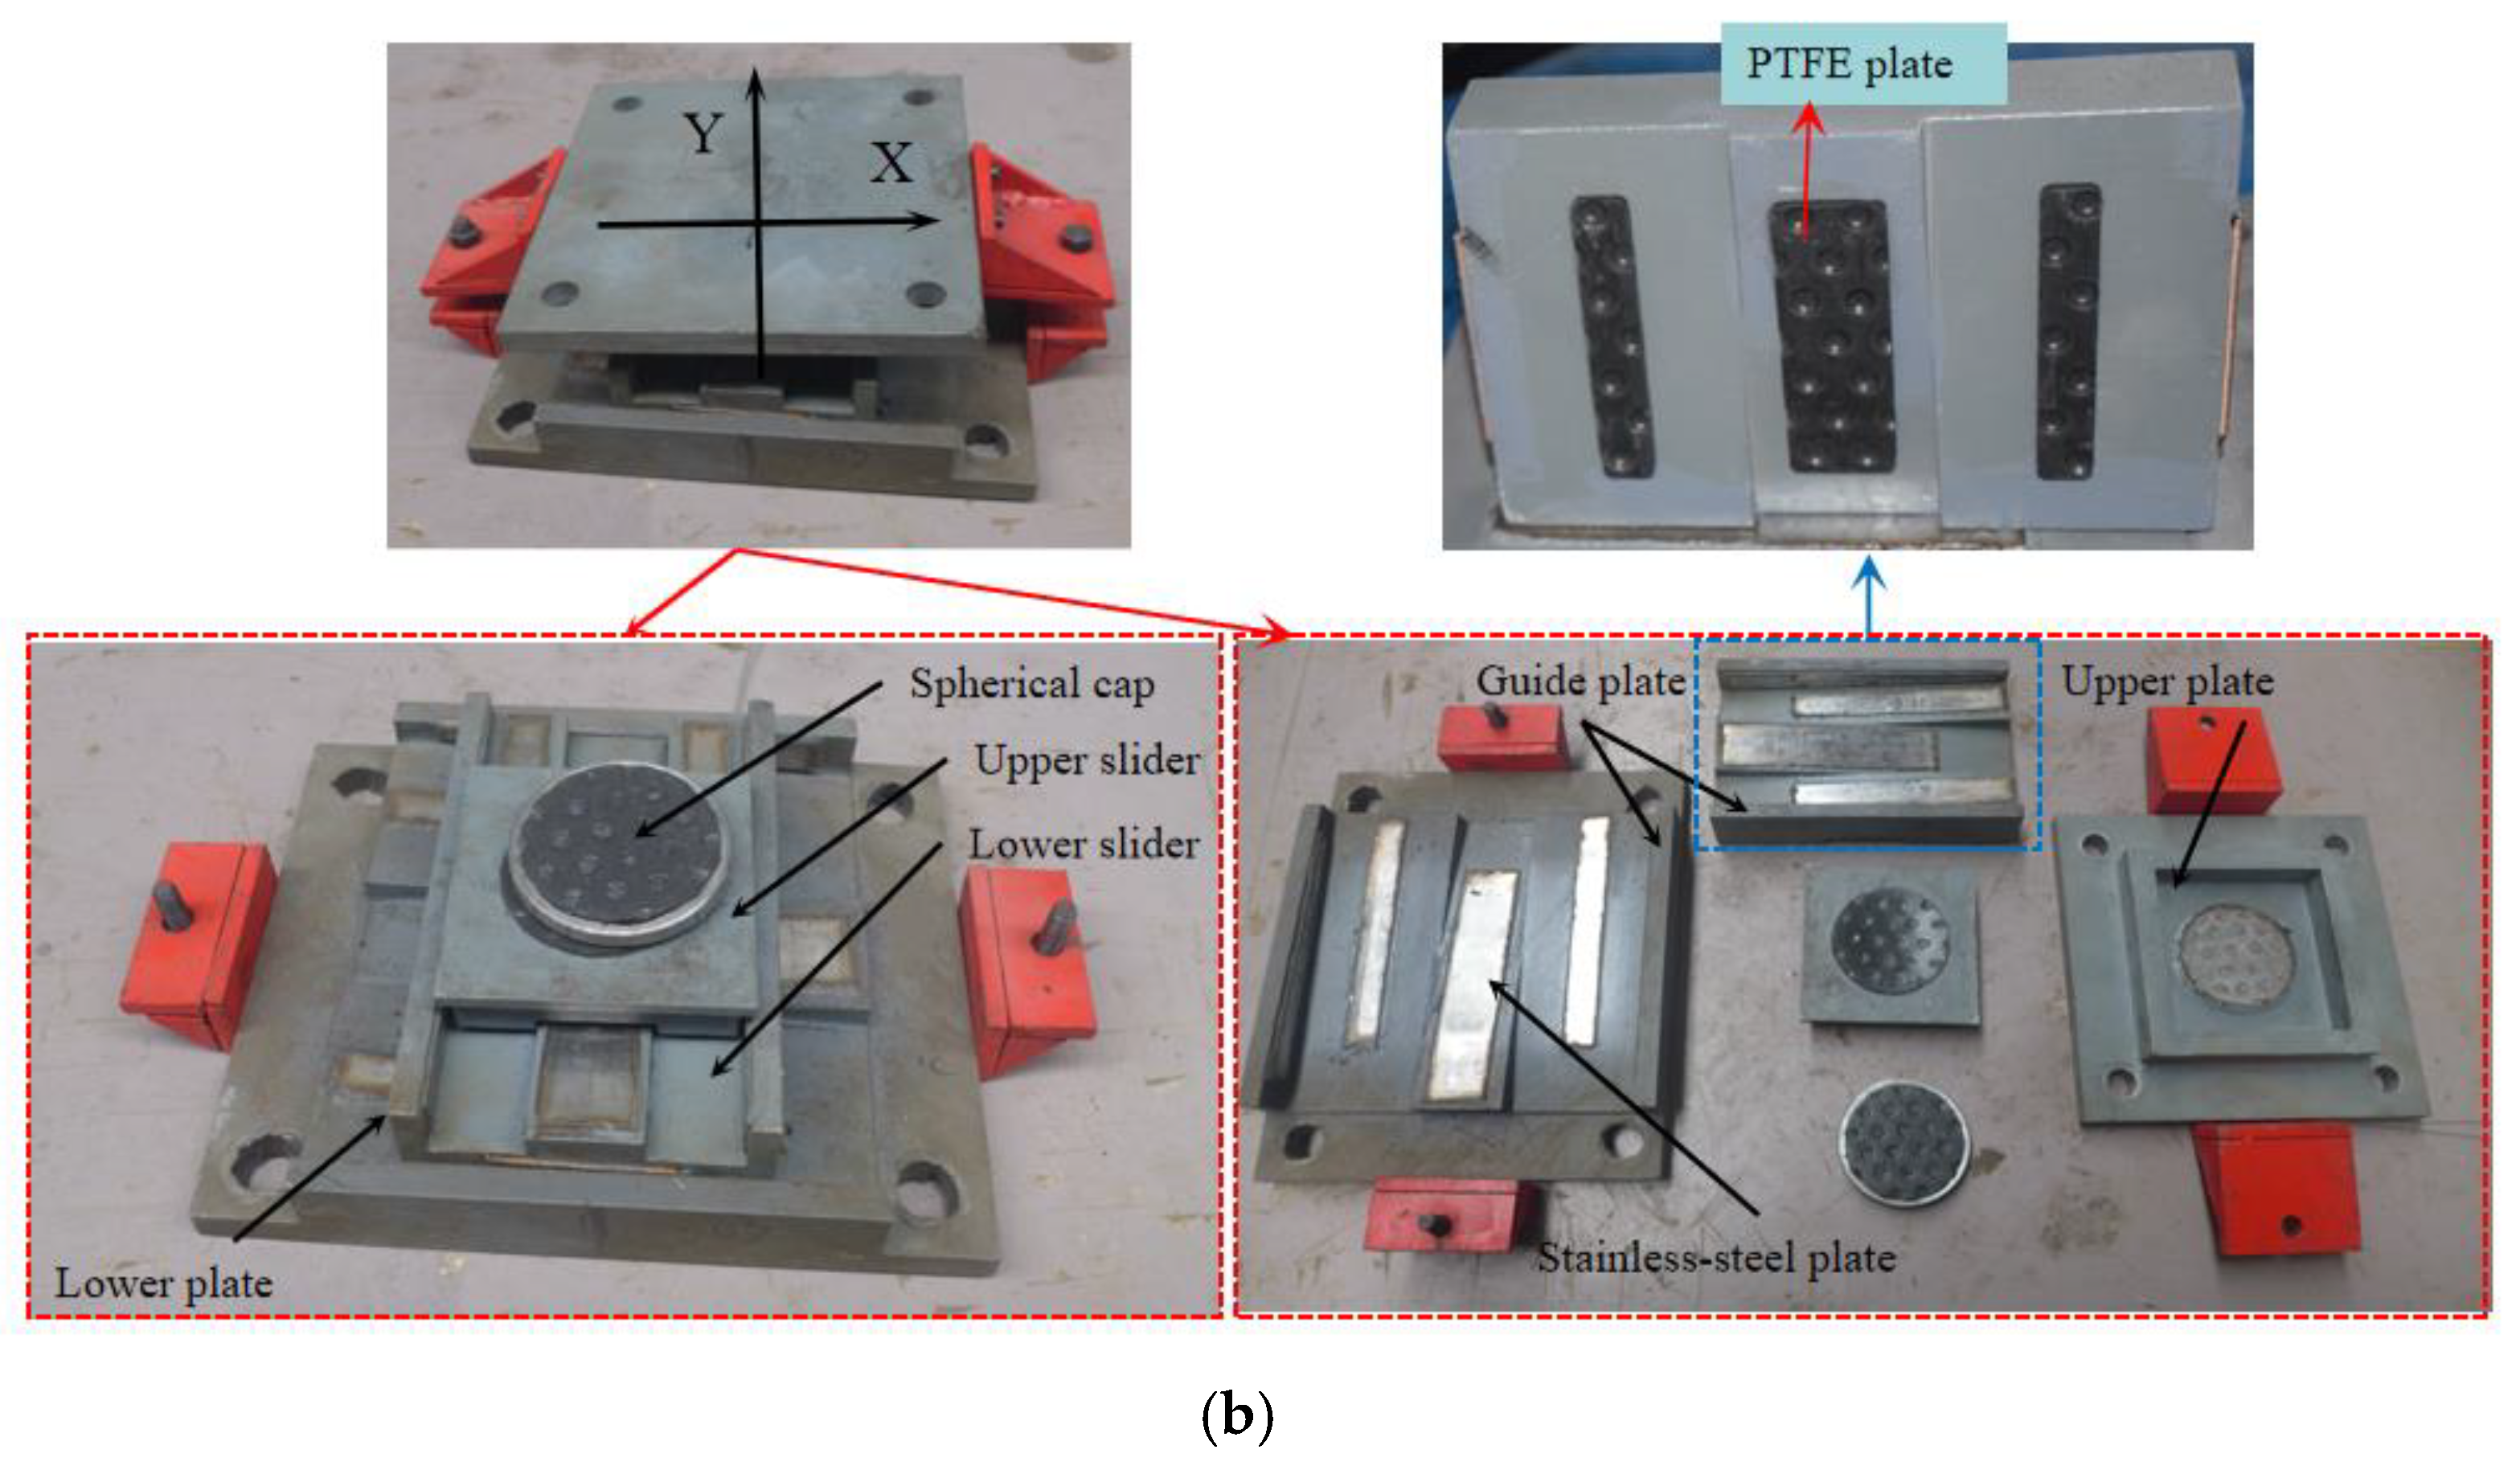
Figure 4.
Hysteresis curve of an IPGB.
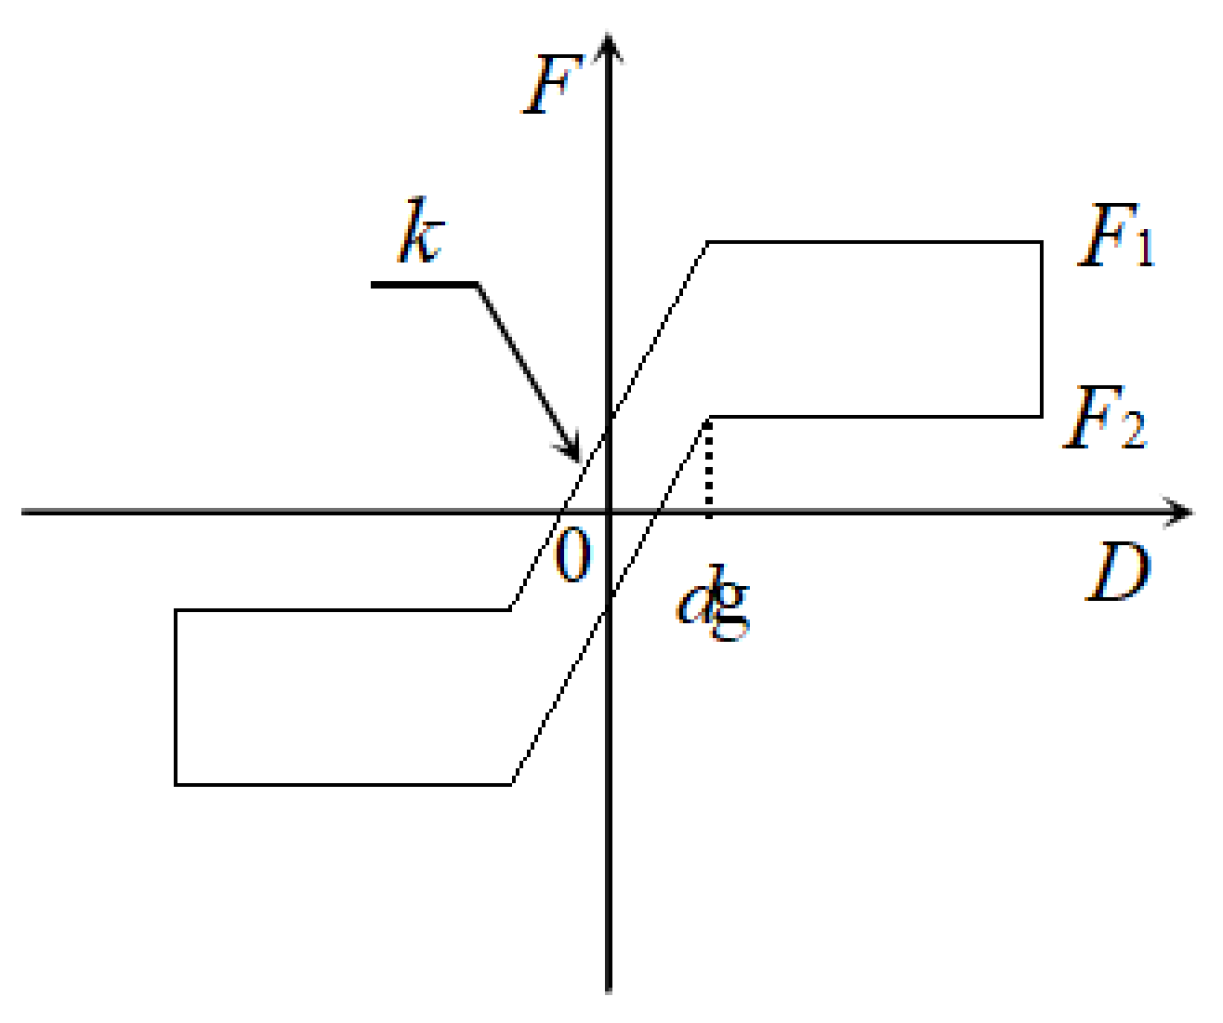
Figure 5.
Design details of Model II (unit: mm).

Figure 6.
Additional mass blocks and transducers of Model II (unit: mm).
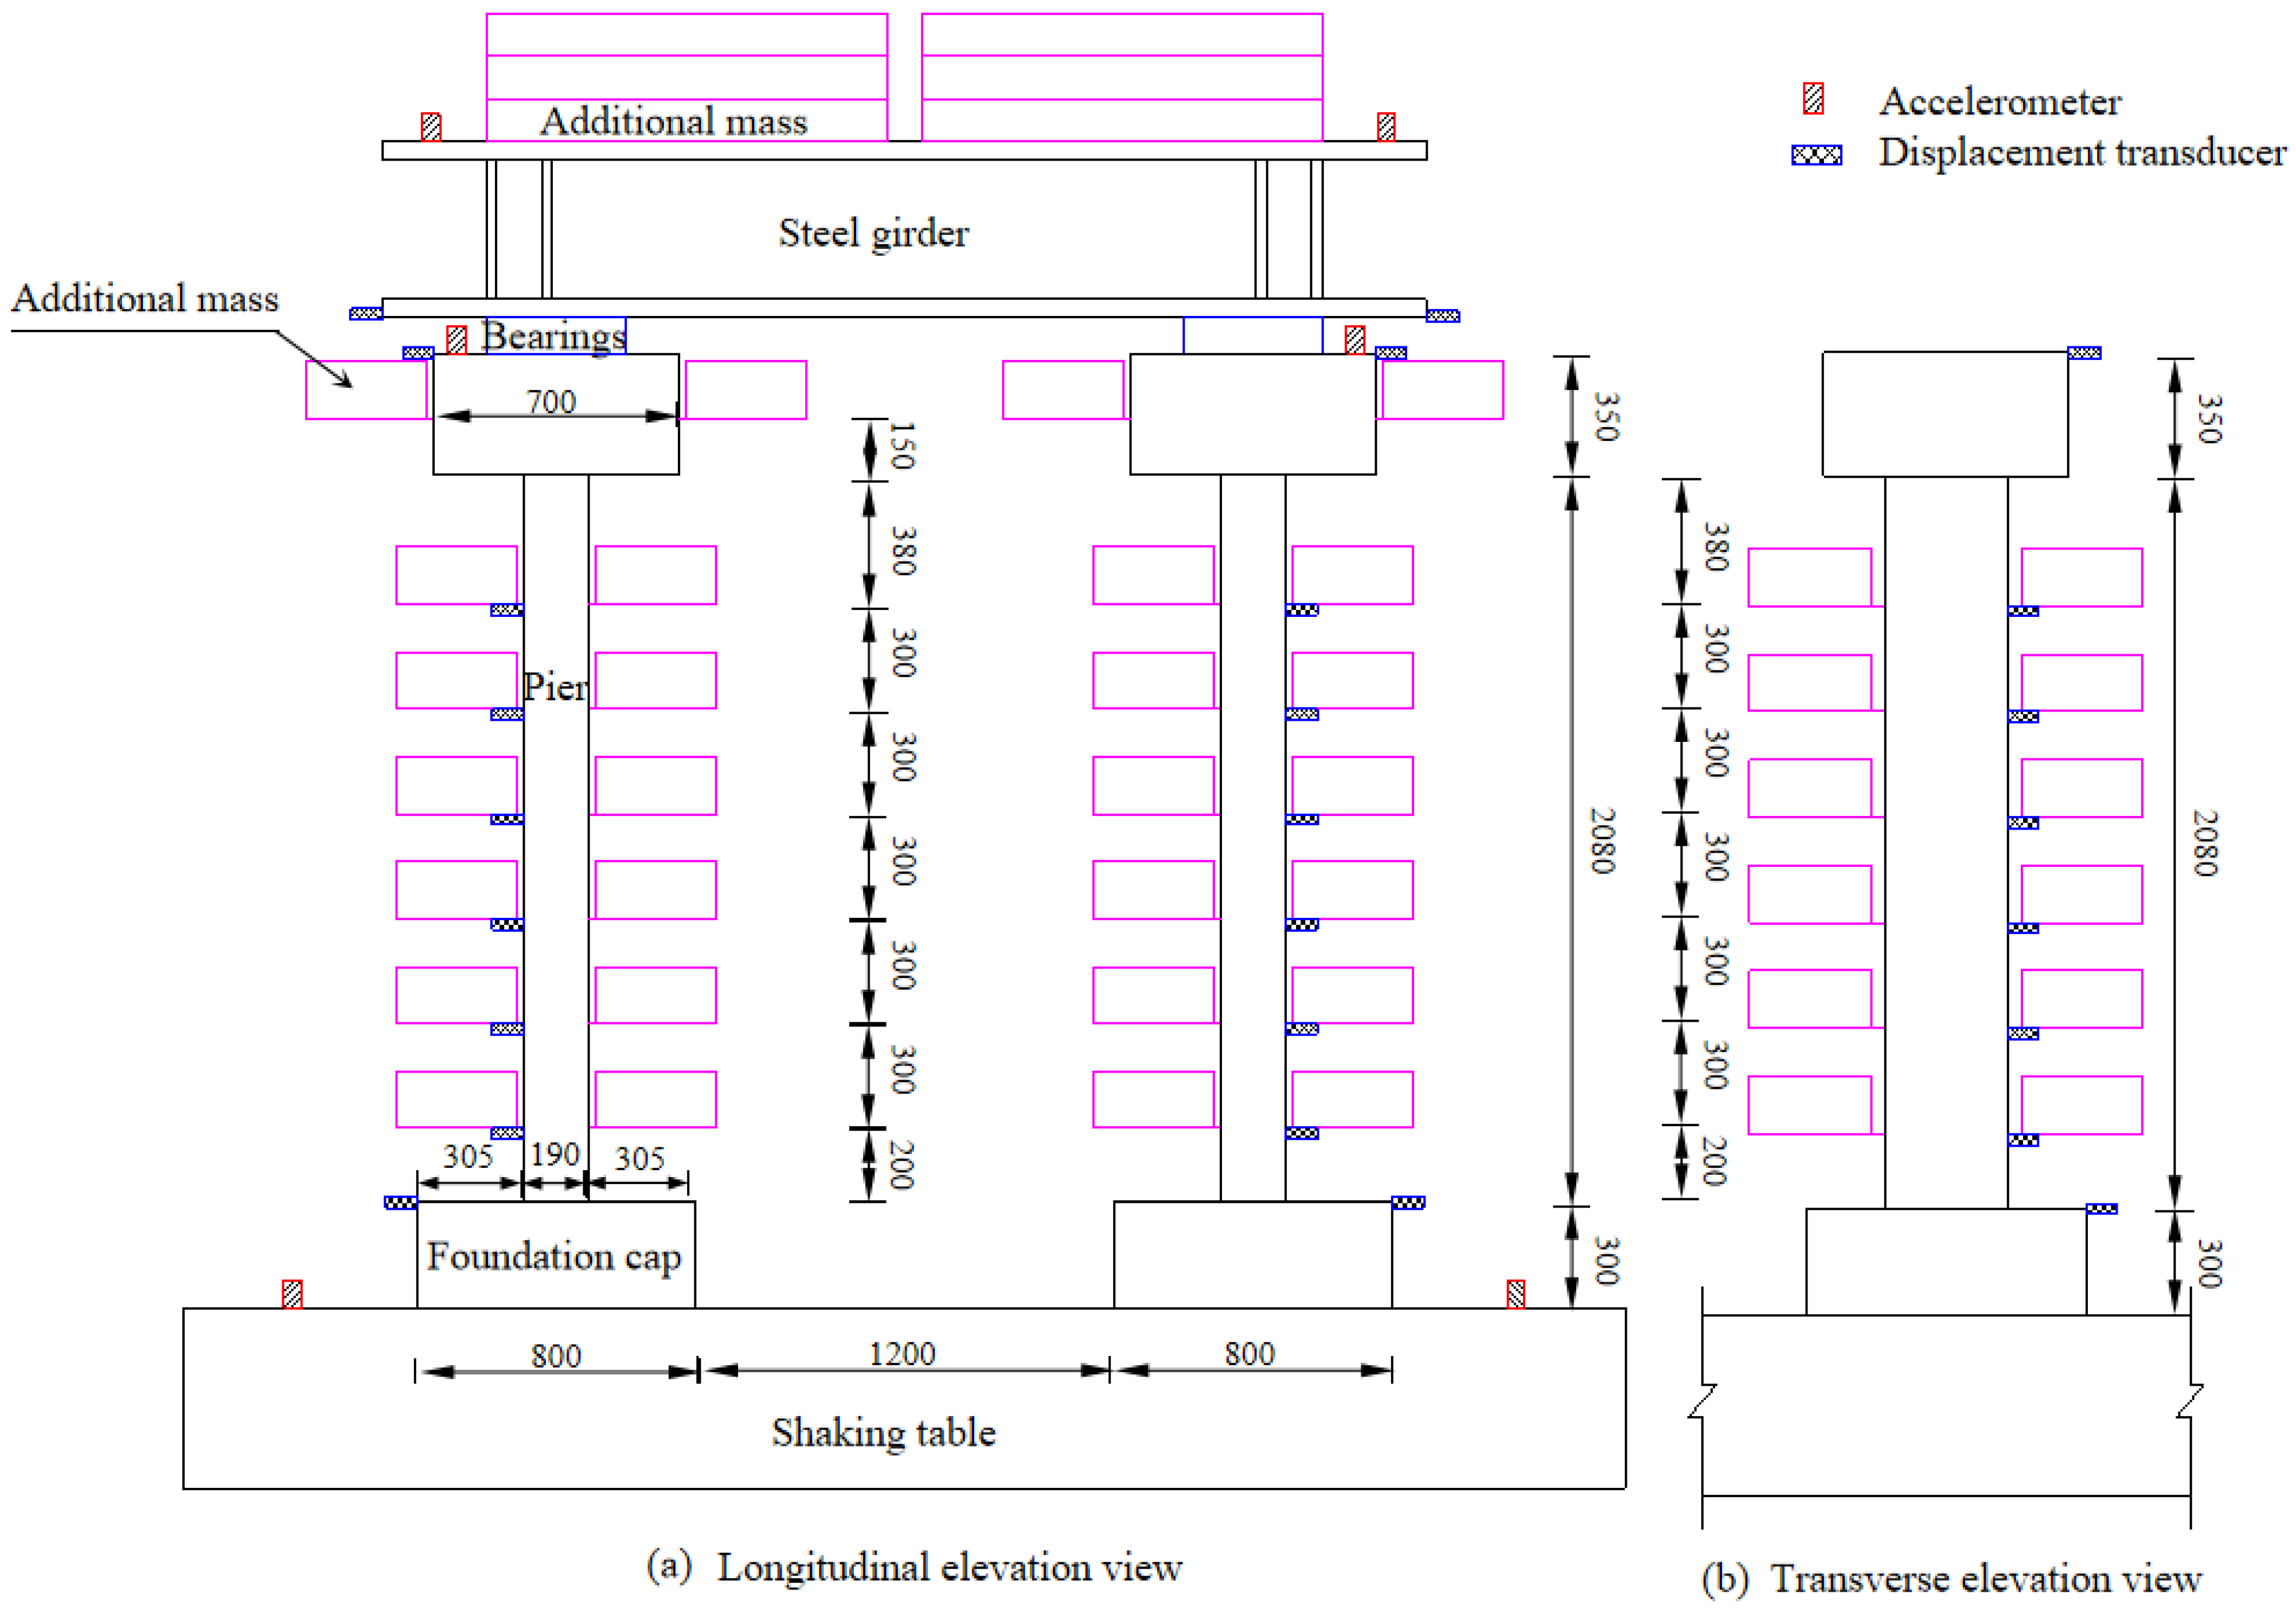
Figure 7.
Photo of the test model.

Figure 8.
Artificial waves (unit: g).

Figure 9.
Maximum responses of the structural acceleration. (a) Pier acceleration. (b) Girder acceleration.
Figure 9.
Maximum responses of the structural acceleration. (a) Pier acceleration. (b) Girder acceleration.

Figure 10.
Seismic responses of the bearings. (a) Maximum displacement. (b) Residual displacement.

Figure 11.
Time history and hysteresis curve of the IPGB of Model I for case 20. (a) Bearing displacement. (b) Hysteresis curve.
Figure 11.
Time history and hysteresis curve of the IPGB of Model I for case 20. (a) Bearing displacement. (b) Hysteresis curve.

Figure 12.
Time history and hysteresis curve of the IPGB of Model II for case 16. (a) Bearing displacement. (b) Hysteresis curve.
Figure 12.
Time history and hysteresis curve of the IPGB of Model II for case 16. (a) Bearing displacement. (b) Hysteresis curve.

Figure 13.
Maximum reinforcement strains at the pier bottom.
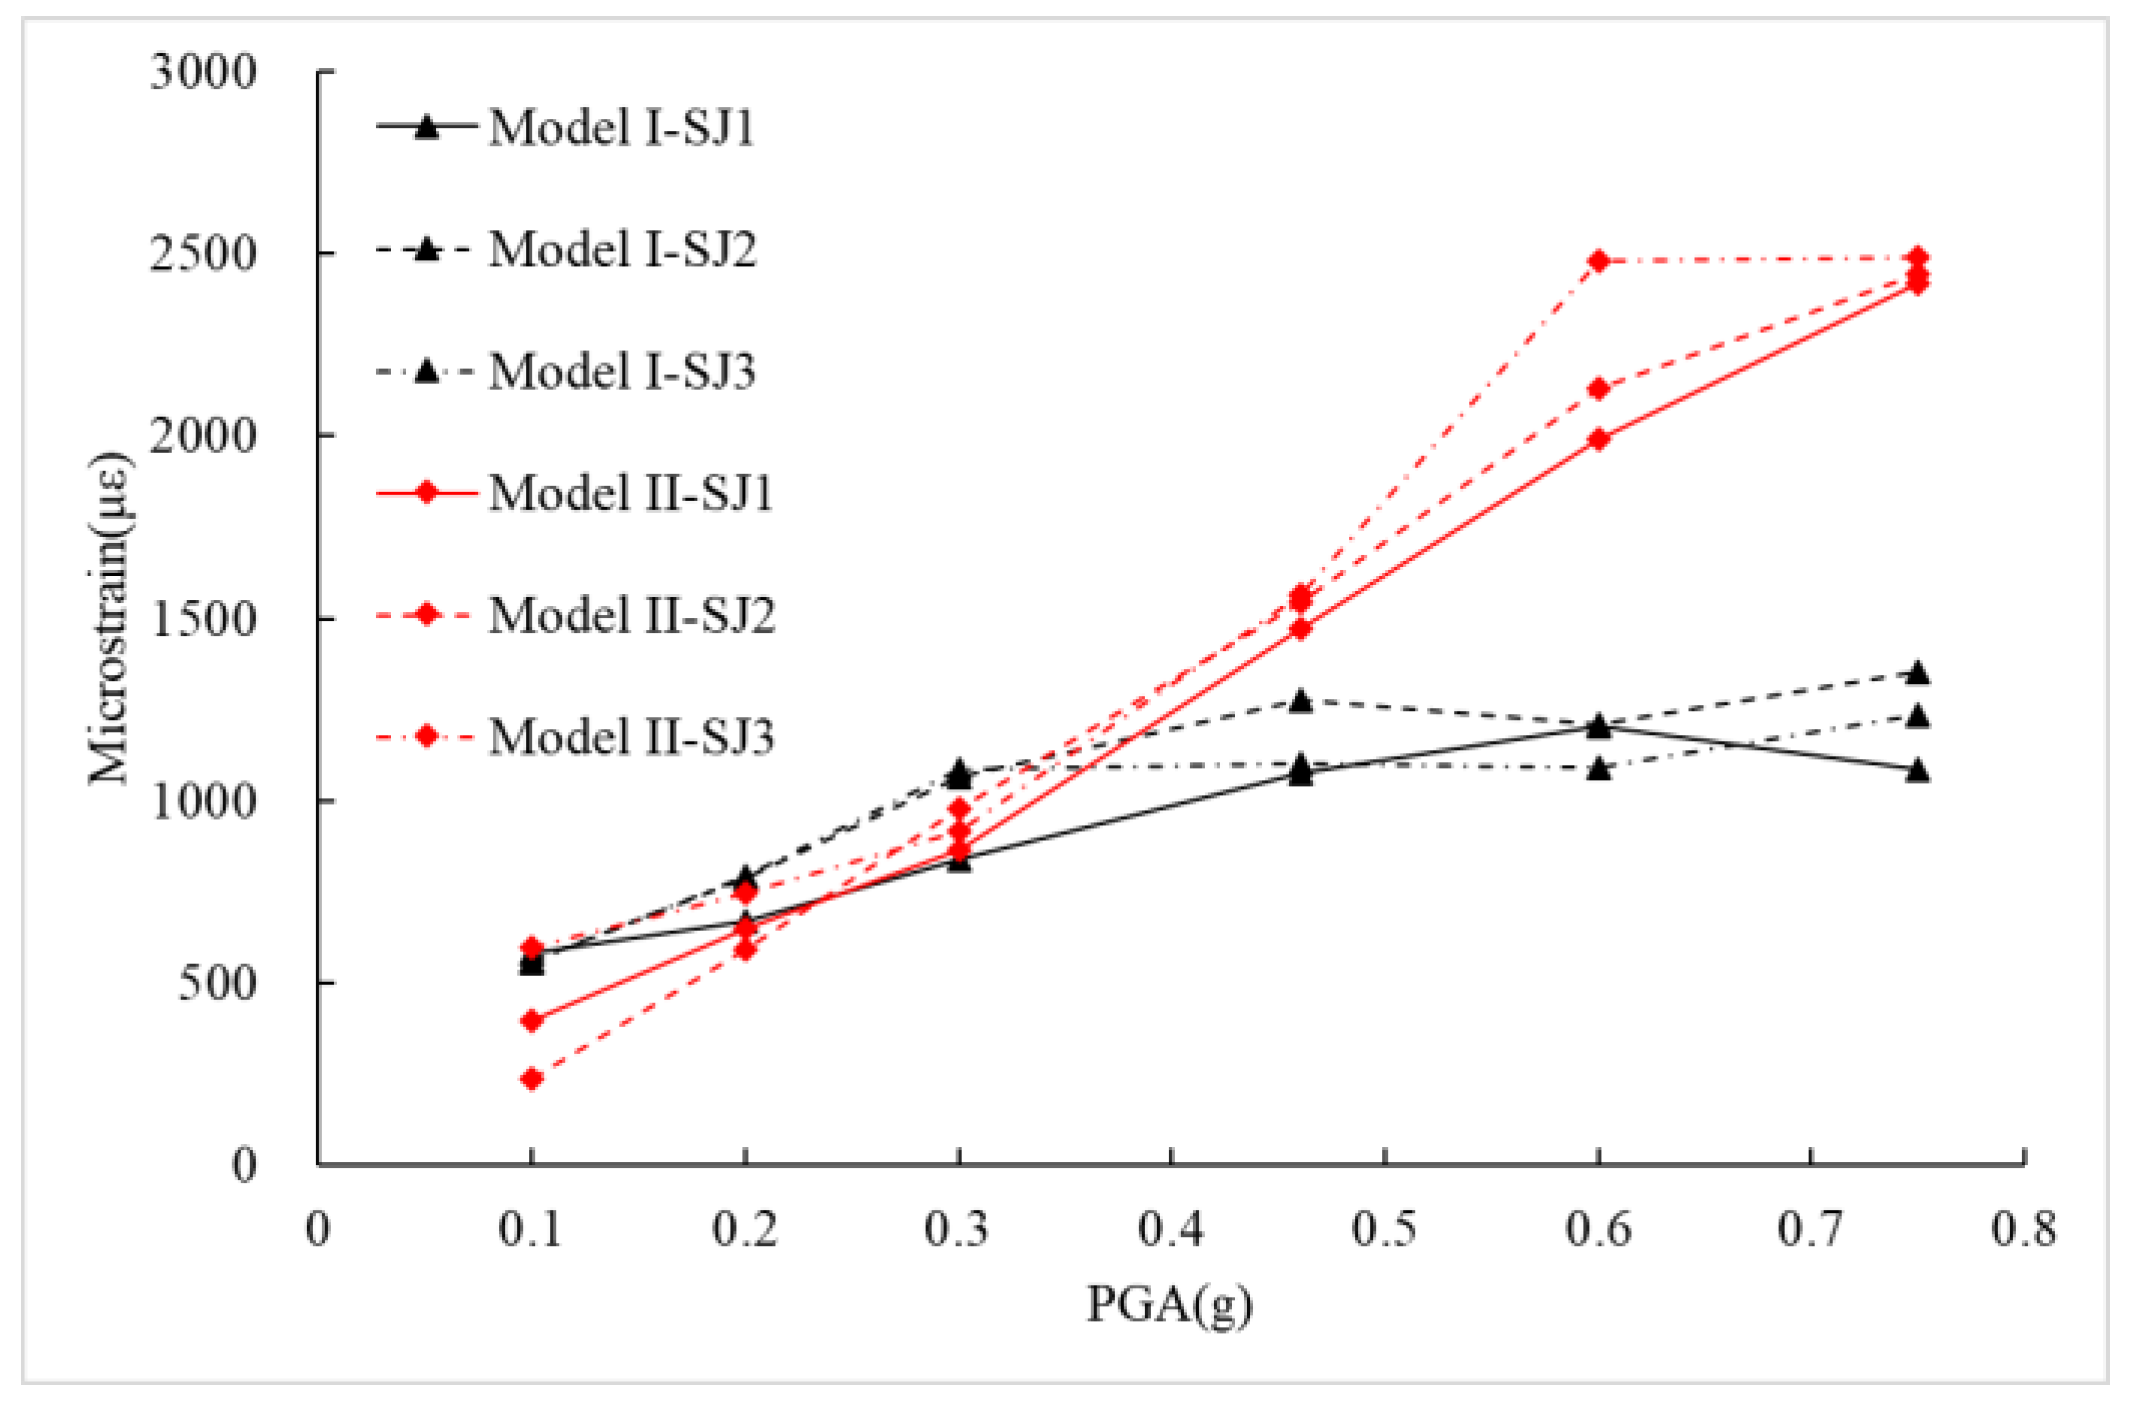
Figure 14.
Displacement time histories in Model I. (a) For case 17. (b) For case 20.
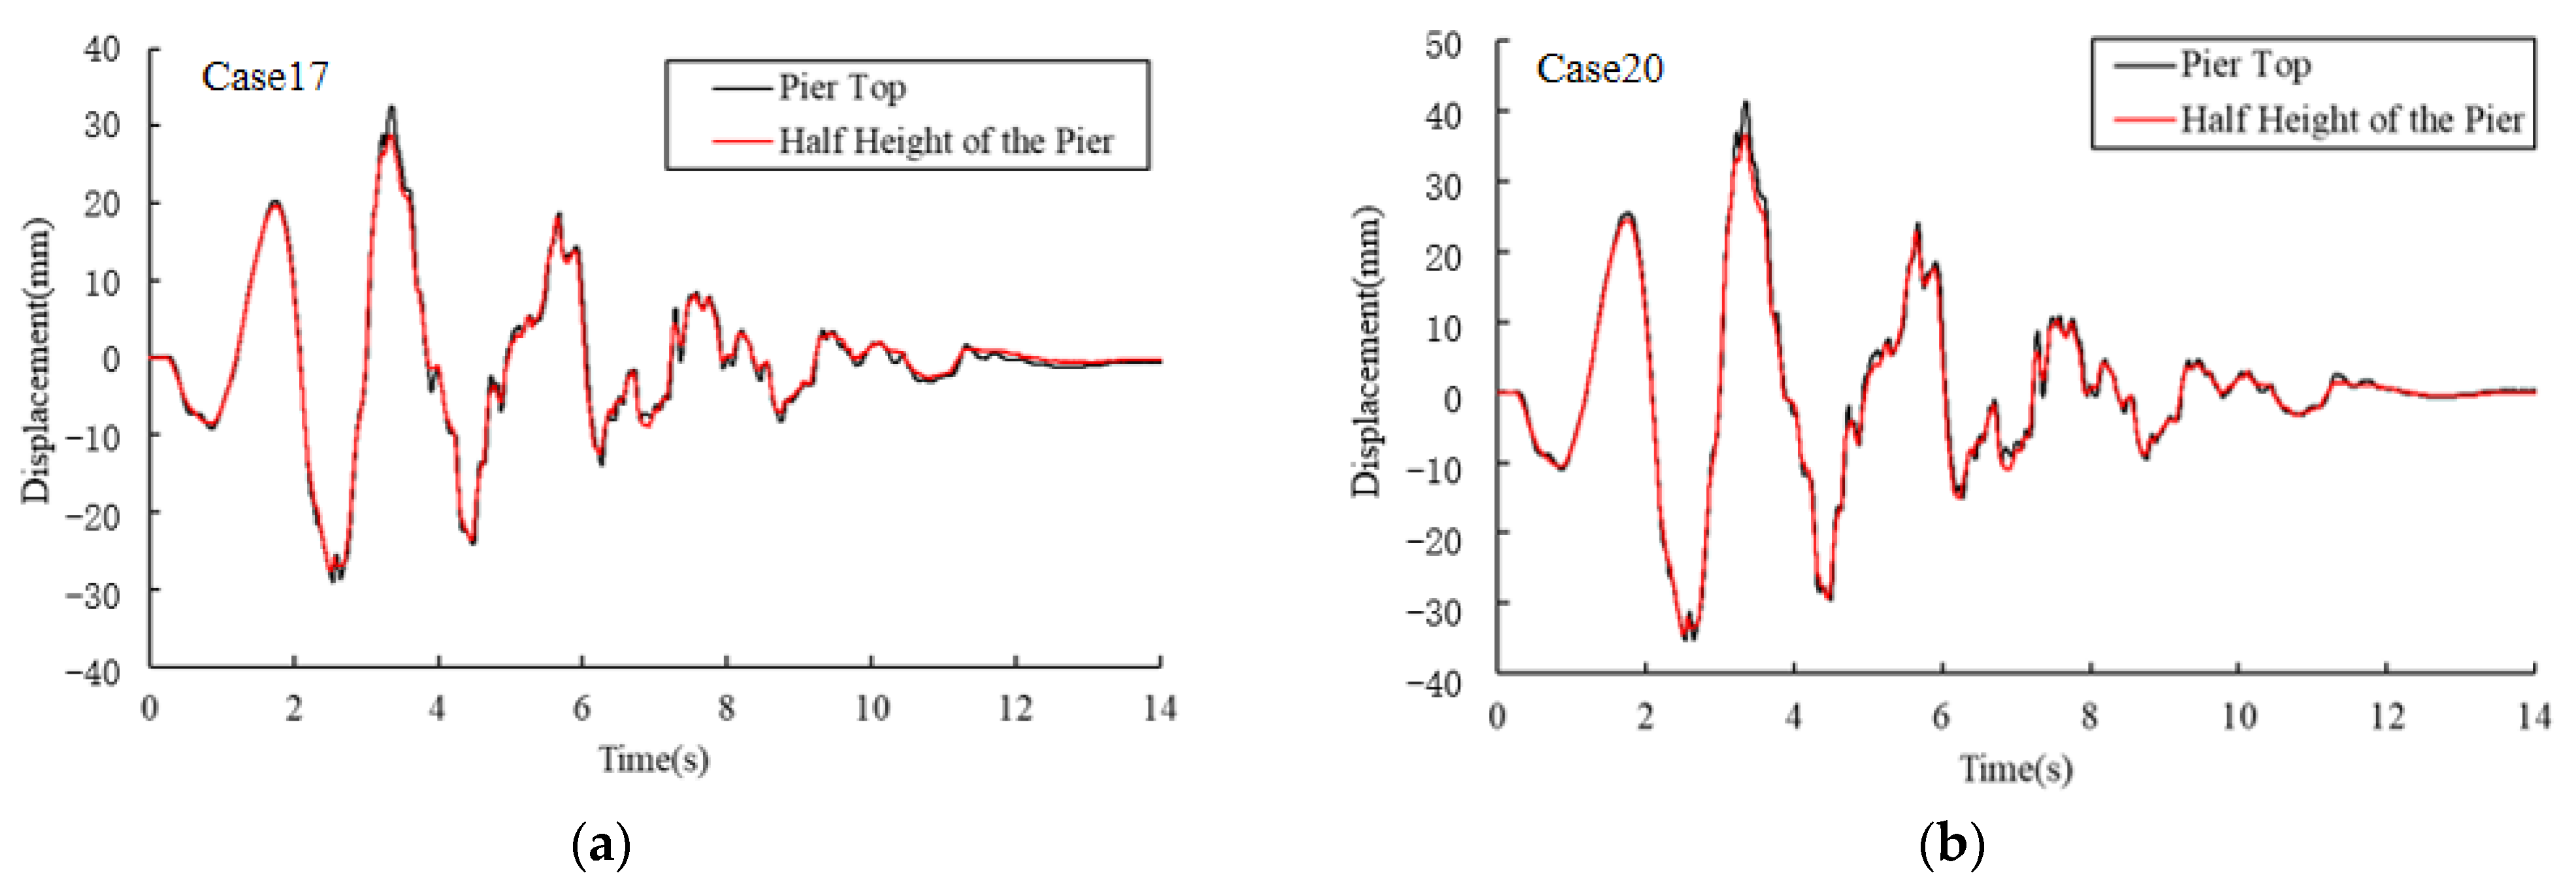
Figure 15.
Displacement time histories in Model II. (a) For case 17. (b) For case 20.
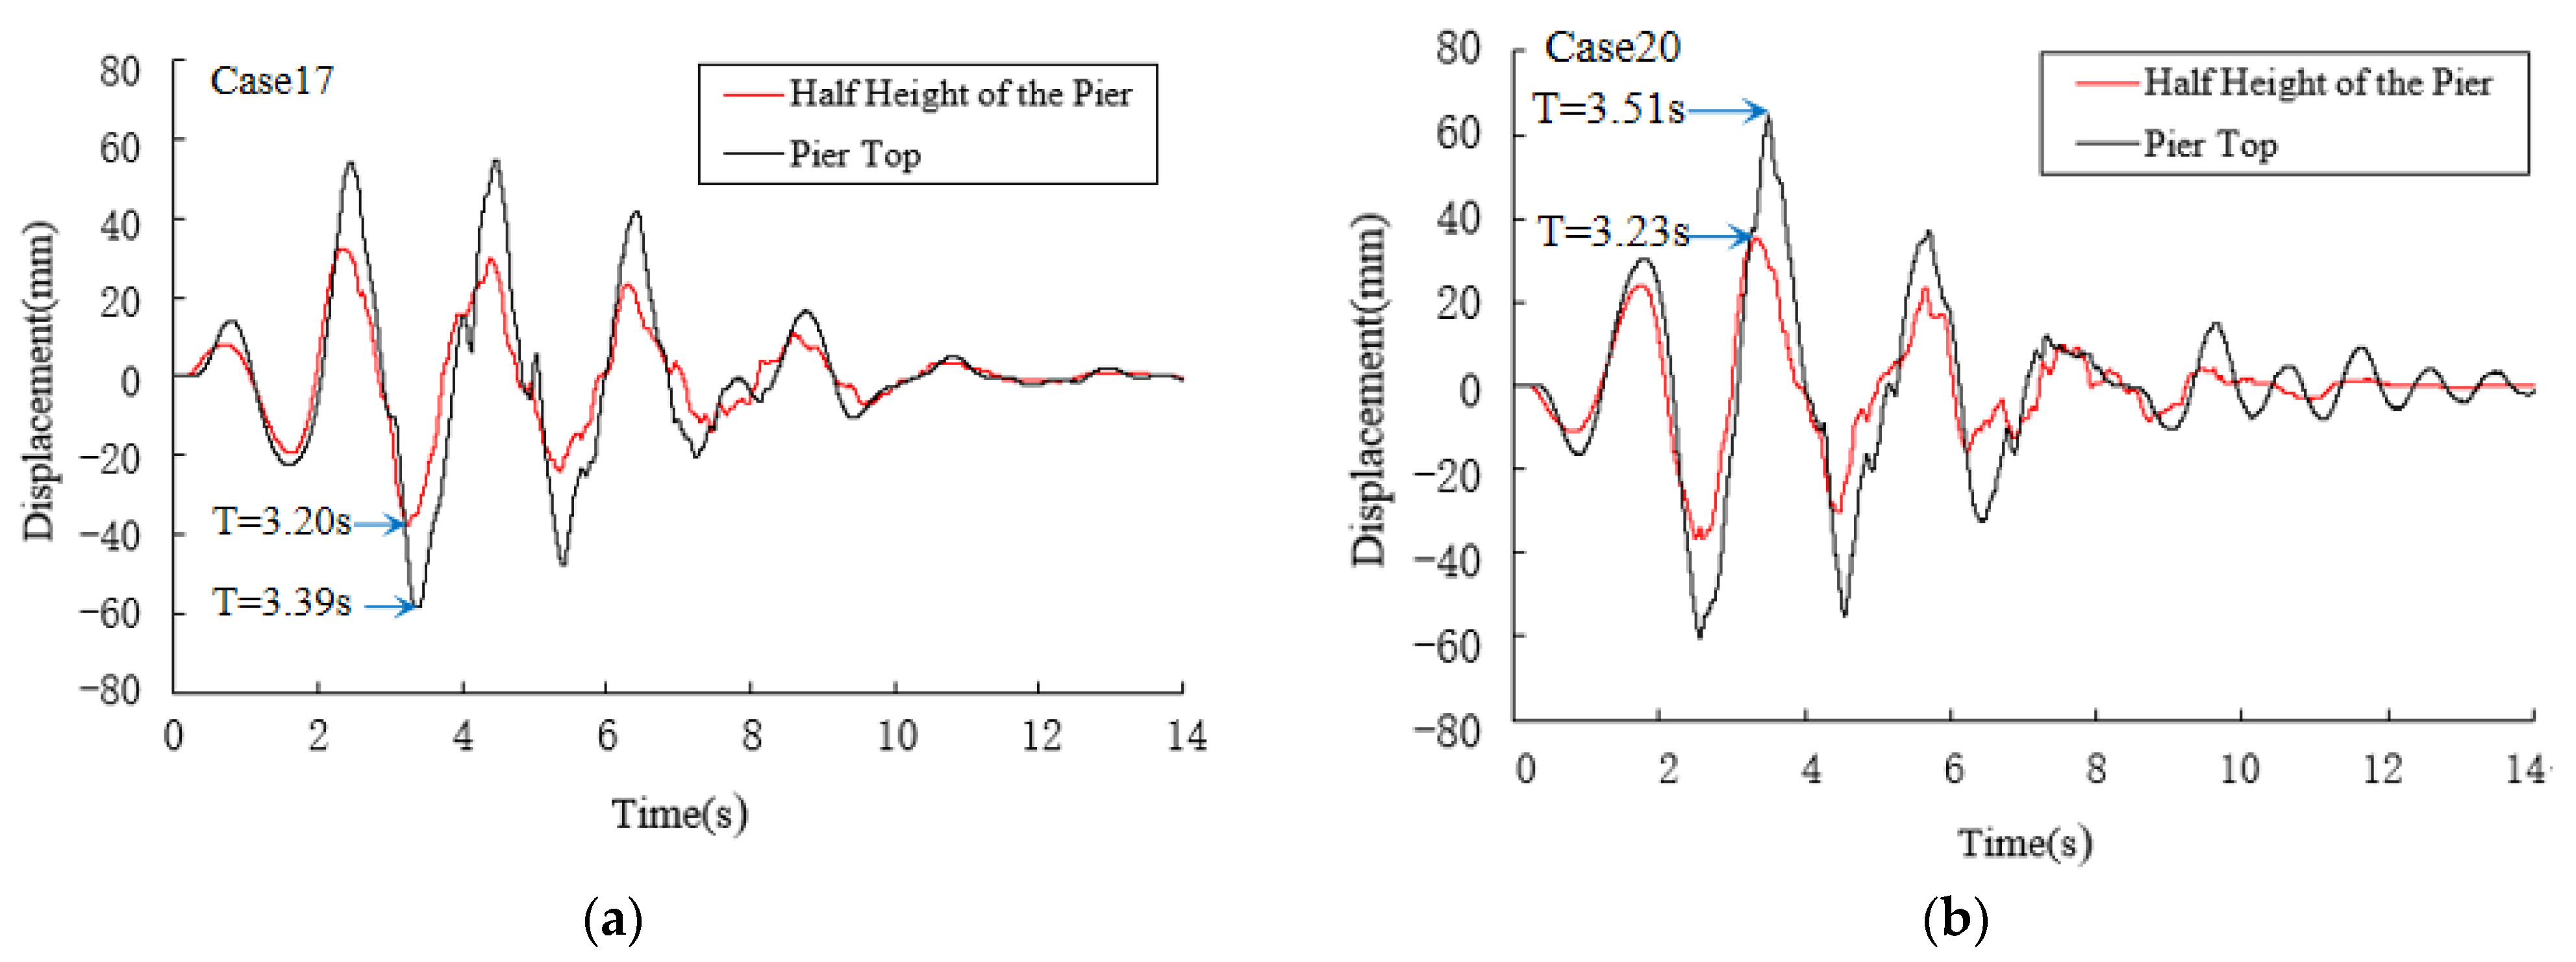
Figure 16.
Simulation method for the IPGBs.

Figure 17.
Numerical simulation model.

Figure 18.
Comparison between the numerical and test results of Model I for case 19. (a) Time history of pier-top displacement. (b) Time history of bearing displacement. (c) Hysteresis curve of the bearings.
Figure 18.
Comparison between the numerical and test results of Model I for case 19. (a) Time history of pier-top displacement. (b) Time history of bearing displacement. (c) Hysteresis curve of the bearings.

Figure 19.
Comparison between the numerical and test results of Model II for case 15. (a) Time history of the pier-top displacement. (b) Time history of the bearing displacement. (c) Hysteresis curve of the bearings.
Figure 19.
Comparison between the numerical and test results of Model II for case 15. (a) Time history of the pier-top displacement. (b) Time history of the bearing displacement. (c) Hysteresis curve of the bearings.


Table 1.
Scale factors of the test model.
| Physical Quantity | Dimensional Calculation | Scale Factors |
|---|---|---|
| Length, l | 0.625 | |
| Displacement, x | 0.625 | |
| Elastic modulus, E | 1 | |
| Strain, | 1 | |
| Stress, | 1 | |
| Density, | 16 | |
| Acceleration, a | 1 | |
| Gravitational acceleration, g | 1 | |
| Concentrated load, P | 0.390 | |
| Moment, M | 0.244 | |
| Time, t | 0.25 | |
| Frequency, | 4 | |
| Damping ratio, | 1 | |
| Stiffness, k | 0.625 | |
| Mass, m | 0.244 |
Table 2.
The additional masses of the main components (unit: kg).
| Components | Mass of the Ideal Model | Mass of the Test Model | Additional Mass |
|---|---|---|---|
| 20 m-high pier | 3920 | 1040 | 2880 |
| 40 m-high pier | 6490 | 1180 | 5310 |
| Girder | 17,000 | 3000 | 14,000 |
Table 3.
Test cases.
| Case | Model | Earthquake Excitation | PGA (g) | Seismic Intensity Level |
|---|---|---|---|---|
| 1 | Model I and II | White noise | 0.05 | |
| 2 | SJ1 | 0.1 | Frequent earthquakes | |
| 3 | SJ2 | 0.1 | ||
| 4 | SJ3 | 0.1 | ||
| 5 | SJ1 | 0.2 | ||
| 6 | SJ2 | 0.2 | ||
| 7 | SJ3 | 0.2 | ||
| 8 | SJ1 | 0.3 | Design earthquakes | |
| 9 | SJ2 | 0.3 | ||
| 10 | SJ3 | 0.3 | ||
| 11 | SJ1 | 0.45 | Rare earthquakes | |
| 12 | SJ2 | 0.45 | ||
| 13 | SJ3 | 0.45 | ||
| 14 | White noise | 0.05 | ||
| 15 | SJ1 | 0.6 | Rare earthquakes | |
| 16 | SJ2 | 0.6 | ||
| 17 | SJ3 | 0.6 | ||
| 18 | SJ1 | 0.75 | ||
| 19 | SJ2 | 0.75 | ||
| 20 | SJ3 | 0.75 | ||
| 21 | White noise | 0.05 |
Table 4.
The natural frequency of each test model.
| Model | Case 1 | Case 14 | Case 21 |
|---|---|---|---|
| Model I | 3.0 Hz | 2.9 Hz | 2.8 Hz |
| Model II | 1.6 Hz | 1.4 Hz | 1.3 Hz |
Table 5.
Seismic isolation rate R.
| Model | Earthquake Excitation | PGA (g) | |||||
|---|---|---|---|---|---|---|---|
| 0.1 | 0.2 | 0.3 | 0.46 | 0.6 | 0.75 | ||
| Model I | SJ1 | 64.9% | 76.2% | 83.5% | 89.3% | 88.1% | 89.2% |
| SJ2 | 61.1% | 73.8% | 76.6% | 80.7% | 87.5% | 91.3% | |
| SJ3 | 65.4% | 74.2% | 86.0% | 86.4% | 89.6% | 90.0% | |
| Model II | SJ1 | 66.9% | 78.4% | 81.7% | 78.1% | 81.6% | 86.2% |
| SJ2 | 68.5% | 69.6% | 74.1% | 78.9% | 85.5% | 86.9% | |
| SJ3 | 60.6% | 74.3% | 71.4% | 80.5% | 84.6% | 88.4% | |
Table 6.
Comparisons between the numerical and test results.
| Model and Test Condition | Pier-Top Displacement (mm) | Bearing Displacement (mm) | Bearing Force (kN) | ||||||
|---|---|---|---|---|---|---|---|---|---|
| Test | Numerical | Numerical/Test | Test | Numerical | Numerical/Test | Test | Numerical | Numerical/Test | |
| Model I, case 19 | 5.47 | 5.32 | 0.97 | 30.62 | 30.35 | 0.99 | 4.58 | 3.90 | 0.85 |
| Model II, case 15 | 22.63 | 22.26 | 0.98 | 17.46 | 18.45 | 1.06 | 4.21 | 3.50 | 0.83 |
Disclaimer/Publisher’s Note: The statements, opinions and data contained in all publications are solely those of the individual author(s) and contributor(s) and not of MDPI and/or the editor(s). MDPI and/or the editor(s) disclaim responsibility for any injury to people or property resulting from any ideas, methods, instructions or products referred to in the content. |
© 2023 by the authors. Licensee MDPI, Basel, Switzerland. This article is an open access article distributed under the terms and conditions of the Creative Commons Attribution (CC BY) license (https://creativecommons.org/licenses/by/4.0/).
Share and Cite
MDPI and ACS Style
Peng, T.; Dong, Y. Seismic Responses of Aqueducts Using a New Type of Self-Centering Seismic Isolation Bearing. Sustainability 2023, 15, 2402. https://doi.org/10.3390/su15032402
AMA Style
Peng T, Dong Y. Seismic Responses of Aqueducts Using a New Type of Self-Centering Seismic Isolation Bearing. Sustainability. 2023; 15(3):2402. https://doi.org/10.3390/su15032402
Chicago/Turabian StylePeng, Tianbo, and Yang Dong. 2023. "Seismic Responses of Aqueducts Using a New Type of Self-Centering Seismic Isolation Bearing" Sustainability 15, no. 3: 2402. https://doi.org/10.3390/su15032402
Note that from the first issue of 2016, this journal uses article numbers instead of page numbers. See further details here.