
Assessment of Ecological Environment Quality in Rare Earth Mining Areas Based on Improved RSEI

1
School of Environmental Studies, China University of Geosciences, Wuhan 430074, China
2
Command Center of Natural Resources Comprehensive Survey, China Geological Survey, Beijing 100055, China
*
Author to whom correspondence should be addressed.
Sustainability 2023, 15(4), 2964; https://doi.org/10.3390/su15042964
Submission received: 1 January 2023
/
Revised: 30 January 2023
/
Accepted: 1 February 2023
/
Published: 6 February 2023
Abstract
:In past decades, the reckless exploitation of rare earth mines devastated the ecological environment. Under strict regulation and governance, the exploitation has gradually gotten back on track in recent years. In this regard, timely and accurate assessment of the ecological environment quality of rare earth management areas is indispensable for regional mine development planning, ecological protection, and sustainable development. Being relatively objective and providing instant results, the Remote Sensing Ecological Index (RSEI) is widely used in evaluating ecological environment quality. This paper combined Landsat 8 OLI multispectral imagery with meteorological, land type, and other data to set the Net Primary Productivity (NPP). The NPP reflects detailed regional vegetation destruction and climate variation, the greenness index of RSEI. We also used kernel principal component analysis (KPCA) to obtain the improved ecological index K-RSEINPP while evaluating the ecological environment quality of rare earth mining areas in southern Jiangxi and compared this with the traditional RSEI results. The results indicate that: (1) PC1 accounts for 88.51% of the results obtained based on K-RSEINPP, and the average correlation coefficient with each index reaches 0.757, which integrates the characteristics of the four indicators; (2) Compared with other indexes, the K-RSEINPP proposed in this paper can better display the detailed information of the ecological environment in the rare earth mining areas to differentiate mining areas under various statuses and cities with different vegetation coverage, and its results were consistent with the actual verification. Therefore, our K-RSEINPP can provide an effective basis for monitoring and evaluating the ecological environment of the mining area.
1. Introduction
The southern Ganzhou region of Jiangxi Province, known as the “Kingdom of Rare Earths”, is one of the important rare earth production areas in China. Its rare earth mining accounts for 70% of the country’s production [1]. The majority of rare earth mines in Ganzhou are scattered in remote mountainous areas, obviously a regulation obstacle and drastically increasing supervision costs. It is no wonder that mining exploitation existed there for a long period and caused a series of problems, such as waste of resources, land and vegetation destruction, soil erosion, and heavy metal pollution [2,3,4], not only posing a huge threat to the local peoples’ health and negatively affecting their daily lives, but also suppressing regional economic growth and social development [5]. Those serious consequences attracted the government’s attention regarding the remediation and resurrection of rare earth mining areas in Jiangxi. In recent years, several policies and restoration works have been launched [6]. With the proposal of the green development concept of “Two Mountains”, it is imperative that we accurately evaluate the ecological environment quality of rare earth mining areas to promote the sustainable and healthy development of regional mine development and environmental protection.
The ecological environment quality index is a quantitative expression of ecological environmental quality, usually generated by establishing an ecological evaluation index system based on prior knowledge and giving different weight to each index through mathematical methods [7,8,9]. Based on remote sensing and GIS technology, many scholars have developed remote sensing index methods to quantitatively evaluate changes in ecosystems and ecological environments. Specifically, by constructing different indices that reflect different aspects of ecosystems, they can characterize ecosystem quality and evaluate changes in ecological environments [10]. The Remote Sensing Ecological Index (RSEI), established by Xu et al. in 2013 [11], is a comprehensive index for the rapid detection of the regional ecological environment status through remote sensing data, which can accurately reflect the ecological environmental status of each spatial location in the region [12]. In general, RSEI can be expressed as a function of 4 indicators of moisture, greenness, dryness, and heat, which are closely related to regional ecological status:
RSEI’s proposal supplements the method of ecological evaluation. It integrates various surface environmental factors quickly obtained by remote sensing, such as surface temperature, vegetation coverage, soil moisture, soil dryness, etc. Moreover, this method amplifies the advantages of remote sensing by weighting each indicator through their main component contribution, thereby reducing the uncertainty of artificial weighting. It is now widely used in the ecological environment evaluation of cities, islands, mines, etc., offering not only calculation convenience but also objective, visible, and stable results [13,14,15].
Due to the dense vegetation coverage in southern Jiangxi and special mining technology of rare earth ore, the mining process requires stripping the topsoil and destroying the mountain body, in which ammonia nitrogen compounds are also used that have various influences on the local vegetation and climate [16]. In this case, the classical RSEI that uses only NDVI as the vegetation status evaluation index can neither accurately characterize the vegetation status nor fully reflect the extent of the consequences of regional vegetation damage and climate change. It can be seen that we can hardly get accurate results if the RSEI method is directly applied to the assessment of the ecological environment in rare earth mining areas in southern Jiangxi. To deal with the situation, we propose adding Net Primary Productivity (NPP) to the traditional RSEI model. NPP, as the indicator of the interaction between the physiological characteristics of vegetation and the external environment, can intuitively reflect the production capacity of surface vegetation under the impact of the external environment. Moreover, being an important part of the earth surface carbon cycle, NPP can be applied to judge the health status of terrestrial ecosystems and study carbon source/sink processes, and as the main parameter reflecting the destruction and pollution of the ecological environment to some extent [17]. In addition, the traditional RSEI is obtained by using PCA transformation, which is not ideal for processing the nonlinear relations between indicators. Considering in particular that there is a weak linear and nonlinear relationship between NPP obtained by multi-source data calculation and other indicators based on Landsat data [18], we found that the RSEI value directly obtained by PCA may have a large error. Thus, this paper tries to use nonlinear Kernel Principal Component Analysis (KPCA) transformation to calculate RSEI to make up for the PCA linear transformation defect.
Therefore, to more accurately evaluate the ecological environment quality of rare earth mining areas, this study uses Landsat satellite data as the main data source and bases on the traditional remote sensing ecological environment quality index to extract relevant indicators. Then, we combine them with meteorological and land classification data to obtain NPP. After processing the required data, we adopted KPCA to construct an improved remote sensing ecological index K-RSEINPP fitting with our research area, the rare earth ore concentration area in southern Ganzhou City, Jiangxi Province, and carried out a quantitative assessment of the ecological environment quality and comparative analysis as well. The research results are significantly practical as they provide technical support and a data basis for sustainable development planning, ecological environment restoration, and management of rare earth mining areas in the study area.
2. Materials
2.1. Study Area
In this study, the rare earth mining concentration area in southern Ganzhou City, Jiangxi Province, China, was selected as the study area (Figure 1). This area involves the Longnan, Dingnan, and Quannan Counties of Ganzhou City, commonly known as the “Sannan Area”, one of the chief production areas of rare earth and nonferrous metals located in the center of the Wuyi-Nanling metallogenic belt. The complex natural and geographical conditions, heavy rainfall, soft surface soil, and frequent mine development activities formerly had a very serious impact on the local ecological environment.
2.2. Data and Preprocessing
2.2.1. Satellite Images
Landsat 8 OLI multispectral image: Landsat 8 is a satellite successfully launched by NASA in 2013. It observes the Earth’s surface with a temporal resolution of about 16 days and a spatial resolution of 30 m, collecting visible light, infrared, and thermal infrared data. Thanks to the ample surface information provided, Landsat 8′s data is widely applied in land surveys, environmental monitoring, and other fields. After screening the Landsat 8 OLI data in August 2020 in the study area through the website of the United States Geological Survey (https://earthexplorer.usgs.gov/ (accessed on 25 September 2022)), we ultimately downloaded qualified images with cloud coverage of less than 5%. Specifically, our preprocessing of the image included radiometric calibration, atmospheric correction, orthorectification, and the use of an image QA band to obliterate cloud-containing pixels.
2.2.2. Auxiliary Data
This paper also collected the total precipitation, average temperature, and total radiation data from August 2020 using the China Meteorological Network (https://data.cma.cn/site/index.html (accessed on 25 September 2022)) and adjusted the data resolution through spatial interpolation to 30 m. For land coverage/utilization and mine data extracted from high-resolution images (GF-2, Worldview-1) from September to November 2020 through visual interpretation and field investigation verification methods, the overall interpretation accuracy was higher than 95%.
3. Methods
The workflow of our study is shown in Figure 2. First, after data preprocessing, we extracted NDVI, NPP, WET, NDBSI, and LST as the indicators of RSEI. Then, two different indicator combinations and two calculation methods (PCA, KPCA) were applied to get four kinds of RSEI. Finally, we conducted correlation analysis and comparison.
3.1. Indicators Extraction
3.1.1. Greenness
In previous studies, the Normalized Difference Vegetation Index (NDVI) was the most commonly used vegetation index for measuring vegetation productivity due to its simplicity and stability [19], and it is often used as the greenness index in RSEI:
where , represent near-infrared and red light in multispectral data, respectively.
However, the NDVI has the problem that when vegetation growth reaches a certain development threshold, the index will saturate and become insensitive. That is, in areas with active plant growth, the NDVI can barely distinguish abnormal green plants from “normal” green plants [20]. In addition, the NDVI cannot fully reflect the impact of regional vegetation destruction and climate change; thus, it can hardly give accurate assessments of the ecological environment of mines.
Accordingly, this paper selects NPP as the greenness index of RSEI to tackle the problem. As a key component of the surface carbon cycle, the NPP of vegetation is an important indicator for characterizing the carbon budget, nutrient cycle, and sustainable development of terrestrial ecosystems, so it can be seen as the main parameter in the reflection of ecological contamination and destruction.
In this paper, the CASA (Carnegie-Ames-Stanford approach) model, a light energy utilization model, is used to calculate NPP. This model perceives NPP as an indicator that can reflect the effective conversion of vegetation to photosynthetically active radiation, fully considering environmental conditions and the influence of vegetation self-characteristics on vegetation photosynthesis [21]. Moreover, with highly available and highly generalizable input data (remote sensing, meteorological data) that fit in NPP dynamic estimation at different regional scales, CASA has become one of the mainstream models for NPP estimation. In this model, the net primary productivity of vegetation is determined by two factors: Absorbed Photosynthetically Active Radiation (APAR) and light energy conversion rate (ε), whose formula is:
where is the photosynthetically active radiation absorbed by pixel x in month t (MJ m−2), and is the light energy conversion rate of x in month t (g C MJ−1).
APAR refers to the part of solar radiation energy fixed by plants as plant organic matter through photosynthesis, and its calculation formula is:
where is the proportion of solar radiation (wavelength 0.38~0.71 μm) that can be used by vegetation to the total radiation. Referring to previous results [22], the value is 0.5; is the total solar radiation of pixel x in month t (MJ m−2); is the ratio of vegetation to solar radiation absorption.
The vegetation coverage is significant to the image, and there is a linear relationship between the NDVI and the ratio vegetation index (SR) [23]. The calculation formula is:
where , represent the maximum and minimum values of NDVI of vegetation type i; according to the relevant results [24], , take values 0.95 and 0.001 respectively.
is the ratio vegetation index, and its calculation formula is:
Average the results of Formulas (5) and (6), and the final value is:
the calculation formula of is:
where , represents the stress factor of low temperature and high temperature on light energy use efficiency; represents the water stress factor; is the maximum light energy conversion rate under ideal conditions, and its value has a significant impact on the estimation of NPP. In the previous CASA model, the unified value of was 0.389 g C/MJ. However, due to differences in intrinsic properties and structures, different vegetation types should have different maximum light energy utilization efficiency. Based on previous studies, we take different values of varied by land type and vegetation type [25].
3.1.2. Moisture
The humidity index is usually calculated from the humidity component of the remote sensing image using the Kautlr-Thomas Transformation (i.e., K-T transformation), designed to extract information on the water content in soil and plants, an important indicator for reflecting the degree of surface moisture in the region [26]. Its calculation formula is:
where , , , , , and respectively, represent the band values of blue, green, red, near-infrared, SWIR1, and SWIR2 in multispectral data; a, b, c, d, e, f is the calculation coefficient of the humidity component in the K-T transformation of different types of Landsat data [27], and the corresponding coefficient values of Landsat 8 OLI are 0.1511, 0.1973, 0.3283, 0.3407, −0.7117, −0.4559.
3.1.3. Dryness
Land dryness is often used to judge the quality of surface land and is one of the important criteria for evaluating the quality of the ecological environment [28]. It is generally presented by NDBSI, which is composed of the Index-based Built-up Index (IBI) and Bare Soil Index (SI):
And the calculation formula of SI and IBI, respectively, are:
where , , , , and respectively represent the band values of blue, green, red, near-infrared, and shortwave infrared 1 in the multispectral data.
3.1.4. Heat
LST is widely applied in evaluating the surface thermal environment, so it is set as the thermal index of RSEI. The theoretical basis of using remote sensing data to invert LST is based on the thermal radiation transfer equation composed by Planck’s law (Planck) quantification [29]. Its formula is:
where , , and are the radiation value of the pixel in the thermal infrared band at the sensor, the gain value and bias value of the thermal infrared band, and the gray value of the pixel, where gain and bias can be obtained from the head file of the image; , , and are brightness temperature values at the sensor and calibration parameters; , , and are the central wavelength, reflectivity, and ground emissivity of the thermal infrared band.
3.2. RSEI Calculation
Principal Component Analysis (PCA) can compress the information on multiple bands to fewer converted bands, that is, concentrate the main information on the first few principal components, of which usually the first main component contains the most information. Compared with other environmental assessment methods, PCA can automatically and objectively set index weights according to their contribution to the principal component instead of manual operation; thus, it helps avoid subjectivity and makes the results more reliable.
Normally, the traditional RSEI directly couples four indicators of greenness, moisture, heat, and dryness extracted through PCA, whereas the nonlinear or weak linear relationship existed between several indicators in RSEI and NPP. Therefore, this paper introduces KPCA, which effectively solves the nonlinear separable problem, to calculate RSEI. Our main idea about KPCA, for the matrix X in the input space, is introducing a kernel function, which enables a nonlinear mapping to map all samples in X to a high-dimensional or even infinite-dimensional space (called feature space) to make the space linearly separable. Then, we perform PCA dimensionality reduction in this high-dimensional space [6]. In this paper, KPCA of Gaussian kernel function (also known as radial basis function kernel, RBF kernel) is used to solve the RSEI in the study area, and its formula is:
This section may be divided by subheadings. It should provide a concise and precise description of the experimental results, their interpretation, and the experimental conclusions that can be drawn.
According to the feature contribution rates shown in PCA and KPCA, the first principal component (PC1) is selected to establish RSEI. It is noteworthy that the dimensions of each factor are not uniform, so they need to be normalized before principal component analysis to ensure their values mapping between [0, 1] and converting to be dimensionless:
where represents a certain index value after normalization; is the value of the index in pixel ; is the maximum value of the index; is the minimum value of the index.
The normalized index can then be used to calculate RSEI. To make the value of PC1 positively correlate with the quality of the ecological environment and facilitate subsequent understanding and analysis, the initial RSEI (RSEI0) can be expressed as:
Finally, we need to normalize RSEI0 to settle its value between [0, 1] and obtain RSEI. The closer the RSEI value is to 1, the better the quality of the ecological environment is.
In addition, since the water body in the region will affect the calculation results of RSEI, before the calculation of RSEI, this paper uses the mNDWI index to mask the regional water body:
where and respectively represent the band values of green and shortwave infrared 1 in the multispectral data.
3.3. Combination Scheme and Grading
In the interest of comparing and evaluating the effect of RSEI based on NPP and KPCA proposed in this paper, we selected different index combinations and calculation methods to obtain 4 sets of RSEI, as shown in Table 1.
To quantitatively analyze the four RSEI results and compare their performance effects on the ecological environment quality assessment of rare earth mining areas more intuitively, this paper refers to the commonly used grading method in previous studies [11,18] and adopts the equal interval method to divide the RSEI value into five grades at intervals of 0.2. The grades represent five ecological quality levels as poor, less-poor, medium, less-premium, and premium (Table 2).
3.4. Correlation Analysis
To quantify the linear correlation between the indicators and the applicability of the RSEI results, this paper adopts the Pearson correlation coefficient to analyze the correlation between the indicators. The Pearson correlation coefficient between the two indicators is defined as the product of the quotient of covariance and standard deviation between two variables:
4. Results
4.1. Comparative Analysis of RSEI Indicators and Results
Through the comparison of the principal component contribution rate of the four groups of ecological environment index results (Table 3) and the correlation analysis with the indicators (Table 4), it can be seen that the PC1 contribution rate obtained by the KPCA of the two groups of indicators is higher than 85%. Specifically, it contains most of the feature information, while the PC1 contribution rate of the PCA method is 70% on average, of which the PC1 contribution rate of RSEIORI is only 67.84%. It is apparent that the KPCA method not only obtains the ecological environment index with more information but can also reflect the ecological environment quality of the study area more objectively compared with PCA. In terms of the correlation coefficient, among the four indicators commonly used in the traditional RSEI, the correlation between NDVI and NDBSI is the highest, of which the absolute value reaches 0.856, although the correlation between LST and other indicators is the lowest. The absolute value of the correlation coefficients between the four indicators are all greater than 0.5; the NPP calculated by CASA has a low correlation with the four indicators of the traditional RSEI, among which the highest is NDVI, with a correlation coefficient of 0.707, while the absolute values of the correlation coefficient with the other three items are all less than 0.6. The absolute value of the correlation coefficient with LST is only −0.469, and it can be clearly seen that the correlation between these indicators is mainly a weak correlation. According to the correlation between the four RSEI calculation results and the indicators, all correlations between the indicators and the RSEI (K-RSEINPP and K-RSEIORI) results calculated by KPCA are higher than that of the RSEI (RSEINPP and RSEIORI) results obtained by PCA. The absolute value of the correlation coefficient in KPCA is higher, 0.065, than in PCA on average, where the average absolute value of the correlation coefficient of K-RSEINPP is 0.757, while the average absolute value of the correlation coefficient of RSEIORI is only 0.645, which is 0.112 lower than that of K-RSEINPP; in general, K-RSEINPP has done better at integrating the characteristics of the four indicators.
4.2. Ecological Environment Quality Analysis
The area ratios of each ecological level of the four RSEI results are shown in Table 5. At the same time, combined with the field research data, we select two RSEI results of rare earth mining areas A and B (Figure 3) in our study area to conduct a graphic comparison. From the results, it can be observed that most of the rare earth mines in mining area A have stopped exploiting and are in the process of land leveling. The mining area is located on the edge of the city, so the terrain of area A is relatively flat; whereas the rare earth mining surface of mining area B is scattered in various mountainous areas, some of which have been abandoned and have not been treated.
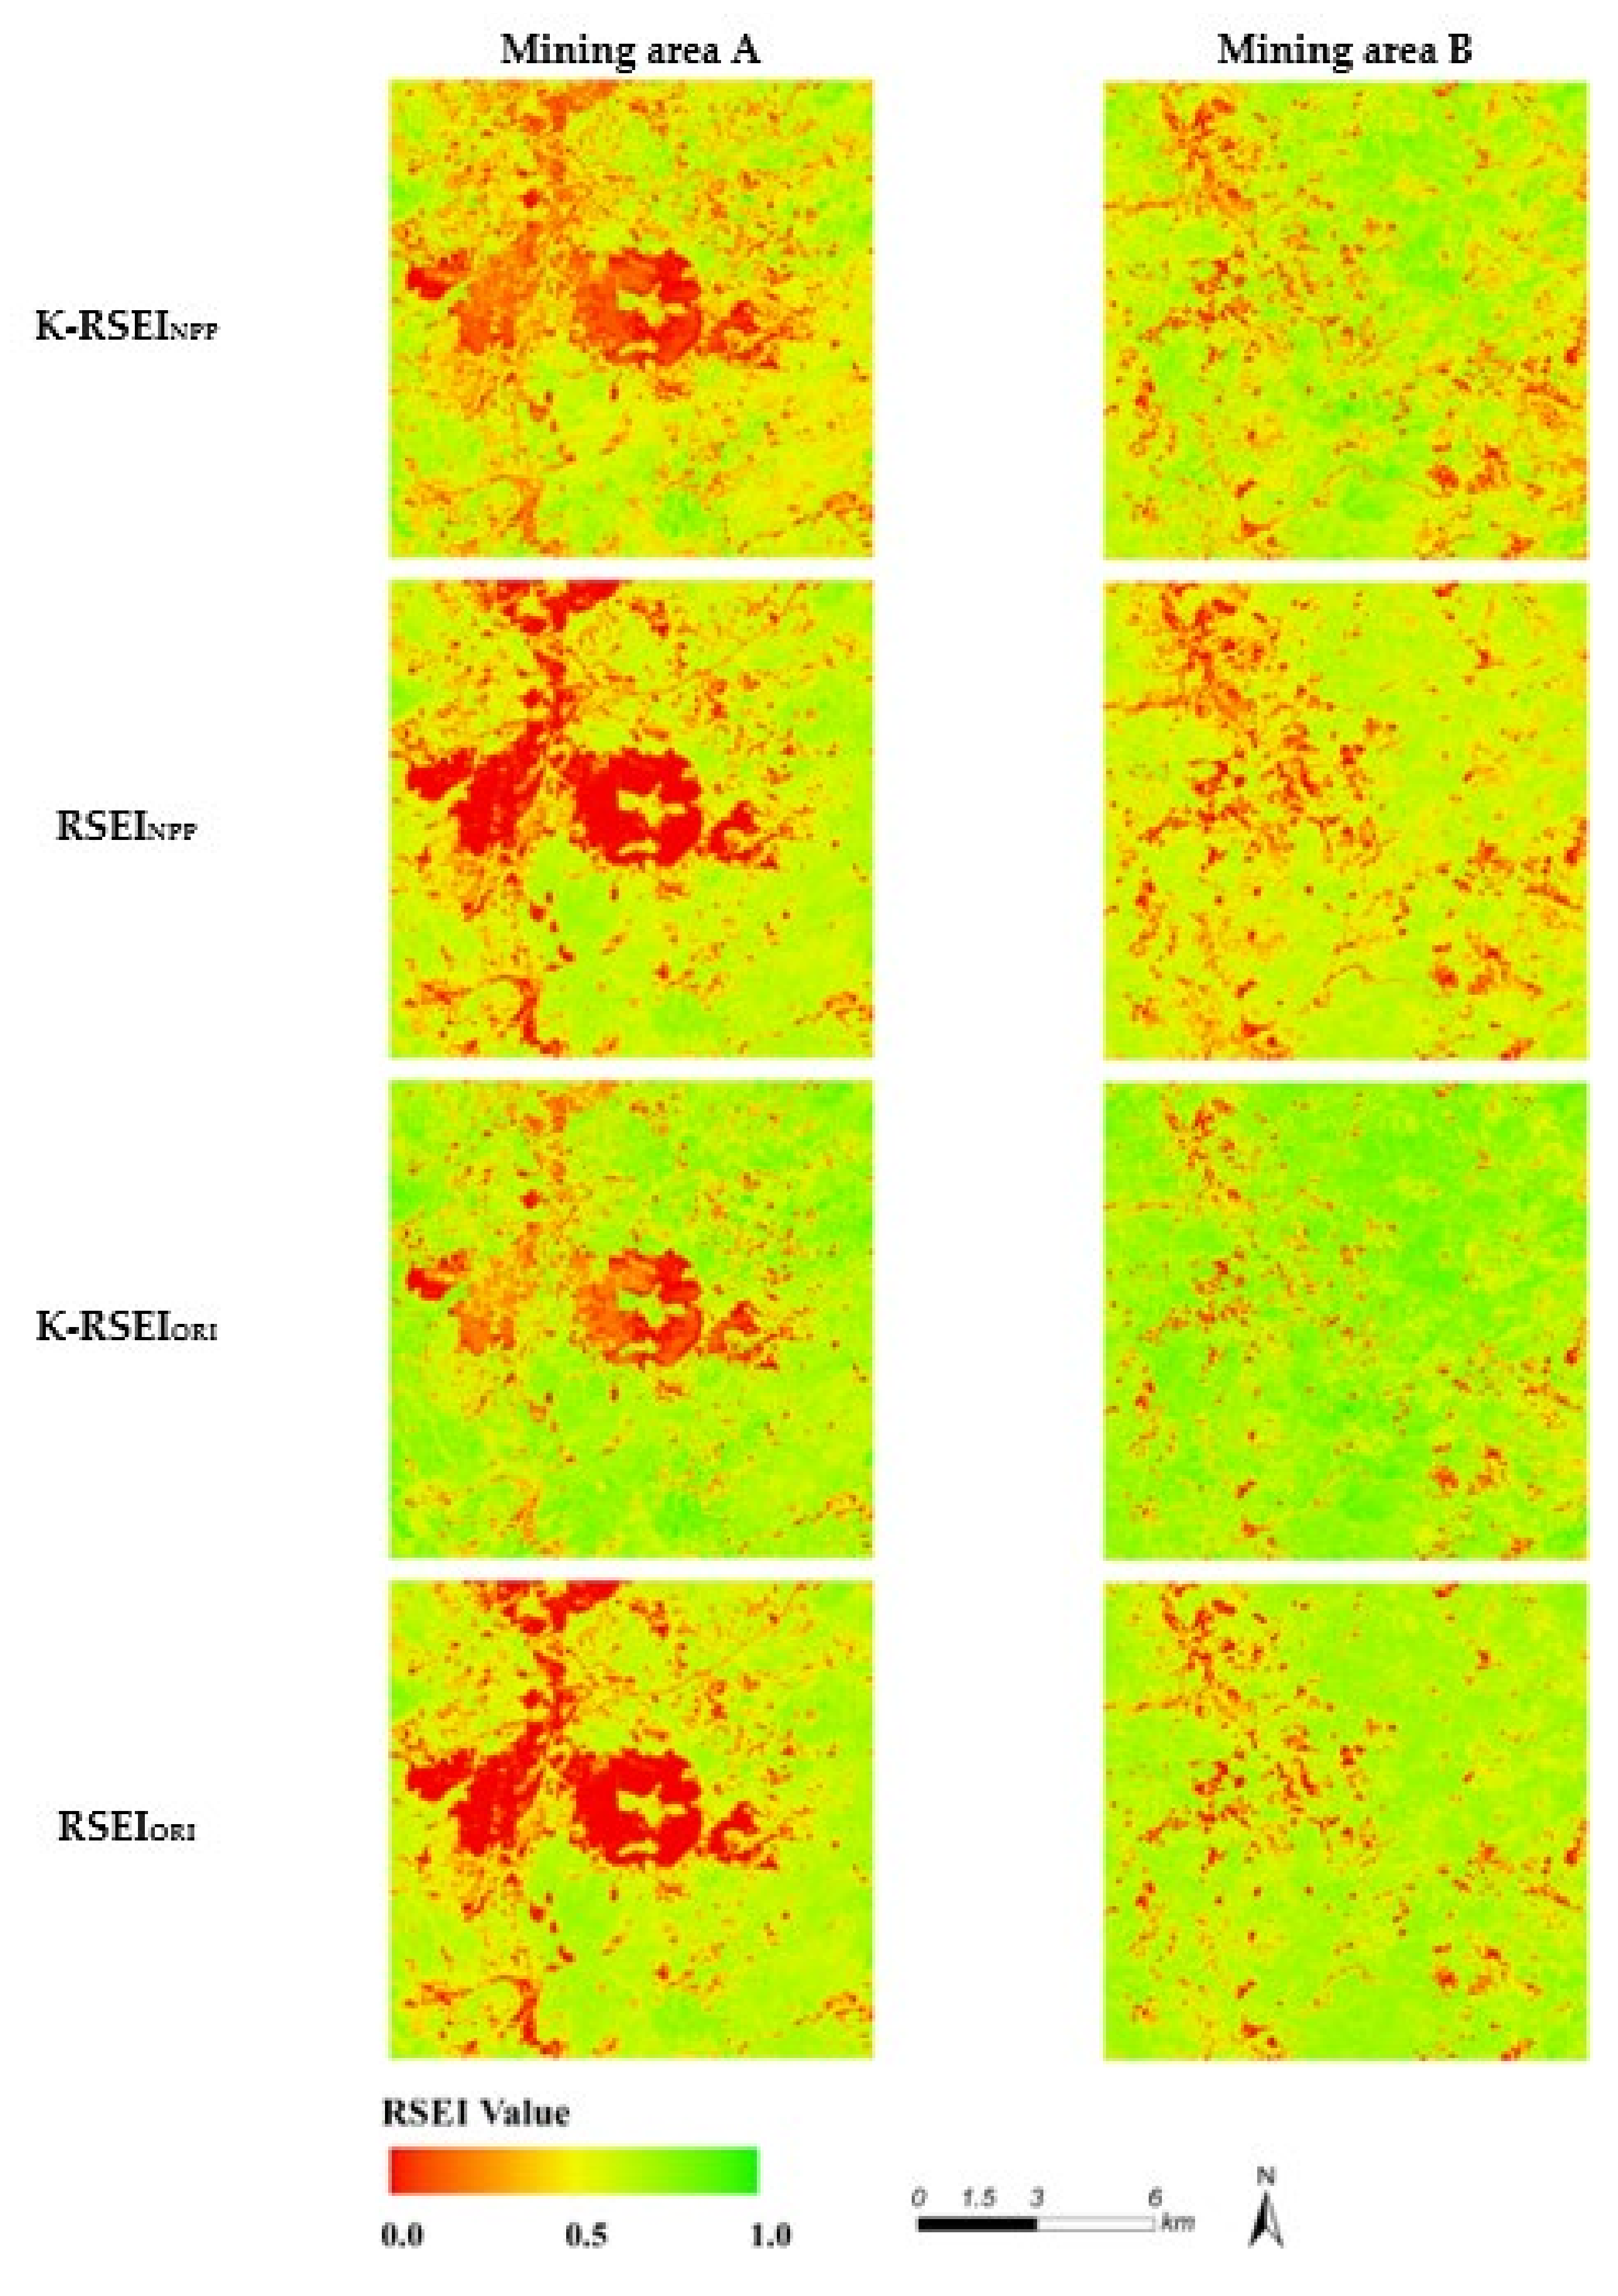
Table 5 and Figure 4 show four types of RSEI results showing the area ratio of each RSEI grade. Specifically, K-RSEINPP has the least RSEI poor area among the four results, mainly including the rare earth area under mining along with some soil and water loss areas. The less-poor areas are mainly in the mining and surrounding areas, some urban areas, and some sparse vegetation coverage areas. On the other hand, the medium and less-premium areas account for the main part of the K-RSEINPP results, including some cities, cultivated land, and most of the vegetation coverage areas. The premium areas are mainly located in mountainous areas unaffected by human activities and have well-developed vegetation. Compared with K-RSEINPP, K-RSEIORI gives an ambiguous differentiation between grades for abandoned mining areas and their surrounding areas and grades for different vegetation coverage areas, so a higher proportion of medium and less-premium area ratios occur in the K-RSEIORI result. Generally, RSEINPP has an area proportion of each grade quite similar to K-RSEIORI but a different distribution area. Besides, its grade division of urban and mining land is unclear. Among RSEIORI’s graded area ratios, medium and less-premium areas have relatively low proportions. The poor areas are located in mining land, cities, roads under development, etc., while most vegetation coverage areas are classified as premium grades.
In further analysis, comparing the result graphs shows that K-RSEINPP is effectively responsive to the RSEI values in rare earth mining areas under different development states and its surrounding areas, other human activity areas, or areas covered by different vegetation, and even can reflect the RSEI of land types only covered small areas. Moreover, referring to different land types, K-RSEIORI, compared to RSEI, can display slight differences. Still, it should be noted that the RSEI expression is not obvious in areas covered by different vegetation. RSEINPP and RSEIORI are not sensitive enough to the ecological quality performance of small-area land types because different grades are reflected in the result map in the form of large blocks. Among all the data, RSEIORI especially performs poorly on distinguishing the ecological quality of different vegetation coverage areas, mine land, and urban land.
5. Discussion
In the previous studies, the traditional RSEI is usually adopted in large-scale urban and regional ecological environment quality assessment research due to its representation and ease of calculation [27,30]. However, for small-scale land types, such as mines and areas with dense vegetation growth, its ecological environment quality assessment capability is only passable [31,32]. In addition, unlike other human development activities, the impact of rare earth mining on surface vegetation is difficult to reflect accurately solely through NDVI [33]. Therefore, this paper introduces the NPP index and KPCA algorithms to make up for the shortcomings of the traditional RSEI regarding the ecological quality evaluation of rare earth mining areas.
The comparison and analysis of results obtained by using different index combinations and methods in this paper show the four RSEIs basically have the same monitoring effects on contiguous building areas and high vegetation coverage areas. However, the traditional RSEI (RSEIORI) hardly reflects the actual ecological conditions in our study area because it has relatively low sensitivity to the ecological quality of the small areas inside the mining regions and different vegetation coverage areas. Its results were all shown as continuous large areas, which may ignore the ecological status of those two area types mentioned above. To deal with this problem, we introduce NPP, which as the greenness index of RSEI can finely characterize regional vegetation destruction and climate change, and use KPCA to recalculate.
Specifically, the two results using NPP as the greenness index (K-RSEINPP and RSEINPP) show better performance in areas with different vegetation coverage and mining regions. Compared with NDVI, NPP can not only reflect the growth status of vegetation in different regions more accurately, but it can also better characterize land quality and more objectively represent the ecological status of land types with different purposes. In terms of calculation methods, the results obtained by the KPCA method (K-RSEINPP and K-RSEIORI) are more accurate in reflecting the ecological quality of small areas and transition zones. Compared with PCA, KPCA accounts for the weak linearity and nonlinearity between indicators while calculating RSEI. It also gave better results that integrate the characteristics of each index and reveal the details of the ecological environment quality more clearly, such as the micro-ground features and the transition zones between different land types, which can more precisely extract the ecological environment quality indicators in the rare earth mining area. Besides, comparing remote sensing images and field survey results shows that the ecological quality reflected by K-RSEINPP conforms with the actual situation to a high degree.
In general, differing from the traditional RSEI, the K-RSEINPP proposed in this paper had a more detailed and accurate representation of the ecological environment of the rare earth mining area in the study area.
It is noteworthy that although the introduction of NPP and KPCA has improved the accuracy and objectivity in evaluating the ecological quality of rare earth mining areas, compared with NDVI, the calculation process of NPP is relatively complicated, and more data needs to be collected. Additionally, the KPCA algorithm requires more calculations than PCA, which is why it is unsuitable for RSEI calculations for larger areas (such as cities, ecological regions, etc.). Therefore, we need further research to optimize the calculation steps and the accuracy of NPP and improve the efficiency of the KPCA algorithm so that K-RSEINPP can be more accurately and quickly applied to the evaluation of ecological environment quality in larger areas.
6. Conclusions
Based on Landsat 8 OLI and meteorological data, etc., this study calculates the indicators NPP, NDVI, LST, NDBSI, and WET in the study area and obtains four groups of RSEIs through KPCA and PCA. After the evaluation and comparison of the four different ecological environment quality results, we conclude as below:
- PC1 obtained from K-RSEINPP proposed in this paper accounts for 88.51% of the results, the highest among the four RSEIs. Meanwhile, the average correlation coefficient between the results and each index reaches 0.757, which indicates that this method can better integrate the characteristics of the four indicators;
- Surpassing PCA, KPCA can obtain results that better represent the ecological environment quality of small-area ground objects and transition zones of different land types. On top of that, compared with NDVI, NPP also reflects the vegetation status in a more detailed manner. The results of K-RSEINPP more meticulously display the ecological environment quality of mining areas, cities in different development stages, and areas with different vegetation coverage and are basically consistent with the actual verification results;
- K-RSEINPP proposed in this paper reflects the ecological environment of rare earth mining areas more accurately than the traditional RSEI and has more detailed information on the ecological environment quality of small areas. It indicates that this method can be effectively applied to the ecological environment quality evaluation of rare earth mining areas in the study area; at the same time, it can also provide an effective reference and research basis for ecological environment monitoring and the evaluation of mining areas in other regions;
- Admittedly, this study has its shortcomings. Specifically, the relatively complicated NPP calculation requires a lot of data, the KPCA algorithm a large amount of calculation, and low efficiency can limit the performance of K-RSEINPP in ecological environment evaluations of large-scale regions, all of which should be addressed in future research.
Author Contributions
Conceptualization, W.Y. and Y.Z.; methodology, Y.Z.; validation, W.Y.; formal analysis, Y.Z.; investigation, C.L.; writing—original draft preparation, Y.Z.; writing—review and editing, W.Y.; visualization, Y.Z.; supervision, W.Y.; project administration, W.Y. and Y.Z.; funding acquisition, W.Y. All authors have read and agreed to the published version of the manuscript.
Funding
This research was funded by the “Organization and implementation of the National Natural Resources Survey” project of the Command Center of Natural Resources Comprehensive Survey, China Geological Survey (grant no. ZD20220101). The APC was funded by the organizational implementation fee project for natural resources comprehensive survey of the Command Center of Natural Resources Comprehensive Survey, China Geological Survey.
Data Availability Statement
No new data were created or analyzed in this study. Data sharing is not applicable to this article.
Conflicts of Interest
The authors declare no conflict of interest.
References
- Xie, L.; Wu, W.; Huang, X.; Ou, P.; Lin, Z.; Zhiling, W.; Song, Y.; Lang, T.; Huangfu, W.; Zhang, Y.; et al. Mining and Restoration Monitoring of Rare Earth Element (REE) Exploitation by New Remote Sensing Indicators in Southern Jiangxi, China. Remote Sens. 2020, 12, 3558. [Google Scholar] [CrossRef]
- Yang, X.; Liu, Z.; Hu, F.; Lin, Y.; Zhang, J.; Lu, C.; Shen, C. Soil Rare Earth Element and Nitride Pollution on Plant Growth and Physiology(Review). Zhongguo Xitu Xuebao/J. Chin. Rare Earth Soc. 2019, 37, 1–11. [Google Scholar]
- Luo, X.; Zhang, Y.; Zhou, H.; He, K.; Luo, C.; Liu, Z.; Tang, X. Review on the Development and Utilization of Ionic Rare Earth Ore. Minerals 2022, 12, 554. [Google Scholar] [CrossRef]
- Xu, F.; Li, H.; Wang, X. Progress in Environmental Problems and Cost Assessment of Ion-adsorption Rare Earth Mining. Chin. Rare Earths 2020, 41, 119–127. [Google Scholar]
- LI Wenchang, L.J.X.G. Critical minerals in China: Current status, research focus and resource strategic analysis. Earth Sci. Front. 2022, 29, 1. [Google Scholar]
- Li, Y.; Li, H.; Xu, F. Comparison of Remote Sensing Monitoring Methods for Land Desertification in Ion-adsorption Rare Earth Mining Areas. Chin. Rare Earths 2021, 42, 9–20. [Google Scholar]
- Wang, X.; Gong, W.; Huang, X.; Liu, T.; Zhou, Y.; Li, H. Assessment of Eco-environmental Quality on Land Use and Land Cover Changes Using Remote Sensing and GIS: A Case Study of Miyun County. Nat. Environ. Pollut. Technol. 2018, 17, 739–746. [Google Scholar]
- Ie, A.D.; Jones, M.; OMahony, T.; Byrne, G. Selecting environmental indicator for use in strategic environmental assessment. Environ. Impact Assess. Rev. 2007, 27, 161–175. [Google Scholar]
- Sullivan, C.; Skeffington, M.S.; Gormally, M.; Finn, J. The ecological status of grasslands on lowland farmlands in western Ireland and implications for grassland classification and nature value assessment. Biol. Conserv. 2010, 143, 1529–1539. [Google Scholar] [CrossRef]
- Li, H.; Li, D.; Li, Y. A multi-index assessment method for evaluating coverage effectiveness of remote sensing satellite. Chin. J. Aeronaut. 2018, 31, 2023–2033. [Google Scholar] [CrossRef]
- Xu, H.Q.V.C. A remote sensing urban ecological index and its application(Article). Shengtai Xuebao/Acta Ecol. Sin. 2013, 33, 7853–7862. [Google Scholar]
- Xu, H.; Wang, Y.; Guan, H.; Shi, T.; Hu, X. Detecting Ecological Changes with a Remote Sensing Based Ecological Index (RSEI) Produced Time Series and Change Vector Analysis. Remote Sens. 2019, 11, 2345. [Google Scholar] [CrossRef]
- Geng, J.; Yu, K.; Xie, Z.; Zhao, G.; Ai, J.; Yang, L.; Yang, H.; Liu, J. Analysis of Spatiotemporal Variation and Drivers of Ecological Quality in Fuzhou Based on RSEI. Remote Sens. 2022, 14, 4900. [Google Scholar] [CrossRef]
- Xiong, Y.; Xu, W.; Lu, N.; Huang, S.; Wu, C.; Wang, L.; Dai, F.; Kou, W. Assessment of spatial–temporal changes of ecological environment quality based on RSEI and GEE: A case study in Erhai Lake Basin, Yunnan province, China. Ecol. Indic. 2021, 125, 107518. [Google Scholar] [CrossRef]
- Ning, L.; Jiayao, W.; Fen, Q. The improvement of ecological environment index model RSEI. Arab. J. Geosci. 2020, 13, 403. [Google Scholar] [CrossRef]
- Hengkai, L.; Feng, X.; Qin, L. Remote sensing monitoring of land damage and restoration in rare earth mining areas in 6 counties in southern Jiangxi based on multisource sequential images. J. Environ. Manag. 2020, 267, 110653. [Google Scholar] [CrossRef]
- Ghorbani, A.; Dadjou, F.; Moameri, M.; Biswas, A. Estimating Aboveground Net Primary Production (ANPP) Using Landsat 8-Based Indices: A Case Study From Hir-Neur Rangelands, Iran. Rangel. Ecol. Manag. 2020, 73, 649–657. [Google Scholar] [CrossRef]
- Ying, L.; Chaoya, D.; Hui, Y.; Lv, C.; Jiaxin, Q.; Rong, Z. Comparison between modified remote sensing ecological index and RSEI. Natl. Remote Sens. Bull. 2022, 26, 683–697. [Google Scholar]
- Liu, C.; Liu, J.; Zhang, Q.; Ci, H.; Gulakhmadov, X.G.A.A. Attribution of NDVI Dynamics over the Globe from 1982 to 2015. Remote Sens. 2022, 14, 2706. [Google Scholar] [CrossRef]
- Gan, L.; Cao, X.; Chen, X.; Dong, Q.; Cui, X.; Chen, J. Comparison of MODIS-based vegetation indices and methods for winter wheat green-up date detection in Huanghuai region of China. Agric. For. Meteorol. 2020, 288–289, 108019. [Google Scholar] [CrossRef]
- Jinguo, Y.; Zheng, N.; Chenli, W. Vegetation NPP distribution based on MODIS data; CASA model―A case study of northern Hebei Province. Chin. Geogr. Sci. 2006, 16, 334–341. [Google Scholar]
- Yu, D.Y.D.; Shi, P.S.P.; Shao, H.S.H.; Zhu, W.Z.W.; Pan, Y.P.Y.H. Modelling net primary productivity of terrestrial ecosystems in East Asia based on an improved CASA ecosystem model. Int. J. Remote Sens. 2009, 30, 4851–4866. [Google Scholar] [CrossRef]
- Zhu, W.; Pan, Y.; Hu, H.; Li, J.; Gong, P. Estimating net primary productivity of terrestrial vegetation based on remote sensing: A case study in Inner Mongolia, China. In Proceedings of the IGARSS 2004 IEEE International Geoscience and Remote Sensing Symposium, Anchorage, AK, USA, 20–24 September 2004. [Google Scholar]
- Zhu, W.Z.W.; Pan, Y.P.Y.; He, H.H.H.; Yu, D.Y.D.; Hu, H.H.H. Simulation of maximum light use efficiency for some typical vegetation types in China. Chin. Sci. Bull. 2006, 51, 457–463. [Google Scholar] [CrossRef]
- Wenquan, Z.; Yaozhong, P.; Jinshui, Z. Estimation of Net Primary Productivity of Chinese Terrestrial Vegetation Based on Remote Sensing. J. Plant Ecol. 2007, 31, 413–424. [Google Scholar] [CrossRef]
- Li-ping, Y.; Cheng-lei, H.; Mei-ling, Z.; Yu-xing, B.; Zhi-qiang, S. Study on Soil Moisture Content Inversion in an Arid Area Based on Landsat-8 Imagery. Chin. J. Soil Sci. 2021, 52, 47–54. [Google Scholar]
- Wen, X.L.; Ming, Y.L.; Gao, Y.G.; Hu, X.Y. Dynamic Monitoring and Analysis of Ecological Quality of Pingtan Comprehensive Experimental Zone, a New Type of Sea Island City, Based on RSEI. Sustainability 2020, 12, 21. [Google Scholar] [CrossRef]
- Hang, X.; Luo, X.; Cao, Y.; Li, Y. Ecological quality assessment and the impact of urbanization based on RSEI model for Nanjing, Jiangsu Province, China. J. Appl. Ecol. 2020, 31, 219–229. [Google Scholar]
- Aemail, M.U.; Sup, A. Analyses of land surface temperature (LST) variability among local climate zones (LCZs) comparing Landsat-8 and ENVI-met model data. Sustain. Cities Soc. 2021, 69, 102877. [Google Scholar]
- Zhang, Y.; She, J.; Long, X.; Zhang, M. Spatio-temporal evolution and driving factors of eco-environmental quality based on RSEI in Chang-Zhu-Tan metropolitan circle, central China. Ecol. Indic. 2022, 144, 109436. [Google Scholar] [CrossRef]
- Nie, X.; Hu, Z.; Zhu, Q.; Ruan, M. Research on Temporal and Spatial Resolution and the Driving Forces of Ecological Environment Quality in Coal Mining Areas Considering Topographic Correction. Remote Sens. 2021, 31, 2815. [Google Scholar] [CrossRef]
- Li, J.; Liang, J.; Wu, Y.; Yin, S.; Yang, Z.; Hu, Z. Quantitative evaluation of ecological cumulative effect in mining area using a pixel-based time series model of ecosystem service value. Ecol. Indic. 2021, 120, 106873. [Google Scholar] [CrossRef]
- Xu, F.; Li, H.; Li, Y. Ecological environment quality evaluation and evolution analysis of a rare earth mining area under different disturbance conditions. Environ. Geochem. Health 2021, 43, 2243–2256. [Google Scholar] [CrossRef]
Figure 1.
Location of the study area and the two main rare earth mining areas in the study area (shown in a true color image from Landsat 8).
Figure 1.
Location of the study area and the two main rare earth mining areas in the study area (shown in a true color image from Landsat 8).
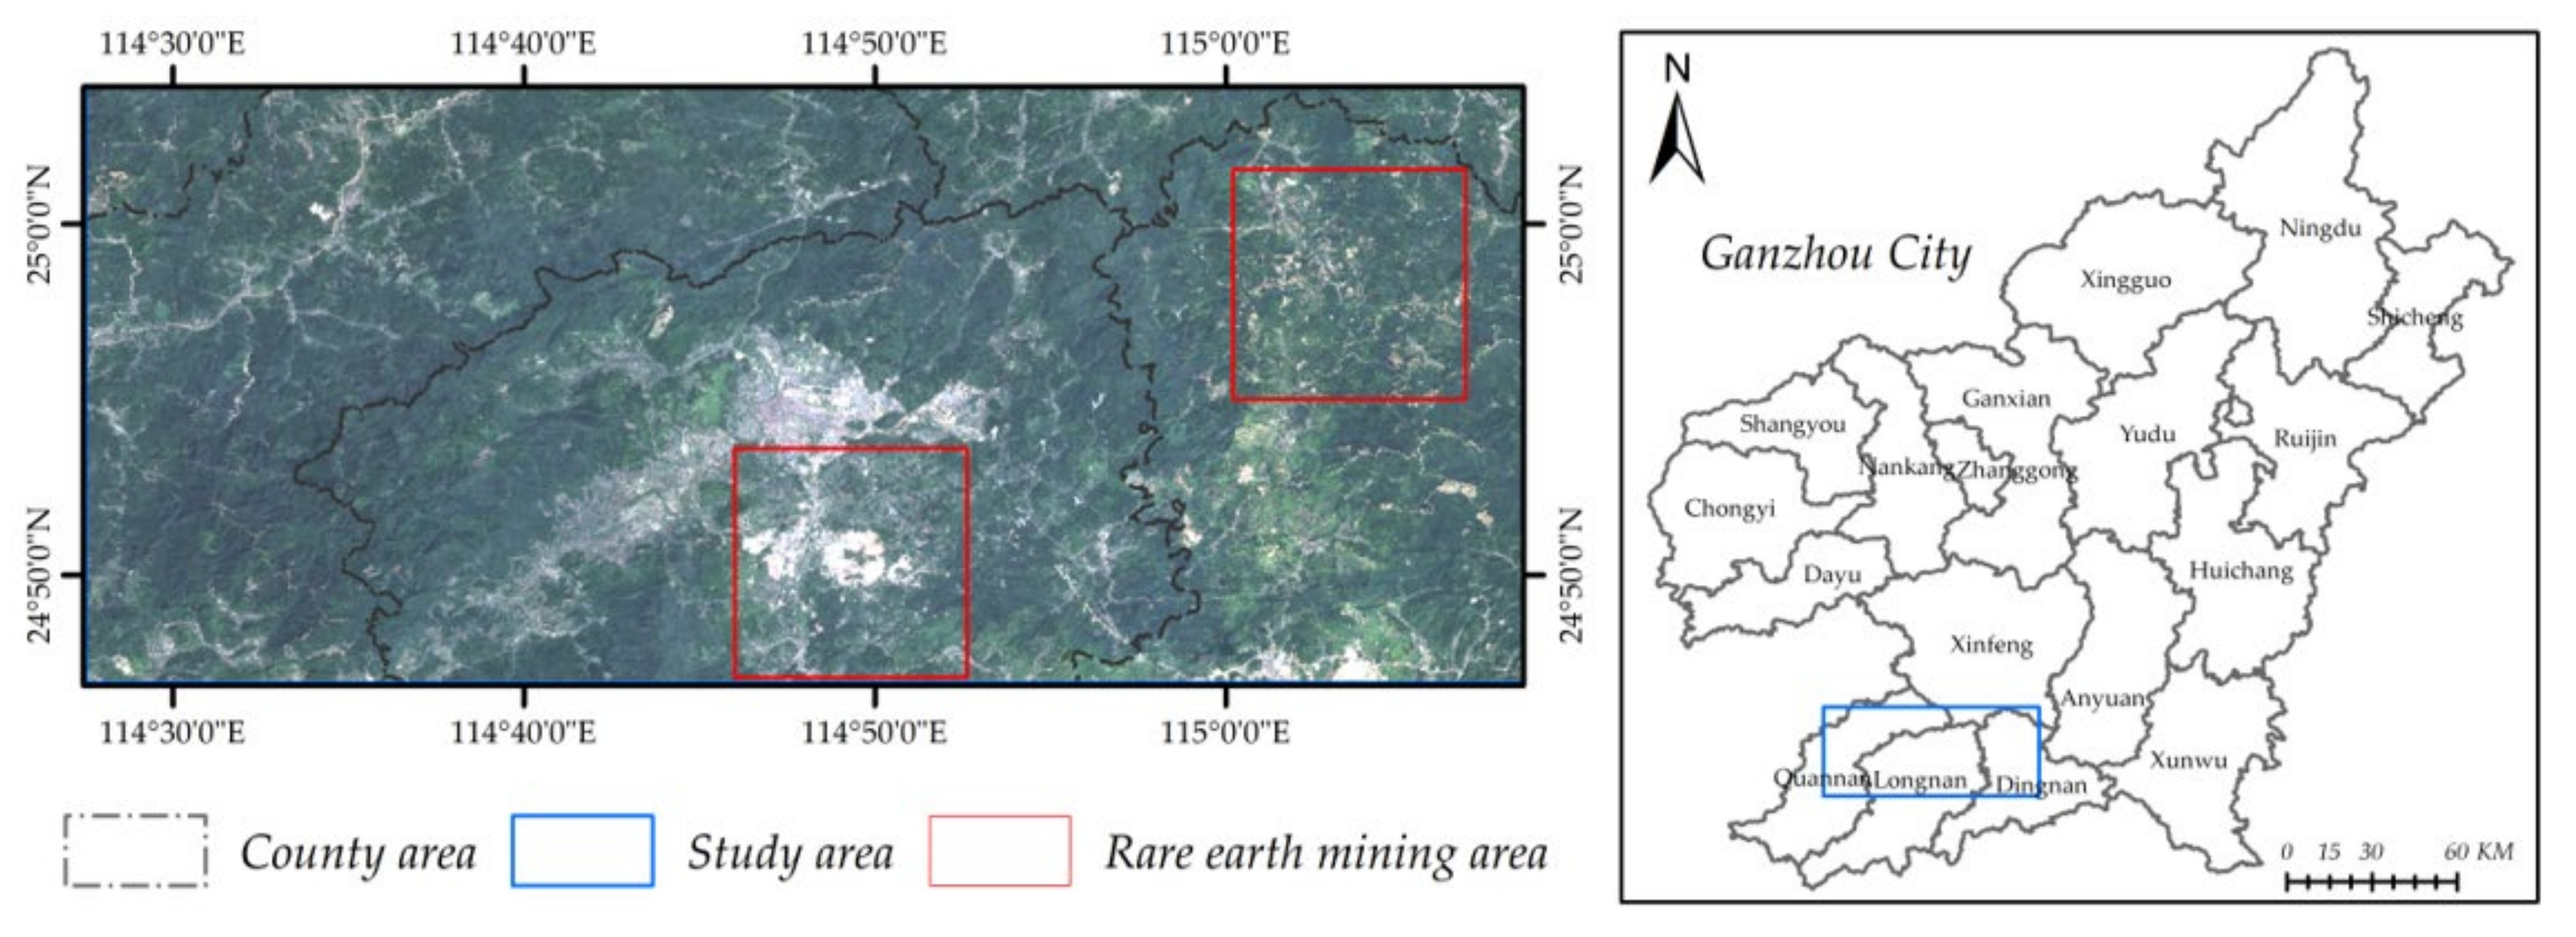
Figure 2.
The workflow of this study.

Figure 3.
Locations of 2 rare earth mining areas for visual verification: (A) Middle rare earth mining area; (B) Eastern rare earth mining area.
Figure 3.
Locations of 2 rare earth mining areas for visual verification: (A) Middle rare earth mining area; (B) Eastern rare earth mining area.
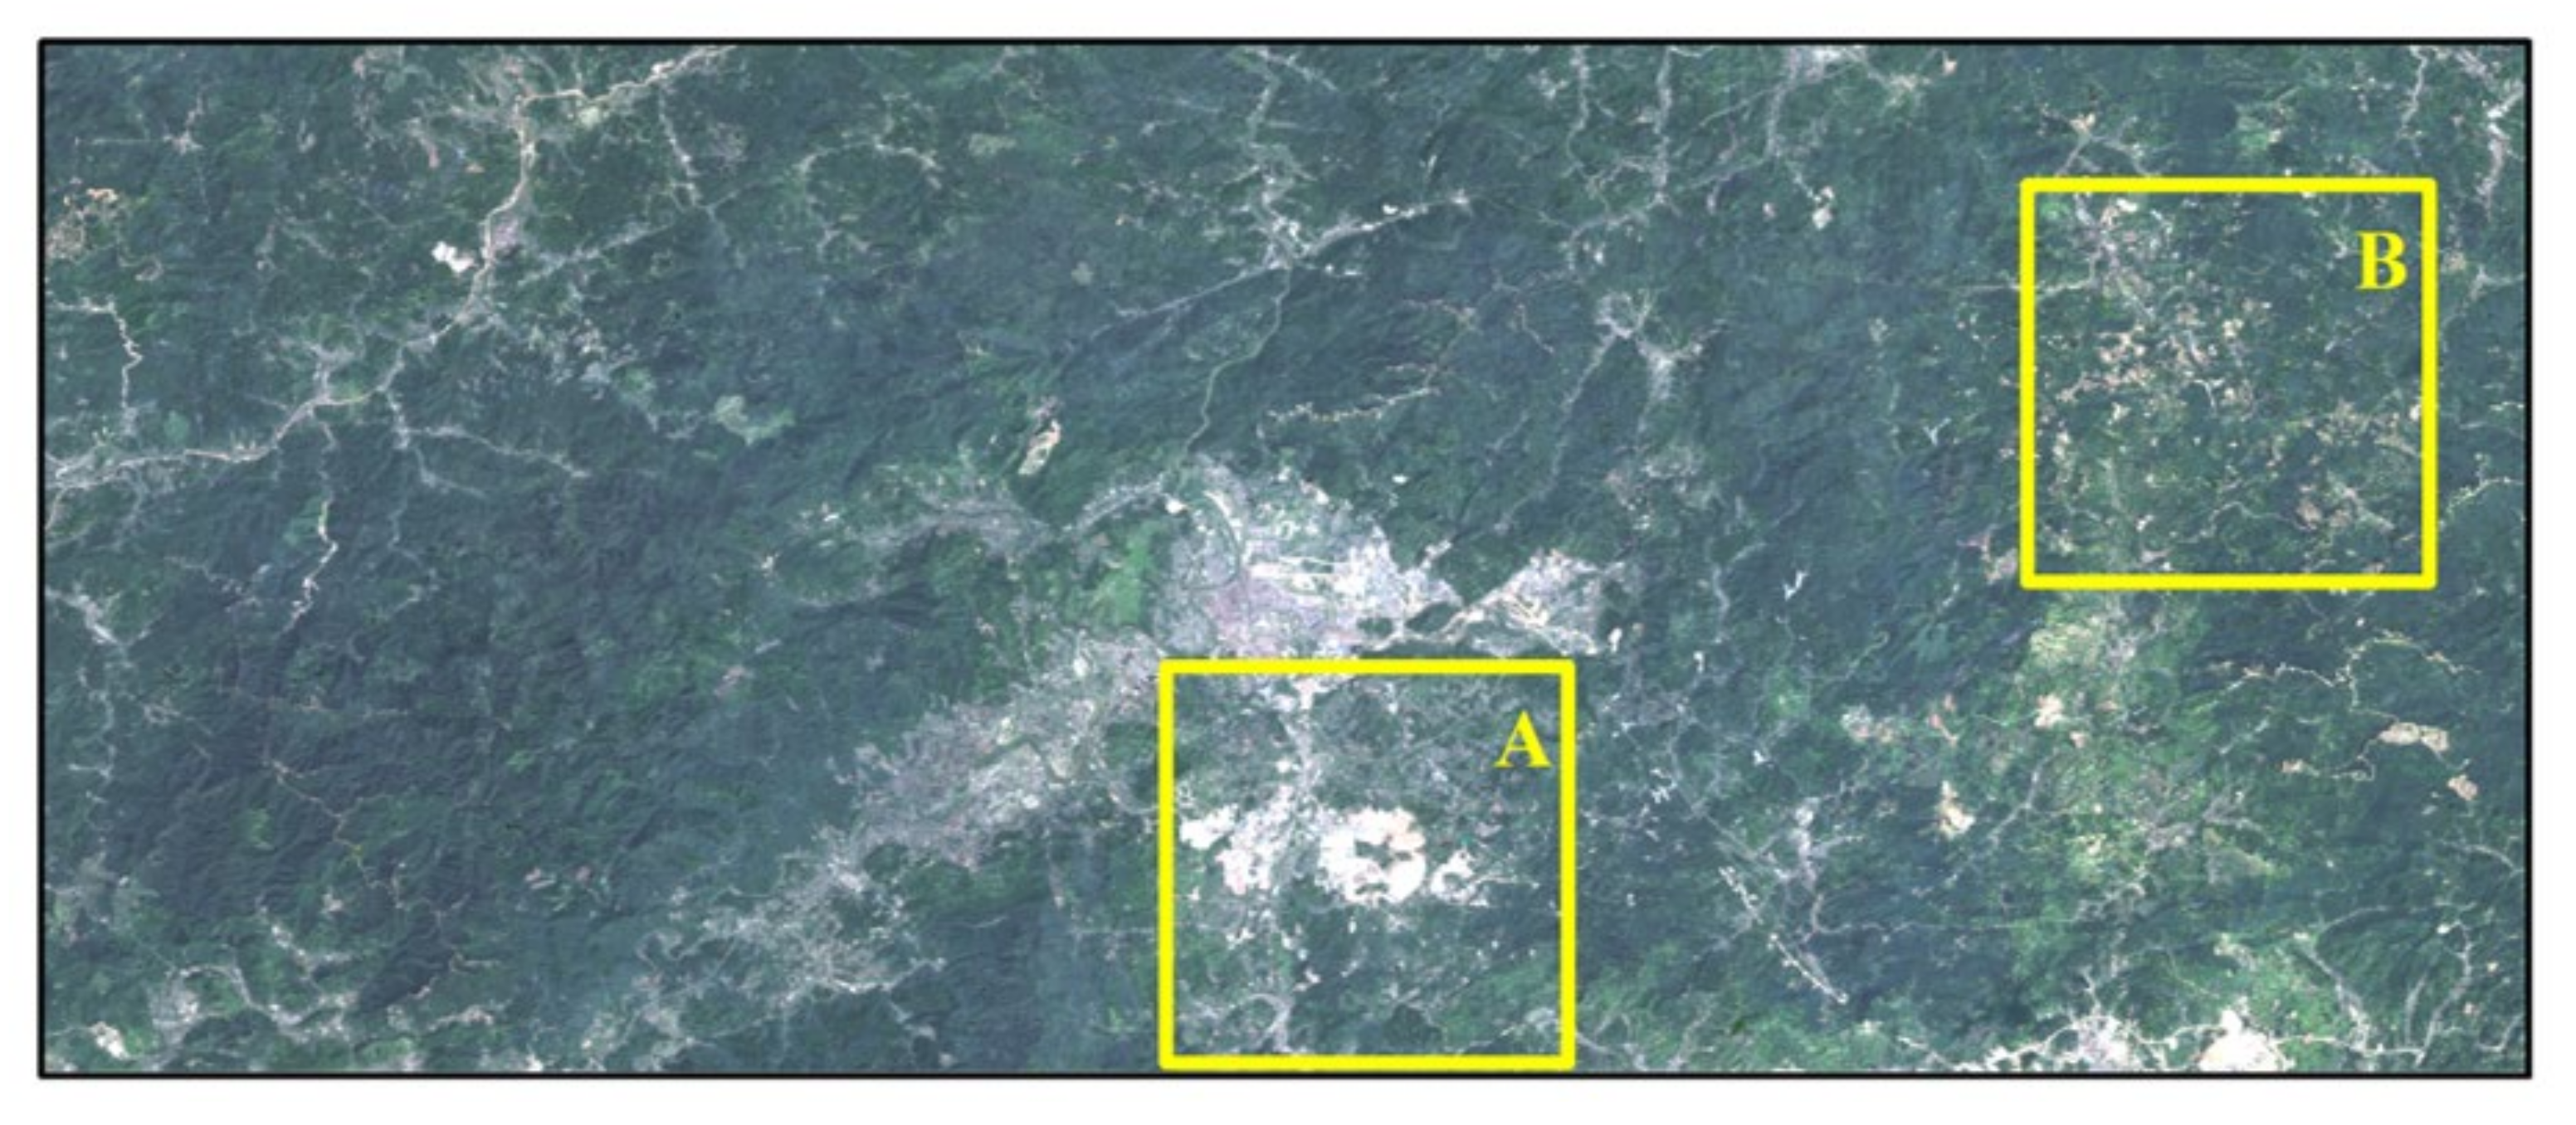
Figure 4.
RSEI result of 2 mining areas.

Table 1.
RSEI combination scheme.
| Scheme | Name | Selected Index | Calculation |
|---|---|---|---|
| 1 | K-RSEINPP | NPP, LST, WET, NDBSI | KPCA |
| 2 | RSEINPP | NPP, LST, WET, NDBSI | PCA |
| 3 | K-RSEIORI | NDVI, LST, WET, NDBSI | KPCA |
| 4 | RSEIORI | NDVI, LST, WET, NDBSI | PCA |
Table 2.
RSEI grade division.
| NO. | 1 | 2 | 3 | 4 | 5 |
|---|---|---|---|---|---|
| Value range of RSEI | [0–0.2) | [0.2–0.4) | [0.4–0.6) | [0.6–0.8) | [0.8–1.0) |
| Ecological quality level | Poor | Less-poor | Medium | less-premium | premium |
Table 3.
Principal component contribution statistics of RSEI.
| Results | Contribution | |||
|---|---|---|---|---|
| PC1 | PC2 | PC3 | PC4 | |
| K-RSEINPP | 88.51% | 6.54% | 3.12% | 1.82% |
| RSEINPP | 72.32% | 18.83% | 6.06% | 2.79% |
| K-RSEIORI | 85.66% | 7.24% | 4.89% | 2.20% |
| RSEIORI | 67.84% | 16.28% | 6.77% | 9.11% |
Table 4.
Statistics of the correlation coefficient between indicators and RSEI.
| Index * | NPP | NDVI | WET | NDBSI | LST |
|---|---|---|---|---|---|
| NPP | 1 | 0.707 | 0.543 | −0.562 | −0.469 |
| NDVI | 1 | 0.698 | −0.856 | −0.603 | |
| WET | 1 | −0.725 | −0.584 | ||
| NDBSI | 1 | 0.616 | |||
| LST | 1 | ||||
| K-RSEINPP | 0.872 | — | 0.768 | −0.702 | −0.687 |
| RSEINPP | 0.839 | — | 0.647 | −0.688 | −0.502 |
| K-RSEIORI | — | 0.853 | 0.702 | −0.726 | −0.623 |
| RSEIORI | — | 0.723 | 0.674 | −0.667 | −0.514 |
* The data of each group have passed the 2-tailed test of significance (p < 0.05).
Table 5.
RSEI grade area statistics.
| Results | Area Ratio of Each RSEI Grade (%) | ||||
|---|---|---|---|---|---|
| Poor [0–0.2) | Less-Poor [0.2–0.4) | Medium [0.4–0.6) | Less-Premium [0.6–0.8) | Premium [0.8–1.0) | |
| K-RSEINPP | 9.21 | 18.65 | 31.05 | 22.76 | 18.33 |
| RSEINPP | 15.63 | 13.37 | 37.15 | 13.25 | 20.60 |
| K-RSEIORI | 14.21 | 18.95 | 35.23 | 12.56 | 19.05 |
| RSEIORI | 25.28 | 14.37 | 26.23 | 11.85 | 22.27 |
Disclaimer/Publisher’s Note: The statements, opinions and data contained in all publications are solely those of the individual author(s) and contributor(s) and not of MDPI and/or the editor(s). MDPI and/or the editor(s) disclaim responsibility for any injury to people or property resulting from any ideas, methods, instructions or products referred to in the content. |
© 2023 by the authors. Licensee MDPI, Basel, Switzerland. This article is an open access article distributed under the terms and conditions of the Creative Commons Attribution (CC BY) license (https://creativecommons.org/licenses/by/4.0/).
Share and Cite
MDPI and ACS Style
Yang, W.; Zhou, Y.; Li, C. Assessment of Ecological Environment Quality in Rare Earth Mining Areas Based on Improved RSEI. Sustainability 2023, 15, 2964. https://doi.org/10.3390/su15042964
AMA Style
Yang W, Zhou Y, Li C. Assessment of Ecological Environment Quality in Rare Earth Mining Areas Based on Improved RSEI. Sustainability. 2023; 15(4):2964. https://doi.org/10.3390/su15042964
Chicago/Turabian StyleYang, Weilong, Yi Zhou, and Chaozhu Li. 2023. "Assessment of Ecological Environment Quality in Rare Earth Mining Areas Based on Improved RSEI" Sustainability 15, no. 4: 2964. https://doi.org/10.3390/su15042964
Note that from the first issue of 2016, this journal uses article numbers instead of page numbers. See further details here.