Article

How to Measure Sustainability? An Open-Data Approach

1
Institute of Automotive Technology, Department of Mobility Systems Engineering, School of Engineering and Design, Technical University of Munich, Boltzmannstr. 15, 85748 Garching bei München, Germany
2
Institute of Sustainable Mobile Drivetrains, Department of Mobility Systems Engineering, School of Engineering and Design, Technical University of Munich, Schragenhofstr. 31, 80992 München, Germany
3
Data Analytics and IoT, E.ON Digital Technology GmbH, Georg-Brauchle Ring 52-54, 80992 München, Germany
*
Author to whom correspondence should be addressed.
These authors contributed equally to this work.
Sustainability 2023, 15(4), 3203; https://doi.org/10.3390/su15043203
Submission received: 20 December 2022 / Revised: 20 January 2023 / Accepted: 1 February 2023 / Published: 9 February 2023

Abstract

:
Determining quantitative sustainable development metrics can be difficult and requires a high effort in manual data acquisition on an institutional level, like the Word Bank or the United Nations, without adequately reflecting reality. To overcome the lack of a transparent and scalable method, which links local actions to global sustainability metrics, the Sustainability Mirror connects the Sustainable Development Goals (SDGs) with publicly and locally available data to proxy SDG metrics. By applying the approach to Germany, we calculated eight SDG metrics on a regional level. Comparing our results to two German cities, we show that the Sustainability Mirror reflects economic and ecological sustainability measures. Furthermore, we demonstrate the mirror’s scalability and spatial resolution by applying the method to each German county. Presenting a proof-of-concept, we show that proxy data can link local and global sustainability metrics. However, further research should include more social sustainability topics. Finally, we are sure our approach and its implementations can contribute to a continuous assessment of spatial and temporal spreads and changes in SDG metrics.

1. Introduction

In 1987, the Brundtland Report defined the three pillars of sustainable development: ecology, economy, and social [1]. Signed by 178 United Nations (UN) members, the 1992 Earth Summit manifested these dimensions as international development goals—later established as 17 Sustainable Development Goals (SDGs) [2,3]. Although the commitment to the SDGs highlights the importance of sustainable development and specifies monitoring at a global scale, their implementation remains complex and difficult. Often, global targets must be implemented at a local level, rendering them difficult to track and assess. Sustainability factors vary locally, and tools to qualify, quantify, and monitor SDG initiatives are essential to identify potentials. However, current frameworks neglect the feedback and co-dependencies of local actions on global goals, for instance, “[cities’] consumption impacts that extend far beyond their borders” [4]. An assessment framework developed by Mascarenhas et al. [5] addresses this issue, aligning local, regional, and national sustainability indicators to a common strategy. In this context, stakeholder engagement and communication play a decisive role in the framework’s successful implementation.
We concluded that there is a trade-off between global sustainability indicators and regional stakeholder interests (Section 2.1). Our approach aims to resolve this trade-off by using open-source and community-based data to derive local sustainability impact comprehensively and engagingly, linking local impact to the existing SDG indicators. The approach’s novelty is its easy scalability combined with a higher spatial resolution than currently found in the literature. Therefore, our approach relies on proxy data, linking publicly available metrics (e.g., OpenStreetMap (OSM)) to overall sustainability.
Reviewing current sustainability assessment methods and indicators (Section 2.2), we derived the approach’s requirements and the subsequent research gap (Section 2.4). Section 3 introduces our framework, the currently used data sources that meet the defined requirements (Section 3.1), and the linked SDG indicators (Section 3.2). Section 4 correlates the indicators with the respective data sources. As a proof of concept, Section 5.1 compares the sustainability metrics of two German cities and compares them with the direct feedback of policy- and decision-makers. Section 5.2 shows the approach’s scalability from a city to a country level. Section 6 discusses the conclusions, the limitations, and future research.

2. State-of-the-Art

In the following, we review perspectives on quantifying sustainability. Based on the literature, we summarize state-of-the-art sustainability assessment approaches and sustainability metrics. From their limitations and shortcomings, we derive our research gap and the respective requirements for our developed method.

2.1. Global and Local Sustainability

According to Wiedmann and Allen [4] and Mascarenhas et al. [5], sustainability should be evaluated on a regional level and not on the framework’s global scale. Howard and Wheeler [6] underlined that local communities “help global targets to be translated into interventions and actions that bring about actual improvements in the lives of citizens.” However, without participatory approaches, the problem of how local communities can be represented on a supra-regional level remains unsolved—in particular regarding the global south [6]. Therefore, Fraser et al. [7] analyzed participatory approaches for SDG indicator identification. They found that engaging local people in the selection process of such indicators empowers and educates the community and, ultimately, improves acceptance. Furthermore, Fraser et al. [7] found that participatory approaches link top-down perspectives, such as the SDGs, to bottom-up indicator selection and data collection. Moallemi et al. [8] supported this conclusion and found that participatory approaches in system dynamic modeling “help in framing what sustainability could mean to local people and in downscaling the high-level SDG agenda, aligned with internal resources and capacities and guided by local needs and priorities.”
The trade-off between global and local interests prevents legislators from tackling existing regional lacks as reliable statistics do not exist. From a regional perspective, stakeholders are less incentivized, as their efforts are invisible in national statistics, which also decreases their willingness for further engagement. “Data are the lifeblood of decision-making,” Gonzalez Morales et al. [9] stated, but current solutions still lack the harmonizing impacts of regional initiatives with SDG indicators on a national level. Digitization and the increasing willingness of governments to provide free and open data increases accessibility [10,11], enabling people to trace their impacts on a regional level. The current SDGs partly rely on these data, as well, but usually depict metrics only on the country level. Researchers already approach methods to measure SDG indicators in higher spatial resolution [12], but a general framework that connects acquired and publicly available (big) data with SDG indicators on a regional level still does not exist [4].

2.2. Sustainability Assessment and Indicators

The introductory examples illustrate the abstract and holistic nature of sustainability, which is hard to quantify and implement: different scales, such as regional vs. global, must be considered for each pillar and out of long- and short-term perspectives [8,9,13,14]. As a concept for human development, sustainability assessment ultimately needs to provide guidelines or concrete actions for decision-makers [13]. Therefore, different methods and tools for sustainability assessment emerged with the common goal of translating something abstract into actions [14]. Ness et al. [13] distinguished three categories of sustainability assessment tools: (1) indicators and indices, (2) product-related assessment, and (3) integrated assessment. They argued that there is a lack of specific assessment (i.e., product- or site-related), on the one hand, and widely accessible and transparent tools, on the other. Furthermore, Ness et al. [13] highlighted the relevance of input data, which “is generally the weak link.” While product-related methods such as life-cycle assessment build on datasets agreed upon by experts and, thus, on high-quality input data, these tools are not available to the public [13]. The obtained results are consequently not transparent. Additionally, integrated—often subjective—assessments do not fulfill the requirement for transparency and stakeholder engagement. Sustainability indicators or metrics (i.e., aggregated indicators) typically consist of historical data. Depending on the source and their license, these data can theoretically be completely transparent to any user.
In the following, we present two approaches that quantify sustainability based on indicators, which are currently used to identify potentials for achieving the SDGs. Both approaches rely on public datasets and provide current, as well as historical information on a global scale. Comparing these approaches, we identified the need for a method that combines regional sustainability with the overarching SDG framework.

2.3. Sustainable Development Goals
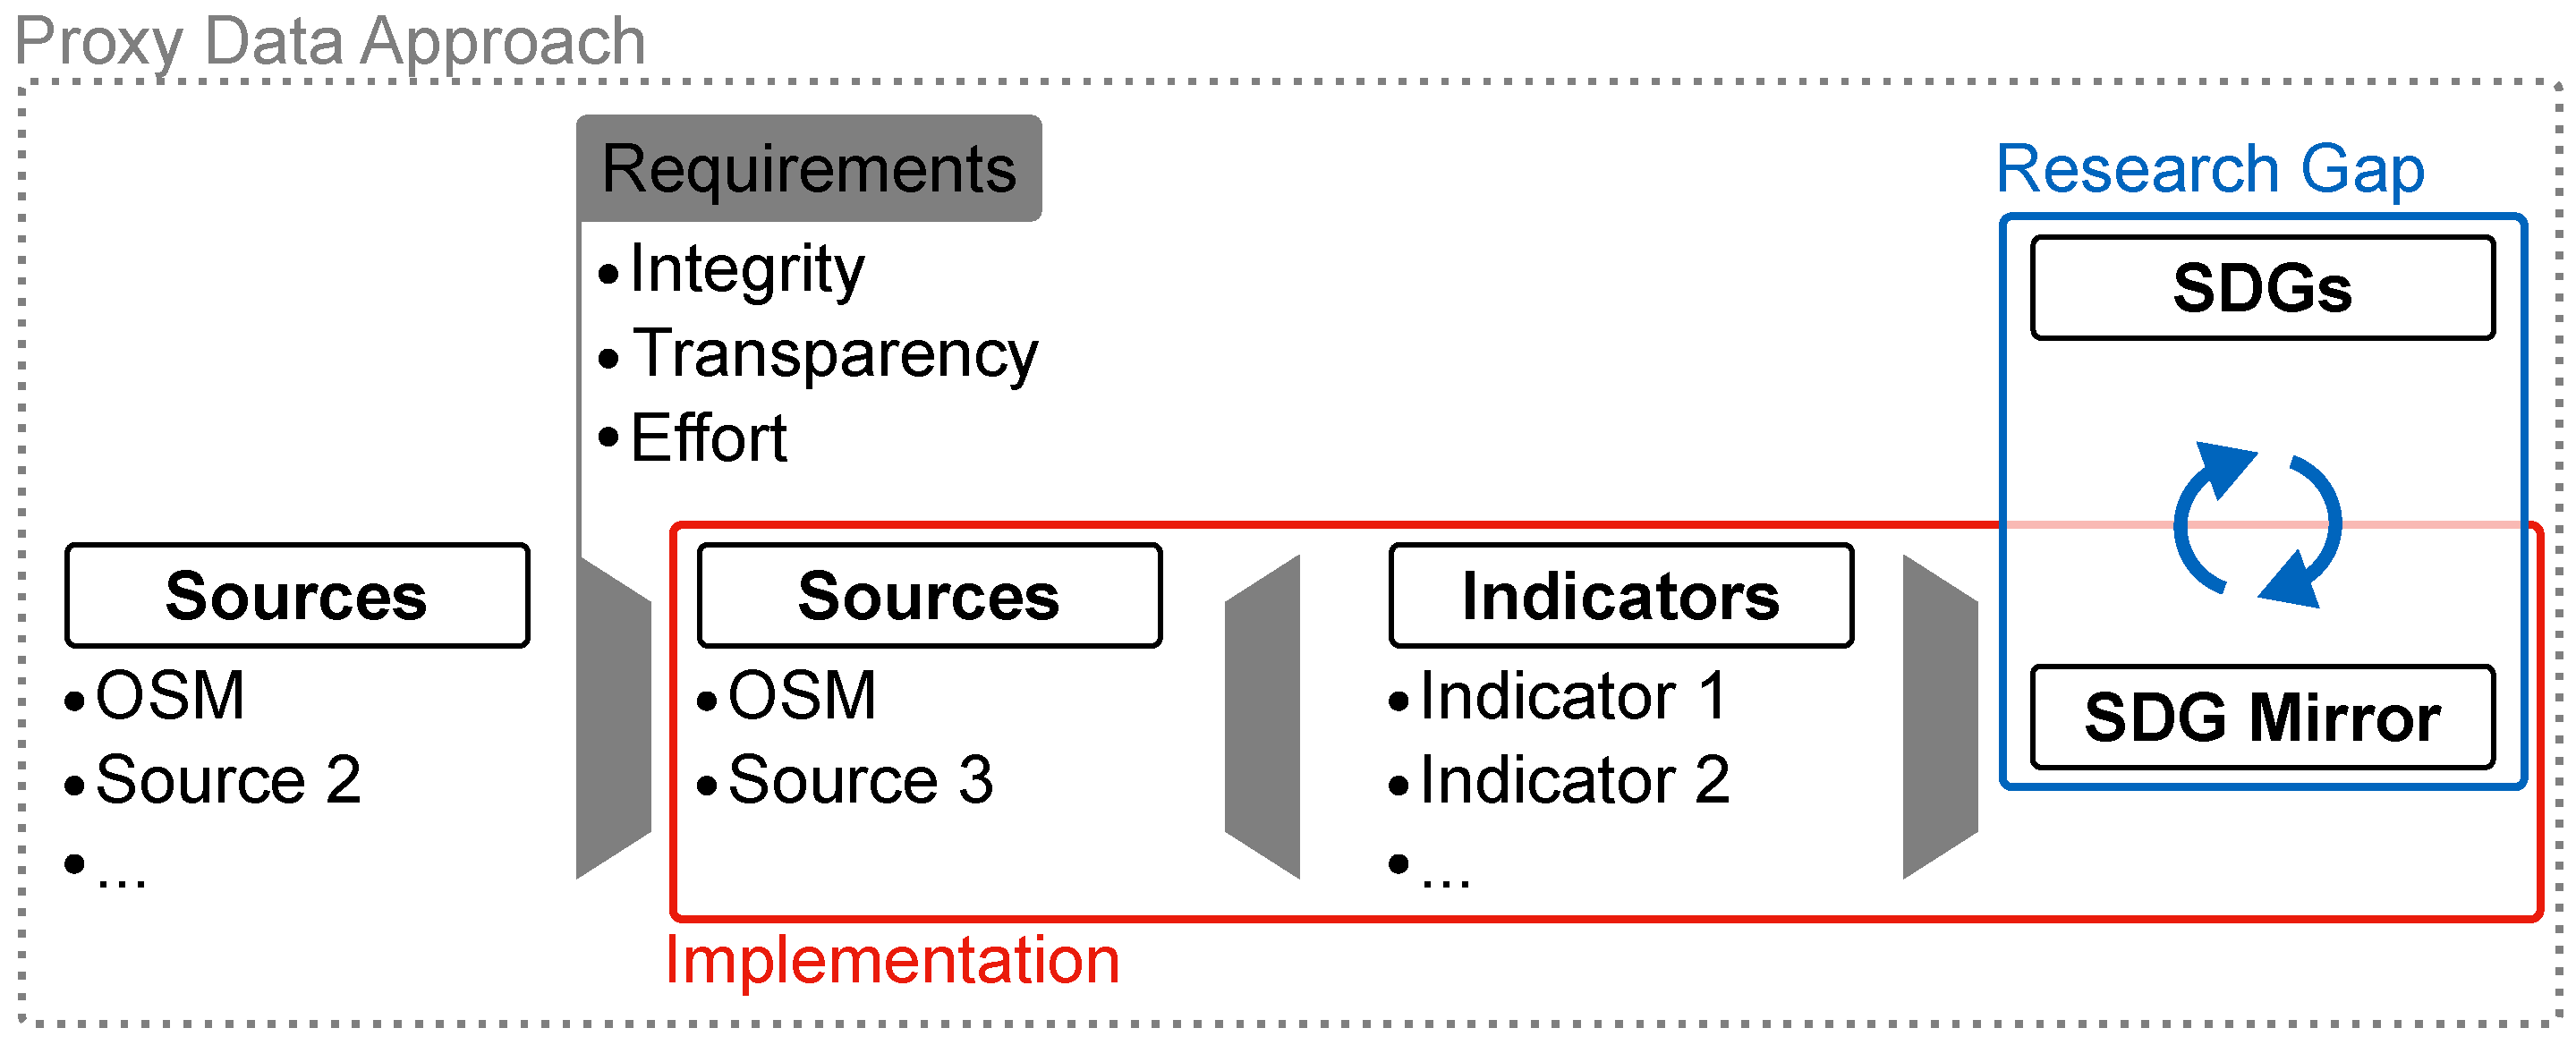
The SDGs consist of 17 main goals [2] covering all three pillars [15] of sustainability. Wackernagel et al. [16] highlighted the relevance of the SDGs due to existing international consensus on them and claimed that transparent monitoring is a crucial factor for the successful implementation of the SDG goals. The UN divides these goals into 169 targets linked to 232 unique indicators. The open-source project SDG-Tracker provides a platform for gathering data for each of these indicators (if available) on a country level [17]. Analyzing the SDG-Tracker’s data sources, we found that only 4 of the 232 SDG indicators provide data for smaller regions than countries. The list of data sources is provided as Supplementary Information. Data often come out of surveys, and data acquisitions are mostly commissioned on a national level. Accordingly, the majority of the data are published by global organizations, such as the UN or the World Bank, as shown in Figure 1.
Recently, the project SDG-Portal has aimed to break down dissolvable spatial data into a regional level based on existing SDG indicator regularities [18]. The Sustainable Development Report [19] aggregates SDG indicators to a single index on the country level.
The examples show that publicly aggregated data can facilitate monitoring worldwide, at least on a national scale. However, data collection requires an effort to capture, collect, filter, and process the data to a single indicator, complicating the tracing of data sources. The Data Revolution Group supports the transparency requirement and, additionally, emphasizes availability and accessibility as key principles for SDG data sources [11], aiming “to close data gaps and to strengthen national statistical capacities”. Acquiring these national data can be complex, time consuming, and expensive, and countries with a low gross domestic product (GDP) collect them much less than countries with a higher GDP [6]. The SDG indicators describe a complex and extensive ruleset (e.g., 2096 pages of SDG indicator metadata in 2021 [20]), which impedes institutions and initiatives in identifying the relevant metric due to the associated high effort.
Although SDG metrics exist, their meaningfulness for regional stakeholders is limited. Spangenberg [21] stated that the SDG framework lacks obligations for states, private industry, and consumers. To derive legitimate obligations, concrete and transparent SDG measures are required [22] and, therefore, a minimum amount of input data. For this, Gusmao Caiado et al. [22] suggested crowd-sourced data. Their proposed closed-loop framework formalizes the process of the “implementation, monitoring and continuous improvement of the 17 goals in a global way.” Their framework highlights the positive effects of the connection between monitoring, implementing, innovating, and education on the SDGs.
While a variety of local and regional initiatives exist, implementing a standard (policy) framework to measure their impact on a European level is lacking [23]. Initiatives can be very successful, but they fail to provide a solution for the vertical (i.e., upwards) integration of their regional impact to SDG indicators. Additionally, Nilsson et al. [24] highlighted that the correlative impact of initiatives for multiple SDGs should be considered. “Policy coherence is one of the [important] targets …[and therefore] policymakers need a rubric for thinking systematically,” Nilsson et al. [24] state. Robert et al. [25] highlight the complexity of matching SDG initiatives to the existing ruleset and define sustainable development more abstractly as “a group of people with a common ideology who try together to achieve certain general goals.”
To the author’s knowledge, no methods exist that assess the regional level to a comparable extent to the SDG-Tracker or the World Benchmarking Alliance (WBA). This impedes transparency and comparability, particularly among different regions, and ultimately bottom-up scalability.

2.4. Research Gap

While some sustainability approaches were successfully implemented on a regional level, they failed to scale their outcomes to a national level or beyond [26]. Although regionality often leads to specific solutions, a framework that catches regional impacts and makes their outcomes and interdependencies visible on a larger scale is needed to provide trust, comparability, and transparency [4,13,23].
Stakeholder engagement is a key component and amplifier for successful sustainable implementations [27,28,29,30]. For example, citizen science projects successfully demonstrated an improvement in sustainability measures due to the direct involvement of the stakeholder or citizens, respectively [31]. However, data infrastructure remains a challenge for projects of this kind [31]. Furthermore, data acquisition can be difficult due to high efforts, insufficient data sources, and local intervention factors such as illness outbreaks (e.g., COVID-19) and country instabilities that prevent local SDG assessments [32].
We concluded that the SDGs are not readily perceivable by and transparent for all stakeholders. Thus, a new method should rely on either community-created or open data and already-existing IT infrastructure. This way, the method can ensure data integrity and transparency with a relatively low data acquisition effort at the same time. We argue that no method links local stakeholder actions to sustainability impact in a scalable approach. Ultimately, the question remains if open data can facilitate sustainable decision-making and evaluations on a regional level.
Our method aims to close the mentioned gaps by aggregating publicly available data to a local sustainability index. As most of the data were acquired for purposes other than SDGs metrics, but still mirror interesting aspects for SDG indicators, we call our concept the Sustainability Mirror. Using open-source or crowd-sourced data sources ensures data transparency and integrity and allows scalability while maintaining a low effort in data handling. The Sustainability Mirror aims to visualize local impacts on a county, city, and municipal level while at the same time linking them to the national SDG indicators. Therefore, the Sustainability Mirror translates SDG indicators to metrics that are observable, perceivable, understandable, and reflect the local initiatives’ impacts. In our opinion, the increased transparency and feedback of this approach to local stakeholders could foster local sustainability engagement.

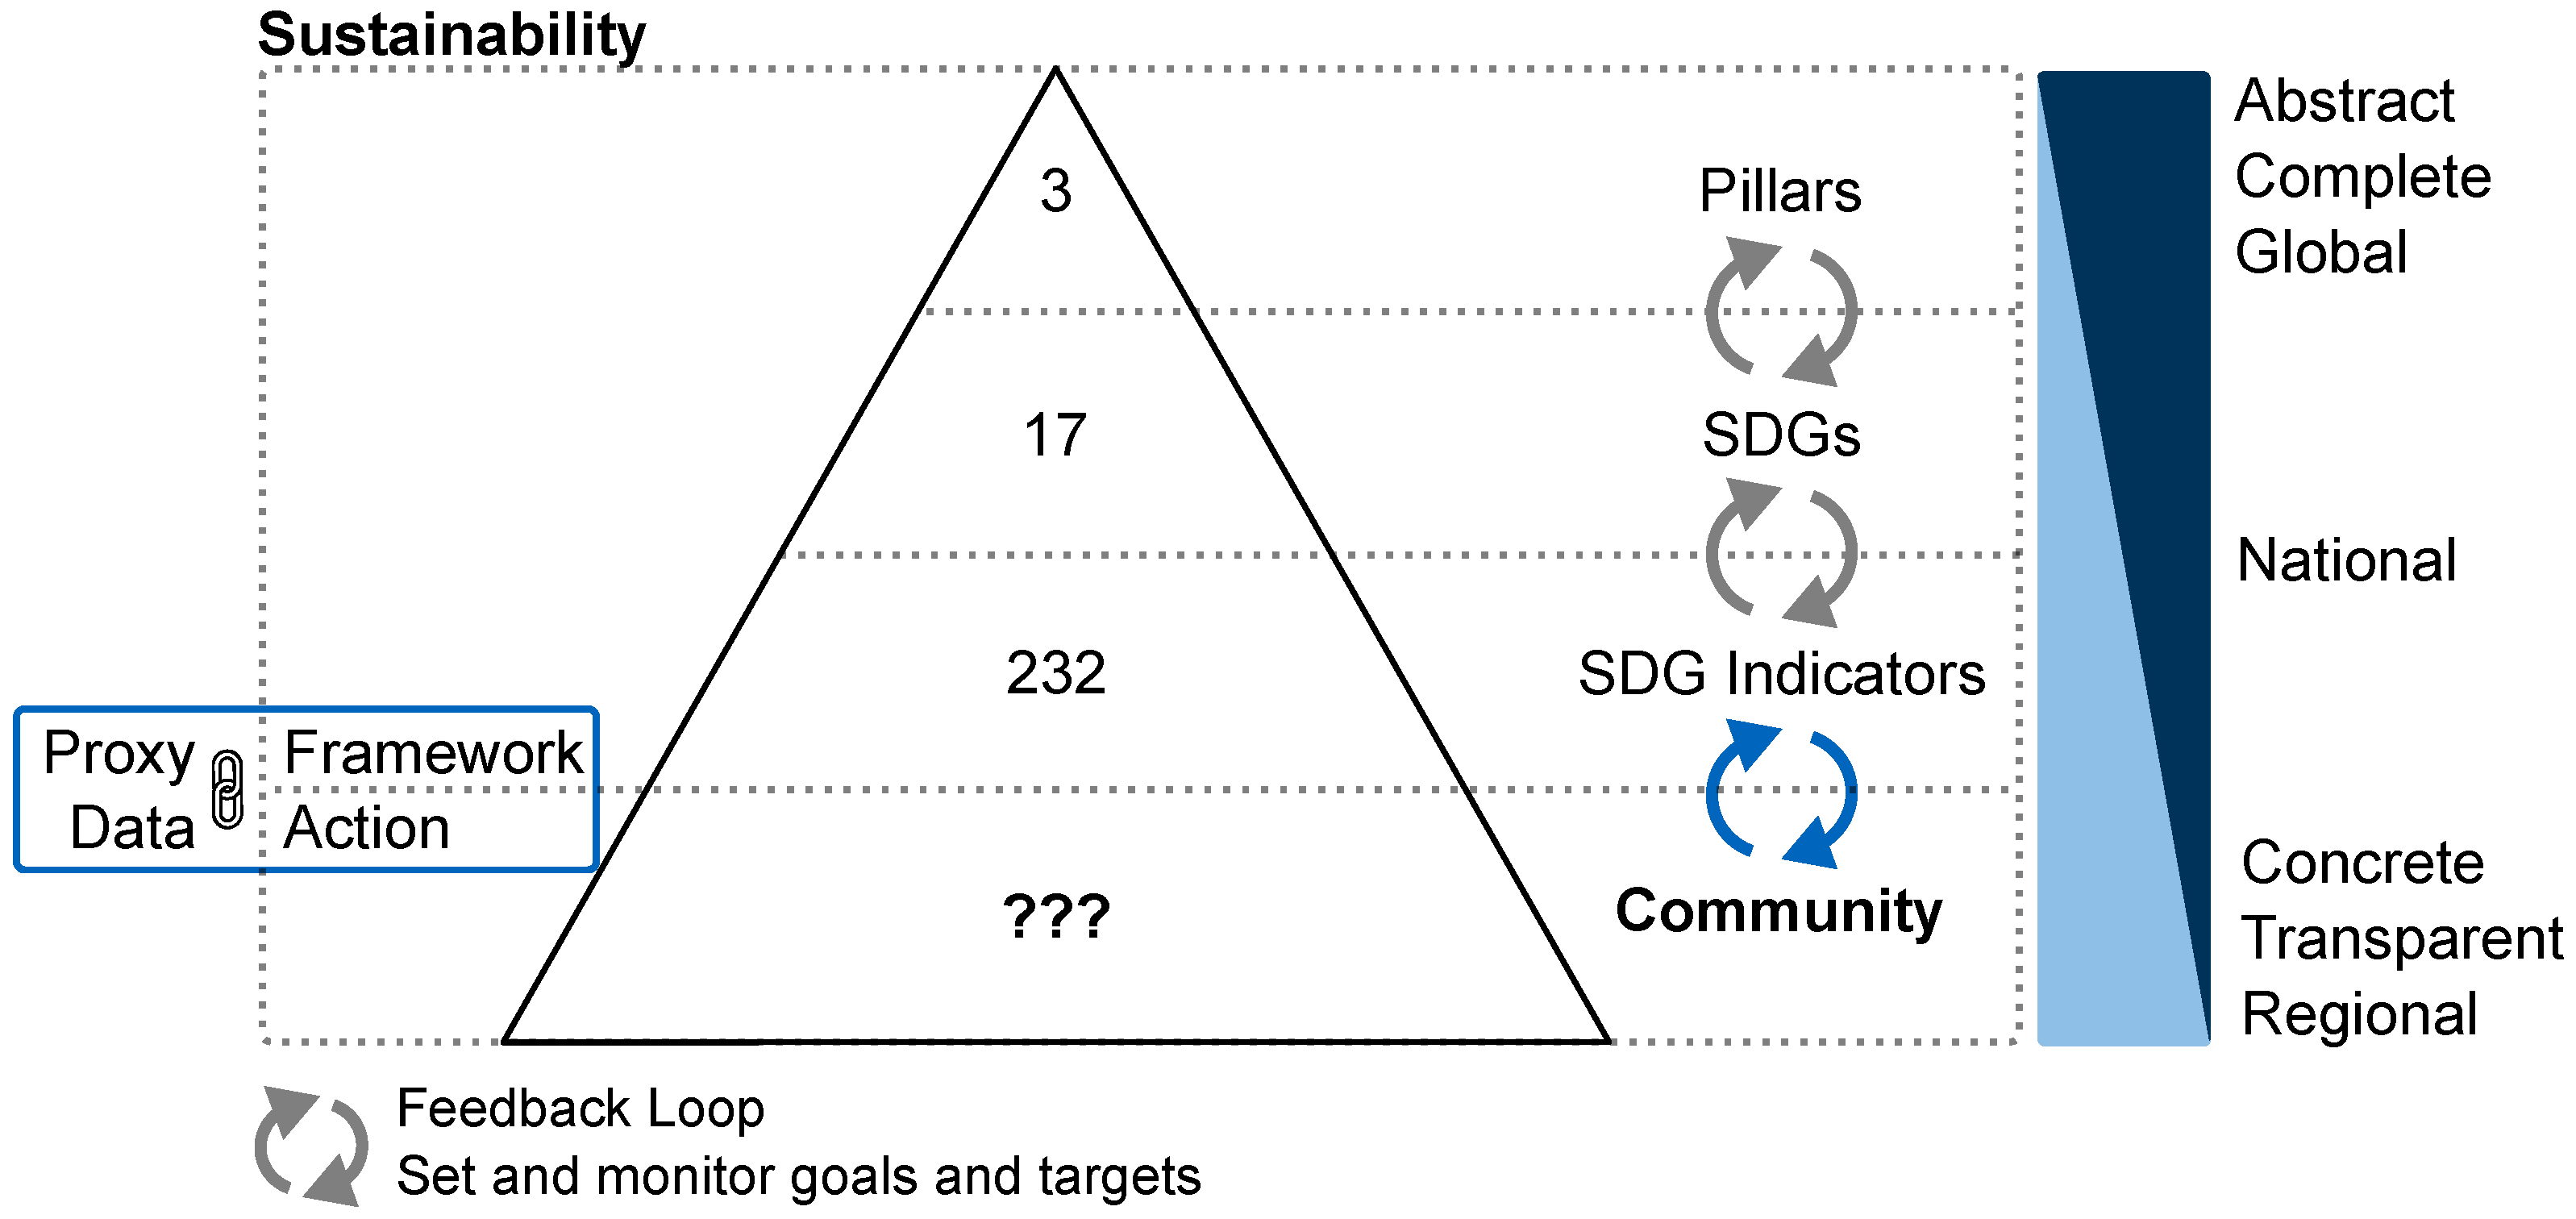
3. The Sustainability Mirror

The Sustainability Mirror concept does not necessarily structure existing SDG compartments, but instead, introduces a proxy to estimate local impacts (e.g., by local initiatives) and connect them with abstract SDG indicators, linking the regional and national levels. Figure 2 illustrates the placement of our concept inside the whole SDG framework.
Based on our literature review (Section 2.3), the framework should be scalable and transparent and require a low effort. Furthermore, community integration is crucial. Ideally, data should be freely accessible and comply with the following requirements:
  • Integrity: Data should be maintainable, traceable, and controllable by the community or trusted suppliers to guarantee integrity.
  • Transparency: Data should be freely available to everyone and reflect local changes. Only under transparent conditions is the local initiative’s impact traceable for everyone.
  • Effort: Data should be collected inside a bigger group of contributors (community) or acquired automatically not to presuppose substantial costs to keep data up to date. Therefore, data acquisition efforts should be low to guarantee a manageable and seamless integration.
The requirements often align with the open data [33] and reusable data [10] principles but are less restrictive in terms of ownership, which theoretically allows commercial data providers. Applying the aforementioned criteria, we identified data sources and derived community metrics that can be linked to SDG indicator metrics and, therefore, mirror regional impacts. Figure 3 shows the entire extraction and derivation process.

3.1. Selection of Data Sources

We chose the data sources according to the requirements. We aimed to show a proof of concept with these data without a claim on their completeness. It is worth mentioning that one of the potential candidates for data selection was open land use data. However, the quality of land use data has some major issues. Predominantly, robust land use data with comprehensive international coverage remain scarce. Statistical numbers are often presented at large scales. The local data-gathering groups also rely on specific areas and zones [34]. Another challenge is the data’s reliability, which can lead to outdated maps. This lack of consistency can be at both the spatial and temporal level [35]. An added issue is inconsistent rules and guidelines that are specific to local geographies. Different measurement methods, analysis techniques, and purpose-led data collection techniques might result in inconsistent data. Therefore, we neglected this data source and focused on the below-mentioned resources.
  • OpenStreetMap: We relied on the OSM platform due to its global importance for cartography and geographic data collection. Over the last decade, OSM has gained an increasing awareness, also for SDG data in developing regions, driven by initiatives such as the Humanitarian OpenStreetMap Team (HOT) or the American Red Cross (ARC) [36]. With over eight million members, OSM maintains data via the community and is, therefore, balanced over multiple members (↓ effort) [37]. All data are openly accessible (↑ transparency) and retrievable over multiple platforms (e.g., OverPass or Geofabrik). OSM ensures data integrity with active community members maintaining the dataset, but without strict data annotation rules (↖ integrity).
  • Open Charge Map: The Open Charge Map (OCM) platform provides global vehicle charging station information and locations. The platforms’ data are open and freely accessible (↑ transparency). In comparison to other platforms, the OCM provides a high level of detail and live updates. The OCM is maintained by a community (↓ effort) consisting of “businesses, charities and developers” (↑ integrity) [38].
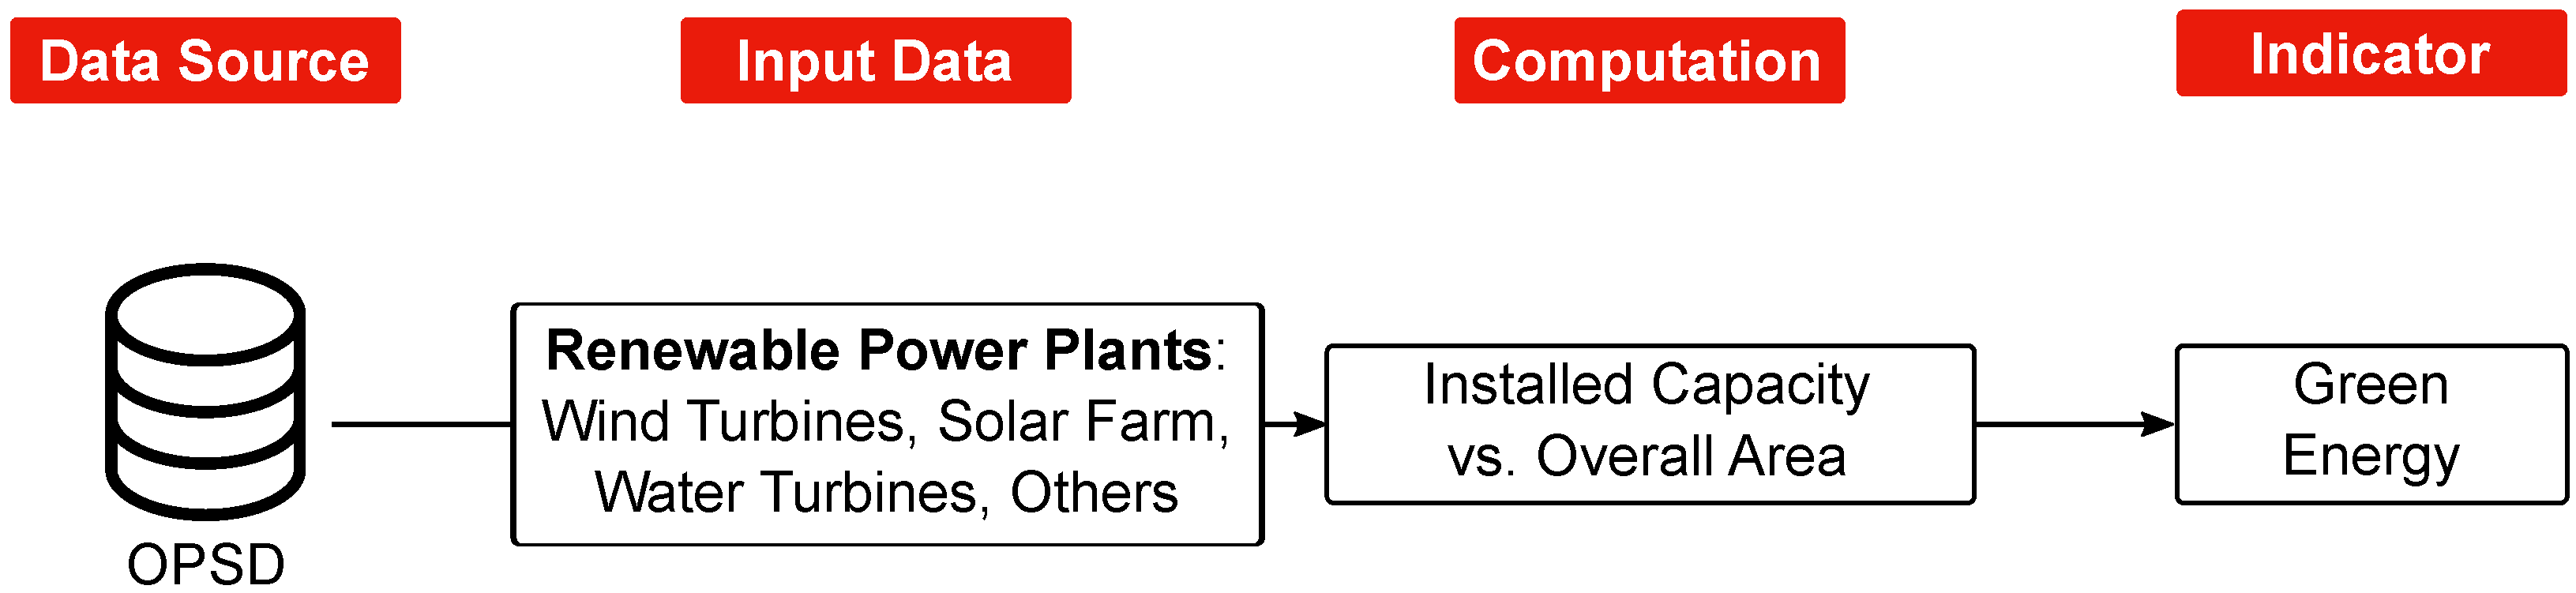
  • Open Power System Data: The Open Power System Data (OPSD) collection mainly includes data collected by German and Swiss universities focusing on power systems (renewable and conventional power plants) and weather and household information in Central Europe [39]. The dataset is maintained by the aforementioned scientific contributors (↑ integrity) and updated by them yearly (↓ effort). As manuals and the dataset are offered freely, data transparency is a given (↑ transparency).
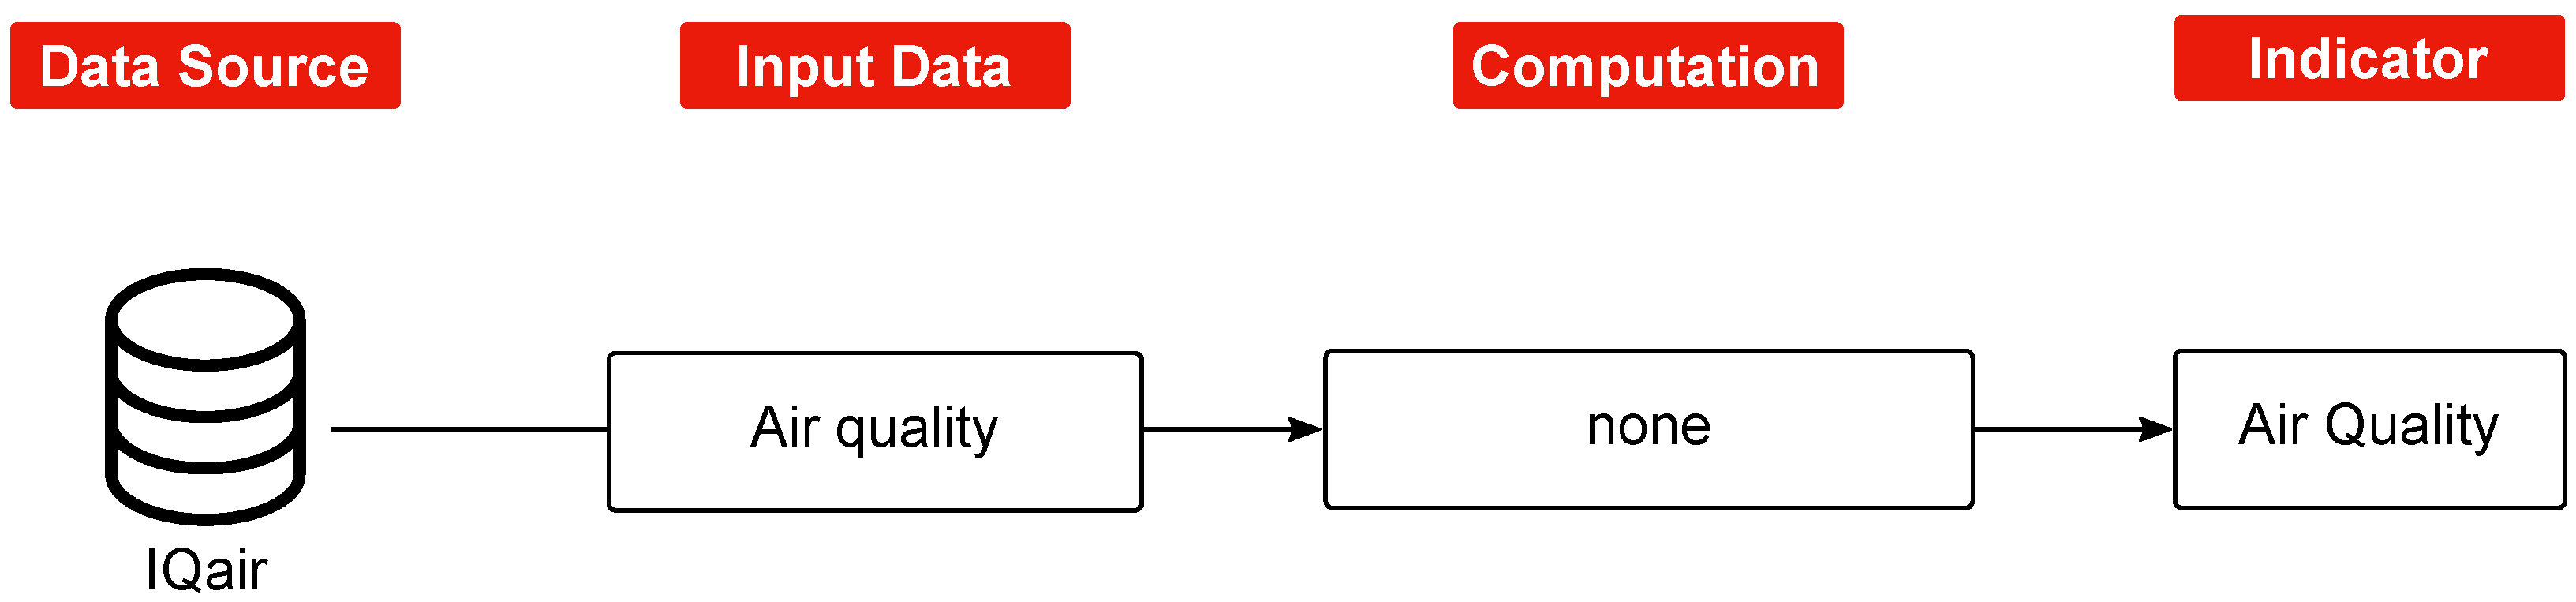
  • IQAir: IQAir collects air pollution data, especially particulate matter (PM2.5) statistics, all over the globe. Data are mostly collected automatically in real-time (↓ effort) from ground-based stations backed by governmental and non-governmental providers (↑ integrity). Data access is provided via an API but requires an API-Key, and therefore, open access is limited (← transparency).
Table 1 summarizes our rating of the different sources as previously mentioned in Section 2.3.

3.2. Derivation of Indicators

The selected community-based data reflect public engagement that contributes to a sustainable future by disclosing specific and focused sustainable key performance indicators (KPIs). We define seven distinct and one average indicator—or dimension—as proxies of the local adherence to the global SDGs (Table 2). By distributing the score for each dimension between 1 and 5, where 1 is the lowest and 5 is the highest, we enable a normalized approach that allows a comparison of counties across all of Germany. The approach could, however, be applied to any given country or region.

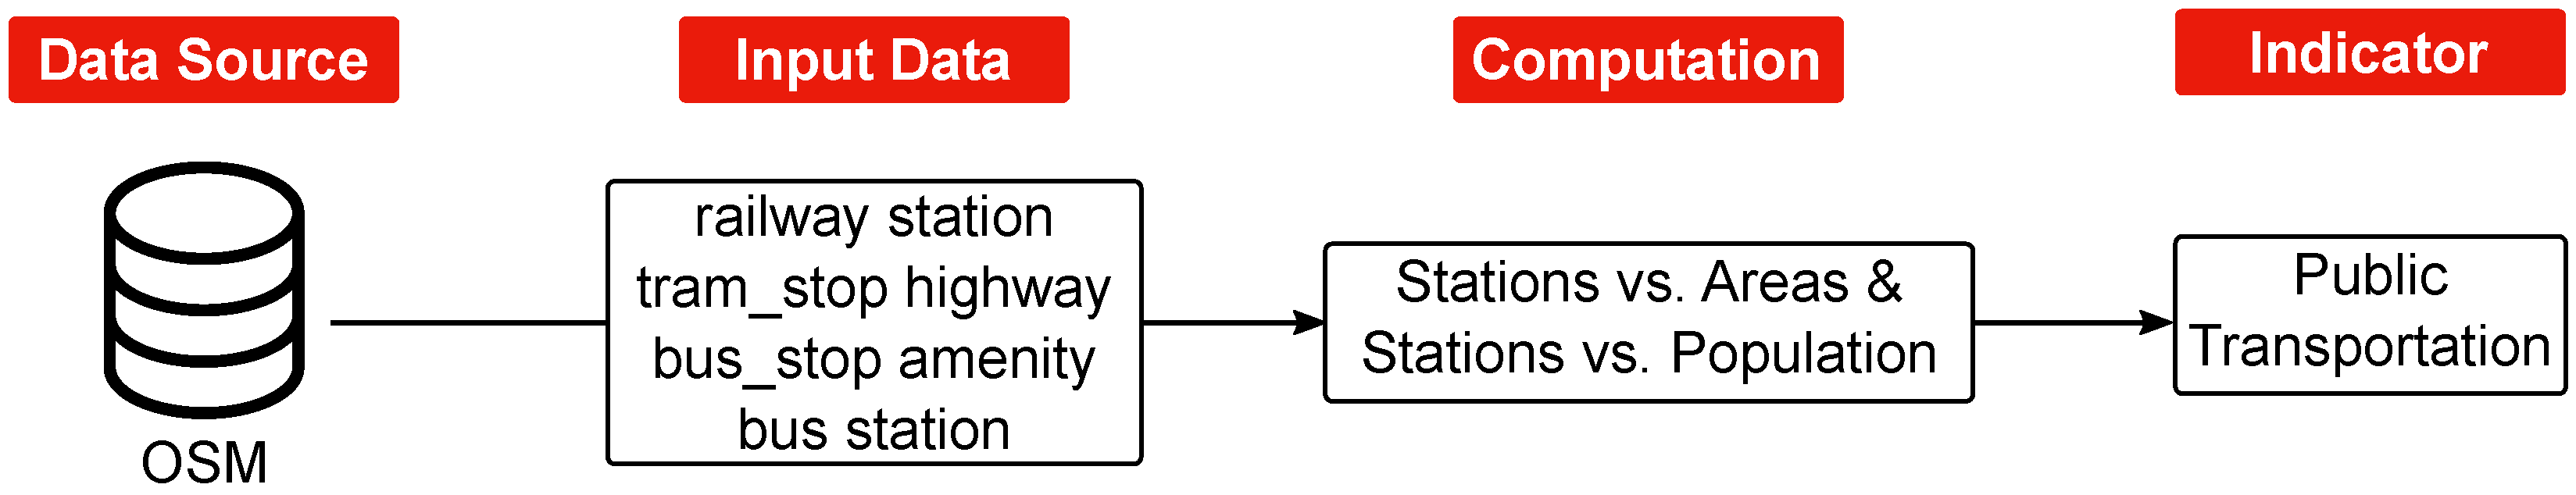
3.2.1. Public Transportation

SDG 11 aims “to make cities and human settlements inclusive, safe, resilient and sustainable.” Public transportation is one of the key components to fulfill this goal, as shown with Target 11.2.1, defined as the “Proportion of the population that has convenient access to public transport”. However, Klopp and Petretta [40] asserted that the poor accessibility of consistent, open-source, and relevant data poses a threat to fulfilling this goal and quantifying public transportation. It is important to have concise data that can be scaled worldwide. However, in some areas, particularly in Asia or Africa, a large portion of public transportation is unmapped and untraceable [41]. While some relevant data exist, they are kept as proprietary data, which hinders sharing and public usage [42].
We utilized OSM to analyze the infrastructure of public transportation at the county level for Germany. The data source is consistent, scalable, and easily extendable for the future. Since it is evident that cities with a low density will have less public transportation, we used an index that takes into account the weighted sum of stations respectively divided by the area and population of the city. Indicators can be correlated with demographic features to measure the impact on demographic groups additionally.

3.2.2. Bike Lane Density
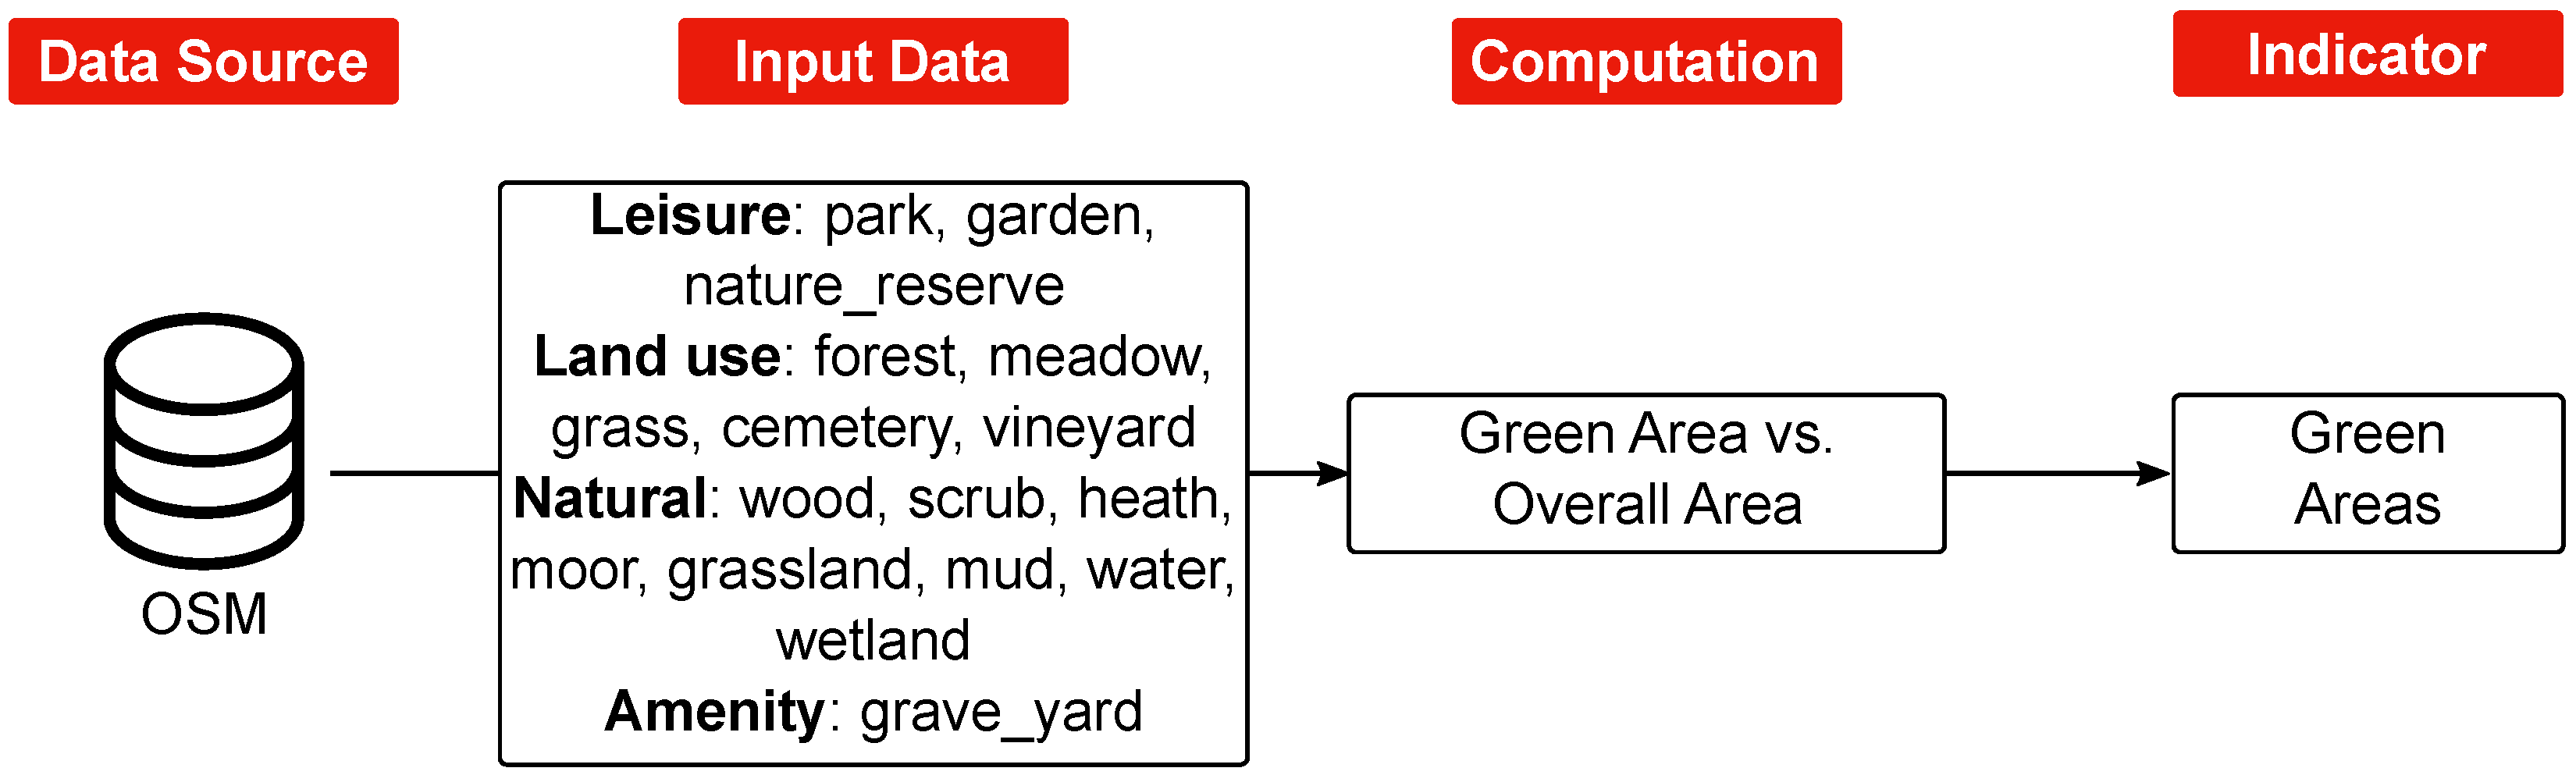
Cycling directly aligns to several SDGs [43]. Over the past few years, bikes have not been merely used for traveling to a place, but have become a symbol of an eco-friendly and healthy lifestyle [44]. This usage is beneficial for the global and local environment to reduce emissions and improve air quality [45]. Furthermore, cycling infrastructure requires considerably less area and is inexpensive compared to other modes of transportation [46].
The SDGs underestimate the priority of local city landscapes and streets. Existing projects fail to gather consistent and precise evidence due to insufficient and comprehensive data, while the absence of data also remains a problem. Winters et al. [47] devised a method that depends on broadly available geographical and spatial data, which determines a bicycle-friendly network. This method focuses on regional datasets. Krenn et al. [48] assessed Geographic Information System (GIS) data to determine cycling indices and mapped bicycle lanes based on the time of travel. However, their research was restricted to just one city. Likewise, Schmid-Querg et al. [49] also focused on computing a GIS-based biking index, implemented it in one city, and visualized some factors of their index.
In our approach, we extended the work of Hardinghaus et al. [50] to assess the quality of the cityscape based on infrastructure that is suitable for biking or walking. To guarantee the reproduction of these indices globally, Hardinghaus et al. [50] used OSM data to compute their cycling index. The bike lane distance is compared to the total distance covered by roads with a maximum speed of 50 km/h−1. OSM is ideal due to its widespread coverage, granularity, and low cost.

3.2.3. Green Areas

Green areas (leisure areas, parks, etc.) contribute significantly to urban sustainability and, therefore, reflect environmental and social benefits [51]. Green area measures can act as proxies for Target 15.1.1 (“Forest area as a proportion of total land area”), as they depict a major part of terrestrial ecosystems, which are the main focus of SDG 15 (“Life On Land”).
Different data sources have been used previously to assess this dimension accurately. Among these, Heikinheimo et al. [52] used user-generated geographic data such as social media, sports tracking, and mobile phone data. These data provide valuable results to identify leisure areas, but lack consistency because of platform-specific information and sample biases. Heikinheimo et al. [52] further favored using GIS as a data source.
Similarly, Feltynowski et al. [53] used satellite images to measure green areas and compared them with the local land statistics and the Maps and Urban Atlas dataset and recognized substantial disparities. Here, spatial data are collected only at the municipality level without division into small areas, while the green area is monitored at the lower level of districts and counties. Furthermore, their solution does not consider regional accessibility [54].
Consequently, a more coherent and accessible method to quantify green spaces is required. To define how green a city is, we analyzed the total surface of the green areas in comparison to the total surface of the city, referring to Section 4.2, where the OSM input data contain different dimensions such as leisure, land, natural, and amenity and are accumulated into the overall green area indicator.

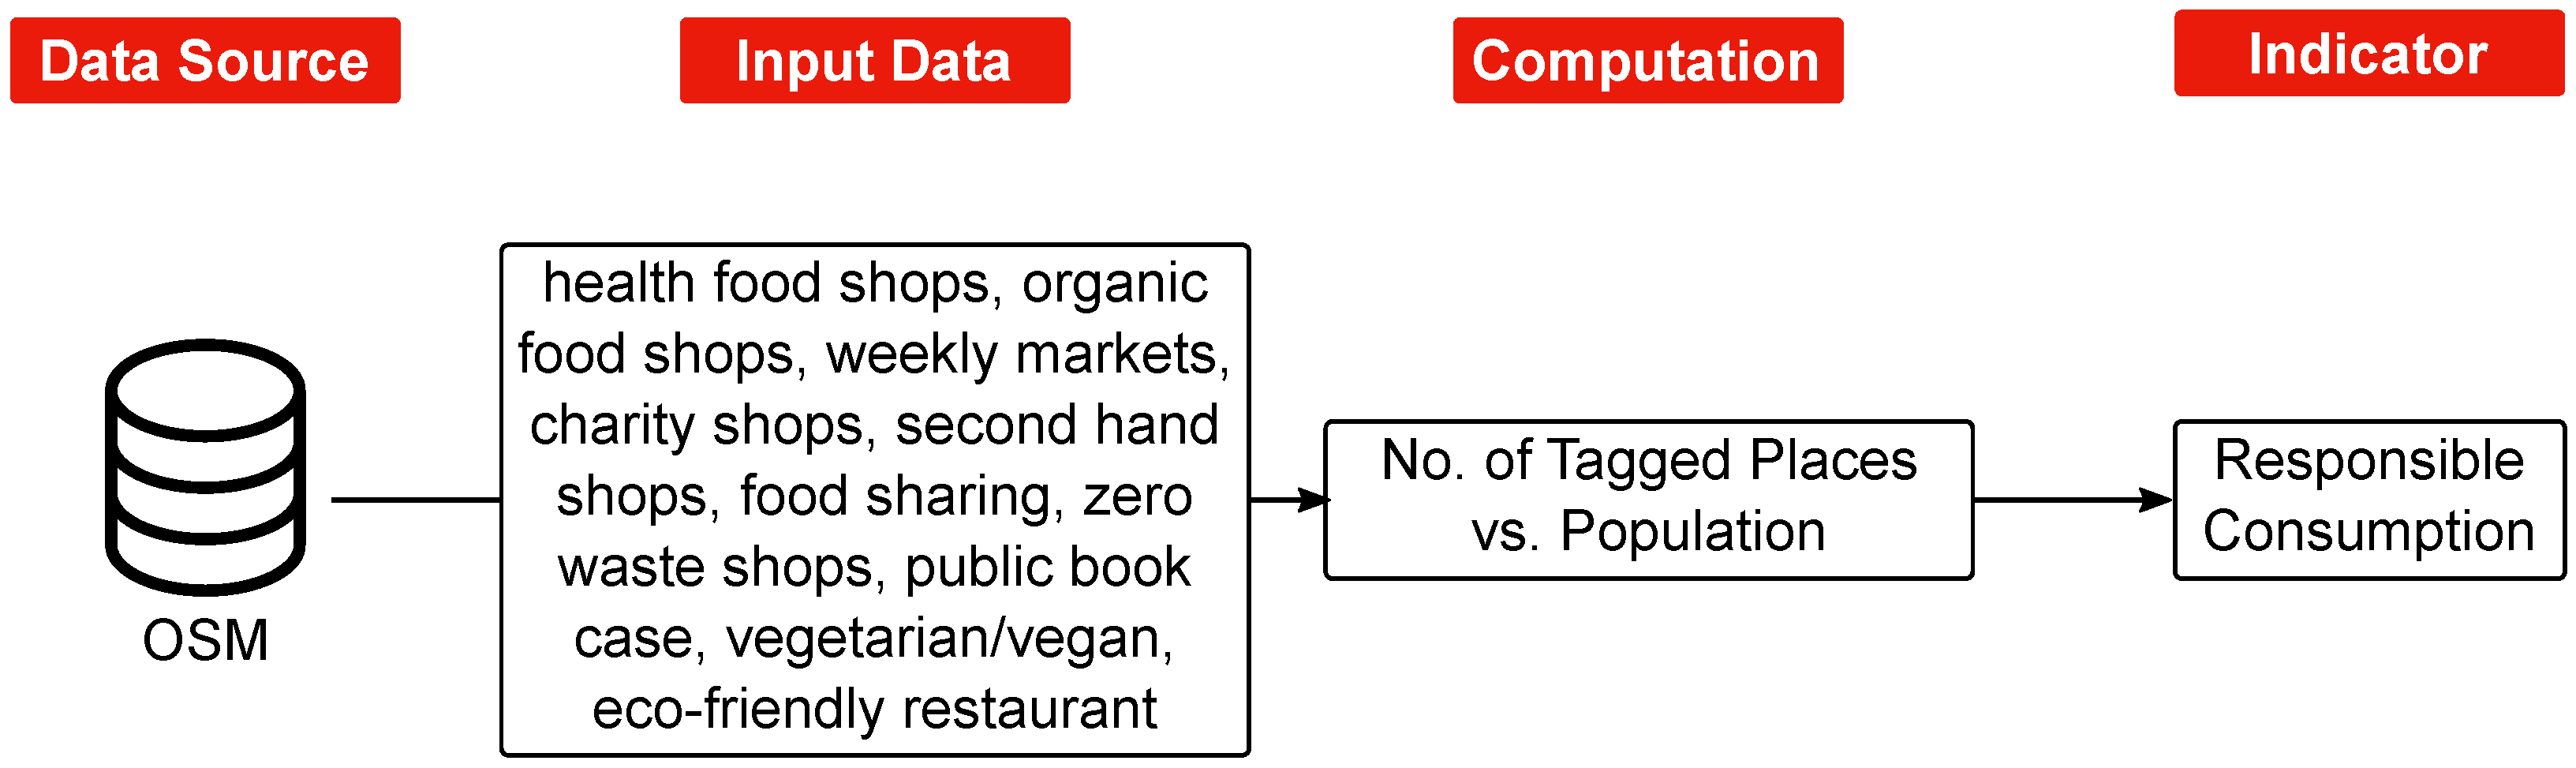
3.2.4. Sustainable Consumption

With the rapid increases in waste production, chronic diseases, and environmental pollution in recent times, regional enablers are needed to support a social change to address environmental concerns and establish sustainable consumption behaviors [55]. Eco-labeling and social messages have enhanced the attitude toward sustainable consumption [56]. Previous studies suggest that stimulating responsible shopping behavior is a difficult job [57]. Daily practices and habits regarding shopping and food consumption are the hardest to alter because these habits are usually associated not only with the consumer’s taste, but also with daily tasks, jobs, childcare, and community standards [58].
Several different digital platforms are promoting a message encouraging more responsible consumption. These platforms allow users to shop for responsible goods online or provide information for a responsible on-site shopping experience. However, Fuentes et al. [59] argued that their success in changing consumers’ consumption towards sustainability has deficiencies. Additionally, some researchers argue that digital products and platforms have been unable to change the lifestyle of users [60]. The reason might be that consumers perceive that these platforms can not responsively enough change customer attitudes and dynamic environments. Consumers might also question the transparency and neutrality of these digital platforms as their internal processes are hidden. Therefore, we used OSM, which is transparent and accessible to the public. We considered places that offer a range of sustainable consumer goods (food (organic/vegan), clothing, books, etc.) and related them to the population of the respective county to compute the index. Supported by Nilsson et al. [24], we think that, with an increased variety of stores offering goods that are focused on responsible consumption, people are encouraged to live a more sustainable life, which impacts almost every SDG, but especially Nos. 8 and 12.

3.2.5. E-Mobility Infrastructure

The adoption of electric vehicles is a significant component of future mobility because of their environmental friendliness and efficient operation. To accelerate this adoption, it is essential to create and visualize the urban charging infrastructure. In a few cities, some datasets are available for the community to locate these charging stations and applications and can allow the ranking of cities based on these data. If their energy comes from sustainable energy sources, electric charging stations provide access to clean fuels/energy. Therefore, if set in relation to the regional population, the number of charging stations is an excellent parameter to estimate the regional impact on Target 7.1.1, the “Proportion of population with primary reliance on clean fuels and technology.”
Previous studies focused on the optimal location of these charging stations. Some studies also used open datasets to check performance and location. Among them, Flammini et al. [61] acquired data from EVnetNL, a Dutch research center. The dataset consisted of all data points of publicly available charging stations in the Netherlands. The study also emphasized the application of a GIS and OSM to combine with these open datasets. This allowed us to gather more information and the geographical coordinates of all charging stations. Few studies are being performed in the United States to assess and use GIS data for empirical evaluations on charging stations [62]. Moreover, Lee et al. [63] also utilized an open-access web API for Korean e-mobility infrastructure data.
Falchetta and Noussan [64] used OCM, which is a comprehensive open-access dataset, depicting the locations of electric vehicles (EVs) charging stations. However, ACEA [65] reported that there is some variation between these open-access data and commercial data. This variation cannot be confirmed and accurately measured due to the unavailability at the public level and lack of standardization. To fill these research gaps and strengthen the robustness, we consolidated the open datasets from OSM and OCM to locate charging stations and provide granularity up to the county level. The computation was based on a comparison of charging stations with the population of the county to ensure sufficient coverage of the area with respect to its inhabitants.

3.2.6. Green Energy

With the recent expansion of new green energy, renewable energy sources are expected to grow to around 42 percent in the next two decades [66]. To cultivate this growth, it is essential to measure the production of renewable energy and determine the drivers of green energy globally and in countries leading this transformation toward sustainable growth. Green energy penetration can be derived based on the amount of sustainable energy consumption and the number of sustainable energy producers in a particular region. Target 7.2.1, the “renewable energy share in the total final energy consumption”, aligns with this metric.
State-of-the-art data analysis techniques, including machine learning, data mining, and artificial intelligence, are often used to locate green energy resources by using OPSD. These methods have been prove to be handy in forecasting resource production. They conceptualized a system based on smart computing to derive these data. However, translating its use globally is problematic because of the necessity of required technology and a high skill set, which can be costly and hard to acquire [67]. Trumpy et al. [68] used the web-based Global Geothermal Energy Database. This source is specialized for locating geothermal plants and proves an effective tool to assess their use globally. The data include locations, direct consumption, production, and business reports with options to integrate and filter the data. Punys et al. [69] analyzed major statistical indicators from the European Hydro Power Database, focused only on the production of hydropower plants. Kelsey and Meckling [70] applied the data from the European Photo-Voltaic Industry Association and the European Wind Energy Association to determine solar and wind capacity in Europe. For private plants, a proprietary database named World Electric Power Plant Database exists. In the United States, renewable energy capacity for solar and wind resources is documented in the U.S. Energy Information Agency database. Several databases are available and provide data about renewable capacities in different regions of the world. The OPSDs exists to unify European power plant information, offering open-access and accumulating extensive information on renewable energy. To ensure consistency, we employed the data to show the capacity production of a renewable mix including wind, solar, biomass, and biogas in a district-level granularity to enhance private engagement and gauge production levels. These capacities are the basis of this indicator’s sustainability score.

3.2.7. Air Quality

The air quality index is also an essential metric due to instantaneous fluctuations in harmful emissions driven by human actions [71]. Consequently, effective quantification of air quality is a crucial requirement for policymakers and residents. As air pollution directly correlates with Targets 3.9.1, 11.6.2, and 12.4, regional knowledge of hazardous air pollutants is crucial. Yet, the differing computation complicates the indexes’ evaluation and standardization. Some scientists are gradually directing their energies toward using state-of-the-art methods such as sensor and machine learning models to forecast air quality [72]. However, these methods are complex and costly to scale. Another approach is to use air quality monitoring stations. Büke and Köne [73] assessed three main pollutants consisting of sulfur dioxide SO2, nitrogen dioxide NO2, and particulate matter. This method gives standard and comparable results to apply to all cities uniformly.
Therefore, we also tapped into open-source application programming interfaces (APIs) for air quality index data, having nearly 8000 sensors across the globe from IQ Air. The data reliability was confirmed and validated, using machine learning algorithms [74]. Open-source availability allows consistency for every user and engenders trust. In addition to the air quality index, IQ Air also provides the proportion of particulate matter and sulfur and nitrogen extracts to pinpoint the issues.

4. Implementation

We define a combined index taking seven sub-indices into consideration: public transportation, green areas, bike lane density, e-mobility, green energy, air quality, and responsible consumption. All the indices were calculated on an administrative Nomenclature of Territorial Units for Statistics (NUTS) V.3 grid for Germany, to segment areas into regions that include between 150 and 800 thousand inhabitants [75]. We obtained a rating by pre-processing every aforementioned indicator for every county in Germany. To remove outliers, we clipped the rating of each indicator by just considering the 95th percentile and setting the outliers to the closest included rating value. Finally, to calculate the final scores, we linearly rescaled the ratings from 1 to 5, making them comparable with each other.

4.1. Public Transportation

As the most-utilized modes of public transportation, trains, buses, streetcars, and subways are the main factors for computing this index. To assess accessibility and feasibility, it is important for them to be equally normalized to the region’s total area and the population, using the following formulas. We set the weights of the different modes of public transportation according to their usage ratio averaged over Germany in our score, accordingly:
x PT = 1 6 n bus stations + 2 6 n streetcar stations + 4 6 n subway stations + 1 6 n train stations .
and:
c PT = 1 2 x PT A county + 1 2 x PT n population / 1000
where:
xPT = Weighted number of public transportation stations;
ni = Number of station i;
cPT = Total public transportation score;
Acounty = County area in km2;
npopulation = Population size.
To obtain the number of public transportation stations n i , we used OSM as the data source. Figure 4 summarizes the data collection and computation required to calculate the score.

4.2. Green Areas

Green areas will improve the quality of life, and this is why we have used as options a variety of tags to capture green spaces in the region. For the green area index computation types of leisure, land uses, and natural and amenities areas were extracted from OSM and compared to the total area (Figure 5). The green area share was then calculated accordingly:
c GA = A Green Areas A county
where:
cGA = Total green area score;
AGreen Areas = Total green area in km;
Acounty = County area in km.
Figure 5. Process from OSM data to the green area indicator.
Sustainability 15 03203 g005

4.3. Bike Lane Density

To evaluate the potential for bicycle usage in certain regions, we extracted OSM streets, having a maximum speed of 50 k m / h , that could be potentially used by bicycles and computed their overall distance. As these streets do not necessarily contain suitable bicycle lanes, we, additionally, filtered the streets with the bicycle tag “yes” and computed their distance (Figure 6). Our final bicycle lane coefficient sets the street distance including bike lanes in relation to the street distance that a bike could possibly travel on:
c BL = d bike lanes d total
where:
cBL = Total bike lane score;
dbike lanes = Total bike lane length in km;
dtotal = Total road length with max 50 km h−1 in km.
Figure 6. Process from OSM data to the bike lane density indicator.
Sustainability 15 03203 g006

4.4. Responsible Consumption

The index for responsible consumption was computed by identifying all the locations tagged as sustainable using OSM data. Figure 7 shows the tags used to identify these locations. Subsequently, the locations were normalized to the area’s total population:
c SC = n sustainable places n population / 1000 .
where:
cSC = Responsible consumption indicator;
nsustainable places = Number of sustainable consumption location;
npopulation = Population size.
Figure 7. Process from OSM data to the sustainable consumption indicator.
Sustainability 15 03203 g007

4.5. E-Mobility Infrastructure

To retrieve the number of charging stations, we used a service that consolidates charging stations from OCM (Figure 8). We included all public charging stations without differentiating between their type (AC or DC) and power because this information is not available for all data points. Based on these numbers, we can evaluate availability and accessibility by dividing both by the overall population:
c EM = n charging stations n population / 1000 .
where:
cEM = E-mobility indicator;
ncharging stations = Number of public charging stations;
npopulation = Population size.
Figure 8. Process from open data to the e-mobility infrastructure indicator.
Sustainability 15 03203 g008

4.6. Renewable Power Plants

To evaluate each region’s renewable sources, we retrieved renewable power plants from OPSD and measured the installed electrical capacity in M W . Secondly, we divided the capacity through the NUTS-3 segment’s area to normalize the outcome on the potential available space to place renewable energy plants. The value was then rescaled into the relational 1–5 score system. Figure 9 summarizes the input data taken from OPSD. The indicator is calculated according to:
c GE = C renewable A area .
where:
cGE = Green energy indicator;
Crenewable = Renewable energy capacity
Aarea = NUTS-3 area size.
Figure 9. Process from OPSD data to the sustainable consumption indicator.
Sustainability 15 03203 g009

4.7. Air Quality

The air quality index was taken from IQAir and then scaled into the relational 1–5 score system. Because the data are equal for every region, IQAir’s output can be directly used to compute the air quality indicator (Figure 10).

4.8. Overall Score

The overall index was computed as the average of those seven sub-indices in the five-point system. Following the equally weighted sustainability pillars, we chose to apply an equal weight to each sub-index. Although weighting of the individual indicators is possible, it reduces the neutrality and objectivity of the Sustainability Mirror because it requires an a priori decision-maker to set the weights. All the indices were calculated on an administrative NUTS-3 grid for Germany. We obtained a score by pre-processing every KPI for every county in Germany and, then, the lowest score sets 1 and the highest score sets 5 based on a relational comparison. The KPIs is computed as shown below:
c t o t a l = c i n i n d
where:
ctotal = Total sustainability score;
ci = Sustainability indicator i;
nind = Number of indicators.
The legend for the mirror is as follows:
  • 1: Very poor;
  • 2: Poor;
  • 3: Fair;
  • 4: Very good;
  • 5: Excellent.

5. Results and Discussion
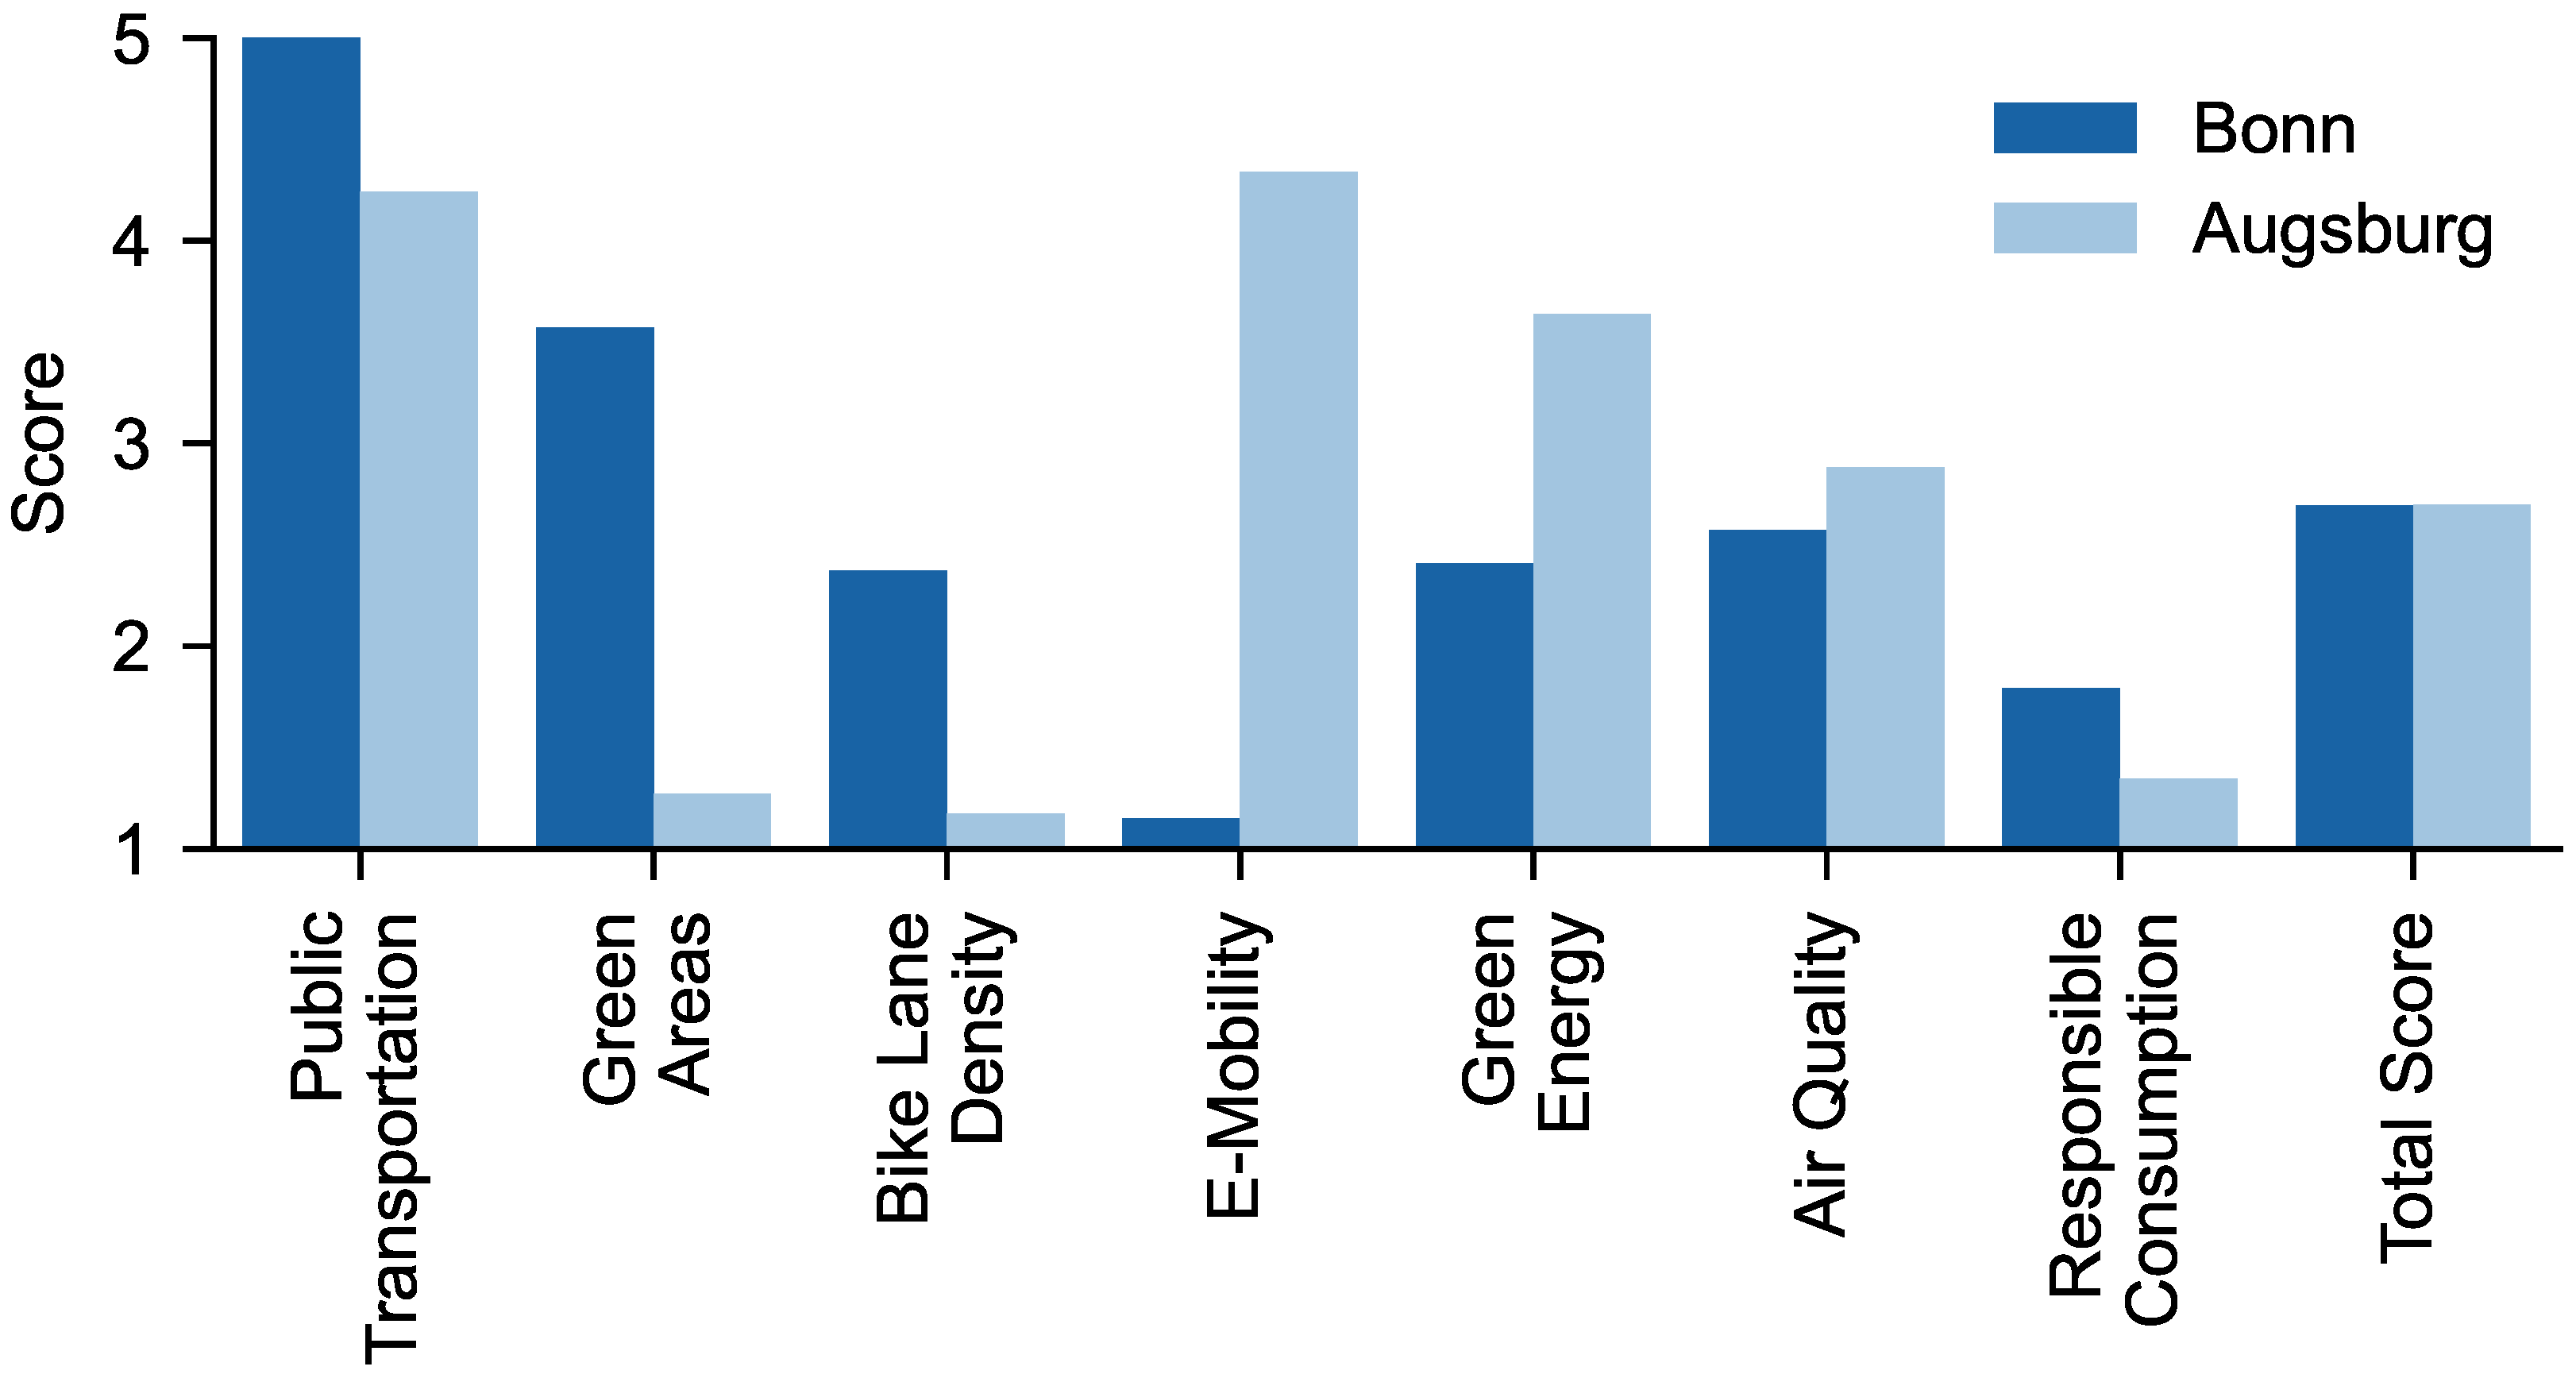
In the following, we present the results obtained by the Sustainability Mirror. To verify these results, we first compared two German cities and analyzed the results with the cities’ respective sustainability assessments. Second, we applied the methodology to every Landkreis (county) in Germany and discuss its scalability.

5.1. Local Scale

We calculated the seven indicators down to the scale of cities—the smallest spatial unit provided in the NUTS-3 grid. To show that the methodology yields plausible results, we compared two German cities with an equal total score, but different characteristics. We sampled the two cities in the following criteria:
  • Comparable population and area (i.e., within 10%);
  • Similar overall score;
  • Within 100 k m to TUM and E.ON SE headquarters (Munich and Essen), respectively.
In alphabetical order, Augsburg and Bonn fulfilled these criteria first. Bonn (North Rhine-Westphalia) and Augsburg (Bavaria)—characteristic of other old and historical regions in Germany—are relatively similar in terms of their population (Bonn: 329,673; Augsburg: 296,582) and surface area (Bonn: 141.06   m 2 ; Augsburg: 146.86   m 2 ).
Figure 11 shows the resulting values for each dimension of the Sustainability Mirror. Both cities have a similar overall (i.e., average) score of 2.7, the specific dimensions differ. Bonn and Augsburg have excellent and very good scores, respectively, for public transportation, which we expected because both are categorized as big cities (>100,000 inhabitants). On the other hand, Bonn has outperformed Augsburg in green areas and bike lane density, with good and poor scores, respectively. Similarly, Augsburg’s excellent e-mobility score, outperforming that of Bonn, could also make the region a role model. Scoring good in green energy, Augsburg could set an example for Bonn, which only scores slightly worse. Demonstrating a fair score in air quality, both counties could benefit from improvements in these areas. However, an area that needs to be given the highest priority for enhancement is responsible consumption, as both regions scored as poor.
Following the UN Agenda 2030, both cities developed a plan and tracked their progress, allowing us to compare our Sustainability Mirror to their assessment. However, the cities used different methodologies.
Augsburg introduced a sustainability assessment (Ger.: Nachhaltigkeitseinschätzung) for each resolution passed by the City Council [76]. Augsburg uses three categories—analogous to the three sustainability pillars—with five indicators per category. The latest report summarizes the results of the sustainability assessment for 2019 City Council Resolutions [77]. Distinguishing promoting and inhibiting effects, Stamm [77] identified the indicator with the most-significant advancement. We interpreted this as a strategy for the city that, if successful, should result in improvement in the respective areas.
Based on Augsburg’s sustainability assessment, improvements in the area of ecological sustainability were primarily due to enhanced ecological mobility (Ger.: Ökologische Mobilität) [77]. The Sustainability Mirror reflects this with good scores in public transportation. Highlighting an area of improvement, the poor performance in bike lane density, however, contradicts the city’s report. Less attention was given to resolutions fostering biodiversity (Ger.: Biologische Vielfalt), which reflects the poor score in green areas. According to the assessment, Augsburg improved social sustainability by enhancing security and inclusiveness. Neither improvement is reflected by the Sustainability Mirror, which could be part of future work. Regarding economic sustainability, Augsburg improved as a business location, although less attention was given to social and ecological business practices. The good score in e-mobility, the fair score in green energy, and the poor score in responsible consumption can be interpreted in the same way as the city’s report. However, the report does not provide a detailed breakdown of the individual resolutions, so no clear connection can be made between the city council resolutions and these three dimensions of the Sustainability Mirror.
Air quality is not assessed by the report, and thus, no conclusion can be made. Based on the city’s assessment, we can verify that mobility- and environment-related topics are well represented by the Sustainability Mirror. Interpreting the results, the Sustainability Mirror reflects economic development in some ways, but the correlation cannot be proven. Social aspects—in particular education, inclusiveness, and equality—are (currently) not shown by the Mirror.
The city of Bonn publishes an SDG report with KPIs similar to the reporting found in the private sector [78]. In the latest report, covering the years 2016 to 2018, the city measures four key categories: well-being, social equity, environmental quality, resource efficiency, and economic efficiency. The report assigns one or more SDGs to each category and assesses the categories’ status using a four-point scale (negative, neutral, positive, and non-measurable development).
Bonn’s sustainability report highlights the positive development of the city’s public transportation, which the Sustainability Mirror reflects with a very good score [78]. The same trend applies to bike lane density, where the report shows a positive development and the Sustainability Mirror a fair score. Regarding green areas, the report describes overall neutral development, but a notable negative trend, which should be monitored. This is reflected by a good score in our Sustainability Mirror. Similar conclusions hold for the comparison between the air quality index and the city report. In contrast, the fair score for green energy seems to contradict the reported values, where Bonn has a renewable energy share (72%) well above the German average (38%). The city’s report does not provide any information on e-mobility. However, we assumed that the mirror can therefore depict not only public, but also private sector infrastructure projects.
Based on the two exemplary cities and their sustainability assessment, we concluded the following:
  • Both cities have made efforts to improve their infrastructure (public transportation) and to make it greener (green areas and bike lane density). The same applies to lowering pollutant emissions. The Sustainability Mirror reflects these developments very well, which is why we assumed that it is a good proxy for overarching SDGs (Section 3.2), especially for a local resolution.
  • The Sustainability Mirror can adequately represent developments in the ecological sustainability pillar, using green areas as proxy data.
  • Neither Augsburg nor Bonn addressed e-mobility in their own reports. On the one hand, this could be due to the publication date, missing the recent uptake of electric mobility. On the other hand, as private companies often build and operate e-mobility infrastructure, it might be challenging to capture it in public reports.
  • The cities’ economically sustainable development is hardly directly measurable. The mirror’s dimensions, responsible consumption, e-mobility infrastructure, and green energy hint at economic developments. However, we cannot clearly correlate these dimensions with the development described in the reports.
  • Both reports give special attention to social sustainability aspects. Foremost, education, inclusiveness, and equality are essential targets for the cities’ development. None of these dimensions is currently reflected by the Sustainability Mirror and should be considered in future research.
  • In an international energy market, energy production and consumption do not necessarily occur in the same place. As a consequence, the officially reported energy mix is an accounting figure, reflecting authorities’ and cities’ ownership or shares in renewable energy assets abroad or several hundred kilometers away, not directly matched with the physical energy consumption at the location. Within the Sustainability Mirror, we chose a different approach: the green energy index reflects the actual installed renewable capacity within the administrative boundary, underpinning the local physical match between demand and supply. This way, counties or cities could be motivated to install renewable energy sources instead of accounting for remote assets. A method, as proposed by Krapf et al. [79], that measures the installed photovoltaic capacity on building roofs could extend the index in the future. However, the method by Krapf et al. [79] cannot be scaled to larger regions yet, as required for the Sustainability Mirror.
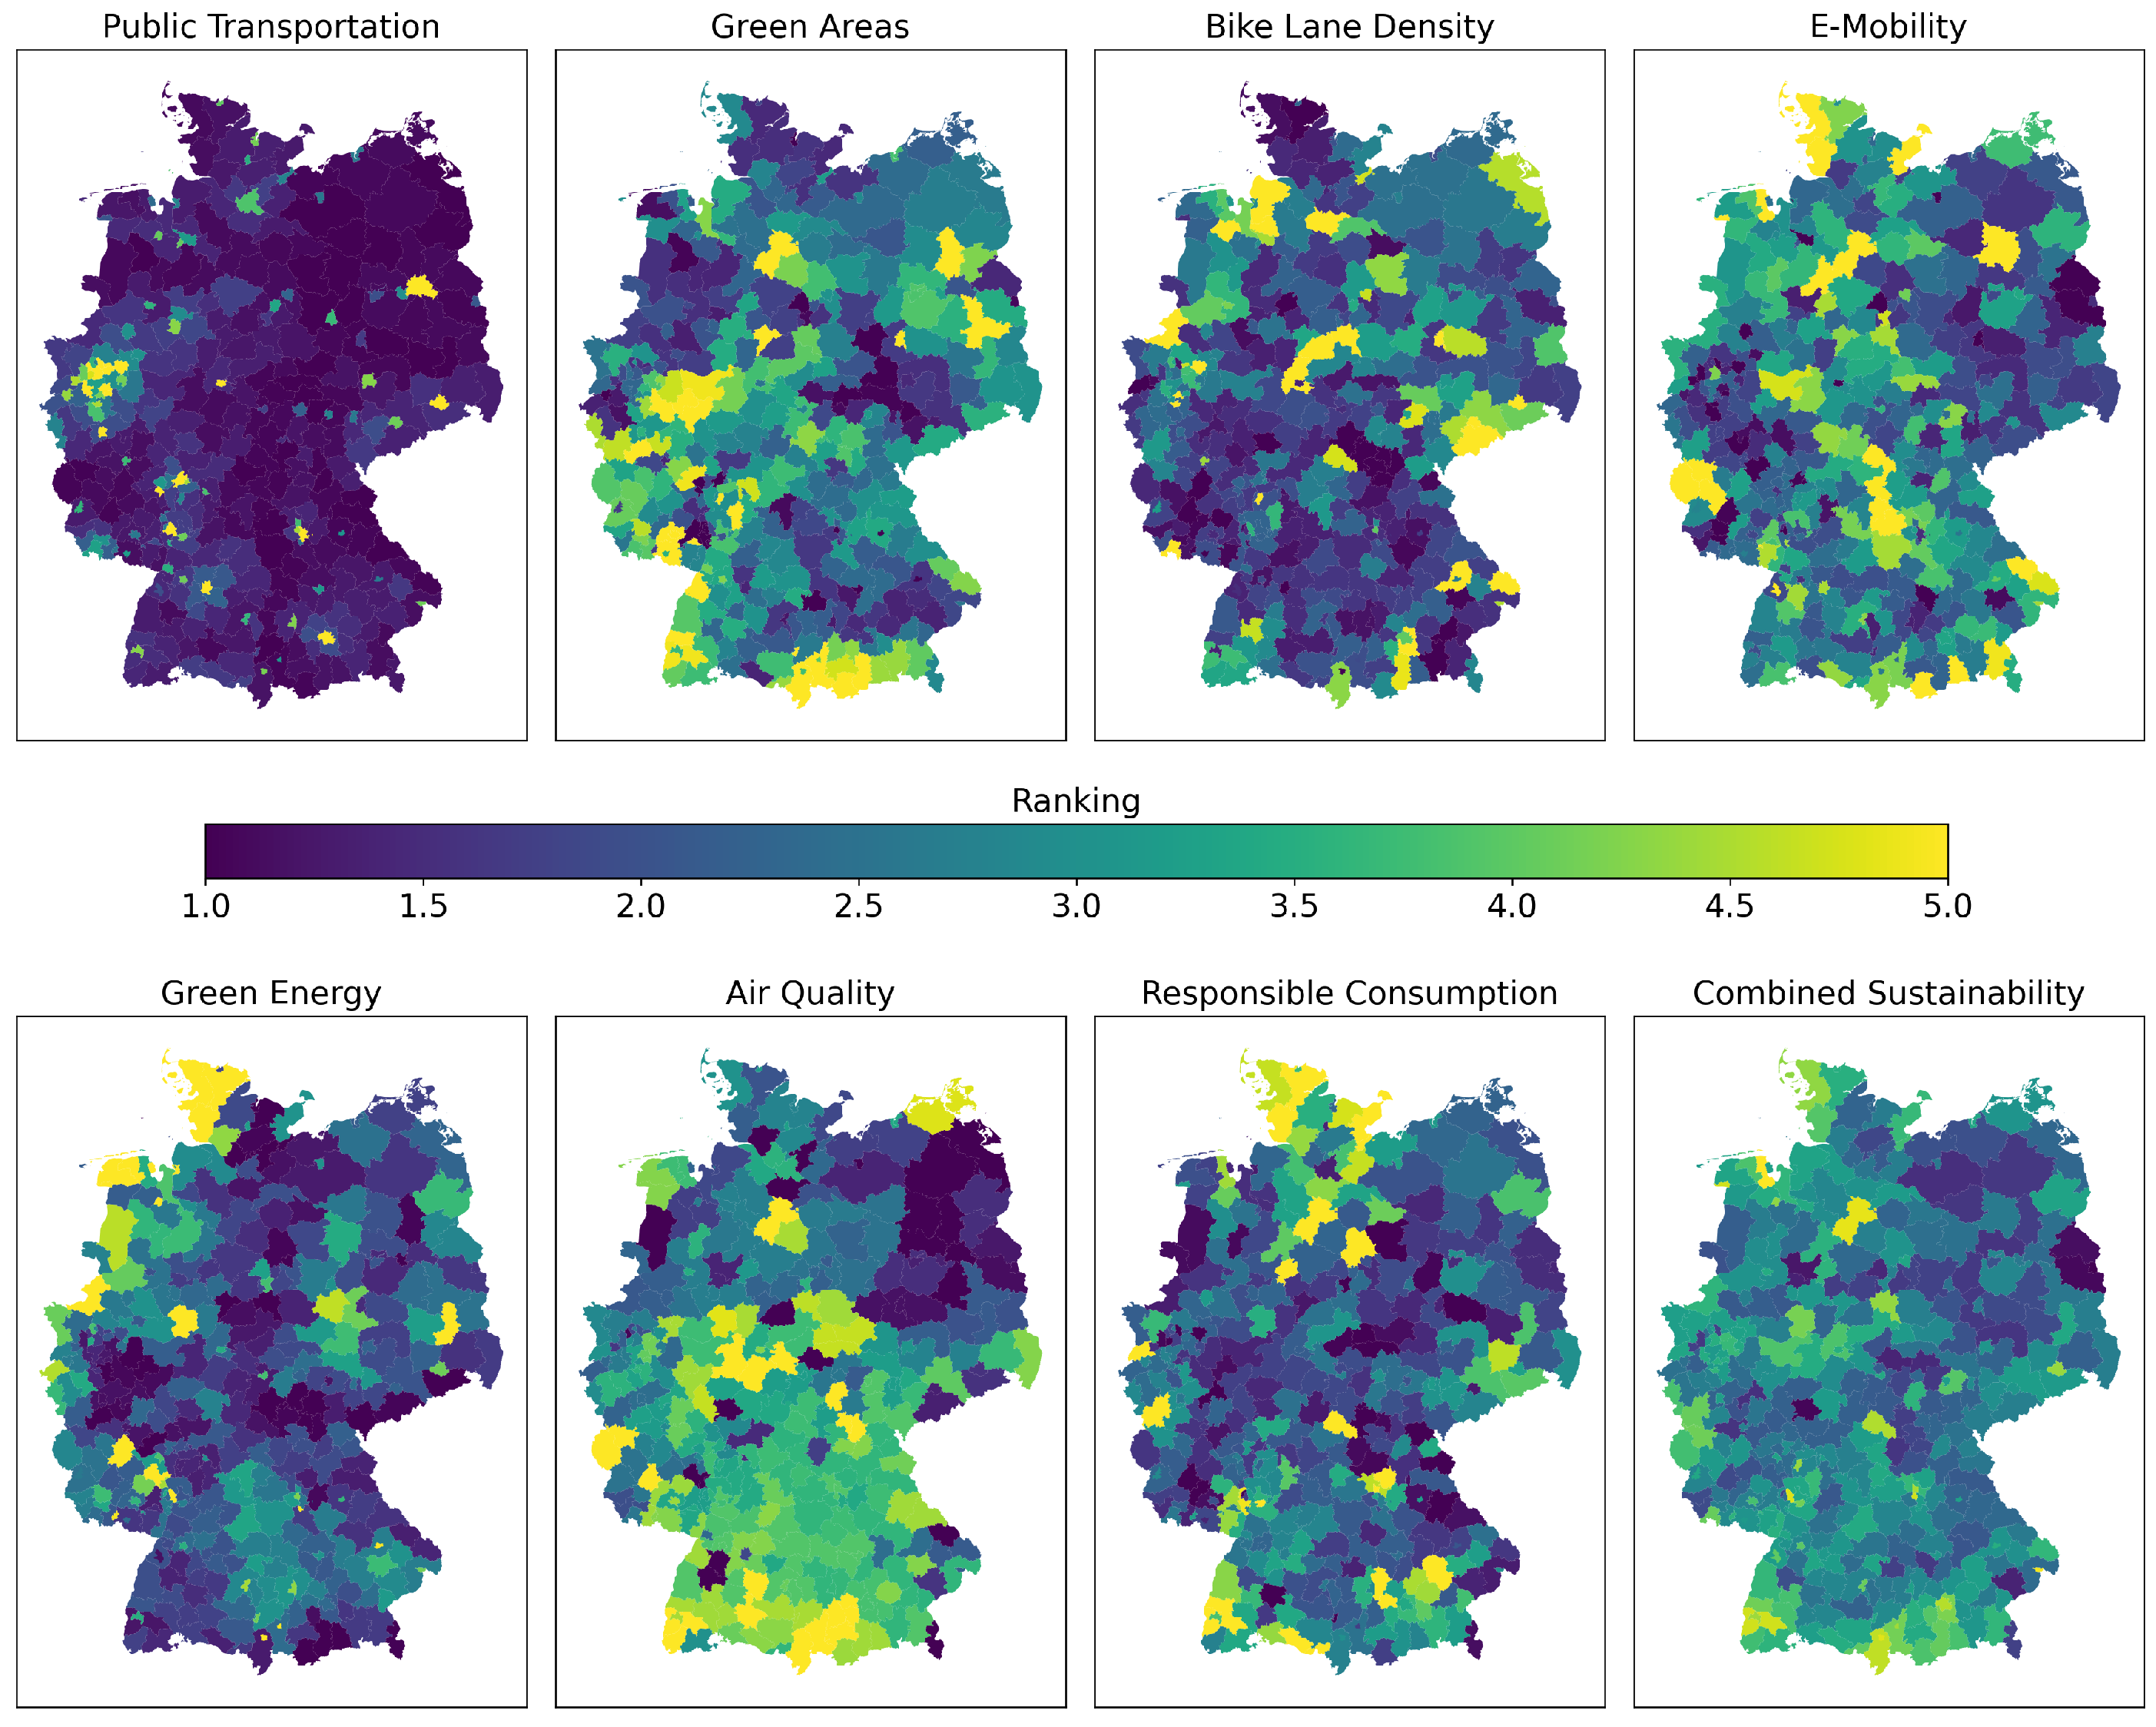
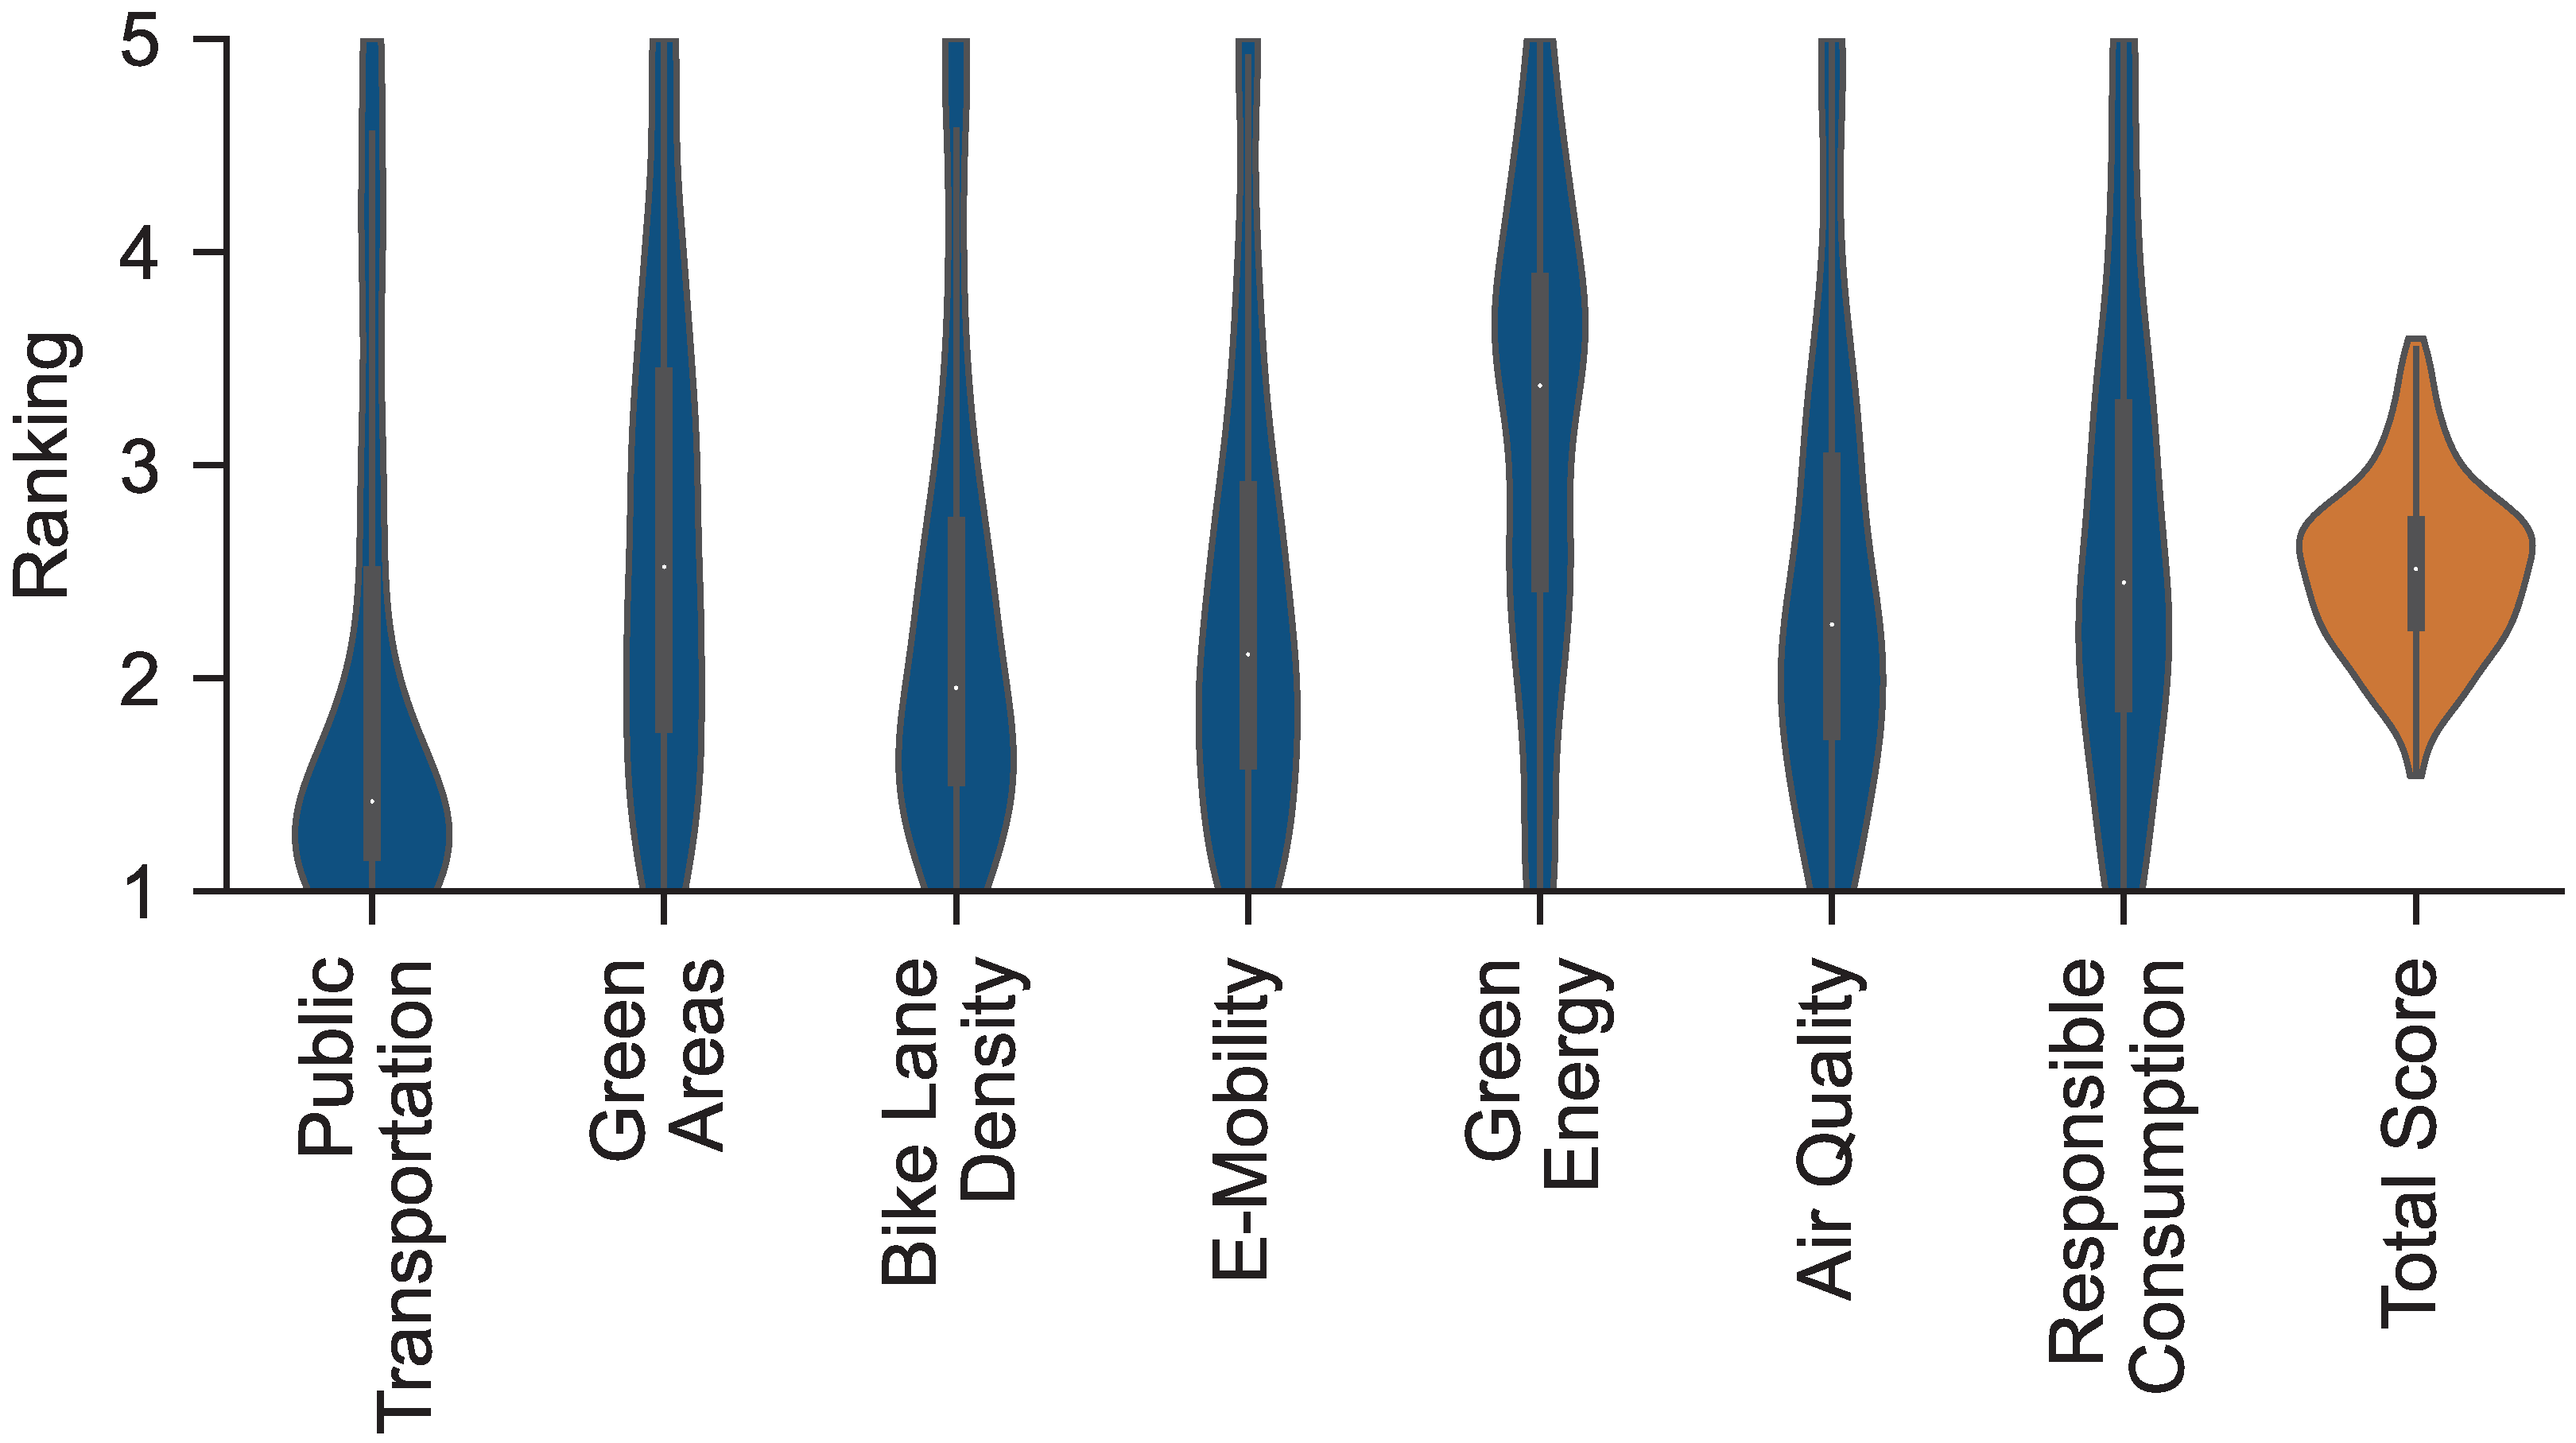
5.2. National Scale

To show the method’s scalability, we applied the metric to each Landkreis in Germany. Figure 12 shows the results for each indicator, as well as the overall score (bottom right). We see that the regions’ performances are scattered. In particular, good scores for green areas, bike lane density, and e-mobility seem to spread little to neighboring regions. These indicators are either primarily controlled by regional governments or driven by private investments and, thus, largely independent of neighboring regions. Green energy is an exception, where, for example, the high share of wind energy in northern Germany and high shares of lignite in eastern Germany are conspicuous.
In addition to the spatial distribution, Figure 13 shows the shapes of the distributions. All dimensions show a normal distribution, although with varying mean values, standard deviations, and outliers. For public transportation (1.98), bike lane density (2.29), and e-mobility (2.36), the mean value is below the total score’s average of 2.5. The assumptions that these dimensions are better developed in cities than in rural areas and that rural counties comprise approximately 75% of German counties explain this trend. The opposite applies to Green Energy. We expect renewable energy power plants to be located more often in rural areas because there is less of a shortage of space than in cities. Green areas (2.64), air quality (2.48), and sustainable consumption (2.65) have a mean value close to 2.5, but a larger standard deviation than the total score.
In the scope of this research, we only applied the method to Germany. Due to the relatively low effort and good data availability, an extension to other countries is possible, which further research should pursue. Applying the Sustainability Mirror to additional countries would allow a comparison with larger-scale data, such as the SDG-Tracker [17]. On the one hand, this would establish a complete link between regional indicators and the overarching SDG framework. On the other hand, the Sustainability Mirror also shows regions with particularly good performance that can serve as positive examples, as well as regions with an increased need for action.

6. Summary and Conclusions

Reviewing sustainability assessment methods and indicators, we found that the link between global sustainability goals and regional indicators and activities is missing. We found that proxy data can establish this connection. To ensure data integrity and transparency while retaining low effort to be scalable, the approach requires publicly available or crowd-sourced data.
In this work, we presented the Sustainability Mirror as a tool linking regionally measured sustainability to more abstract frameworks such as the SDGs. Because the UN sustainability indicators are either complex to calculate, not available, or not suitable for automated processing (cf. Bonn’s sustainability report) on local scales, we used seven proxy indicators to compute an overall score, reflecting a region’s local sustainability. The method’s scalability allows the computation of larger regions or multiple countries and, consequently, enables a quantifiable comparison of local sustainability on a large scale—a key criticism of current local sustainability assessment [4].
With this work, we presented a novel approach to measuring sustainability. One of our key findings is the approach’s overall plausibility. Sampling two cities (Bonn and Augsburg), we showed that the Sustainability Mirror adequately represents environmental- and urban-planning-related SDGs. Based on this sample, we verified the methodology’s results. Comparing the cities’ sustainability reports, we found that the Sustainability Mirror reflects certain economically sustainable-related aspects. However, we were not able to clearly correlate these aspects, which is why future research should supplement the Sustainability Mirror with other sources in these areas.
Another limitation of the methodology, which we concluded from comparing the two cities, is the underrepresented social sustainability pillar. Some aspects, such as the number of schools or healthcare facilities, might be easily included in future versions of the Sustainability Mirror, but were out of the scope of this research. Other aspects, such as gender equality or reduced inequalities, are harder to measure, because of missing data, particularly with a sufficient spatial resolution. Future research should, therefore, focus on the local measurement of social aspects with a high spatial resolution to reflect local sustainability. We found that the use of proxy data is a useful way to enhance spatial resolution, which should be pursued by future research.
Comparing the national sustainability indicators, an important differentiation between public reports and the Sustainability Mirror regarding green energy is highlighted as a key finding. While, in general, authorities tend to report the accounting-based energy mix (including asset ownership at distant locations), the Sustainability Mirror focuses on the locally installed renewable sources only, giving accessto the physical availability of green energy at the specific location.
The goal of this research was the development and presentation of a new method to measure sustainability on the local level and scale it to larger levels. In the current state, we showed the proof-of-concept for using proxy data to achieve this goal. Disclosing the complete methodology behind the Sustainability Mirror, we hope to motivate other researchers to apply and enhance the presented methodology. We hope not only to apply the method to larger regions, but also to collect time-related data. Ultimately, this makes it possible to answer the question of the ability to measure sustainability locally, foster engagement, and enhance sustainability on a greater scale.

Supplementary Materials

The following Supporting Information can be downloaded at https://www.mdpi.com/article/10.3390/su15043203/s1. Table S1 includes all data sources from the SDG-Tracker, which are used for Figure 1, as an Excel sheet.

Author Contributions

Conceptualization, D.Z., S.W. and F.d.D.; methodology, A.-B.A., G.C. and F.d.D.; software, G.W. and E.N.; validation, D.Z. and S.W.; formal analysis, D.Z. and S.W.; investigation, D.Z. and S.W.; resources, J.K.; data curation, D.Z. and J.K.; writing—original draft preparation, D.Z., S.W. and M.U.; writing—review and editing, D.Z., S.W., M.L., M.U., A.-B.A. and G.C.; visualization, D.Z. and S.W.; supervision, D.Z., S.W., A.-B.A. and G.C.; project administration, S.W.; funding acquisition, M.L. All authors have read and agreed to the published version of the manuscript.

Funding

The research of D.Z. and S.W. was conducted thanks to basic research funds from the Institute of Automotive Technology, Technical University of Munich.

Institutional Review Board Statement

Not applicable.

Informed Consent Statement

Not applicable.

Data Availability Statement

To generate the shown results, we mainly used data from the following open data platforms: OpenStreetMap at https://planet.openstreetmap.org/ (accessed on 30 January 2023), Open Charge Map at https://openchargemap.org/site/develop/api#/(accessed on 30 January 2023), Open Power System Data at https://open-power-system-data.org/ (accessed on 30 January 2023), and IQAir at https://www.iqair.com/air-pollution-data-api (accessed on 30 January 2023). The community or measuring stations update the data of the platforms over time to synchronize to the actual state reliably.

Conflicts of Interest

D.Z., S.W., J.K., and M.L. declare no conflict of interest. F.d.D., M.U., A.-B.A., E.N., and G.C. are or were employees of the E.ON Digital Technology GmbH and involved in developing the Sustainability Mirror as a web-based platform. All E.ON employees received a salary for this work. E.ON covered the Article Processing Charges for this publication.

References

  1. Brundtland, G.; Khalid, M.; Agnelli, S.; Al-Athel, S.; Chidzero, B.; Fadika, L.; Hauff, V.; Lang, I.; Shijun, M.; Morino de Botero, M.; et al. Our Common Future (’Brundtland report’); Oxford University Press: Oxford, UK, 1987. [Google Scholar]
  2. Transforming our World: The 2030 Agenda for Sustainable Development: A/RES/70/1. Available online: https://sdgs.un.org/2030agenda (accessed on 20 January 2023).
  3. United Nations Sustainable Development. United Nations Conference on Environment & Development: Agenda 21. Available online: https://sustainabledevelopment.un.org/content/documents/Agenda21.pdf (accessed on 30 January 2023).
  4. Wiedmann, T.; Allen, C. City footprints and SDGs provide untapped potential for assessing city sustainability. Nat. Commun. 2021, 12, 3758. [Google Scholar] [CrossRef] [PubMed]
  5. Mascarenhas, A.; Coelho, P.; Subtil, E.; Ramos, T.B. The role of common local indicators in regional sustainability assessment. Ecol. Indic. 2010, 10, 646–656. [Google Scholar] [CrossRef]
  6. Howard, J.; Wheeler, J. What community development and citizen participation should contribute to the new global framework for sustainable development. Community Dev. J. 2015, 50, 552–570. [Google Scholar] [CrossRef]
  7. Fraser, E.D.; Dougill, A.J.; Mabee, W.E.; Reed, M.; McAlpine, P. Bottom up and top down: Analysis of participatory processes for sustainability indicator identification as a pathway to community empowerment and sustainable environmental management. J. Environ. Manag. 2006, 78, 114–127. [Google Scholar] [CrossRef]
  8. Moallemi, E.A.; Bertone, E.; Eker, S.; Gao, L.; Szetey, K.; Taylor, N.; Bryan, B.A. A review of systems modelling for local sustainability. Environ. Res. Lett. 2021, 16, 113004. [Google Scholar] [CrossRef]
  9. Gonzalez Morales, L.; Hsu, Y.C.; Poole, J.; Rae, B.; Rutherford, I. A World that Counts; United Nations: New York, NY, USA, 2014.
  10. Perez, R.; Arturo, J.; Emilsson, C.; Ubaldi, B. Public Governance Policy Papers: Open, Useful and Re-usable data (OURdata) Index: OECD Policy Papers on Public Governance 2019. 2020. Available online: https://www.oecd.org/gov/digital-government/policy-paper-ourdata-index-2019.htm (accessed on 30 January 2023).
  11. Independent Expert Advisory Group. A World a that Counts: Mobilising the Data Revolution for Sustainable Development. 2014. Available online: https://www.undatarevolution.org/wp-content/uploads/2014/11/A-World-That-Counts.pdf (accessed on 30 January 2023).
  12. Choi, J.; Hwang, M.; Kim, G.; Seong, J.; Ahn, J. Supporting the measurement of the United Nations’ sustainable development goal 11 through the use of national urban information systems and open geospatial technologies: A case study of south Korea. Open Geospat. Data Softw. Stand. 2016, 1, 4. [Google Scholar] [CrossRef]
  13. Ness, B.; Urbel-Piirsalu, E.; Anderberg, S.; Olsson, L. Categorising tools for sustainability assessment. Ecol. Econ. 2007, 60, 498–508. [Google Scholar] [CrossRef]
  14. Hák, T.; Janoušková, S.; Moldan, B. Sustainable Development Goals: A need for relevant indicators. Ecol. Indic. 2016, 60, 565–573. [Google Scholar] [CrossRef]
  15. Singh, G.G.; Cisneros-Montemayor, A.M.; Swartz, W.; Cheung, W.; Guy, J.A.; Kenny, T.A.; McOwen, C.J.; Asch, R.; Geffert, J.L.; Wabnitz, C.C.; et al. A rapid assessment of co-benefits and trade-offs among Sustainable Development Goals. Mar. Policy 2018, 93, 223–231. [Google Scholar] [CrossRef]
  16. Wackernagel, M.; Hanscom, L.; Lin, D. Making the Sustainable Development Goals Consistent with Sustainability. Front. Energy Res. 2017, 5, 18. [Google Scholar] [CrossRef] [Green Version]
  17. Ritchie, H.; Roser, M.; Mispy, J.; Ortiz-Ospina, E. Measuring progress towards the Sustainable Development Goals—SDG Tracker. 2018. Available online: https://sdg-tracker.org (accessed on 23 January 2023).
  18. Assmann, D.; Honold, J.; Grabow, B.; Roose, J. Bertelsmann Stiftung.; Bundesinstitut für Bau-, Stadt- und Raumforschung.; Deutscher Landkreistag.; Deutscher Städtetag.; Deutscher Städte- und Gemeindebund.; Deutsches Institut für Urbanistik.; ICLEI European Secretariat.; Rat der Gemeinden und Regionen Europas / Deutsche Sektion. SDG-Indikatoren für Kommunen. Available online: https://www.rgre.de/rgre (accessed on 30 January 2023).
  19. Sachs, J.; Kroll, C.; Lafortune, G.; Fuller, G.; Woelm, F. Sustainable Development Report 2021; Cambridge University Press: Cambridge, UK, 2021. [Google Scholar]
  20. Statistics Division United Nations. SDG Indicators—SDG Indicators. 2022. Available online: https://unstats.un.org/sdgs/dataContacts/ (accessed on 30 January 2023).
  21. Spangenberg, J.H. Hot Air or Comprehensive Progress? A Critical Assessment of the SDGs. Sustain. Dev. 2017, 25, 311–321. [Google Scholar] [CrossRef]
  22. Gusmão Caiado, R.G.; Leal Filho, W.; Quelhas, O.L.G.; Luiz de Mattos Nascimento, D.; Ávila, L.V. A literature-based review on potentials and constraints in the implementation of the sustainable development goals. J. Clean. Prod. 2018, 198, 1276–1288. [Google Scholar] [CrossRef]
  23. McGuinn, J.; Fries-Tersch, E.; Jones, M.; Crepaldi, C.; Masso, M.; Lodovici, M.S.; Drufuca, S.; Gancheva, M.; Geny, B. Social Sustainability—Concepts and Benchmarks. 2020. Available online: https://www.europarl.europa.eu/RegData/etudes/STUD/2020/648782/IPOL_STU(2020)648782_EN.pdf (accessed on 31 January 2023).
  24. Nilsson, M.; Griggs, D.; Visbeck, M. Policy: Map the interactions between Sustainable Development Goals. Nature 2016, 534, 320–322. [Google Scholar] [CrossRef]
  25. Robert, K.W.; Parris, T.M.; Leiserowitz, A.A. What is Sustainable Development? Goals, Indicators, Values, and Practice. Environ. Sci. Policy Sustain. Dev. 2005, 47, 8–21. [Google Scholar] [CrossRef]
  26. Fraisl, D.; Campbell, J.; See, L.; Wehn, U.; Wardlaw, J.; Gold, M.; Moorthy, I.; Arias, R.; Piera, J.; Oliver, J.L.; et al. Mapping citizen science contributions to the UN sustainable development goals. Sustain. Sci. 2020, 15, 1735–1751. [Google Scholar] [CrossRef]
  27. Wolff, S.; Brönner, M.; Held, M.; Lienkamp, M. Transforming automotive companies into sustainability leaders: A concept for managing current challenges. J. Clean. Prod. 2020, 276, 124179. [Google Scholar] [CrossRef]
  28. Engert, S.; Baumgartner, R.J. Corporate sustainability strategy—Bridging the gap between formulation and implementation. J. Clean. Prod. 2016, 113, 822–834. [Google Scholar] [CrossRef]
  29. Kiesnere, A.L.; Baumgartner, R.J. Sustainability management emergence and integration on different management levels in smaller large-sized companies in Austria. Corp. Soc. Responsib. Environ. Manag. 2019, 26, 1607–1626. [Google Scholar] [CrossRef]
  30. Sukitsch, M.; Engert, S.; Baumgartner, R. The Implementation of Corporate Sustainability in the European Automotive Industry: An Analysis of Sustainability Reports. Sustainability 2015, 7, 11504–11531. [Google Scholar] [CrossRef]
  31. Dickinson, J.L.; Shirk, J.; Bonter, D.; Bonney, R.; Crain, R.L.; Martin, J.; Phillips, T.; Purcell, K. The current state of citizen science as a tool for ecological research and public engagement. Front. Ecol. Environ. 2012, 10, 291–297. [Google Scholar] [CrossRef] [Green Version]
  32. United Nations. The Sustainable Development Goals Report 2021; United Nations: New York, NY, USA, 2021.
  33. Zuiderwijk, A.; Hinnant, C.C. Open data policy-making: A review of the state-of-the-art and an emerging research agenda. Inf. Polity 2019, 24, 117–129. [Google Scholar] [CrossRef]
  34. Kuemmerle, T.; Erb, K.; Meyfroidt, P.; Müller, D.; Verburg, P.H.; Estel, S.; Haberl, H.; Hostert, P.; Jepsen, M.R.; Kastner, T.; et al. Challenges and opportunities in mapping land use intensity globally. Curr. Opin. Environ. Sustain. 2013, 5, 484–493. [Google Scholar] [CrossRef] [PubMed]
  35. Saah, D.; Tenneson, K.; Matin, M.; Uddin, K.; Cutter, P.; Poortinga, A.; Nguyen, Q.H.; Patterson, M.; Johnson, G.; Markert, K.; et al. Land cover mapping in data scarce environments: Challenges and opportunities. Front. Environ. Sci. 2019, 7, 150. [Google Scholar] [CrossRef]
  36. Herfort, B.; Lautenbach, S.; Porto de Albuquerque, J.; Anderson, J.; Zipf, A. The evolution of humanitarian mapping within the OpenStreetMap community. Sci. Rep. 2021, 11, 3037. [Google Scholar] [CrossRef] [PubMed]
  37. OpenStreetMap. 2022. Available online: https://www.openstreetmap.org/ (accessed on 31 January 2023).
  38. Lilley, S.; Kotter, R.; Evatt, N. A Review of Electric Vehicle Charge Point Map Websites in the NSR: Interim Report. 2013. Available online: http://e-mobility-nsr.eu/fileadmin/userupload/downloads/info-pool/ReviewofNSRchargepointmapsinterimreportJune2013final.pdf (accessed on 30 January 2022).
  39. Wiese, F.; Schlecht, I.; Bunke, W.D.; Gerbaulet, C.; Hirth, L.; Jahn, M.; Kunz, F.; Lorenz, C.; Mühlenpfordt, J.; Reimann, J.; et al. Open Power System Data—Frictionless data for electricity system modelling. Appl. Energy 2019, 236, 401–409. [Google Scholar] [CrossRef]
  40. Klopp, J.M.; Petretta, D.L. The urban sustainable development goal: Indicators, complexity and the politics of measuring cities. Cities 2017, 63, 92–97. [Google Scholar] [CrossRef]
  41. Williams, S.; White, A.; Waiganjo, P.; Orwa, D.; Klopp, J. The digital matatu project: Using cell phones to create an open source data for Nairobi’s semi-formal bus system. J. Transp. Geogr. 2015, 49, 39–51. [Google Scholar] [CrossRef]
  42. Westfall, M.S.; De Villa, V.A. Urban Indicators for Managing Cities; Asian Development Bank: Mandaluyong, Philippines, 2001. [Google Scholar]
  43. Cycling Delivers on the Global Goals. 2016. Available online: https://ecf.com/sites/ecf.com/files/The%20Global%20Goals_internet.pdf (accessed on 31 January 2023).
  44. Horton, D. Environmentalism and the bicycle. Environ. Politics 2006, 15, 41–58. [Google Scholar] [CrossRef]
  45. De Nazelle, A.; Nieuwenhuijsen, M.J.; Antó, J.M.; Brauer, M.; Briggs, D.; Braun-Fahrlander, C.; Cavill, N.; Cooper, A.R.; Desqueyroux, H.; Fruin, S.; et al. Improving health through policies that promote active travel: A review of evidence to support integrated health impact assessment. Environ. Int. 2011, 37, 766–777. [Google Scholar] [CrossRef]
  46. Pucher, J.; Buehler, R. Making cycling irresistible: Lessons from the Netherlands, Denmark and Germany. Transp. Rev. 2008, 28, 495–528. [Google Scholar] [CrossRef]
  47. Winters, M.; Brauer, M.; Setton, E.M.; Teschke, K. Mapping bikeability: A spatial tool to support sustainable travel. Environ. Plan. B Plan. Des. 2013, 40, 865–883. [Google Scholar] [CrossRef]
  48. Krenn, P.J.; Oja, P.; Titze, S. Development of a bikeability index to assess the bicycle-friendliness of urban environments. Open J. Civ. Eng. 2015, 5, 451. [Google Scholar] [CrossRef]
  49. Schmid-Querg, J.; Keler, A.; Grigoropoulos, G. The Munich Bikeability Index: A practical approach for measuring urban bikeability. Sustainability 2021, 13, 428. [Google Scholar] [CrossRef]
  50. Hardinghaus, M.; Nieland, S.; Lehne, M.; Weschke, J. More than Bike Lanes—A Multifactorial Index of Urban Bikeability. Sustainability 2021, 13, 11584. [Google Scholar] [CrossRef]
  51. Kuklina, V.; Sizov, O.; Fedorov, R. Green spaces as an indicator of urban sustainability in the Arctic cities: Case of Nadym. Polar Sci. 2021, 29, 100672. [Google Scholar] [CrossRef]
  52. Heikinheimo, V.; Tenkanen, H.; Bergroth, C.; Järv, O.; Hiippala, T.; Toivonen, T. Understanding the use of urban green spaces from user-generated geographic information. Landsc. Urban Plan. 2020, 201, 103845. [Google Scholar] [CrossRef]
  53. Feltynowski, M.; Kronenberg, J.; Bergier, T.; Kabisch, N.; Łaszkiewicz, E.; Strohbach, M.W. Challenges of urban green space management in the face of using inadequate data. Urban For. Urban Green. 2018, 31, 56–66. [Google Scholar] [CrossRef]
  54. Wysmułek, J.; Hełdak, M.; Kucher, A. The analysis of green areas’ accessibility in comparison with statistical data in Poland. Int. J. Environ. Res. Public Health 2020, 17, 4492. [Google Scholar] [CrossRef]
  55. Becchetti, L.; Fiaschetti, M.; Salustri, F. Let us buy sustainable! The impact of cash mobs on sustainable consumption: Experimental results. J. Clean. Prod. 2021, 317, 128419. [Google Scholar] [CrossRef]
  56. Song, L.; Lim, Y.; Chang, P.; Guo, Y.; Zhang, M.; Wang, X.; Yu, X.; Lehto, M.R.; Cai, H. Ecolabel’s role in informing sustainable consumption: A naturalistic decision making study using eye tracking glasses. J. Clean. Prod. 2019, 218, 685–695. [Google Scholar] [CrossRef]
  57. Fuentes, C. Smart consumers come undone: Breakdowns in the process of digital agencing. J. Mark. Manag. 2019, 35, 1542–1562. [Google Scholar] [CrossRef]
  58. Dyen, M.; Sirieix, L.; Costa, S.; Depezay, L.; Castagna, E. Exploring the dynamics of food routines: A practice-based study to understand households’ daily life. Eur. J. Mark. 2018, 52, 2544–2556. [Google Scholar] [CrossRef]
  59. Fuentes, C.; Cegrell, O.; Vesterinen, J. Digitally enabling sustainable food shopping: App glitches, practice conflicts, and digital failure. J. Retail. Consum. Serv. 2021, 61, 102546. [Google Scholar] [CrossRef]
  60. Hargreaves, T.; Wilson, C.; Hauxwell-Baldwin, R. Learning to live in a smart home. Build. Res. Inf. 2018, 46, 127–139. [Google Scholar] [CrossRef]
  61. Flammini, M.G.; Prettico, G.; Julea, A.; Fulli, G.; Mazza, A.; Chicco, G. Statistical characterisation of the real transaction data gathered from electric vehicle charging stations. Electr. Power Syst. Res. 2019, 166, 136–150. [Google Scholar] [CrossRef]
  62. Nicholas, M.; Hall, D.; Lutsey, N. Quantifying the electric vehicle charging infrastructure gap across US markets. Int. Counc. Clean Transp. 2019, 1–39. Available online: https://theicct.org/publication/quantifying-the-electric-vehicle-charging-infrastructure-gap-across-u-s-markets/ (accessed on 30 January 2023).
  63. Lee, J.; Park, G.L.; Han, Y.; Yoo, S. Big data analysis for an electric vehicle charging infrastructure using open data and software. In Proceedings of the Eighth International Conference on Future Energy Systems, Hong Kong, China, 16–19 May 2017; pp. 252–253. [Google Scholar]
  64. Falchetta, G.; Noussan, M. Electric vehicle charging network in Europe: An accessibility and deployment trends analysis. Transp. Res. Part D Transp. Environ. 2021, 94, 102813. [Google Scholar] [CrossRef]
  65. ACEA. European Automobile Manufacturers’ Association, Making the Transition to Zero-Emission Mobility—2020 Progress Report 2020. 2020. Available online: https://www.acea.auto/publication/making-the-transition-to-zero-emission-mobility-2020-progress-report (accessed on 30 January 2023).
  66. Conti, J.; Holtberg, P.; Diefenderfer, J.; LaRose, A.; Turnure, J.T.; Westfall, L. International Energy Outlook 2016 with Projections to 2040; Technical Report; USDOE Energy Information Administration (EIA): Washington, DC, USA, 2016.
  67. Ozkan, M.B.; Küçük, D.; Buhan, S.; Demirci, T.; Karagoz, P. Large-scale renewable energy monitoring and forecast based on intelligent data analysis. In Handbook of Research on Smart Computing for Renewable Energy and Agro-Engineering; IGI Global: Hershey, PA, USA, 2020; pp. 53–77. [Google Scholar]
  68. Trumpy, E.; Bertani, R.; Manzella, A.; Sander, M. The web-oriented framework of the world geothermal production database: A business intelligence platform for wide data distribution and analysis. Renew. Energy 2015, 74, 379–389. [Google Scholar] [CrossRef]
  69. Punys, P.; Baublys, R.; Kasiulis, E.; Vaisvila, A.; Pelikan, B.; Steller, J. Assessment of renewable electricity generation by pumped storage power plants in EU Member States. Renew. Sustain. Energy Rev. 2013, 26, 190–200. [Google Scholar] [CrossRef]
  70. Kelsey, N.; Meckling, J. Who wins in renewable energy? Evidence from Europe and the United States. Energy Res. Soc. Sci. 2018, 37, 65–73. [Google Scholar] [CrossRef]
  71. Tan, X.; Han, L.; Zhang, X.; Zhou, W.; Li, W.; Qian, Y. A review of current air quality indexes and improvements under the multi-contaminant air pollution exposure. J. Environ. Manag. 2021, 279, 111681. [Google Scholar] [CrossRef]
  72. Benammar, M.; Abdaoui, A.; Ahmad, S.H.; Touati, F.; Kadri, A. A modular IoT platform for real-time indoor air quality monitoring. Sensors 2018, 18, 581. [Google Scholar] [CrossRef]
  73. Büke, T.; Köne, A.Ç. Assessing air quality in Turkey: A proposed, air quality index. Sustainability 2016, 8, 73. [Google Scholar] [CrossRef]
  74. World Air Quality Report: Region & City PM2.5 Ranking. 2020. Available online: https://www.iqair.com/world-most-polluted-cities/world-air-quality-report-2020-en.pdf (accessed on 31 January 2023).
  75. European Commission. Statistical Office of the European Union. In Statistical Regions in the European Union and Partner Countries: NUTS and Statistical Regions 2021: 2022 Edition; Publications Office: Luxembourg, 2022. [Google Scholar]
  76. City of Augsburg. Zukunftsleitlinien für Augsburg [Future guidelines for Augsburg]; Technical Report; City of Augsburg: Augsburg, Germany, 2015. [Google Scholar]
  77. Stamm, N. Auswertung der Nachhaltigkeitseinschätzungen für Beschlussvorlagen des Augsburger Stadtrats [Evaluation of Sustainability Assessments for Draft Resolutions of the Augsburg City Council]; Technical Report; City of Augsburg: Augsburg, Germany, 2020. [Google Scholar]
  78. Bonn City Hall. Nachhaltigkeitsbericht der Stadt Bonn 2016–2018 [Sustainability Report of the City of Bonn 2016-2018]; Technical Report; Bonn City Hall: Bonn, Germany, 2018. [Google Scholar]
  79. Krapf, S.; Kemmerzell, N.; Uddin, S.K.H.; Vázquez, M.H.; Netzler, F.; Lienkamp, M. Towards Scalable Economic Photovoltaic Potential Analysis Using Aerial Images and Deep Learning. Energies 2021, 14, 3800. [Google Scholar] [CrossRef]
Figure 1. Data collectors per SDG from the SDG-Tracker.
Sustainability 15 03203 g001
Figure 2. Concept overview to bridge local initiatives to the national SDG framework. Currently, there are no common targets on the community level (shown with ???).
Sustainability 15 03203 g002
Figure 3. Complete data extraction and indicator derivation process.
Sustainability 15 03203 g003
Figure 4. Process from OSM data to the public transportation indicator.
Sustainability 15 03203 g004
Figure 10. Process from IQAir data to the air quality indicator.
Sustainability 15 03203 g010
Figure 11. Comparison of the different indicators on a town level, using Bonn and Augsburg as examples.
Sustainability 15 03203 g011
Figure 12. Results of the developed indicators for Germany, visualized according to the spatial distribution. Because extreme values interfere with the visualization, all values between the 5% (score of 1) and 95% (score of 5) percentile are shown.
Sustainability 15 03203 g012
Figure 13. Distribution of the developed indicators for Germany. Because extreme values interfere with the visualization, all values between the 5% (score of 1) and 95% (score of 5) percentile are shown.
Sustainability 15 03203 g013
Table 1. Rating of the data sources according to the proposed metrics.
Data SourceIntegrityTransparencyEffort
OSMSustainability 15 03203 i001Sustainability 15 03203 i002Sustainability 15 03203 i002
OCMSustainability 15 03203 i002Sustainability 15 03203 i002Sustainability 15 03203 i002
OPSDSustainability 15 03203 i002Sustainability 15 03203 i002Sustainability 15 03203 i002
IQAirSustainability 15 03203 i002Sustainability 15 03203 i003Sustainability 15 03203 i002
Sustainability 15 03203 i004 low to Sustainability 15 03203 i002 high integrity | Sustainability 15 03203 i004 low to Sustainability 15 03203 i002 high transparency | Sustainability 15 03203 i004 high to Sustainability 15 03203 i002 less effort.
Table 2. Proxy indicators and their data sources chosen in this publication.
IndicatorData SourceSDGEconomicEnvironmentalSocial
Public TransportationOSM1, 9, 10, 11, 13Sustainability 15 03203 i002Sustainability 15 03203 i003Sustainability 15 03203 i002
Bike Lane Density3, 9, 11, 13Sustainability 15 03203 i004Sustainability 15 03203 i002Sustainability 15 03203 i003
Green Areas 3, 11, 13, 15Sustainability 15 03203 i004Sustainability 15 03203 i002Sustainability 15 03203 i002
Sustainable Consumption 8, 12Sustainability 15 03203 i003Sustainability 15 03203 i004Sustainability 15 03203 i002
E-Mobility InfrastructureOCM7, 9, 11, 12Sustainability 15 03203 i002Sustainability 15 03203 i002Sustainability 15 03203 i003
Green EnergyOPSD7, 8, 12Sustainability 15 03203 i003Sustainability 15 03203 i002Sustainability 15 03203 i002
Air QualityIQAir3, 11, 13, 15Sustainability 15 03203 i004Sustainability 15 03203 i002Sustainability 15 03203 i003
Sustainability 15 03203 i004 no relation | Sustainability 15 03203 i003 indirect relation | Sustainability 15 03203 i002 direct relation.
Disclaimer/Publisher’s Note: The statements, opinions and data contained in all publications are solely those of the individual author(s) and contributor(s) and not of MDPI and/or the editor(s). MDPI and/or the editor(s) disclaim responsibility for any injury to people or property resulting from any ideas, methods, instructions or products referred to in the content.

