
Turbo-Roundabouts as an Instrument for Improving the Efficiency and Safety in Urban Area: An Italian Case Study

Department of Civil Engineering and Architectural, University of Catania, Viale Andrea Doria, 6, 95125 Catania, Italy
*
Author to whom correspondence should be addressed.
Sustainability 2023, 15(4), 3223; https://doi.org/10.3390/su15043223
Submission received: 30 December 2022
/
Revised: 20 January 2023
/
Accepted: 7 February 2023
/
Published: 10 February 2023
(This article belongs to the Special Issue Traffic Calming Measures as an Instrument for Revitalizing the Urban Environment)
Abstract
:In recent years, numerous turbo-roundabouts have been built in many European countries. To date, there are no turbo-roundabouts in Italy and even the regulations do not provide for their implementation. Turbo-roundabouts are considered the ideal alternative to multi-lane roundabouts as they have numerous advantages. However, they offer better operational performance only for specific traffic flow distributions. This research used the case study of an important and complex urban arterial road in eastern Sicily, Italy, to compare the operational and safety performance between multi-lane roundabouts and turbo-roundabouts. The evaluations were carried out with two simulation software: (1) AIMSUN Next 20.0.1 (operational performance); (2) SSAM 3.0 (safety performance). The results show that at medium/low traffic volumes, multi-lane roundabouts are significantly superior to turbo-roundabouts in terms of operational performance. At high traffic volumes, the operational performance of turbo-roundabouts improves significantly. As regards the safety parameters, for turbo-roundabouts there is always an increase in the TTC and PET, a reduction in maximum speeds and decelerations. There is also a significant decrease in conflict points. Ultimately, the safety and efficiency performance of turbo-roundabouts should: (1) Encourage administrations to replace the multi-lane roundabouts (illegal in Italy) with turbo-roundabouts; (2) encourage Italian legislators to revise intersection design legislation to include turbo-roundabouts among possible design solutions.
1. Introduction
The problem of road congestion is relatively new, although strongly felt. The roads that were built until the first half of the last century, especially in urban and peri-urban areas, were not designed for high traffic volumes. Intersections were (and still are) crossings between two or more different streets, and the few motor vehicles that used them initially did not cause congestion problems.
With the increase in circulating vehicles, roads in many urban contexts have become “in crisis”, unable to accommodate and manage the growing flows of urban traffic. It has therefore been necessary to regulate the busiest intersections by more complex means than simple “Stop” or “Yield” signs.
Hence the proliferation of signals that allow you to give the green light to all traffic flows in turn, also based on mutual consistency in terms of traffic volume. This device has evolved over time, so that today we have very complex traffic light systems that, for example, change the green time depending on the length of the queues to be reduced, or give the green light when a bus is approaching (to speed up its journey), or are activated only when vehicles are approaching, all automatically.
However, in numerous cases, the use of roundabouts has been shown to improve intersection functionality, in terms of the number of vehicles that can be handled in the reference time unit. Roundabouts do not require traffic signal control; the traffic rule states that before entering the roundabout, arriving vehicles must give priority to vehicles already in the same roundabout. This type of regulation generally reduces the average waiting times of vehicles compared to traffic light regulation, and thus reduces the queues along the roads converging to the intersection.
In addition to improving vehicular traffic, roundabouts can also provide important safety and environmental benefits [1]. In terms of road safety, it should be noted that the presence of roundabouts significantly slows down approaching vehicles in terms of their travel speed, so that collisions between vehicles at a roundabout are much less frequent and less violent than collisions at signalized intersections (where the intersecting roads are straight ahead). In addition, conflict points are significantly reduced compared to standard intersections, and in particular, roundabouts do not have intersection conflict points. Roundabouts can therefore be considered traffic calming measures in all respects, and as such are particularly useful in urban contexts where they are appreciated by all categories of road users [2,3].
However, as far as the environmental aspect is concerned, it should be borne in mind that roundabouts allow a reduction in pollutant emissions and noise caused by road traffic due to the smoother movement of vehicles (less braking, less time spent standing with the engine running, etc.) [4].
Therefore, roundabouts are design solutions that contribute to the revitalization of the urban environment [5]. It should be noted, however, that the above benefits are mainly realized at single-lane roundabouts. The main international regulations, including the Italian one, prohibit the construction of roundabouts with more than one lane on the circulatory roadway. Nevertheless, a great many two-lane (and even three-lane) roundabouts are still used in infrastructural contexts around the world today. The main disadvantage of the above configurations is the creation of dangerous intersection conflict points on the circulatory roadway, which do not exist in the single-lane configurations (Figure 1).
For these reasons, many countries are looking for a solution as to what to do with their existing “standard” multi-lane roundabouts in order to improve the level of traffic safety and capacity. In the last years, many countries of northern Europe (such as the Netherlands, Poland, Czech Republic, Germany, Slovenia, and the UK) have solved the problems of low traffic safety and capacities of existing “standard” multi-lane roundabouts by adopting some alternative types of roundabouts, which decrease the number of conflict points. One of them is the turbo-roundabout [6].
The turbo-roundabout is an innovative scheme of the two-lane roundabout. Professor L.G.H. Fortuijn first introduced it the late 1990s as a safer and more efficient alternative to the standard multi-lane roundabouts. The first turbo-roundabout was built in the Netherlands in 1998. At the turbo-roundabout the traffic flows run separately before entry into the roundabout, they occupy separate lanes within circulatory roadway, and traffic flows are also separate at the exit from the roundabout. Physical separation is obtained through delineators, that is specially-shaped elements, which hinder change of traffic lanes in the various elements making up the roundabout. Therefore, turbo-roundabouts’ defining characteristic are physical barriers between circular lanes. Drivers have to choose an entry lane on the approach leg to the roundabout, based on opportune lane markings. This brings an undeniable advantage for user safety, i.e., the number of conflict points on turbo-roundabouts is lower than on multi-lane roundabouts (Figure 1). Two-lane roundabouts have 24 conflict points, whereas turbo-roundabout have only 14 (4 crossing, 4 diverging, and 6 merging conflict points) [6,7].
This study compared the performance of multi-lane roundabouts and turbo-roundabouts in terms of efficiency and safety. For this purpose, two pieces of microsimulation software (AIMSUN Next and SSAM) provided by the Department of Civil Engineering and Architecture of the University of Catania were used and their specificities are explained in Section 3.3.
Roundabouts characterized by the presence of more than one lane on the circulatory roadway are not allowed by Italian law. However, many roundabouts from before 2006 (the year in which the regulations for road intersections were published) that are still in operation have a double lane on the circulatory roadway, and it is desirable that they be adapted with more suitable design solutions to ensure, above all, a higher level of safety. In this study, therefore, a case study is proposed referring to a design configuration in the urban context of the city of Catania (Italy), characterized by the presence of a series of multi-lane roundabouts. The peculiarity of this study is that we did not want to perform a performance comparison with respect to single roundabouts, but considered a whole road section where two roundabouts (“multi-lane” in the existing configuration and “turbo” in the design hypothesis) were the main intersections of a road infrastructure, called “Circonvallazione”, characterized by a high traffic volume.
2. Literature Review
In the scientific literature, in addition to the aforementioned reduction of conflict points compared to multi-lane roundabouts, turbo-roundabouts are consistently attributed with various advantages in terms of safety [6,7,8,9,10] even if specific accidents occur there [11]. In particular: (1) the number of conflict points on turbo-roundabouts is lower than on multi-lane roundabouts (Figure 1). Two-lanes roundabouts have 24 conflict points, whereas turbo-roundabout have only 14 (4 crossing, 4 diverging, and 6 merging conflict points); (2) improper lane changes and illegal turns can be significantly avoided; (3) the physical separation of lanes leads to optimum utilization of entry and circulatory lanes, which, in turn, can boost capacity; (4) the spiral road markings in conjunction with the raised lane dividers promote low driving speed; (5) major-road vehicles are limited to cross one circulating lane, as opposed to two circulating lanes in case of minor-road vehicles. Thus, more major-road vehicles can be processed through available critical gaps within the circulatory lanes.
On the contrary, there are some disadvantages that could have a negative impact on operational performance: (a) U-turns are not allowed on minor approaches of basic turbo-roundabouts; (b) passing vehicles on minor approaches are forced to use only the left entry lane, resulting in less flexibility than offered to arriving drivers on main approaches. The impact of the aforementioned disadvantages on traffic operation is mainly dependent on volumes and proportions of vehicular traffic movements of minor legs [6,7].
Other research shows that turbo-roundabouts have a greater capacity than single-lane roundabouts [12], while, depending on the geometric organization and the traffic flows, it could be less than that of multi-lane roundabouts [13]. Choosing the best design solution may sometimes require the use of simulation software that represents, analyzes, and predicts the behavior of vehicle traffic at the site under study. These software offer different levels of detail for analysis:
- macroscopic; treat stationary and aggregated values,
- mesoscopic; study the temporal evolution of all the variables and,
- microscopic; intermediate level between the two previously-mentioned levels.
There are various, mainly commercial, microsimulation software for evaluating the operational performance of the individual components of the road network and the road network as a whole. Among the main microsimulation software tested in research conducted around the world, which have proven reliable and are now widely used and consolidated in the context of roundabout performance characterization, are the following:
- VISSIM, developed by Planung Transport Verkehr (PTV), a German company, is a microscopic simulation program for modeling multimodal transport operations. VISSIM is characterized by a discrete, stochastic, and time step-based model in which vehicle units are represented as individual entities.
- AIMSUN Next, developed by Siemens (one of the largest manufacturers of signal control systems), is capable of generating various traffic conditions based on either stochastic route choice or dynamic user equilibrium.
- PARAMICS, developed by Quadstone Limited, a Scottish company, is a software for modeling the movement and behavior of individual vehicles and transit on local and regional freeway networks.
- TRITONE, developed by University of Calabria, is an open-source platform that also allows the evaluation of traffic safety performance through a set of indicators that represent the interactions in real time between different pairs of vehicles of the traffic flow.
Table 1 shows the advantages and disadvantages of each of the above-mentioned software, based on the results of the studies conducted by different researchers [14,15,16,17,18,19,20,21,22,23,24,25,26,27,28,29].
In one study, PARAMICS microsimulation software was used to investigate the operational performance of a two-lane turbo-roundabout and a three-lane traditional roundabout. The authors concluded that the turbo-roundabout had a 12–20% higher capacity [30]. Other authors evaluated the performance of multi-lane roundabouts using KREISEL 7.0 software. The results showed that turbo-roundabouts were able to achieve higher capacity in most cases regardless of the saturation level [31].
Analysis of a turbo-roundabout and an existing two-lane roundabout in Bogotà, Colombia, using VISSIM showed that converting a two-lane roundabout to a turbo-roundabout resulted in a 7% increase in overall capacity [32]. Similarly, a study of the effects of converting an existing two-lane roundabout to a basic turbo-roundabout in Portugal concluded that the total capacity of conventional roundabouts was nearly 3% lower [33].
By using a Dutch capacity model, the Multilane Roundabout Explorer, it was shown that turbo-roundabouts were superior to traditional roundabouts whenever traffic flow did not exceed the threshold of 3500 pcph. The authors indicated that the capacity improvement of turbo-roundabouts compared with conventional roundabouts ranged from 25% to 35% [34].
Another study found that conventional roundabouts always performed better as long as circulating vehicles did not exceed 700 pcph. However, when circulating traffic exceeded this value and reached up to 3000 pcph, basic turbo-roundabouts became superior and consistently outperformed conventional roundabouts [35].
In contrast, other studies have shown that conventional two-lane roundabouts have 20–30% higher capacity compared to basic turbo-roundabouts. The authors also added that minor approaches of basic turbo-roundabouts perform better in very rare scenarios where more than 60% of the main traffic flow turns right [30,36,37].
Comparison of four alternatives to conventional roundabouts, one of which is a basic turbo-roundabout, showed that turbo-roundabouts perform best when 70% of vehicles turn right on each approach [38].
One study examined three turbo-roundabouts that were designed to replace three existing two-lane roundabouts in Portugal. Results from the AIMSUN microsimulation model showed that turbo-roundabouts were superior to conventional roundabouts when the saturation level was below 70% [39]. The results of a study conducted in Ghana using VISSIM software showed that turbo-roundabouts provided 19% higher capacity than conventional roundabouts [40]. Nevertheless, their minor approaches were always operationally inferior. In a study conducted in Italy, an analytical capacity model was used to evaluate an existing two-lane roundabout with congestion and a turbo-roundabout. The results of the study stated that each approach of a turbo-roundabout can ultimately handle 15–84% more vehicles, depending on traffic volumes and traffic distribution on site [41].
Even in this case, the results still seem unclear and sometimes contradictory. Two studies showed that drivers experience significantly less delay at turbo-roundabouts than at multi-lane roundabouts when most of the traffic flow is through the main approaches [42,43]. However, according to another study, turbo-roundabouts have shorter delays than multi-lane roundabouts when traffic volumes are balanced, although the differences are minimal [31].
The outputs of micro-simulation models can also be used to evaluate the safety level of road networks. This approach can be achieved using SSAM software developed by FHWA, which automates conflict analysis by processing vehicle trajectories (vehicle position, speed and acceleration profiles) generated during simulation.
Therefore, by coupling the micro-simulation performed with software such as VISSIM, AIMSUN Next, PARAMICS, and TRITONE with SSAM, it is possible to study different scenarios from a traffic safety point of view and to quickly evaluate possible measures to improve the safety level of the infrastructure elements of a road network.
Some studies have highlighted some concerns about SSAM, namely: The ability of a simulated trajectory to reflect complex real-world driving behavior, calibration efforts to obtain reliable safety results, or the inability of SSAM to determine the probability that each estimated conflict will result in an accident [44,45,46,47]. Although the SSAM required accurate calibration of the traffic model, some authors nevertheless found reasonable relationships between the conflicts estimated by the SSAM and real accidents [48,49,50,51].
Regarding specifically the application of SSAM to roundabouts, some studies have shown that the values of surrogate safety indicators obtained for the configurations of two-lane roundabouts and turbo-roundabouts are particularly reliable [51,52]. In contrast, the safety indicators obtained for single-lane roundabouts are less reliable [24,51,52,53,54]. A study conducted in Italy has shown that regardless of the traffic micro-simulation model used, the safety parameters obtained with SSAM for single-lane roundabouts show that roundabouts are less safe than other types of intersections [24]. This is in stark contrast to the fact that roundabouts are recognized as the safest intersection types of all possible at-grade intersection configurations.
3. Materials and Methods
The method used in the present study was based on the micro-simulation of different traffic scenarios starting from a specific urban road context characterized by a sequence of standard roundabouts, actually present in Italy. This context was then compared, at the level of performance offered, with a project configuration in which the main intersections were hypothesized as turbo-roundabouts designed according to Dutch regulations (CROW, 2008). In particular, two software programs were used which made it possible to obtain both the outputs related to the operational performance offered to users in all the traffic scenarios considered, and the results related to the performance in terms of safety.
3.1. Site Selection
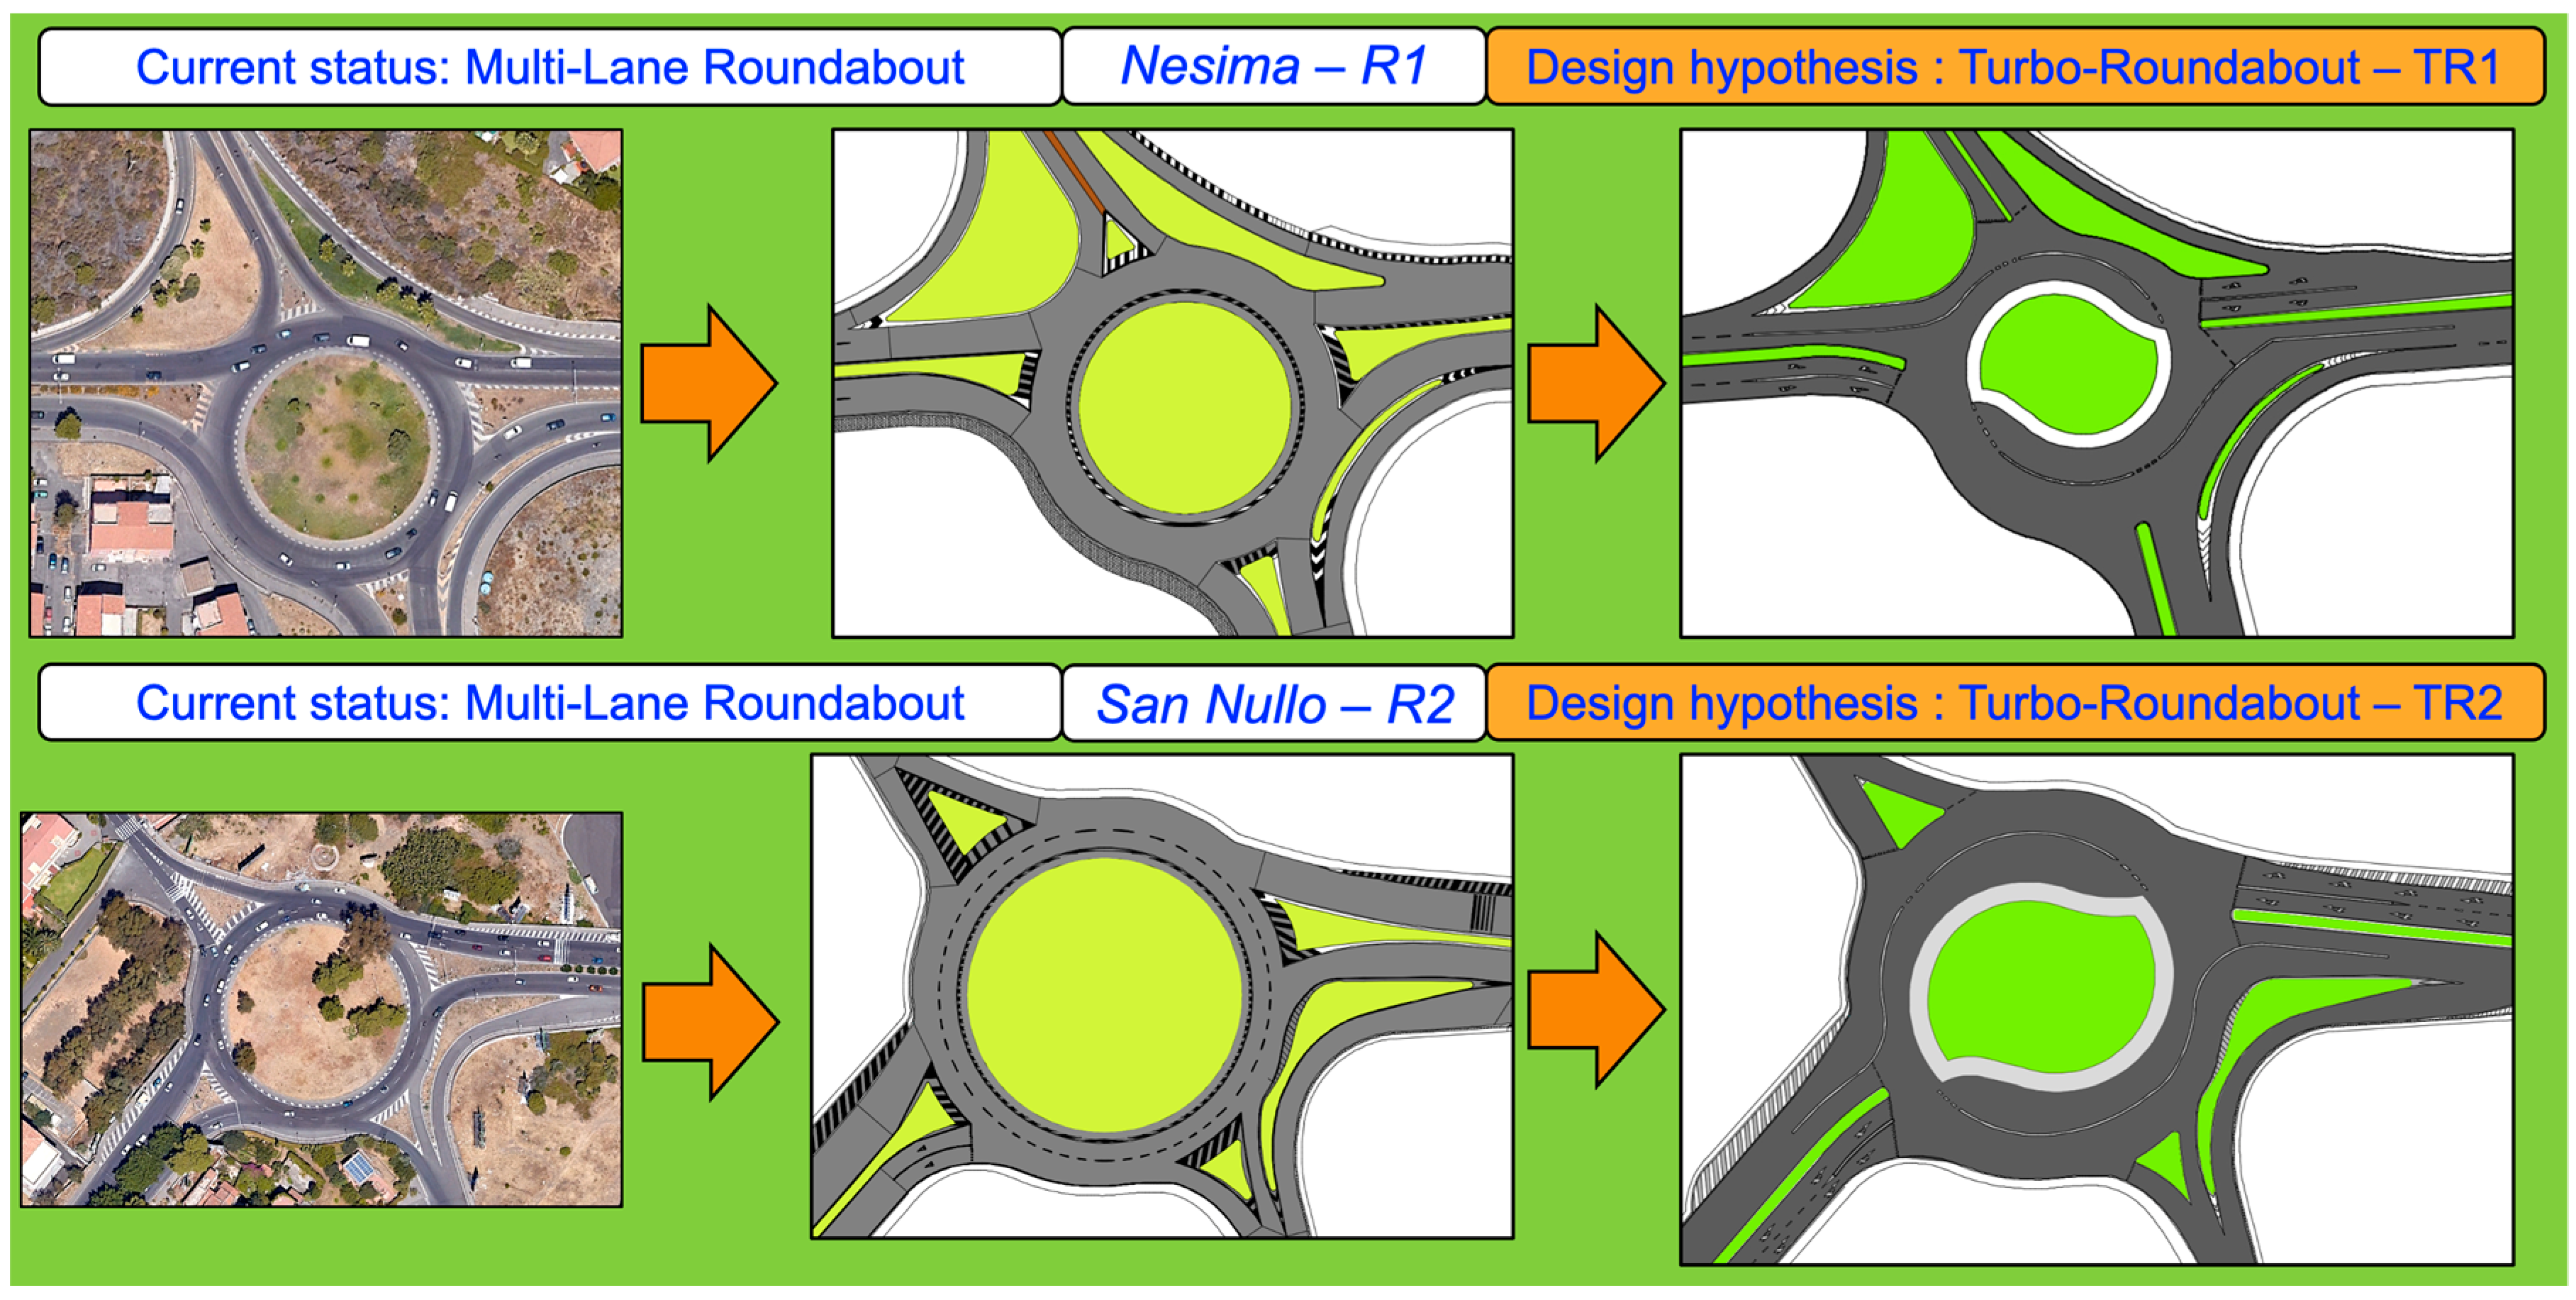
The study context is a road section along the urban artery that forms the ring road of the metropolis of Catania. It is characterized by the presence of two multi-lane roundabouts (only in one of them, however, the horizontal signs separating the two lanes on the circulatory roadway are clearly visible). These two roundabouts are located near the neighborhoods of Nesima and San Nullo. They are about 1.20 km apart and both have a large diameter; the Nesima roundabout (R1) has a diameter of 70 m, while the San Nullo roundabout (R2) has a diameter of 90 m. Between the two roundabouts, almost in the middle, there is a standard intersection (N) with a secondary road called Via Sebastiano Catania. The two roundabouts were first rebuilt in a CAD environment and then redesigned by building two turbo-roundabouts from the central turbo-block based on the literature standard [6,55,56] (Figure 2 and Table 2).
Figure 3 shows the two roundabouts along the road section under consideration and the two alternative design configurations consisting of the TR1 and TR2 turbo-roundabouts.
3.2. Traffic Scenarios
The traffic conditions for the section in question were derived from the preparatory studies for the preparation of the Urban Traffic Plan (PUT) of the City of Catania (2014) and used as a reference for the traffic scenario referred to as “scenario n. 1”. In particular, the peak period from 12:00 to 13:00 was considered, characterized by a total traffic flow of Q1 = 4594 vehicles per hour. In order to compare different traffic conditions and consequently analyze the differences in operational and safety performance, three additional traffic scenarios were defined, characterized by increasing vehicle flows starting at Q1.
In particular, a final scenario (scenario n. 4) was assumed, in which the total traffic flow was increased by 25% compared to scenario n. 1, and 2 other scenarios were defined (scenarios n. 2 and n. 3), among which the 25% increase was fairly distributed.
Finally, for the subsequent simulations, four scenarios were used with the total traffic flow (Qi) values given below:
- Scenario n. 1: Q1 = 4594 vehicles/hour
- Scenario n. 2: Q2 = 4977 vehicles/hour
- Scenario n. 3: Q3 = 5359 vehicles/hour
- Scenario n. 4: Q4 = 5742 vehicles/hour
Figure 4 shows the graph of the analyzed network part.
This graph also shows the 10 centroids used to assign traffic flows to the nodes (intersections) and edges (road segments) of the network.
The street sections of the main street were indicated with capital letters, the side streets with small letters.
3.3. Micro-Simulation Process
The micro-simulation was performed using two pieces of software:
- (1)
- AIMSUN Next for the calculation of the operational performance corresponding to the traffic scenarios described in the previous paragraph;
- (2)
- SSAM for the estimation of the safety indicators, starting from the kinematic parameters associated with all the vehicle trajectories obtained as output of the AIMSUN Next software.
The AIMSUN software and the VISSIM software are both provided by the Department of Civil Engineering and Architecture of the University of Catania. For the present study, the authors preferred the AIMSUN software because, as shown in Section 2 (see in particular Table 1), it is more reliable than VISSIM in generating the most realistic trajectories possible. Since one of the objectives of this study was to also perform the evaluations of the surrogate safety measures, it was decided to use the most appropriate micro-simulation software to create the trajectories compatible with driving on multi-lane roundabouts and turbo-roundabouts.
Moreover, regarding the use of SSAM for the estimation of safety indicators, the authors were encouraged by the good results in the literature (also in Section 2) regarding the reliability of the model in the case of turbo-roundabouts and multi-lane roundabouts.
3.3.1. AIMSUN Model
AIMSUN Next is a software package that is developed by Siemens Business. The basis of this software is a microscopic traffic simulator developed at the Department of Statistics and Operations Research of the Politècnica de Catalunya University by Barceló and Casas (2002), Spain. The structure of AIMSUN can be described in terms of the following two elements:
- (1)
- geometric scheme of the road network.
- (2)
- modelling of vehicle behavior.
The AIMSUN mesoscopic model uses a representation of the road network based on a directed graph consisting of the following three geometric elements:
- Centroids. They are the source of vehicles entering and exiting the network.
- Nodes (intersections). They are treated as node servers in the mesoscopic representation. In the node servers, vehicles are directed from one section to a turning and then to their next section. These turnings connect the lanes of the originating section to the lanes of the destination section. All vehicles are assumed to travel unimpeded, i.e., at free-flow speed, in turnings.
- Edges. They are the segments that connect the nodes. Each edge contains information about its geometry (e.g., the number of lanes, shoulder width, etc.).
- The behavioral models used in AIMSUN are the following:
- Behavioral models in edges: Car-following models and lane-changing models.
- Behavioral models in nodes (intersections): Gap acceptance and lane choice models.
The car-following model is a simplified version of the Gipps car-following model, which is used for the microscopic level and considers two components; deceleration and acceleration. The deceleration and acceleration constraints are simplified to obtain the following expressions [24,57]:
where:
- -
- t = simulation time;
- -
- n = vehicle number ordered by its arrival time on the lane;
- -
- x(t, n) = position of vehicle n at time t;
- -
- Sn = speed of the nth vehicle;
- -
- Sn(max) = maximum speed of the vehicle (the minimum between the desired maximum speed of the vehicle and the maximum speed of the edge);
- -
- EL = effective length of the vehicle (vehicle length plus minimum distance between vehicles);
- -
- d = distance between the vehicles;
- -
- RT = reaction time of the driver of the follower vehicle;
- -
- dc = maximum deceleration of the considered vehicle;
- -
- dc(e) = estimate of the desired deceleration of the leading vehicle;
- -
- d = distance between the vehicles.
The original Gipps car-following model was used to calculate the speed in the next simulation step. In AIMSUN, car-following and lane-change models are used to calculate the edge travel time. The number of vehicles in any segment is limited by the capacity of the edge.
The gap-acceptance model is used to model the give-way behavior. In particular, the model is used to decide which of two vehicles has priority in a conflicting movement in the intersections. It considers the travel time from both vehicles to the collision point, then determines how long it will take the vehicles to clear the intersection, and finally makes the decision.
The maximum give-way time parameters are used to determine when drivers become impatient if they cannot find a gap. If the driver has waited longer than this time, the safety distance—normally set at twice the reaction time—is reduced linearly to zero.
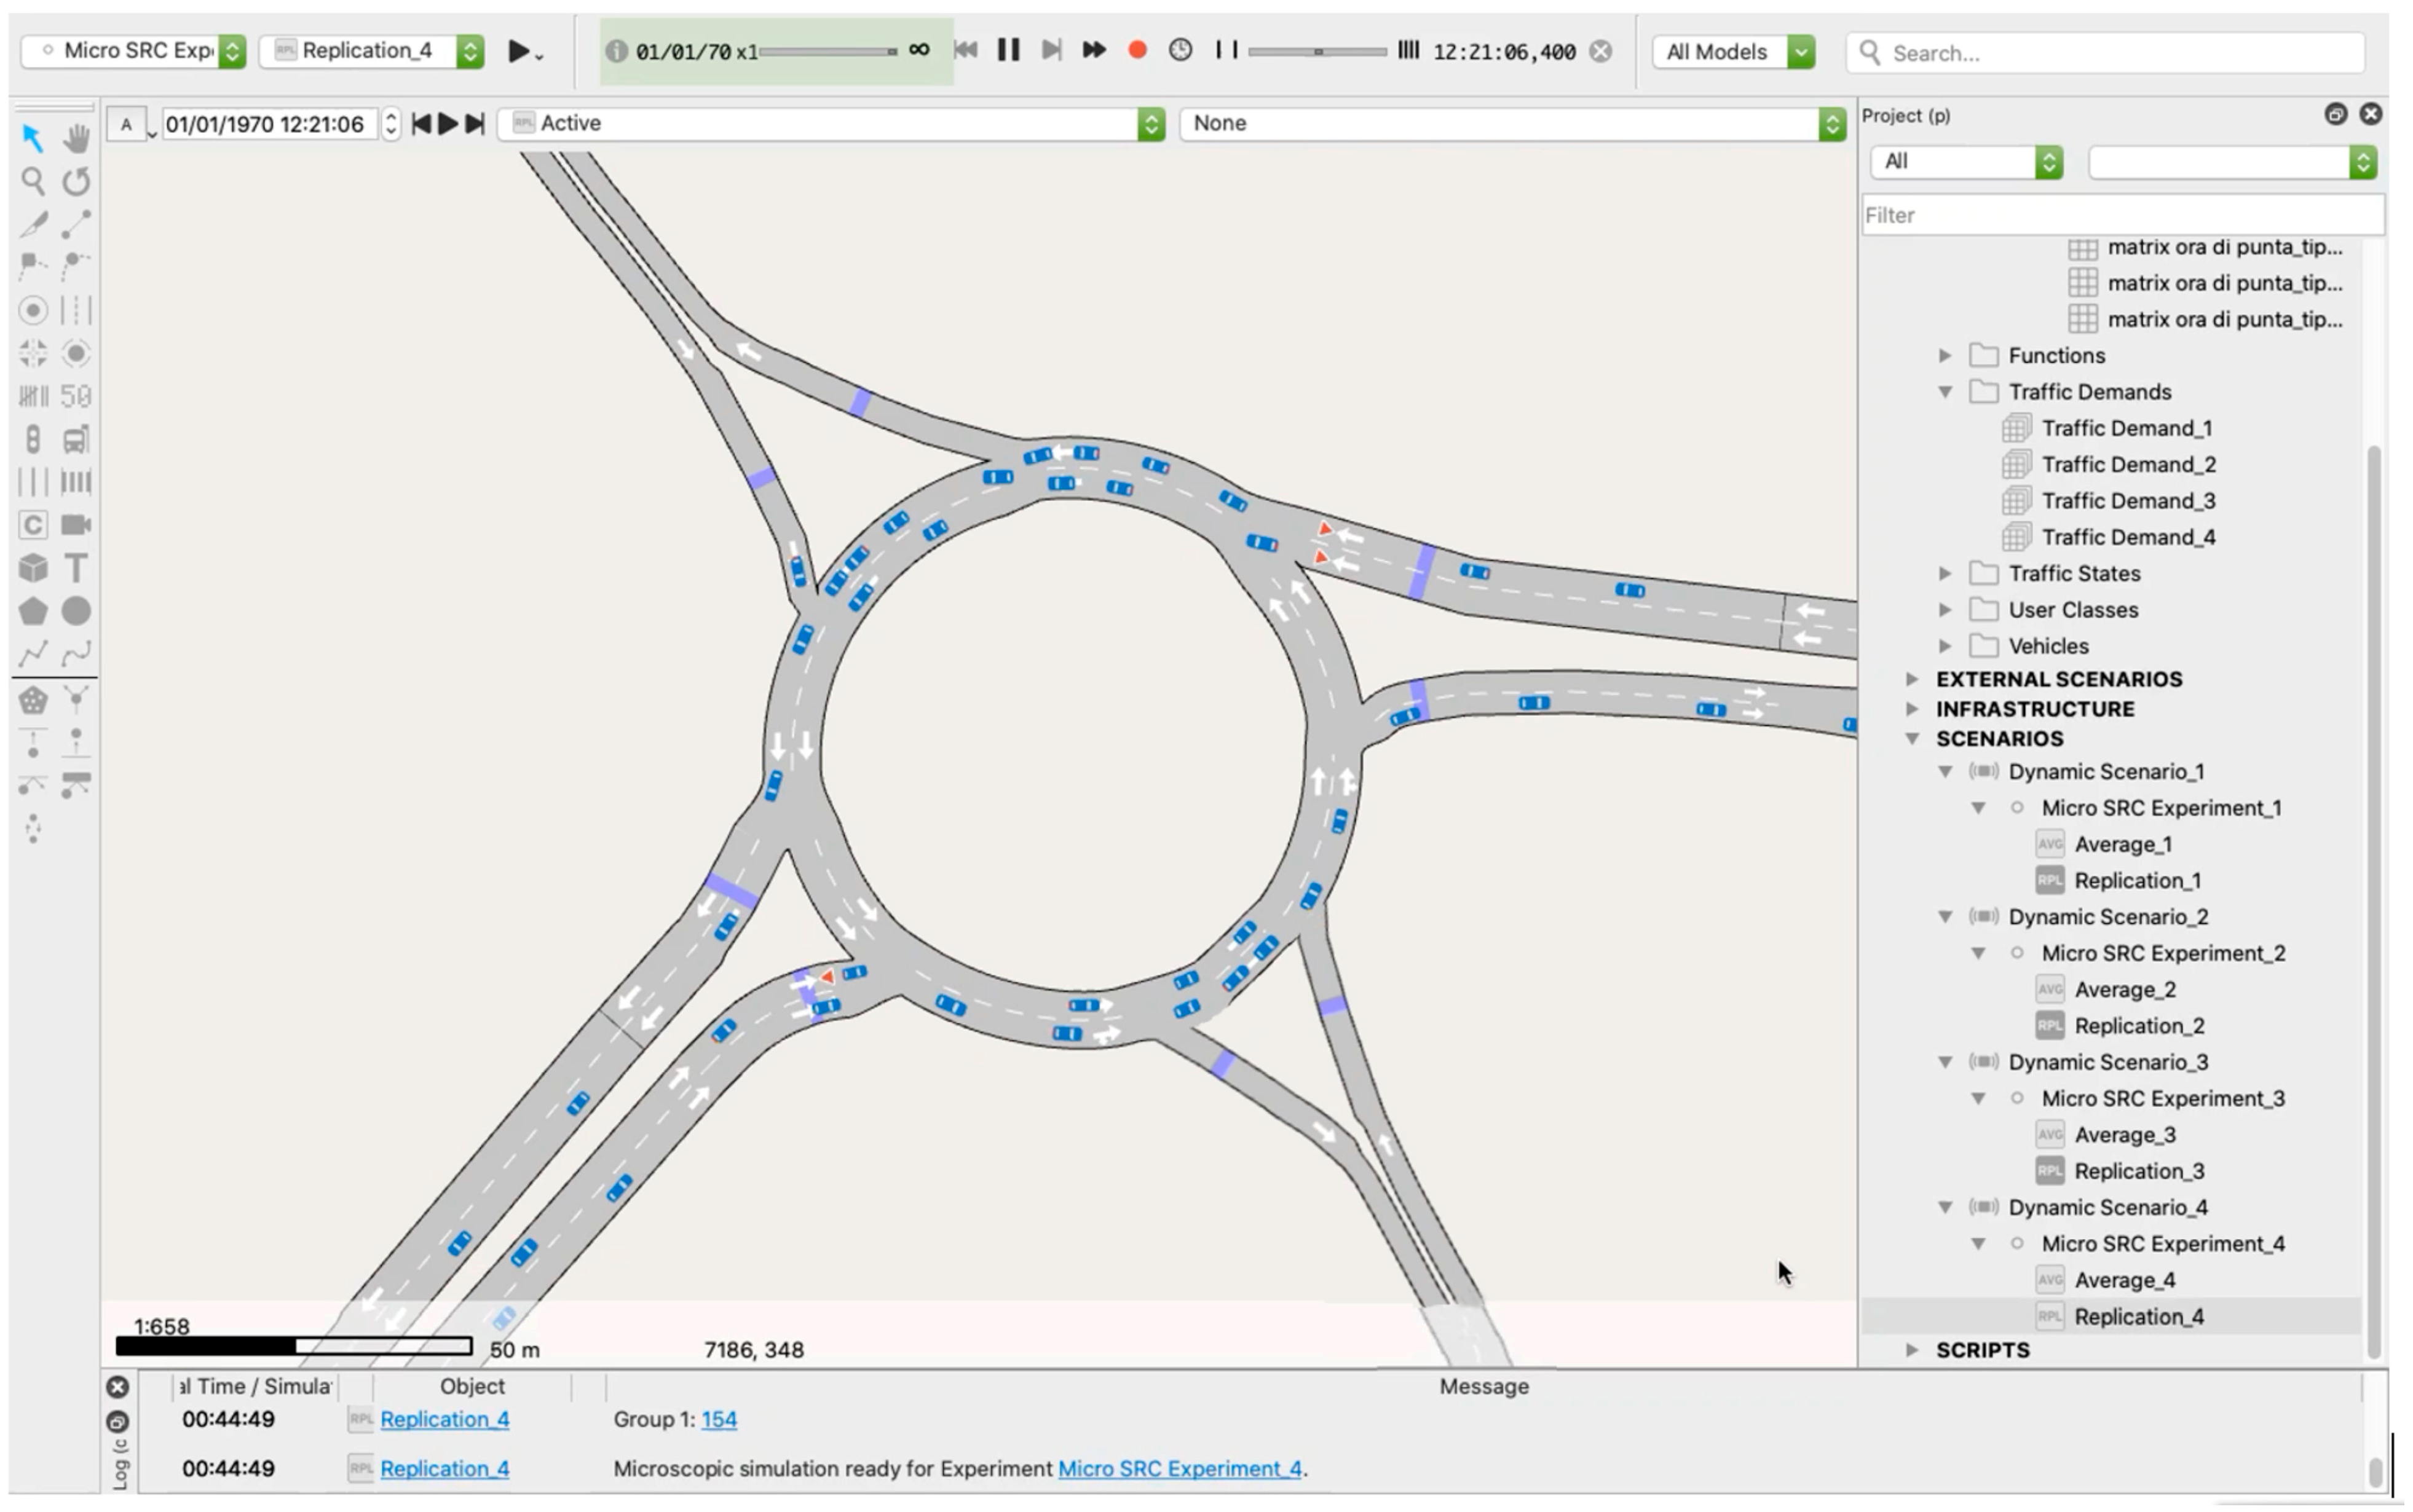
From AIMSUN trajectory files (.trj) are obtained. These files contain the routes and speed changes that drivers adopt in the simulated scenarios (Figure 5).
Among the output data available from AIMSUN Next, the following were considered in this study:
- (1)
- Total number of stops: A stop for a vehicle happens whenever its speed decreases below the queue entry speed and while it remains below the queue exit speed parameter. Once the vehicle speed goes above the queue exit speed parameter the vehicle is no longer considered in a queue nor stopped. A new stop will be added to the number of stops statistics when the vehicle speed goes below queue entry speed again.
- (2)
- Delay Time: Average delay time per vehicle per kilometer (seconds/km). This is the difference between the expected travel time (the time it would take to traverse the system under ideal conditions) and the travel time. It is calculated as the average of all vehicles and then converted into time per kilometer. It does not include the time spent in a virtual queue.
3.3.2. SSAM Model
SSAM (Surrogate Safety Assessment Module) is software developed by Siemens Energy and Automation, Inc. in collaboration with the Federal Highway Administration in 2008. This software uses trajectory data generated by micro-simulators to identify potential conflicts based on the conflict definition specified by the modeler.
A trajectory file is created by the micro-simulator during the model run and contains information about the position and movement of each vehicle. The most important data in the trajectory file can be divided into the following four classes: (1) Dimension, (2) Timestep, (3) Vehicle, (4) Conflict [58,59,60].
- -
- The Dimension class contains information about the spatial characteristics of the rectangular bounding box of the microsimulation environment.
- -
- The Timestep class contains a record of the current time step since the start of the simulation. This variable allows SSAM to position the vehicles in time.
- -
- The Vehicle class contains information about the spatial characteristics of the vehicle and the speed and acceleration values used to predict vehicle motion.
- -
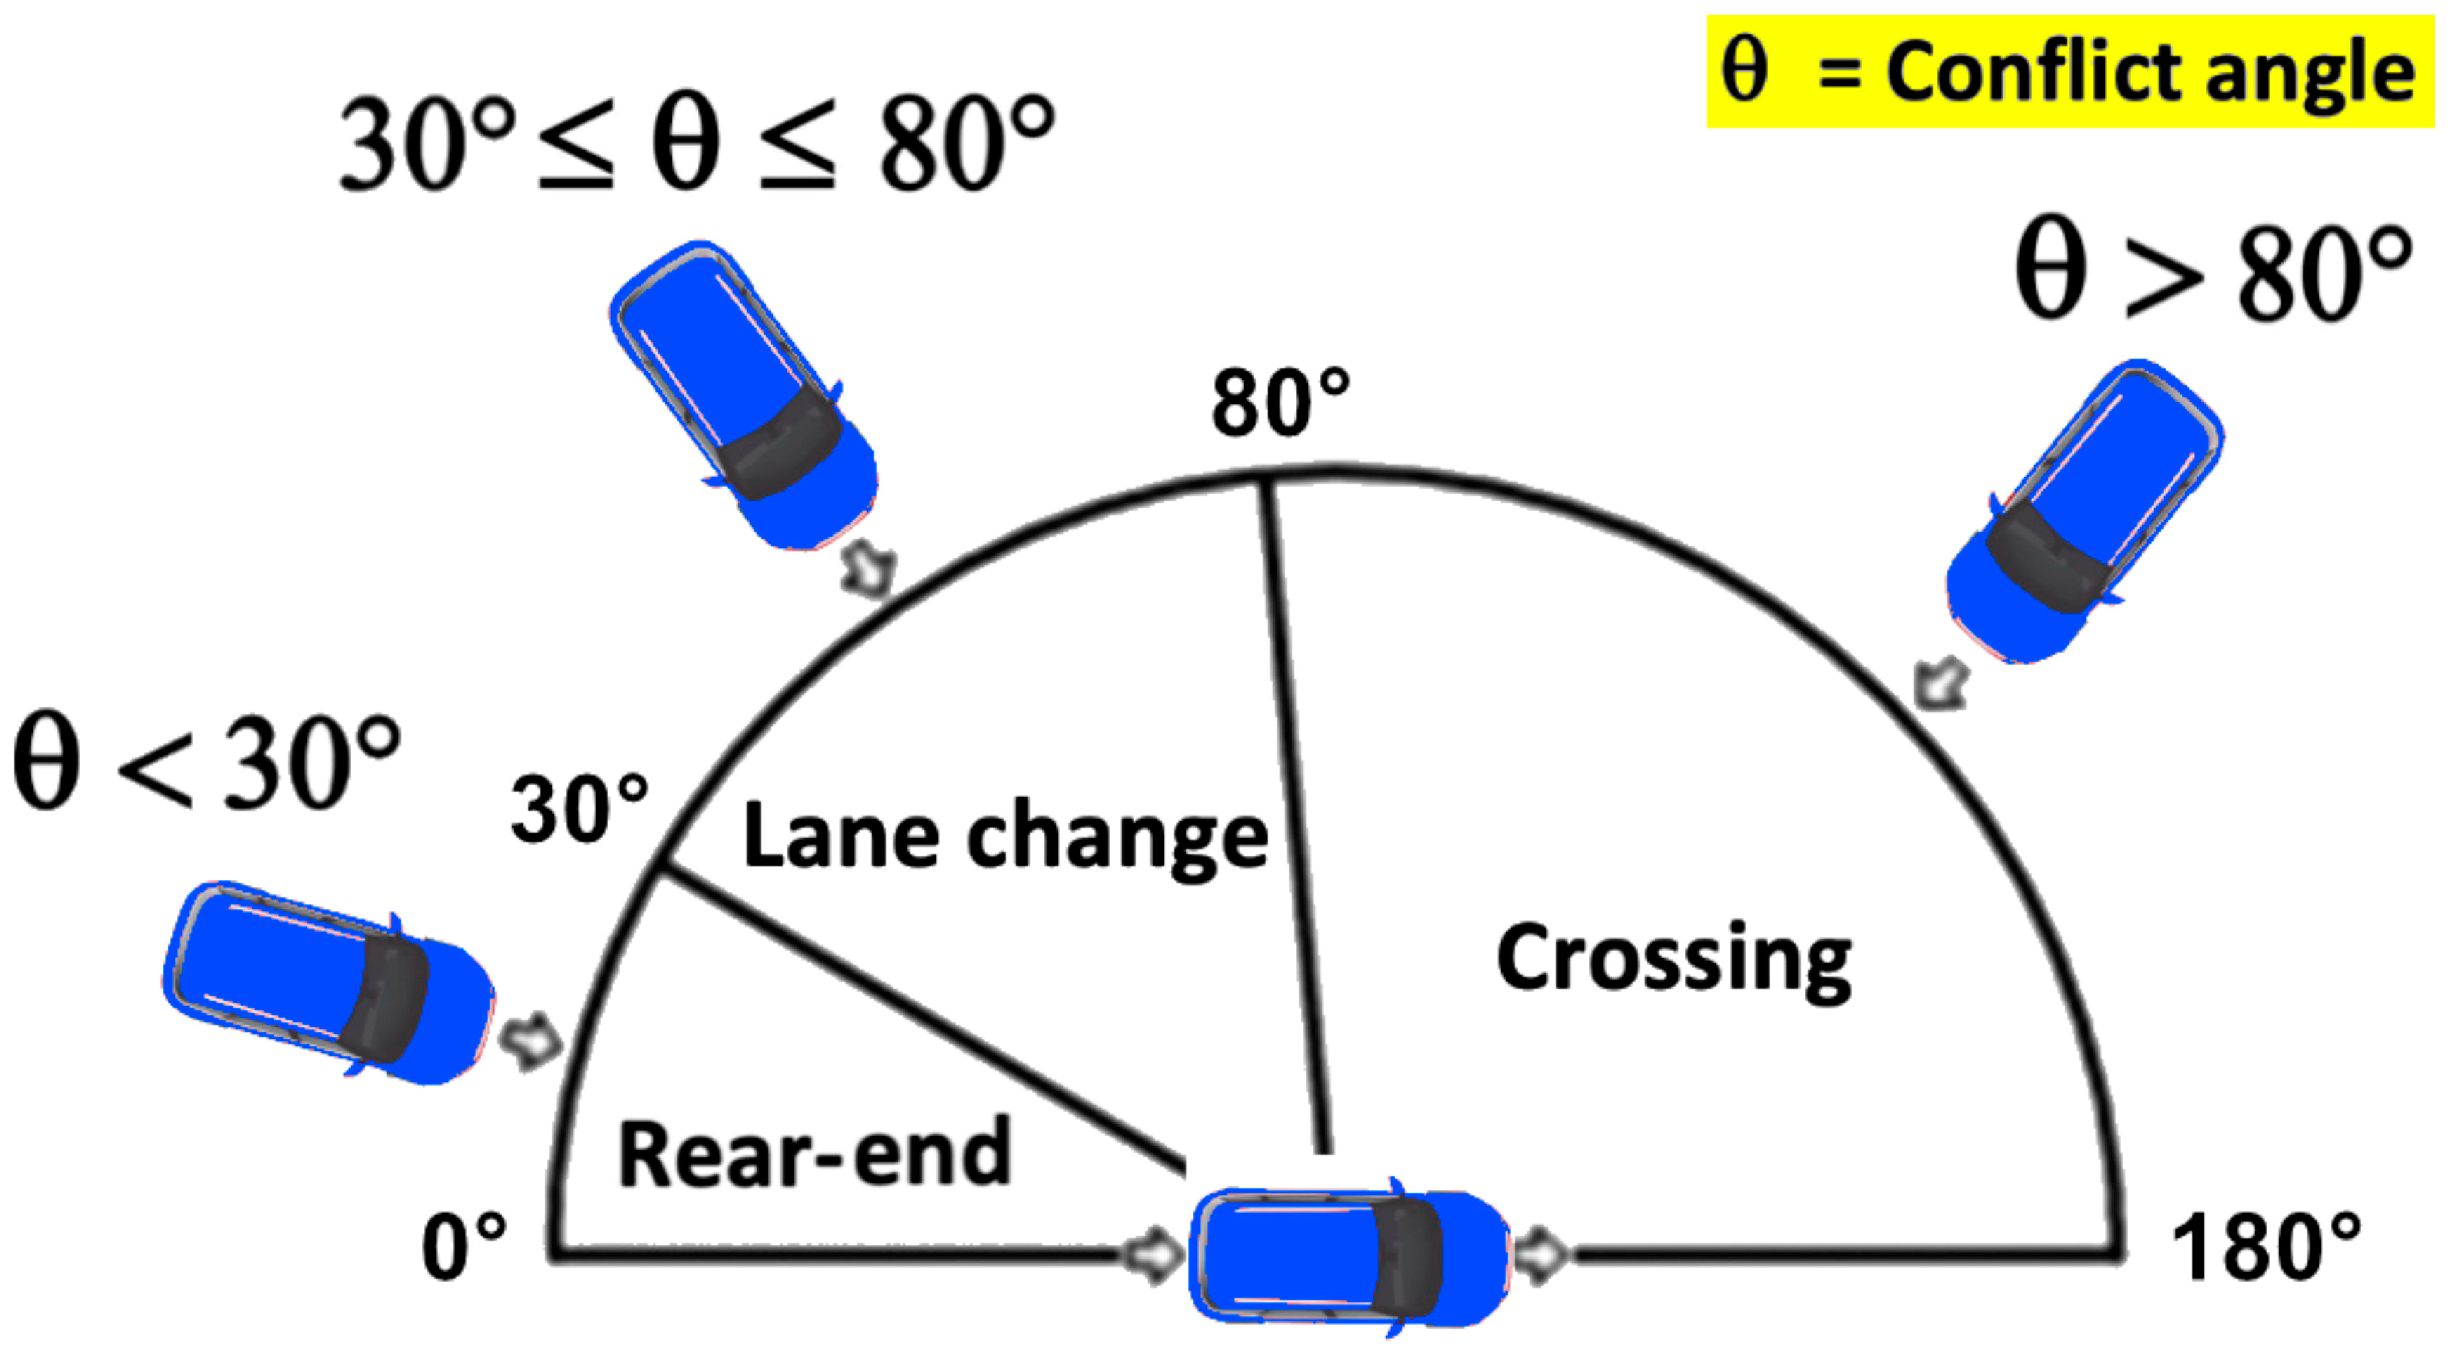
- The Conflict class contains information about the conflict angle, which is an approximate angle for a hypothetical collision between colliding vehicles based on the estimated heading of each vehicle. Depending on the values of this angle, the resulting conflict may be a rear-end collision, a lane change, or crossing movement. Specifically, the rear-end angle is used to define a potential collision when following and lane changing, and the crossing angle defines potential collisions in head-on scenarios, such as maneuvering through an intersection (Figure 6).
Using the four classes of parameters listed above, SSAM can determine whether a vehicle’s trajectory will collide with that of another vehicle and report information about this interaction. This information includes the following surrogate safety measures:
- Maximum speed (MaxS)— the maximum speed (m/s) of two vehicles involved in the conflict event [64].
- Difference in vehicle speeds (DeltaS)—the absolute value of difference in speeds (m/s) of two conflicting vehicles [64].
- Initial Deceleration Rate (DR)—the magnitude of the deceleration action (m/s2) of a driver the moment he begins an evasive braking maneuver [65].
- Maximum deceleration rate (MaxD)—the maximum deceleration (m/s2) of the through vehicle [45].
In this study, four of the six surrogate measures that SSAM reports were used: TTCmin, PET, MaxS and DR.
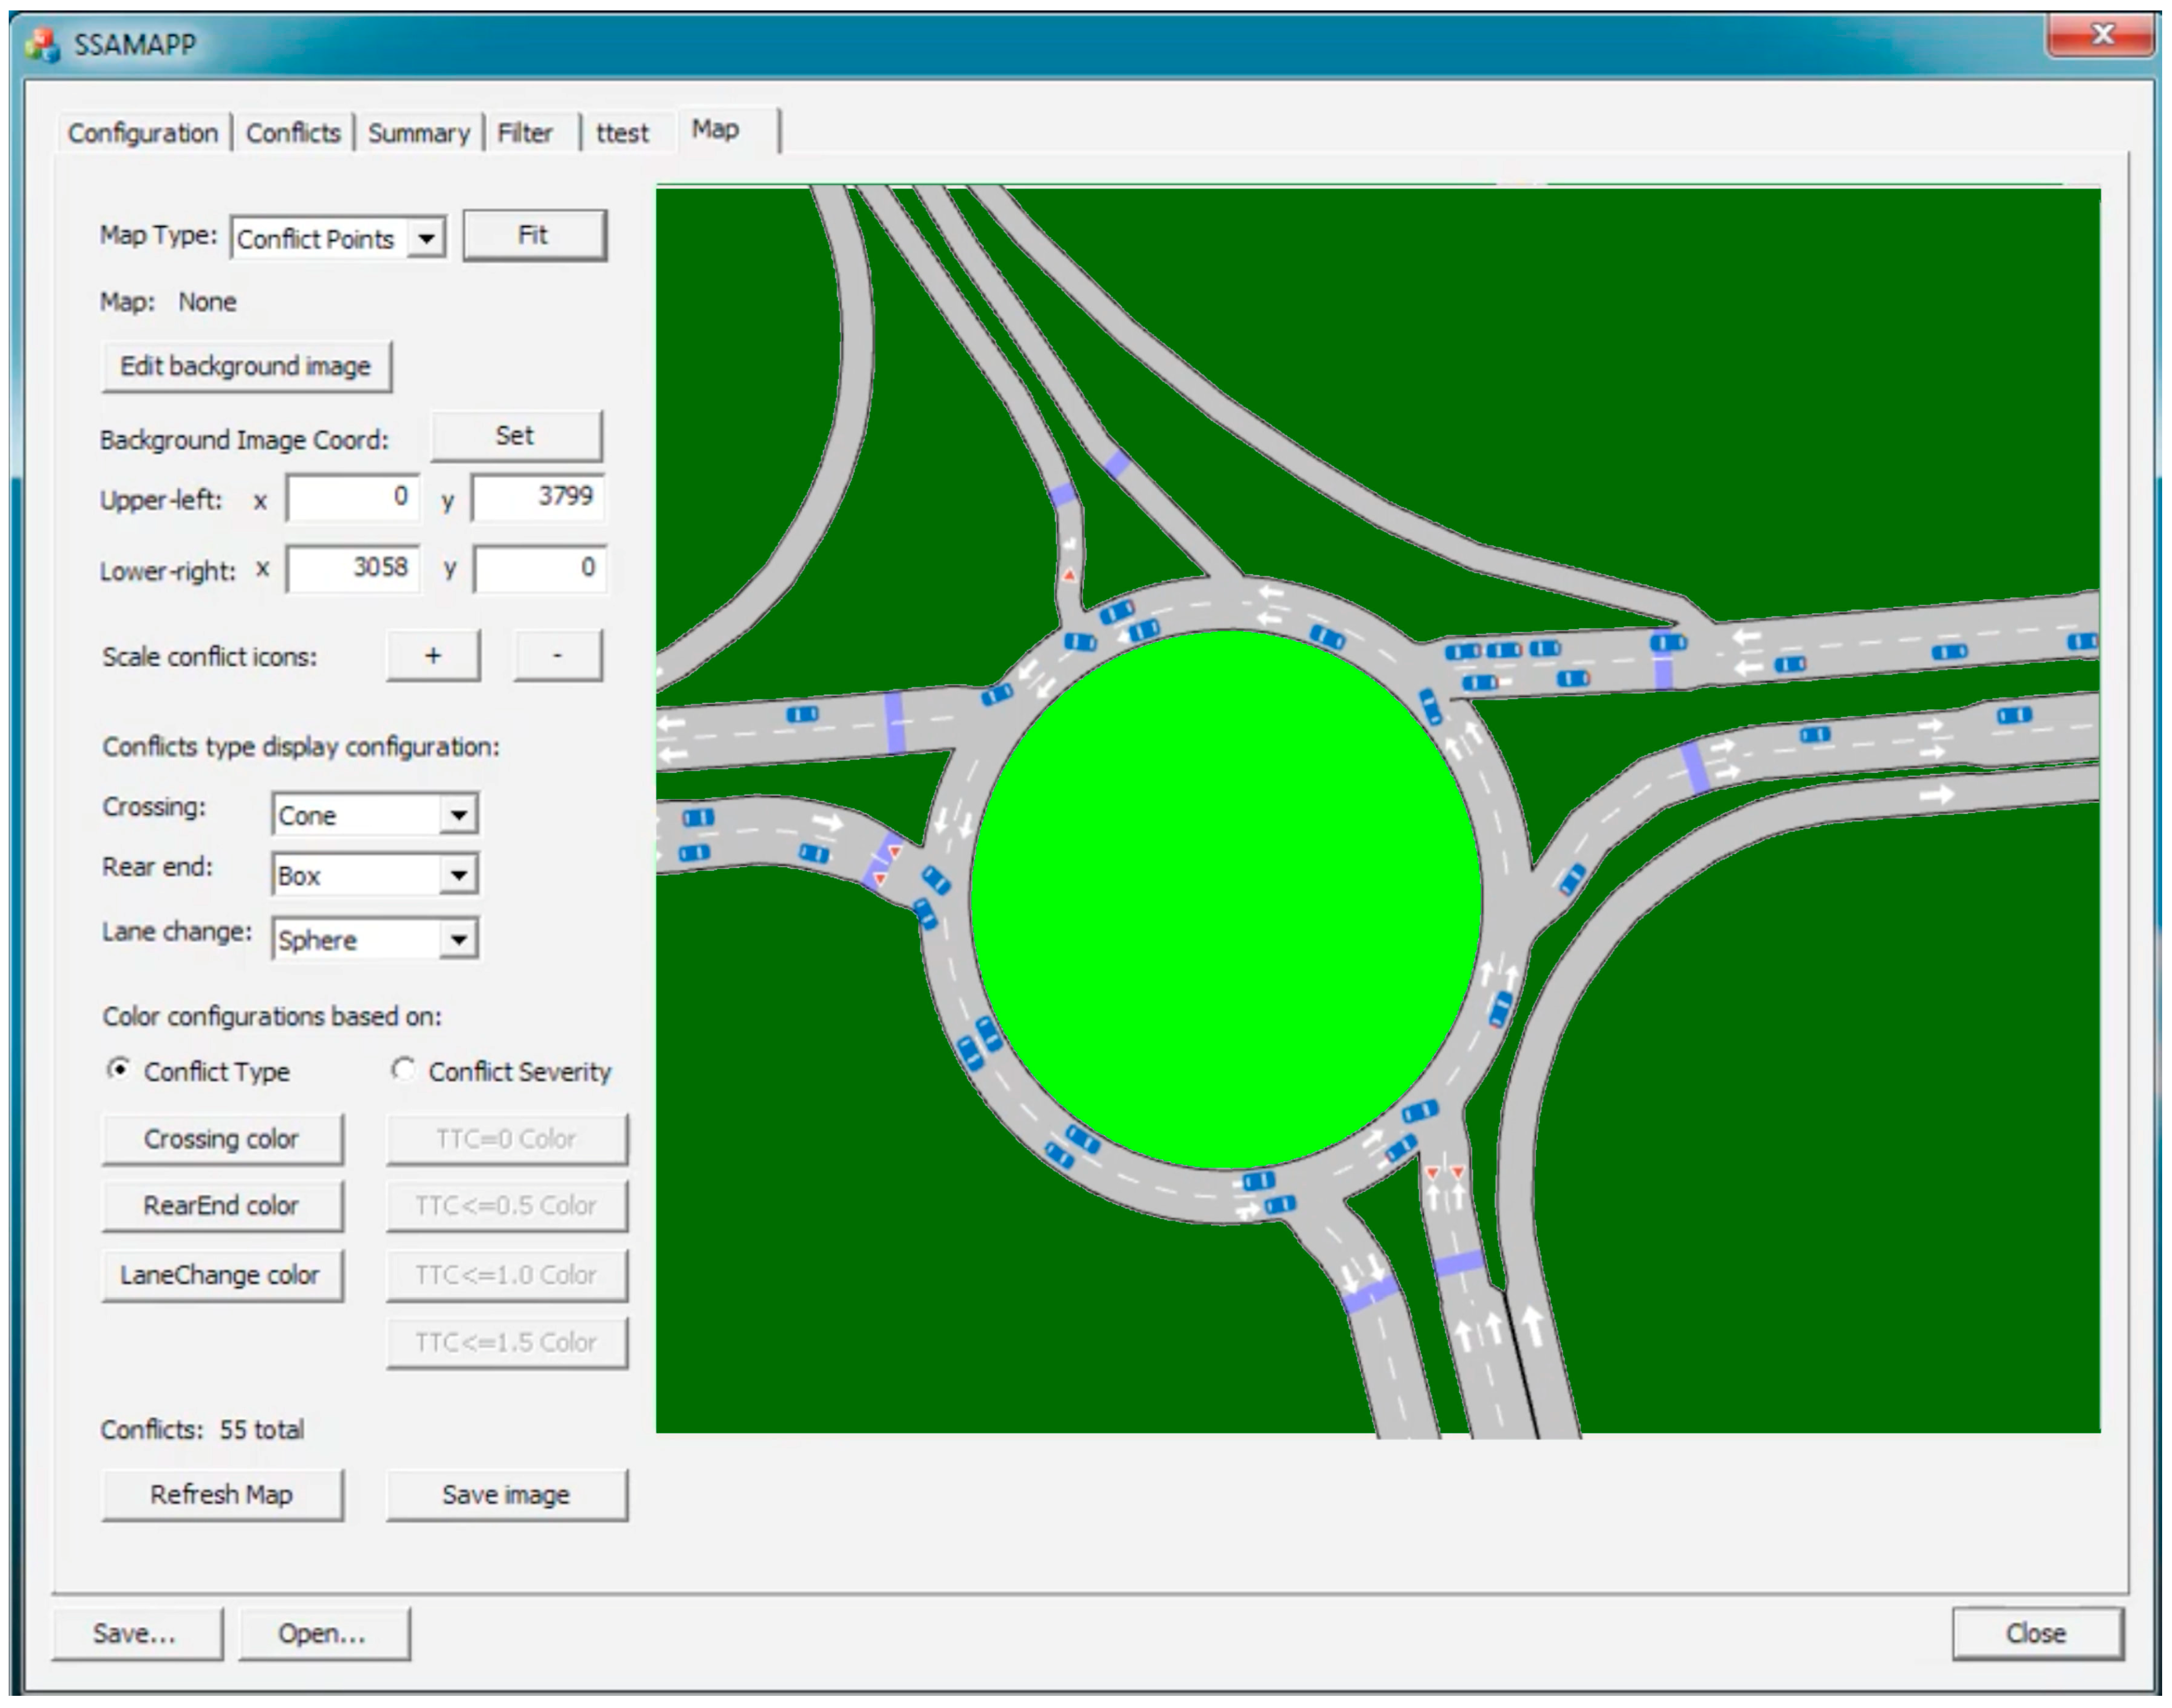
In addition, other parameters were evaluated that are representative of the level of safety provided by the infrastructure configurations considered. These parameters are the total number of conflicts generated in the considered time interval and the number of conflicts divided into the three types that can be evaluated by SSAM (crossing, rear end, lane change) (Figure 7).
4. Results and Discussion
The procedure described in the previous section made it possible to estimate the values of 10 indicators: Two performance indicators (Total number of stops and Delay Time) and eight safety indicators (TTCmin, PET, Maximum speed (MaxS), Initial Deceleration Rate (DR), Total number of conflicts, Crossing Conflicts, Rear End Conflicts and Lane Change Conflicts).
The results of the simulations are shown in Table 3 and Table 4. Specifically, Table 3 shows the values of the 10 parameters obtained from the simulations for the four traffic scenarios with respect to the existing configuration, i.e., the configuration with the two multi-lane roundabouts, while Table 4 shows the results of the four simulations with respect to the project configuration that assumed the presence of turbo-roundabouts.
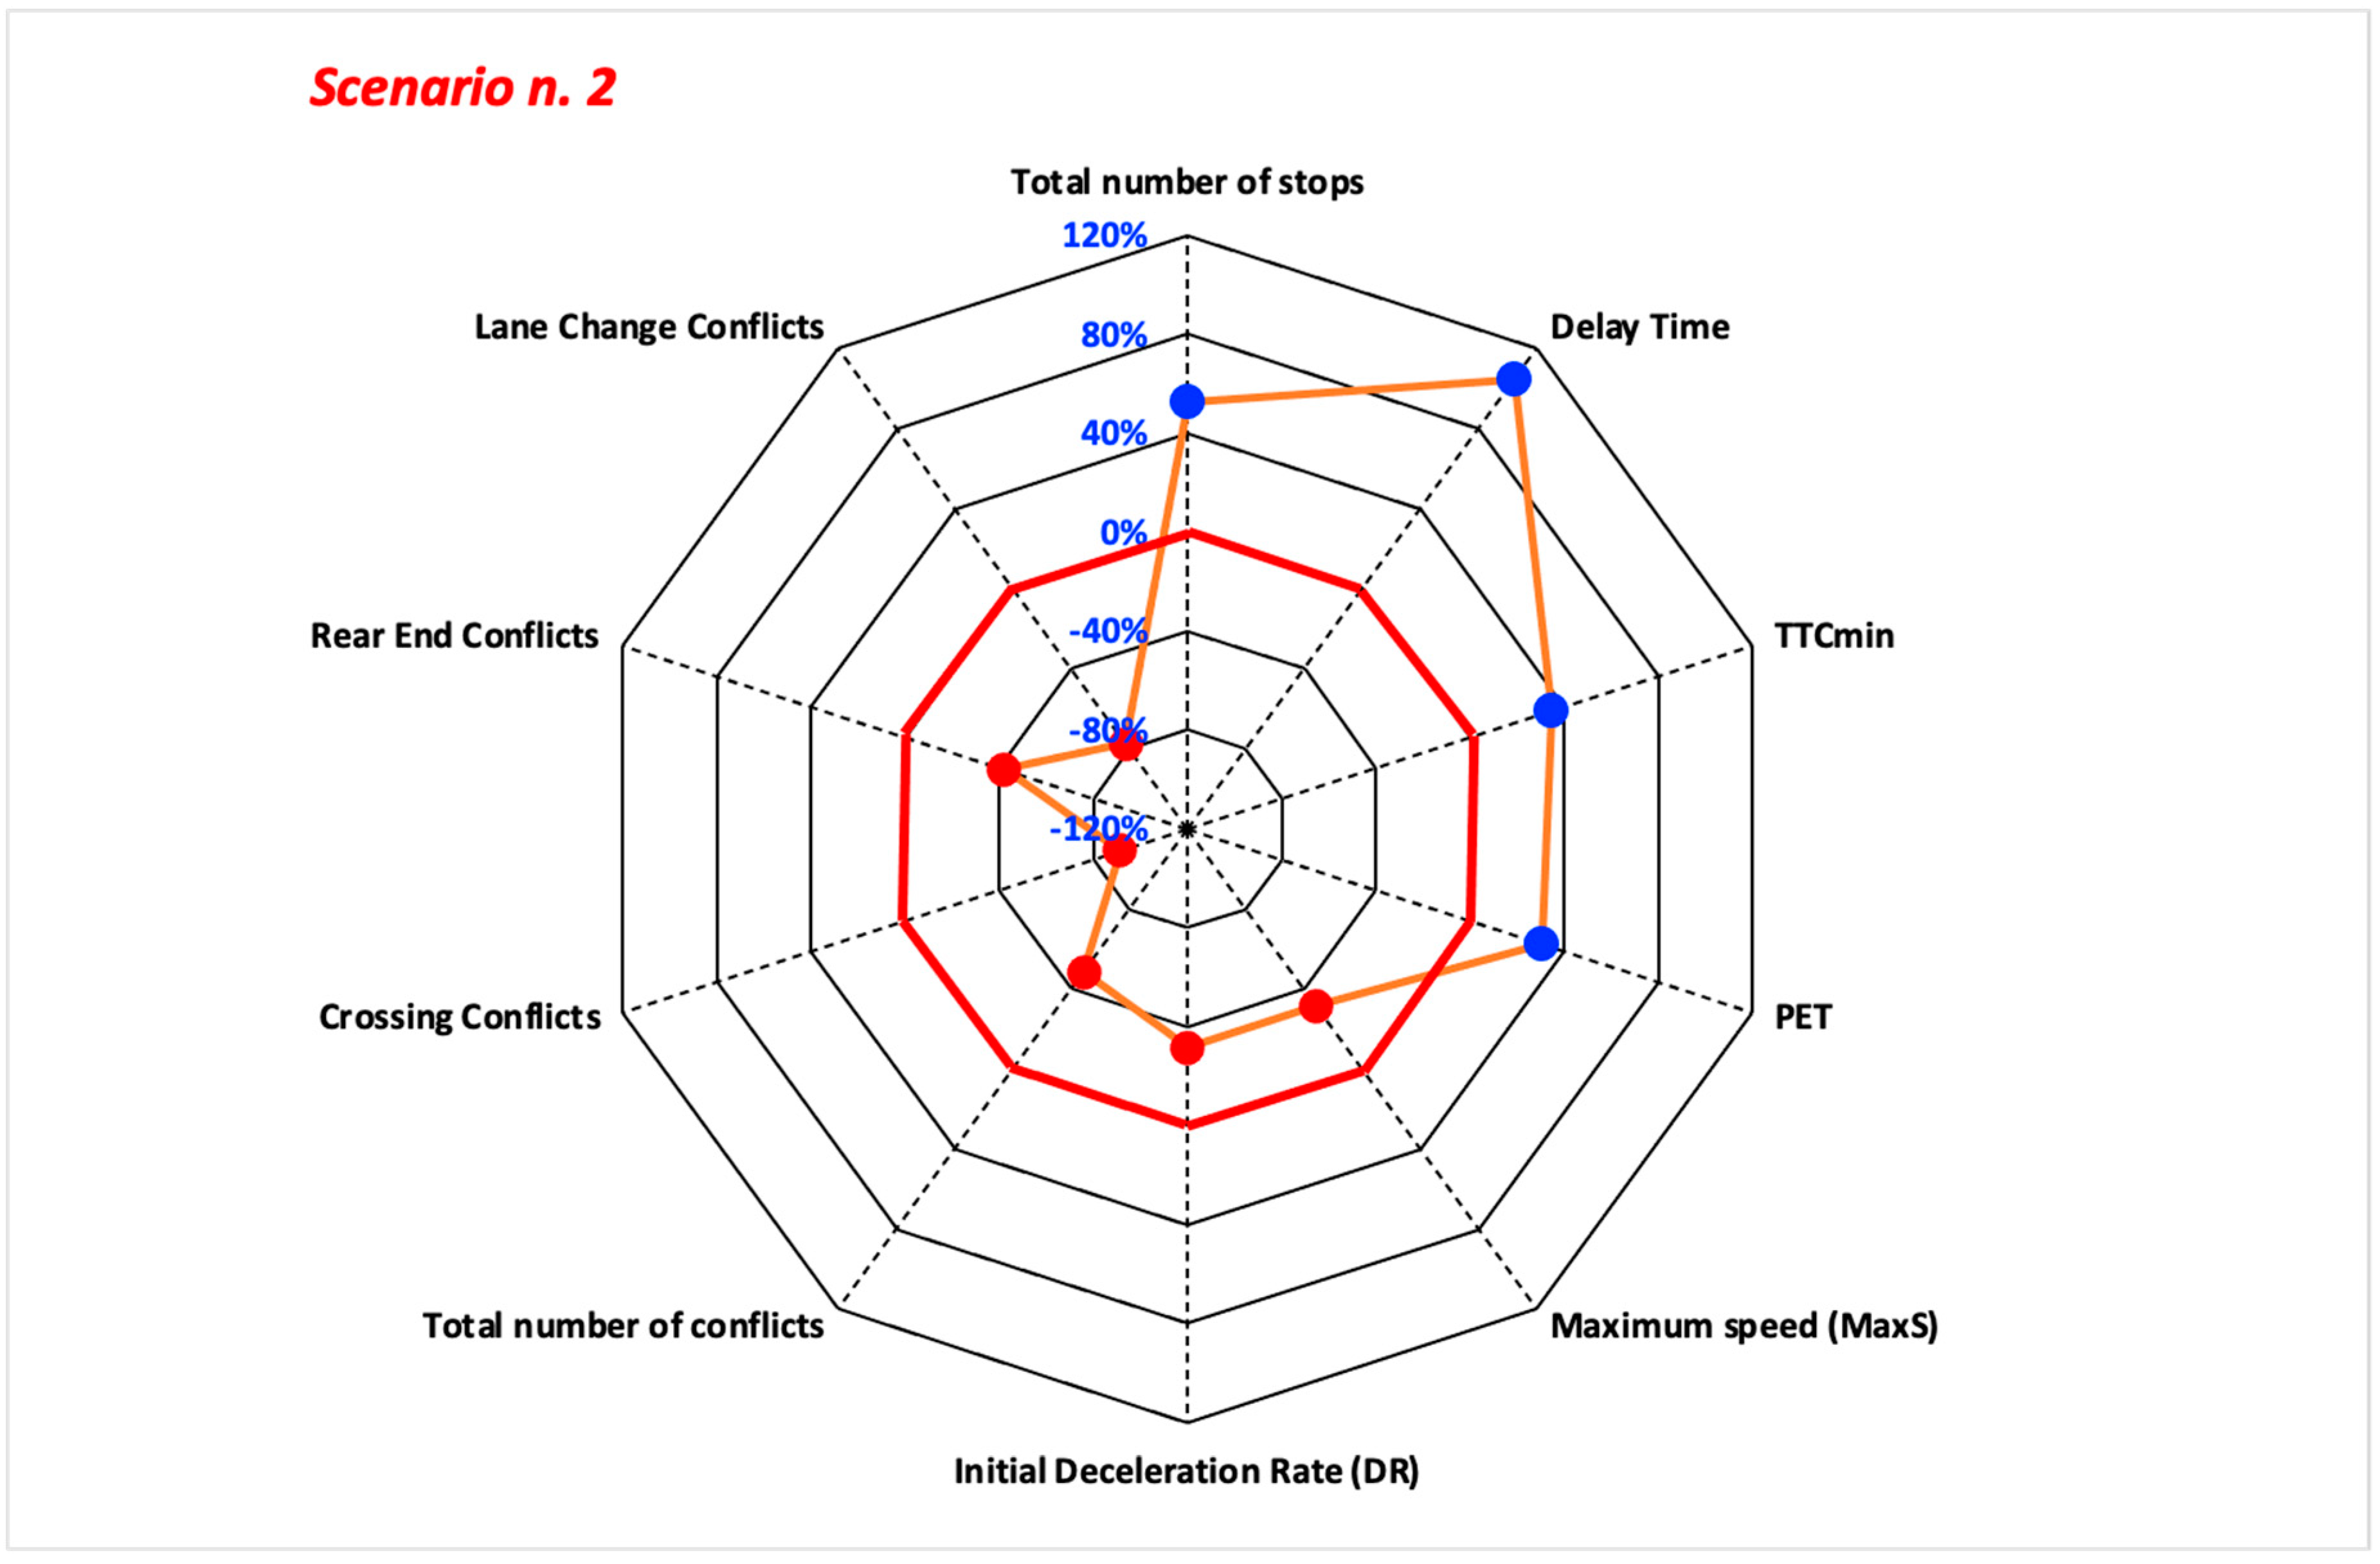
For a better representation of the results obtained, it was decided to use the Kiviar diagram (or radar diagram or spider diagram). A radar chart is a 2D chart that represents multivariate data by assigning an axis to each variable and plotting the data as a polygonal shape across all axes. All axes have the same origin, and the relative position and angle of the axes are usually not informative. The equiangular spokes from the origin to the point on each axis represented by the variable are called radii. Typically, a radar chart looks like an irregular polygon, or like several irregular polygons stacked on top of each other, all with the same center point.
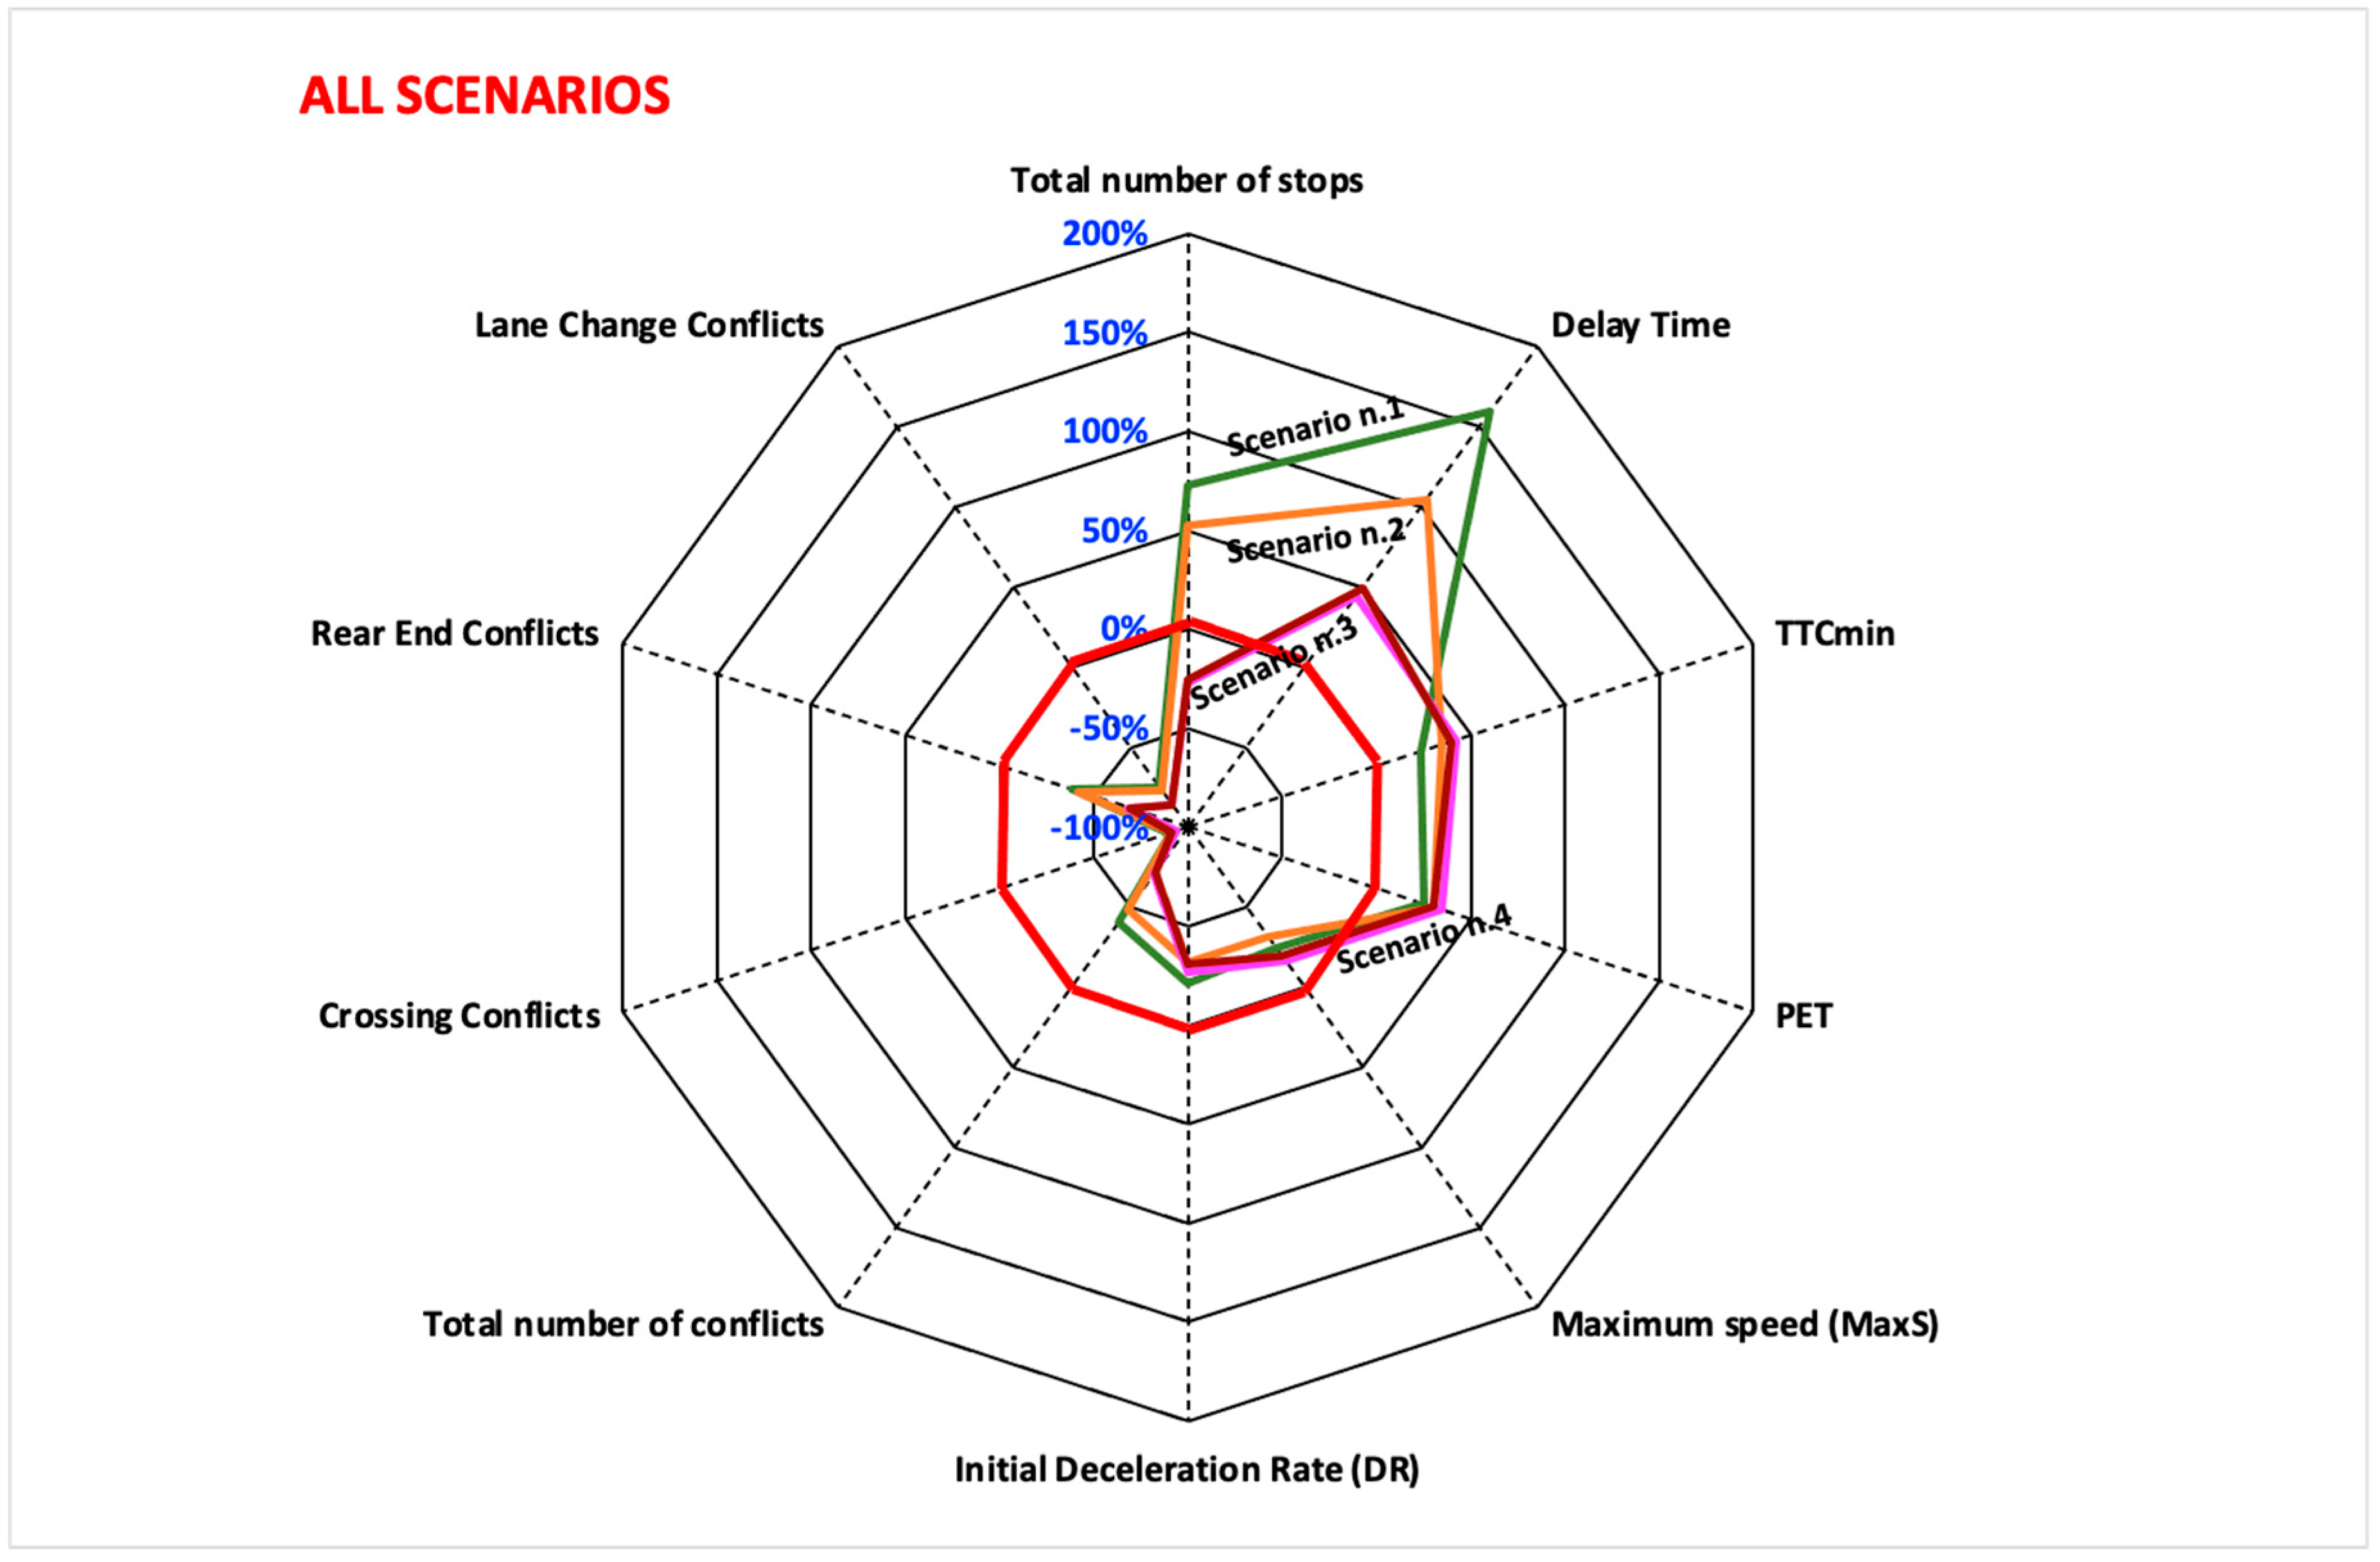
The Kiviar diagrams in Figure 8, Figure 9, Figure 10 and Figure 11 show the percentage changes along the rays for the 10 parameters considered, calculated by comparing the values obtained with respect to the project configuration with turbo-roundabouts with the values of the configuration with multi-lane- roundabouts. In particular, the diagrams in Figure 8, Figure 9, Figure 10 and Figure 11 allow the evaluation, for each scenario, of how much each of the parameters evaluated in relation to the route with turbo-roundabouts varies compared to the sequence of road sections where the main intersections are the standard roundabouts. The diagram in Figure 12, on the other hand, makes it possible to compare all the calculated indicators for all four traffic scenarios at the same time.
The following considerations can be derived from the analysis of Table 3 and Table 4 and Figure 8, Figure 9, Figure 10, Figure 11 and Figure 12.
Total number of stops: The first simulation scenario, to which the lower traffic flows correspond, shows that the multi-lane roundabout is the best design solution. This consideration also applies to the second simulation scenario. Consistent with the first two scenarios, the presence of turbo-roundabouts results in a 73% (first scenario) and 52% (second scenario) increase in the total number of stops. However, when traffic flow continues to increase, a decrease in the total number of stops is observed in the presence of turbo-roundabouts (−27% for scenario n. 3; −25% for scenario n. 4), which translates into a decrease in queuing phenomena. Thus, from the point of view of the indicator considered, the configurations in which the turbo-roundabouts have to manage significant traffic flows are more functional than those in which there are standard roundabouts.
Delay Time: Similar to the other performance indicator analyzed in the previous point, multi-lane roundabouts are more functional than turbo-roundabouts when traffic volumes are medium to low. In fact, delays are about two and a half times higher in scenario n. 1 than in turbo-roundabouts and about twice as high in scenario n. 2. For high traffic volumes, the performance of turbo-roundabouts improves, although high delay values still occur, which in both scenario n. 3 and scenario n. 4 are about 1.5 times the values determined for standard roundabouts. The results related to the evaluation of this parameter are consistent with the uncertainty found in the literature related to operational performance of turbo-roundabouts in general. Indeed, many studies show that the values of operational performance (capacity, delays, queues) strongly depend on the geometric configurations of the turbo-roundabouts and on the distribution of vehicle flows among the different approaches [6,7,9,35,36,37,40,41]. Therefore, the evaluations of operational performance often do not coincide (see the analysis performed in Section 2). Regarding delays, the results of this study are in contrast with studies (such as [42,43]) that show that turbo-roundabouts, where the traffic flows are higher on the main road, and have significantly lower delays than conventional multi-lane roundabouts. In fact, the part of the network investigated in this study is characterized by a main road, the “Circonvallazione”, which is significantly more loaded with traffic than the secondary approaches, yet the total delays always remain high (although they tend to decrease with increasing traffic). The delays valued in this study may be more consistent with the study showing that delays are slightly lower for turbo-roundabouts than for multi-lane roundabouts when traffic flow is balanced [31]. This could mean that when traffic flow is unbalanced, delays on turbo-roundabouts tend to increase. However, it would be necessary to perform simulations under different traffic conditions to obtain positive feedback on the validity of the above statement.
TTCmin: All traffic scenarios associated with the configuration in which the multi-lane roundabouts are present show TTCmin values averaging 0.9 s, which is well below the threshold for this indicator (1.5 s). In contrast, TTCmin values for turbo- roundabouts average 1.2 s. This shows not only that this indicator is 24% to 42% higher than for multi-lane roundabouts, but also that thanks to the turbo-roundabout, drivers always have more time to avoid conflicts, thus providing road users with a higher level of safety. The TTCmin values obtained in this study are quite comparable to the average values obtained in a study conducted in Bogotà, where the TTCmin value in a turbo-roundabout simulated with the SSAM software was 1.32 s [53].
PET: This indicator, similar to the previous one, also shows a higher level of safety of the turbo-roundabouts compared to the multi-lane configurations. The values of PET in the scenarios associated with turbo-roundabouts range from 2.3 sec (scenario n. 1) and 2.5 sec (scenario n. 2), are always higher than in the existing configuration with the multi-lane roundabouts and show significant percentage increases between 25% and 34%.
Maximum speed (MaxS): As traffic conditions vary, this indicator takes values from about 4.5 m/s to 6.5 m/s for simulation scenarios where multi-lane roundabouts are present. The aforementioned values, on the other hand, decrease by percentages ranging from about 16% (scenario n. 3) to 32% (scenario n. 2) when there are conflicts between vehicles on the route where turbo-roundabouts are present. Thus, the change in this indicator shows how the presence of turbo-roundabouts leads to conflicts that occur at significantly lower speeds than conflicts on a route where multi-lane roundabouts are present. So even in this case, turbo-roundabouts are safer on average than standard roundabouts.
Initial Deceleration Rate (DR): The values of this safety indicator are always higher than 2.5 m/s2 for traffic scenarios related to the road section characterized by the presence of multi-lane roundabouts. However, for the simulations performed on the road section equipped with turbo-roundabouts, three out of four scenarios have values of DR lower than 2 m/s2. In terms of percentage change, the comparison between the configuration with turbo-roundabouts and the configuration with multi-lane roundabouts shows an average reduction of about 28%, without much variation between scenarios. Thus, the simulations show that the specific influence of traffic conditions on the change in this parameter is not particularly evident. Therefore, it is reasonable to conclude that turbo-roundabouts induce drivers to face conflict situations at lower speeds than standard roundabouts and that they also require little deceleration to avoid a potential accident. In this way, drivers can handle the potentially hazardous conditions with greater calm and without sudden braking, which benefits safety.
Total number of conflicts: The safety benefits of a turbo-roundabout become even clearer when we consider the change in this indicator. Already in scenario n. 1, the reduction of total conflicts in the configuration with turbo-roundabouts is obvious (−40%). This difference becomes even more evident as traffic volumes increase. In fact, there is a change in conflicts of about −48% in scenario n. 2 and about 70% for scenario n. 3 and scenario n. 4. These results are quite consistent with studies showing a percentage reduction in conflict of the same magnitude as in this study. In particular, a study comparing the safety performance of a two-lane roundabout and a turbo-roundabout with traffic flows similar to those in scenarios 1 and 2 considered in this study showed a percentage reduction of 45% in the total number of conflicts in the turbo-roundabout [52]. A study comparing an existing two-lane roundabout and a turbo-roundabout simulated with VISSIM and SSAM in the city of Bogotá (Colombia) under traffic conditions similar to scenarios 3 and 4 in this study showed a 72% reduction in the total number of conflicts in the turbo-roundabout [53]. Other studies, based on conflict analysis techniques applied to nine layouts with different demand scenarios, showed 40–50 % reductions in accident rates [6,10]. Further consideration of conflicts can be made by looking at the types of conflicts in more detail. Specifically:
- ➢
- Crossing conflicts: These types of conflicts almost cancel out in the turbo-roundabout configuration compared to the multi-lane roundabout configuration. It should be noted, however, that the percentage of these conflicts, as could logically be expected in a context where the two main intersections are roundabouts, is already low in each of the scenarios considered. Therefore, it is not considered appropriate to highlight this result.
- ➢
- Rear End Conflicts: Although this type of conflict generally has the least severe consequences, it is the most common in all of the traffic scenarios considered. In scenarios n. 3 and n. 4, which refer to the road configuration characterized by the presence of multi-lane roundabouts, the number of conflicts even exceeds 8000 on average. The presence of turbo-roundabouts drastically reduces these conflicts, especially in configurations with high traffic volumes: −38% (scenario n. 1), −42% (scenario n. 2), −68% (scenario n. 3), −69% (scenario n. 4).
- ➢
- Lane change Conflicts: The two multi-lane roundabouts have two lanes on the circulatory roadway. It was logical to expect that the simulations would yield a large number of lane change conflicts; nearly 450 in scenario n. 1, about 700 in scenario n. 2, and over 1200 in both scenario n. 3 and scenario n. 4. The design of turbo-roundabouts would result in a very significant reduction in these conflicts. This is confirmed by the following reductions identified in the simulations: −75% (scenario n. 1), −78% (scenario n. 2), −86% (scenario n. 3) and −86% (scenario n. 4).
Finally, it is interesting to note, as can be clearly seen in Figure 9, that scenarios n. 3 and n. 4 are very similar in terms of the variation of all the parameters considered. This means that from a certain traffic volume, which affects the studied part of the road network and, consequently, the roundabouts present there, the conditions of safety and functional operation stabilize and do not vary significantly.
5. Conclusions
Today, turbo-roundabouts are an almost exclusively European reality; of the 600 or so turbo-roundabouts in the world, not even a dozen are in operation on non-European continents. The undisputed homeland of turbo-roundabouts is Holland, where there are more than 370 turbo-roundabouts to date. There are countries, such as France, where there are no turbo-roundabouts, and others, such as Spain and the UK, where some turbo-roundabouts are in the trial phase. In Italy there are no turbo-roundabouts, and at the moment they are not even experimental, although the advantages of this type of intersection are now obvious. It is true that the benefits in terms of improved operational performance are still controversial.
Although this study refers to a particular case study where the part of the simulated road network is characterized by a main road with much higher traffic volumes than the minor roads, it confirms that multi-lane roundabouts on the circulatory roadway, although not allowed by current legislation, are more efficient than turbo-roundabouts for low to medium traffic volumes. On the other hand, the operational performance of turbo-roundabouts improves significantly at high traffic volumes; under these conditions, they actually help reduce the total number of stops compared to standard roundabouts, and average delays, while remaining higher than those of multi-lane roundabouts, tend to be comparable to those of multi-lane roundabouts (it is likely that average delays are noticeably reduced for turbo-roundabouts with more uniform vehicle flows on the various approaches). In any case, under high traffic conditions, turbo-roundabouts result in reduced congestion and improved fluidity of traffic (the so-called green wave) compared to conventional multi-lane roundabouts.
In terms of safety performance, however, this work confirms what other researchers have already found; variations in key safety indicators testify to significant advantages of turbo-roundabouts compared with multi-lane roundabouts. Rear-end and lane change conflicts are also significantly lower compared to standard roundabouts (in turbo-roundabouts, the inner and outer lanes do not intersect).
One of the next goals of this research group is to simulate additional case studies where existing roundabouts and/or existing standard intersections are replaced with turbo-roundabouts. In this way, we will try to overcome the limitations of the current research, which currently lie mainly in the specificity of the case study used, especially in terms of traffic conditions that are unbalanced. New study scenarios characterized by different configurations of turbo-roundabouts, both in terms of geometric design and distribution of vehicle flows on the different approaches, would certainly make it possible to create the conditions for generalizing the research results, which is not possible at this stage, even if it is believed to have taken an important first step towards this goal.
However, it is believed that the case study treated, typical of an Italian urban reality, is in any case important to pursue an important objective; that is, to induce the legislator to evaluate the possibility of designing turbo-roundabouts in Italy; if it is true that multi-lane roundabouts seem to be better than turbo-roundabouts from the point of view of operational performance, it is also true that multi-lane roundabouts are prohibited and, in any case, less safe than single-lane roundabouts. Moreover, from the point of view of safety, turbo-roundabouts have undeniable advantages over multi-lane solutions. In Italy, the revision of the Decree of 19 April 2006, which regulates the geometric design of intersections, has been discussed for several years. The authors believe that today it is feasible to consider turbo-roundabouts as another design solution that can be used alongside modern roundabouts. In this context, the Italian legislator could take advantage of consolidated project standards; in particular, the Dutch one (CROW).
Author Contributions
Conceptualization, N.D. and S.L.; methodology, N.D.; software, N.D. and S.L.; validation, S.L.; formal analysis, N.D. and S.L.; investigation, N.D. and S.L.; resources, N.D. and S.L.; data curation, S.L.; writing—original draft preparation, N.D. and S.L.; writing—review and editing, N.D. and S.L.; visualization, N.D.; supervision, S.L. All authors have read and agreed to the published version of the manuscript.
Funding
This research received no external funding.
Institutional Review Board Statement
Not applicable to this study because effects on humans are essentially nonexistent.
Informed Consent Statement
Not applicable to this study because no subjects were involved in the research trials.
Data Availability Statement
No new data has been created.
Conflicts of Interest
The authors declare no conflict of interest.
References
- Rella Riccardi, M.; Augeri, M.G.; Galante, F.; Mauriello, F.; Nicolosi, V.; Montella, A. Safety Index for evaluation of urban roundabouts. Acc. Anal. Prev. 2022, 158, 106858. [Google Scholar] [CrossRef] [PubMed]
- Leonardi, S.; Distefano, N.; Pulvirenti, G. Italians’ public opinion on road roundabouts: A web based survey. Transp. Res. Proc. 2020, 45, 293–300. [Google Scholar] [CrossRef]
- Distefano, N.; Leonardi, S.; Consoli, F. Drivers’ Preferences for Road Roundabouts: A Study based on Stated Preference Survey in Italy. KSCE J. Civ. Eng. 2019, 23, 4864–4874. [Google Scholar] [CrossRef]
- Distefano, N.; Leonardi, S. Experimental investigation of the effect of roundabouts on noise emission level from motor vehicles. Noise Control Eng. J. 2019, 67, 282–294. [Google Scholar] [CrossRef]
- Ignaccolo, M.; Zampino, S.; Maternini, G.; Tiboni, M.; Leonardi, S.; Inturri, G.; Le Pira, M.; Cocuzza, E.; Distefano, N.; Giuffrida, N.; et al. How to redesign urbanized arterial roads? The case of Italian small cities. Transp. Res. Proc. 2022, 60, 196–203. [Google Scholar] [CrossRef]
- Tollazzi, T. Alternative Types of Roundabouts: An Informational Guide; Springer International Publishing: New York, NY, USA, 2015. [Google Scholar]
- Elhassy, Z.; Abou-Senna, H.; Radwan, E. Performance evaluation of basic turbo roundabouts as an alternative to conventional double-lane roundabouts. Transp. Res. Rec. 2021, 2675, 180–193. [Google Scholar] [CrossRef]
- Balado, J.; Díaz-Vilarino, L.; Arias, P.; Novo, A. A safety analysis of roundabouts and turbo roundabouts based on Petri nets. Traffic Inj. Prev. 2019, 20, 400–405. [Google Scholar] [CrossRef]
- Ciampa, D.; Diomedi, M.; Giglio, F.; Olita, S.; Petruccelli, U.; Restaino, C. Effectiveness of unconventional roundabouts in the design of suburban intersections. Eur. Transp. /Trasp. Eur. 2020, 80, 1–16. [Google Scholar] [CrossRef]
- Mauro, R.; Cattani, M.; Guerrieri, M. Evaluation of the Safety Performance of Turbo Roundabouts by Means of a Potential Accident Rate Mode. Balt. J. Road Bridge Eng. 2015, 10, 28–38. [Google Scholar] [CrossRef]
- Petru, J.; Krivda, V. An Analysis of Turbo Roundabouts from the Perspective of Sustainability of Road Transportation. Sustainability 2021, 13, 2119. [Google Scholar] [CrossRef]
- Pitlova, E.; Kocianova, A. Case Study: Capacity Characteristics Comparison of Single-lane Roundabout and Turbo-roundabouts. Procedia Eng. 2017, 192, 701–706. [Google Scholar] [CrossRef]
- Šarić, A.; Lovrić, I. Multi-Lane Roundabout Capacity Evaluation. Front. Built Environ. 2017, 3, 42. [Google Scholar] [CrossRef]
- Someswara, R.B.; Kadali, B.R. Review Of Traffic Safety Evaluation At T-intersections Using Surrogate Safety Measures In Developing Countries Context. IATSS Res. 2022, 3, 307–321. [Google Scholar] [CrossRef]
- Sobhani, A.; Young, W.; Sarvi, M. A simulation based approach to assess the safety performance of road locations. Transp. Res. Part C Emerg. Technol. 2013, 32, 144–158. [Google Scholar] [CrossRef]
- Young, W.; Sobhani, A.; Lenne, M.G.; Sarvi, M. Simulation of safety: A review of the state of the art in road safety simulation modelling. Accid. Anal. Prev. 2014, 66, 89–103. [Google Scholar] [CrossRef]
- Killi, D.V.; Vedagiri, P. Proactive evaluation of traffic safety at an unsignalized intersection using Microsimulation. J. Traffic Logist. Eng. 2014, 2, 140–145. [Google Scholar] [CrossRef]
- Essa, M.; Sayed, T. Simulated traffic conflicts: Do they accurately represent field- measured conflicts? Transp. Res. Rec. 2015, 2514, 48–57. [Google Scholar] [CrossRef]
- Mahmud, S.M.S.; Ferreira, L.; Hoque, M.S.; Tavassoli, A. Micro-simulation modelling for traffic safety: A review and potential application to heterogeneous traffic environment. IATSS Res. 2019, 43, 27–36. [Google Scholar] [CrossRef]
- Ulak, M.B.; Ozguven, E.E.; Moses, R.; Sando, T.; Boot, W.; Abdel Razig, Y.; Sobanjo, J.O. Assessment of traffic performance measures and safety based on driver age and experience: A microsimulation based analysis for an unsignalized T-intersection. J. Traffic Transp. Eng. 2019, 6, 455–469. [Google Scholar] [CrossRef]
- Guo, Y.; Sayed, T.; Zheng, L.; Essa, M. An extreme value theory based approach for calibration of microsimulation models for safety analysis. Simul. Model. Pract. Theory. 2021, 106, 102172. [Google Scholar] [CrossRef]
- Torday, A.; Baumann, D.; Dumont, D. Indicator for microsimulation-based safety evaluation. In Proceedings of the 3rd STRC Swiss Transport Research, Monte, Verita, 19–21 March 2003. [Google Scholar]
- Caliendo, D.; Guida, M. Microsimulation approach for predicting crashes at unsignalized intersections using traffic conflicts. J. Transp. Eng. 2012, 138, 1453–1467. [Google Scholar] [CrossRef]
- Astarita, V.; Festa, D.C.; Giofrè, V.P.; Guido, G. Surrogate safety measures from traffic simulation models a comparison of different models for intersection safety evaluation. Transp. Res. Proc. 2019, 37, 219–226. [Google Scholar] [CrossRef]
- Ozbay, K.; Yang, H.; Bartin, B.; Mudigonda, S. Derivation and validation of new simulation-based surrogate safety measure. Transp. Res. Rec. 2008, 2083, 105–113. [Google Scholar] [CrossRef]
- Ambros, J.; Turek, R.; Paukrt, J. Road safety evaluation using traffic conflicts: Pilot comparison of micro-simulation and observation. In Proceedings of the International Conference on Traffic and Transport Engineering, Belgrade, Serbia, 27–28 November 2014. [Google Scholar]
- Guido, G.; Astarita, V.; Giofré, V.; Vitale, A. Safety performance measures: A comparison between microsimulation and observational data. Procedia Soc. Behav. Sci. 2011, 20, 217–225. [Google Scholar] [CrossRef]
- Astarita, V.; Guido, G.; Vitale, A.; Giofré, V. A new microsimulation model for the evaluation of traffic safety performances. Eur. Transp. /Trasp. Eur. 2012, 51, 1–16. [Google Scholar]
- Astarita, V.; Giofré, V.; Guido, G.; Vitale, A. Calibration of a new microsimulation package for the evaluation of traffic safety performances. Procedia Soc. Behav. Sci. 2012, 54, 1019–1026. [Google Scholar] [CrossRef]
- Silva, A.; Vasconcelos, L.; Santos, S. Moving from Conventional Roundabouts to Turbo-Roundabouts. Procedia Soc. Behav. Sci. 2014, 111, 137–146. [Google Scholar] [CrossRef]
- Mauro, R.; Branco, F. Comparative Analysis of Compact Multilane Roundabouts and Turbo-Roundabouts. J. Transp. Eng. 2010, 136, 316–322. [Google Scholar] [CrossRef]
- Bulla, L.; Castro, W. Analysis and Comparison between Two-Lane Roundabouts and Turbo Roundabouts Based on a Road Safety Audit Methodology and Microsimulation: A Case Study in Urban Area. In Proceedings of the 3rd International Conference on Road Safety and Simulation, Indianapolis, IN, USA, 14–16 September 2011; Available online: http://onlinepubs.trb.org/onlinepubs/conferences/2011/RSS/2/Bulla,L.pdf (accessed on 14 April 2022).
- Silva, A.; Santos, S.; Gaspar, M. Turbo-Roundabout Use and Design. In Proceedings of the CITTA 6th Annual Conference on Planning Research, Responsive Transports for Smart Mobility, Coimbra, Portugal, 17 May 2013. [Google Scholar]
- Engelsman, J.; Uken, M. Turbo Roundabouts as an Alternative to Two Lane Roundabouts. In Proceedings of the 26th Southern African Transport Conference (SATC 2007), Pretoria, South Africa, 9–12 July 2007; pp. 581–589. Available online: http://www.lags.corep.it/doc/turbo-roundabout.pdf (accessed on 21 April 2022).
- Giuffrè, O.; Guerrieri, M.; Granà, A. Evaluating Capacity and Efficiency of Turbo-Roundabouts. In Proceedings of the 88th Annual Meeting of the Transportation Research Board, Washington, DC, USA, 11–15 January 2009. [Google Scholar]
- Vasconcelos, L.; Silva, A.; Seco, A. Capacity of Normal and Turbo-Roundabouts: Comparative Analysis. Proc. Inst. Civ. Eng. Transp. 2014, 167, 88–99. [Google Scholar] [CrossRef]
- Vasconcelos, L.; Silva, A.B.; Seco, Á.M.; Fernandes, P.; Coelho, M.C. Turboroundabouts: Multicriterion Assessment of Intersection Capacity, Safety, and Emissions. Transp. Res. Rec. J. Transp. Res. Board. 2014, 2402, 28–37. [Google Scholar] [CrossRef]
- Tollazzi, T.; Mauro, R.; Guerrieri, M.; Rençelj, M. Comparative analysis of four new alternative types of roundabouts: Turbo, flower, target and four-flyover roundabout. Period. Polytech. Civ. Eng. 2016, 60, 51–60. [Google Scholar] [CrossRef]
- Silva, A.B.; Mariano, P.; Silva, J.P. Performance assessment of turbo-roundabouts in corridors. Transp. Res. Procedia 2015, 10, 124–133. [Google Scholar] [CrossRef]
- Kwakwa, O.; Adams, C. Assessment of Turbo and Multilane Roundabout Alternatives to Improve Capacity and Delay at a Single Lane Roundabout Using Microsimulation Model Vissim: A Case Study in Ghana. Am. J. Civ. Eng. Archit. 2016, 4, 106–116. [Google Scholar] [CrossRef]
- Gallelli, V.; Iuele, T.; Vaiana, R. Conversion of a Semi-two Lanes Roundabout into a Turbo-Roundabout: A Performance Comparison. Procedia Comput. Sci. 2016, 83, 393–400. [Google Scholar] [CrossRef]
- Giuffrè, O.; Granà, A.; Marino, S. Comparing performances of turbo-roundabouts and double-lane roundabouts. Mod. Appl. Sci. 2012, 6, 70–79. [Google Scholar] [CrossRef]
- Giuffrè, O.; Granà, A.; Marino, S. Turbo-Roundabouts vs Roundabouts Performance Level. Procedia Soc. Behav. Sci. 2012, 53, 590–600. [Google Scholar] [CrossRef]
- Fernandes, P.; Salamati, K.; Rouphail, N.M.; Coelho, M.C. The effect of a roundabout corridor’s design on selecting the optimal crosswalk location: A multi-objective impact analysis. Int. J. Sustain. Transp. 2017, 11, 206–220. [Google Scholar] [CrossRef]
- Gettmann, D.; Pu, L.; Sayed, T.; Shelby, S. Surrogate Safety Assessment Model and Validation: Final Report; United States. Federal Highway Administration. Office of Safety Research and Development: McLean, VA, USA, 2008. Available online: http://www.fhwa.dot.gov/publications/research/safety/08051/08051.pdf (accessed on 28 April 2022).
- Huang, S.; Guo, L.; Yang, Y.; Casas, I.; Sadek, A.W. Dynamic demand estimation and microscopic traffic simulation of a university campus transportation network. Transp. Plan. Technol. 2012, 35, 449–467. [Google Scholar] [CrossRef]
- So, J.; Hoffmann, S.; Lee, J.; Busch, F.; Choi, K. A prediction accuracy-practicality tradeoff analysis of the state-of-the-art safety performance assessment methods. Transp. Res. Proc. 2016, 15, 794–805. [Google Scholar] [CrossRef]
- Al-Ghandour, M.; Schroeder, B.; Williams, B.; Rasdorf, W. Conflict models for single-lane roundabout slip lanes from microsimulation. Transp. Res. Rec. 2011, 2236, 92–101. [Google Scholar] [CrossRef]
- Chai, C.; Wong, Y.D. Micro-simulation of vehicle conflicts involving right-turn vehicles at signalized intersections based on cellular automata. Accid. Anal. Prev. 2014, 63, 94–103. [Google Scholar] [CrossRef] [PubMed]
- Dijkstra, A.; Marchesini, P.; Bijleveld, F.; Kars, V.; Drolenga, H.; van Maarseveen, M. Do calculated conflicts in micro-simulation model predict number of crashes? Transp. Res. Rec. 2010, 2147, 105–112. [Google Scholar] [CrossRef]
- Vasconcelos, L.; Neto, L.; Seco, A.; Silva, A. Validation of the surrogate safety assessment model for assessment of intersection safety. Transp. Res. Rec. 2014, 2432, 1–9. [Google Scholar] [CrossRef]
- Vasconcelos, L.; Silva, A.; Seco, A. Safety analysis of turbo-roundabouts using the SSAM technique. In Proceedings of the CITTA 6th Annual Conference on Planning Research, Coimbra, Portugal, 17 May 2013. [Google Scholar]
- Bulla-Cruz, L.; Lyons, L.; Darghan, E. Complete-Linkage Clustering Analysis of Surrogate Measures for Road Safety Assessment in Roundabouts. Rev. Colomb. Estad. 2021, 44, 91–121. [Google Scholar] [CrossRef]
- Chen, Y.; Persaud, B.; Lyon, C. Effect of Speed on Roundabout Safety Performance: Implications for Use of Speed as Surrogate Measure. In Proceedings of the Transportation Research Board 90th Annual Meeting, TRID, Washington, DC, USA, 23–27 January 2011. [Google Scholar]
- Džambas, T.; Ahac, S.; Dragčević, V. Design of turbo roundabouts based on the rules of vehicle movement geometry. J. Transp. Eng. 2016, 142, 05016004. [Google Scholar] [CrossRef]
- CROW. Turborotondes; CROW Publication no.257. Ede; CROW: Dutch, The Netherlands, 2008. [Google Scholar]
- Ciuffo, B.; Casas, J.; Montanino, M.; Perarnau, J.; Punzo, V. Gaussian process metamodels for sensitivity analysis of traffic simulation models: Case study of AIMSUN mesoscopic model. Transp. Res. Rec. 2013, 2390, 87–98. [Google Scholar] [CrossRef]
- Virdi, N.; Grzybowska, H.; Waller, S.T.; Dixit, V. A safety assessment of mixed fleets with connected and autonomous vehicles using the surrogate safety assessment module. Accid. Anal. Prev. 2019, 131, 95–111. [Google Scholar] [CrossRef]
- Pu, L.; Joshi, R. Surrogate Safety Assessment Model (SSAM)—Software User Manual. Federal Highway Administration, Virginia, 2008. Available online: https://www.fhwa.dot.gov/publications/research/safety/08050/08050.pdf (accessed on 4 March 2022).
- Guo, Y.; Essa, M.; Sayed, T.; Haque, M.M.; Washington, S. A Comparison between Simulated and Field-Measured Conflicts for Safety Assessment of Signalized Intersections in Australia. Transp. Res. Part C Emerg. Technol. 2019, 101, 96–110. [Google Scholar] [CrossRef]
- Hayward, J.C. Near-miss determination through use of a scale of danger. Highw. Res. Rec. 1972, 1, 24–34. Available online: http://onlinepubs.trb.org/Onlinepubs/hrr/1972/384/384-004.pdf (accessed on 4 February 2022).
- Pulvirenti, G.; De Ceunynck, T.; Daniels, S.; Distefano, N.; Leonardi, S. Safety of bicyclists in roundabouts with mixed traffic: Video analyses of behavioural and surrogate safety indicators. Transp. Res. Part F. Traffic Psychol. Behav. 2021, 76, 72–91. [Google Scholar] [CrossRef]
- Laureshyn, A. In Search of the Severity Dimension of Traffic Events: Extended Delta-v as a Traffic Conflict Indicators. Accid. Anal. Prev. 2017, 98, 46–56. [Google Scholar] [CrossRef] [PubMed]
- Gettman, D.; Head, L. Surrogate safety measures from traffic simulation models. Transp. Res. Record 2003, 1840, 104–115. [Google Scholar] [CrossRef] [Green Version]
- Johnsson, C.; Laureshyn, A.; De Ceunynck, T. In search of surrogate safety indicators for vulnerable road users: A review of surrogate safety indicators. Transp. Rev. 2018, 38, 765–785. [Google Scholar] [CrossRef]
Figure 1.
Conflict points (a) single-lane roundabout; (b) double-lane roundabout; (c) turbo-roundabout.
Figure 1.
Conflict points (a) single-lane roundabout; (b) double-lane roundabout; (c) turbo-roundabout.
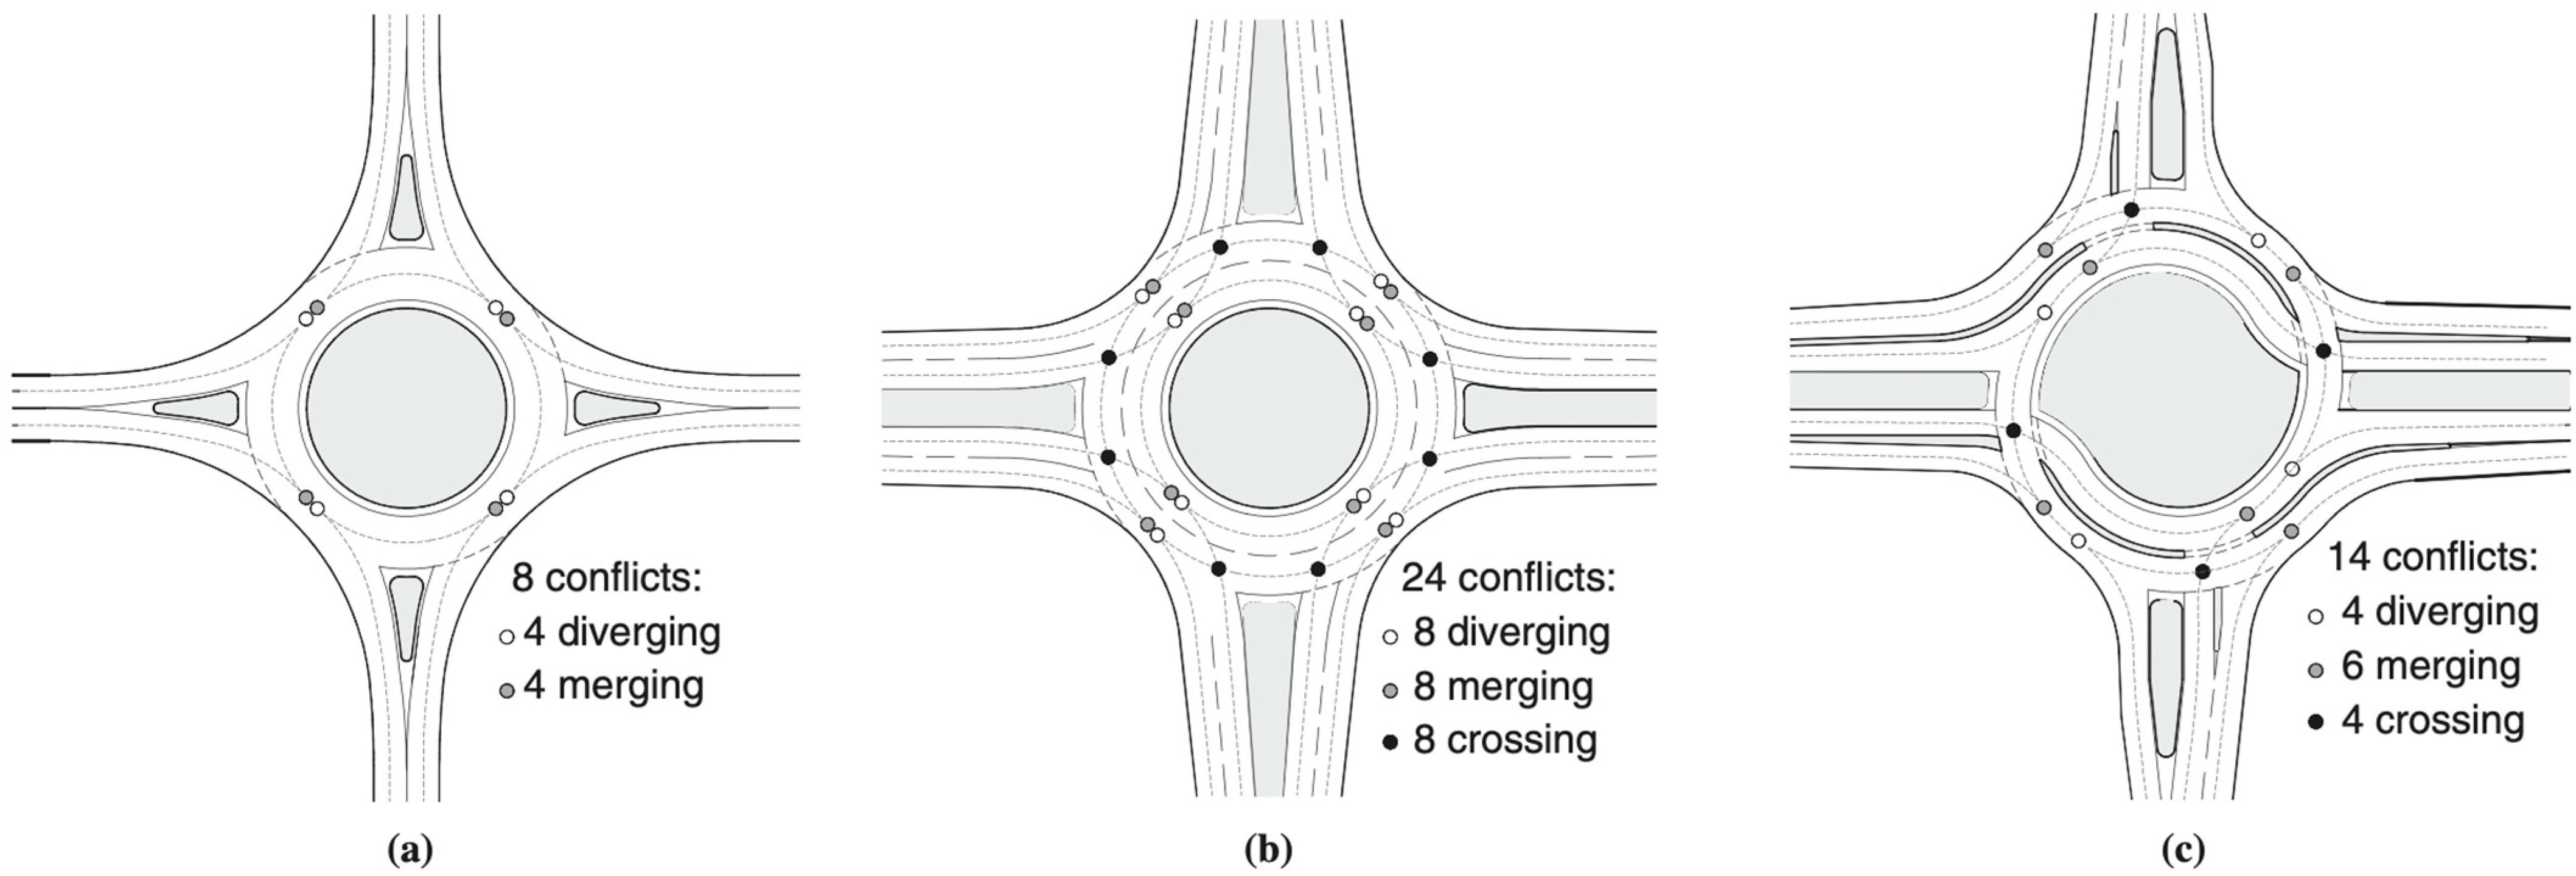
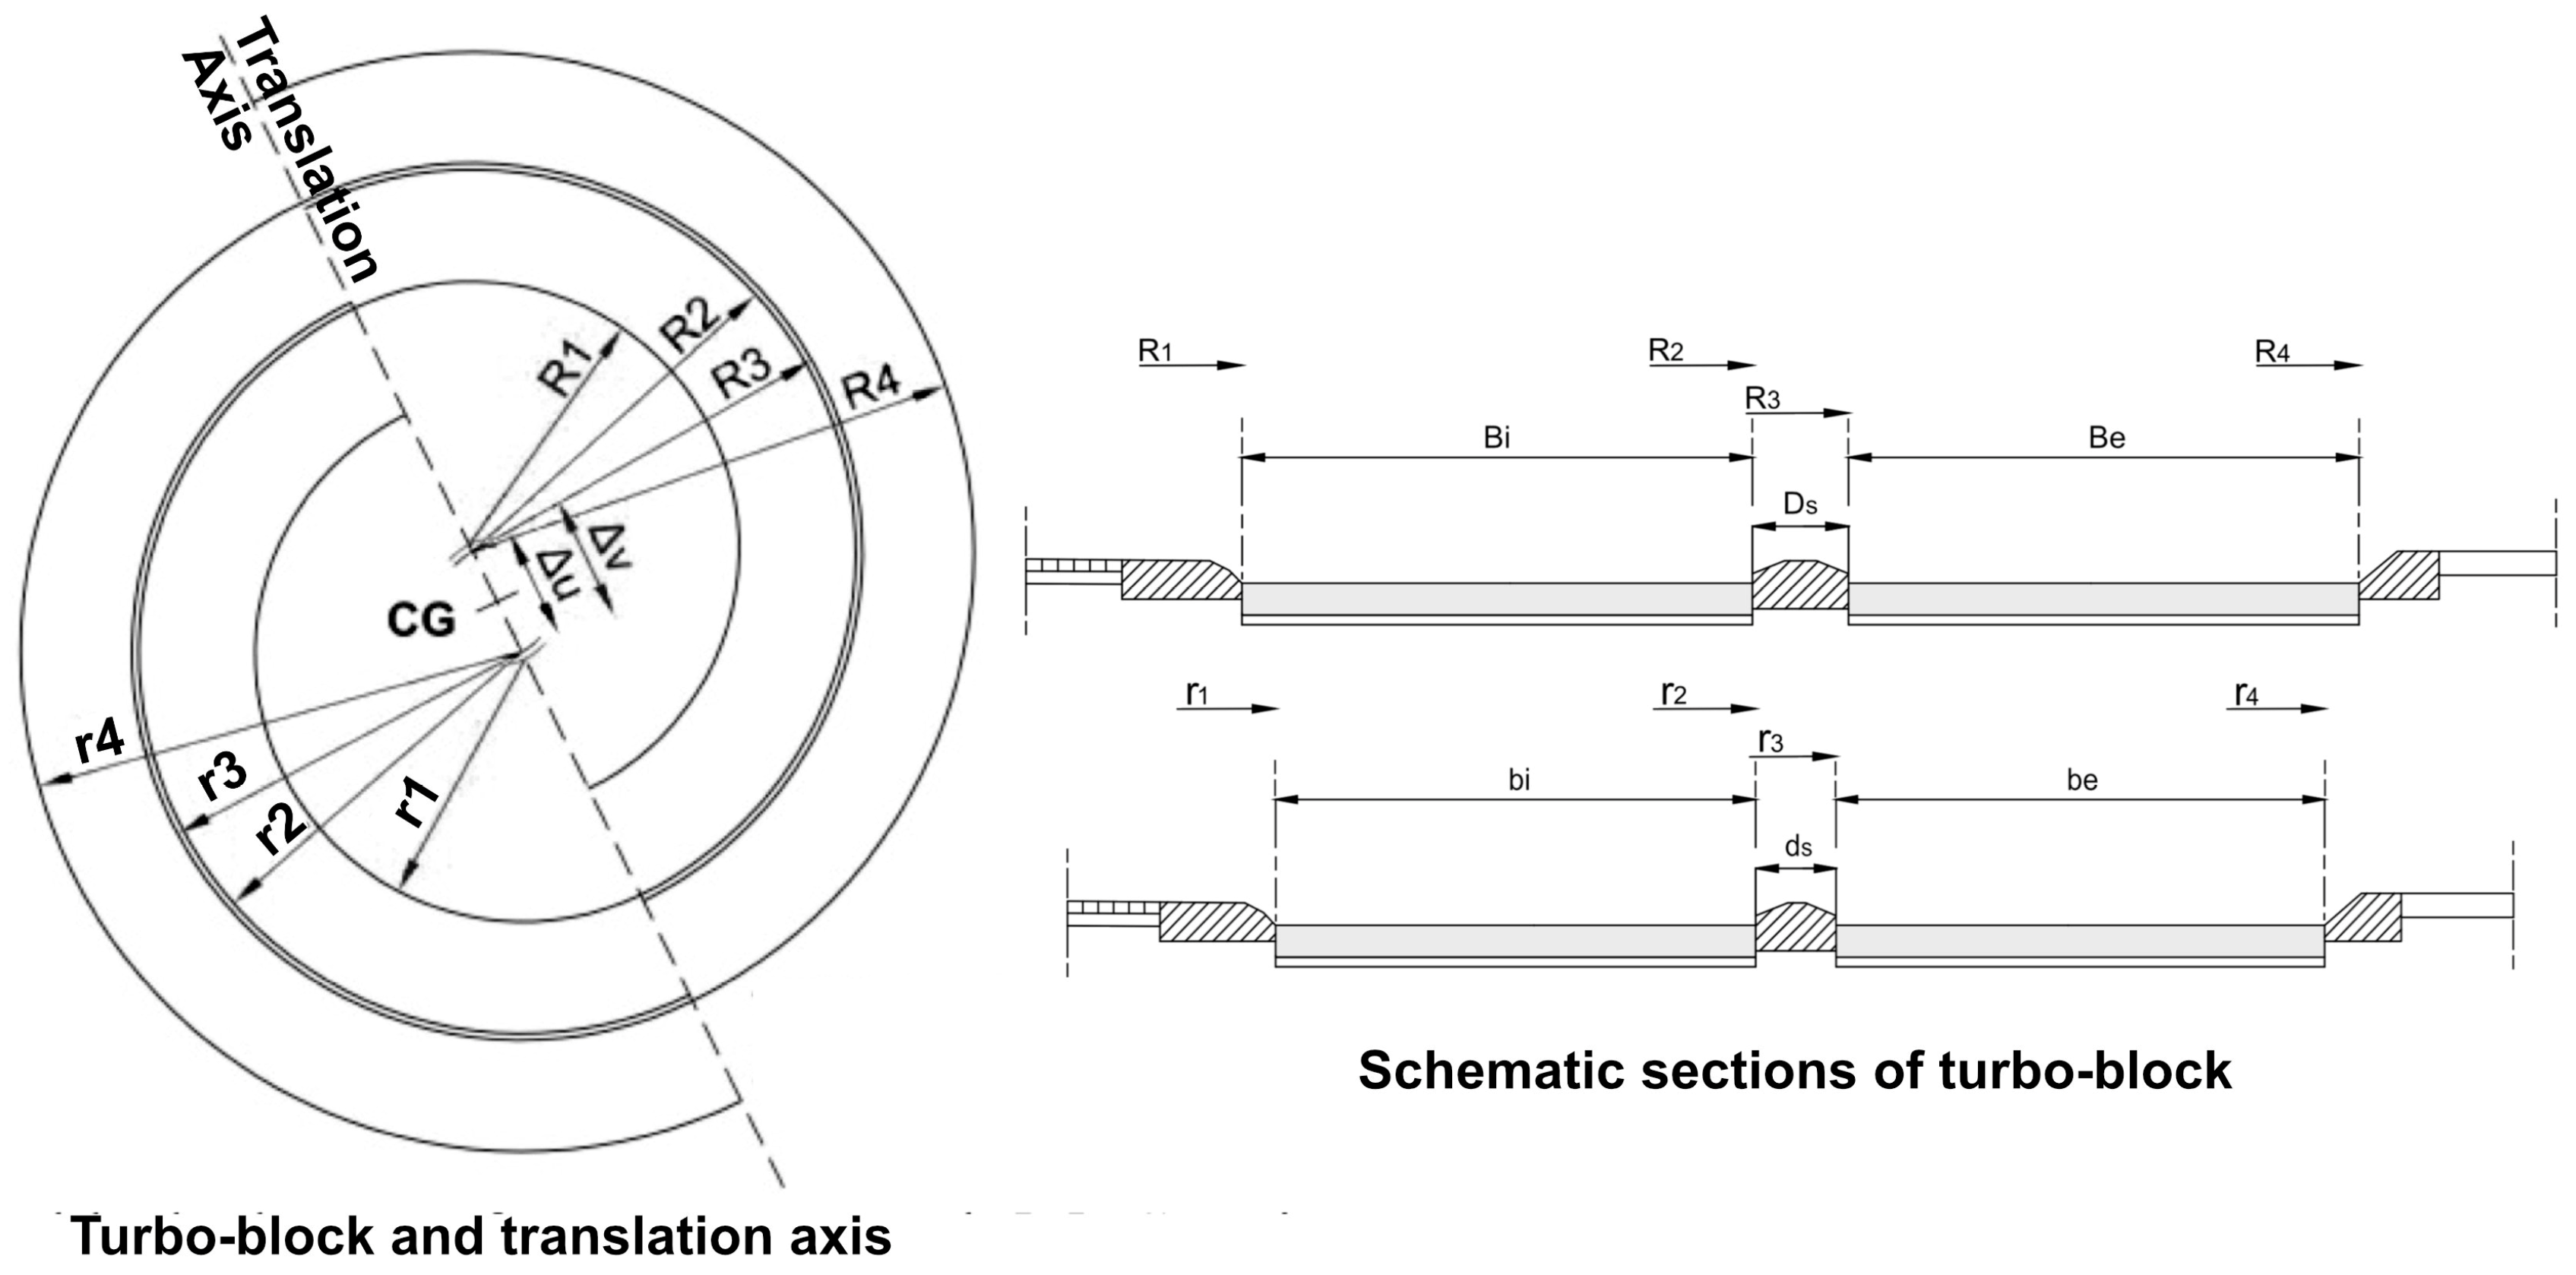
Figure 2.
Design elements of turbo-roundabouts (turbo-block and translation axis).

Figure 3.
Multi-lane existing roundabouts (R1 and R2) and design hypothesis (turbo-roundabouts, TR1 and TR2).
Figure 3.
Multi-lane existing roundabouts (R1 and R2) and design hypothesis (turbo-roundabouts, TR1 and TR2).

Figure 4.
Graph of the analyzed part of the road network.
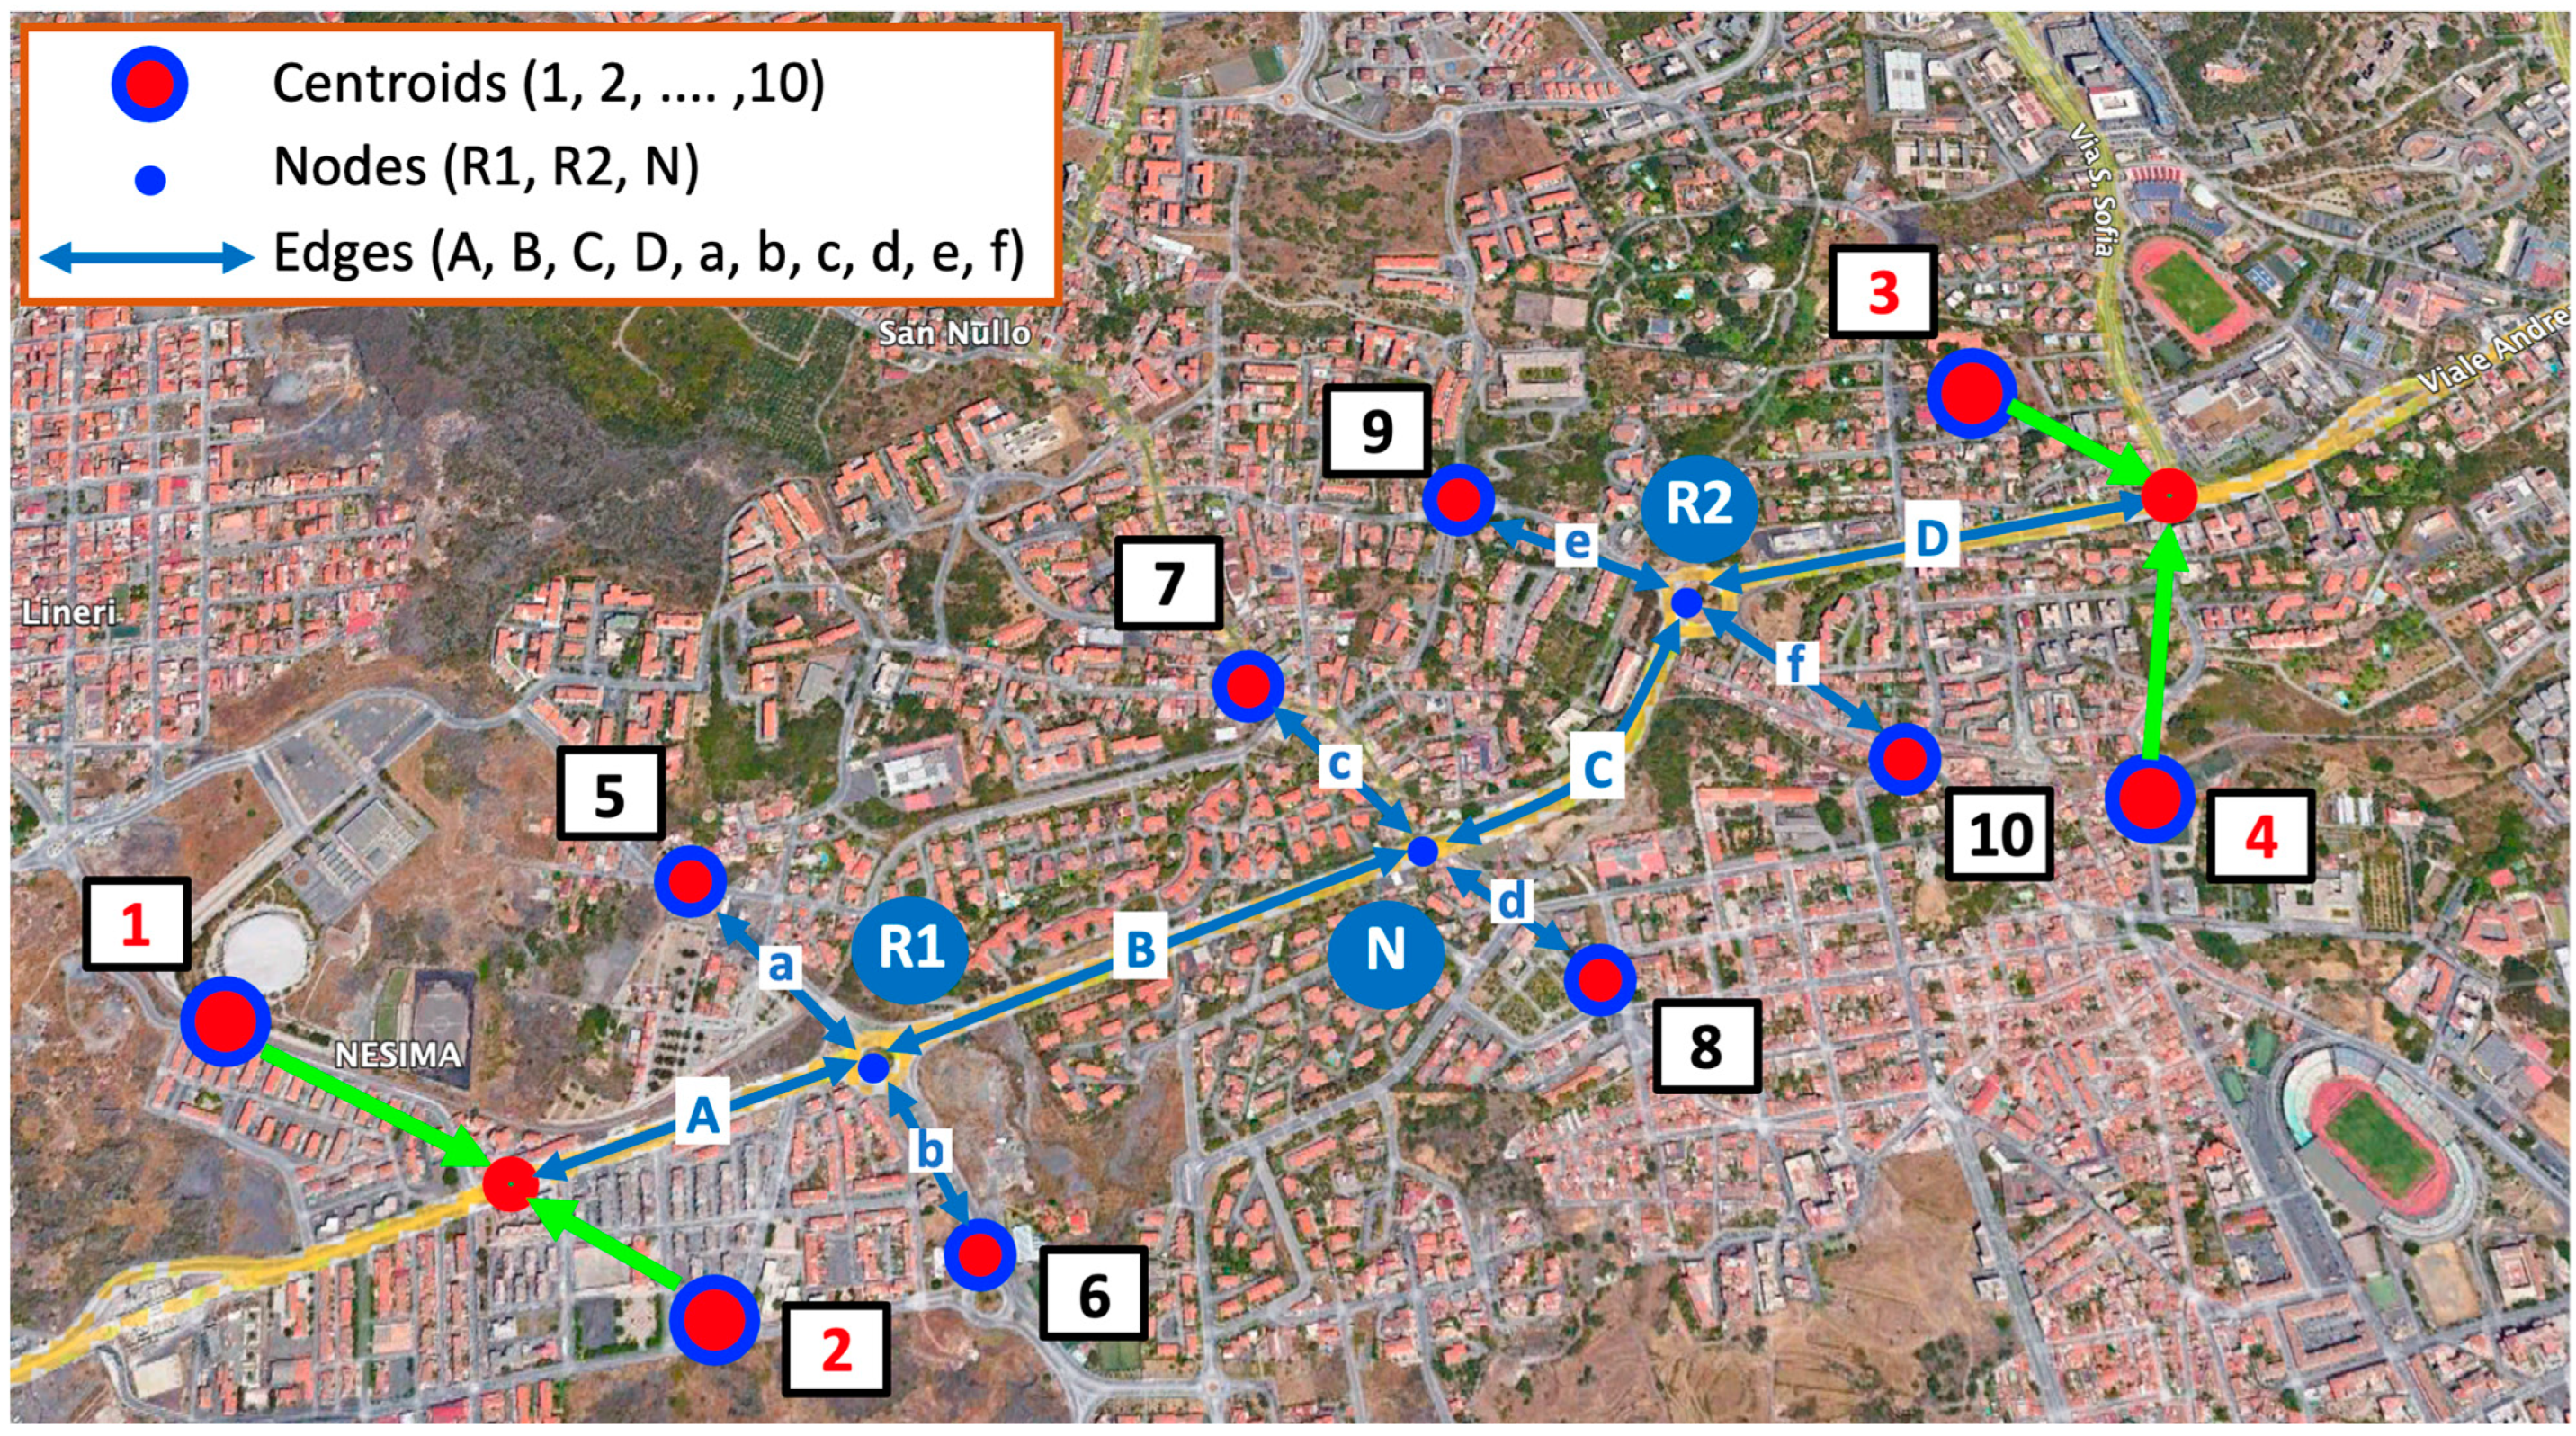
Figure 5.
Example of a AIMSUN output for the simulation of one of the examined roundabouts.

Figure 6.
Representation of conflict angles according to SSAM.

Figure 7.
Example of conflicts in SSAM for one of the examined roundabouts.

Figure 8.
Percentage variation of the 10 indicators considered (Scenario n. 1).
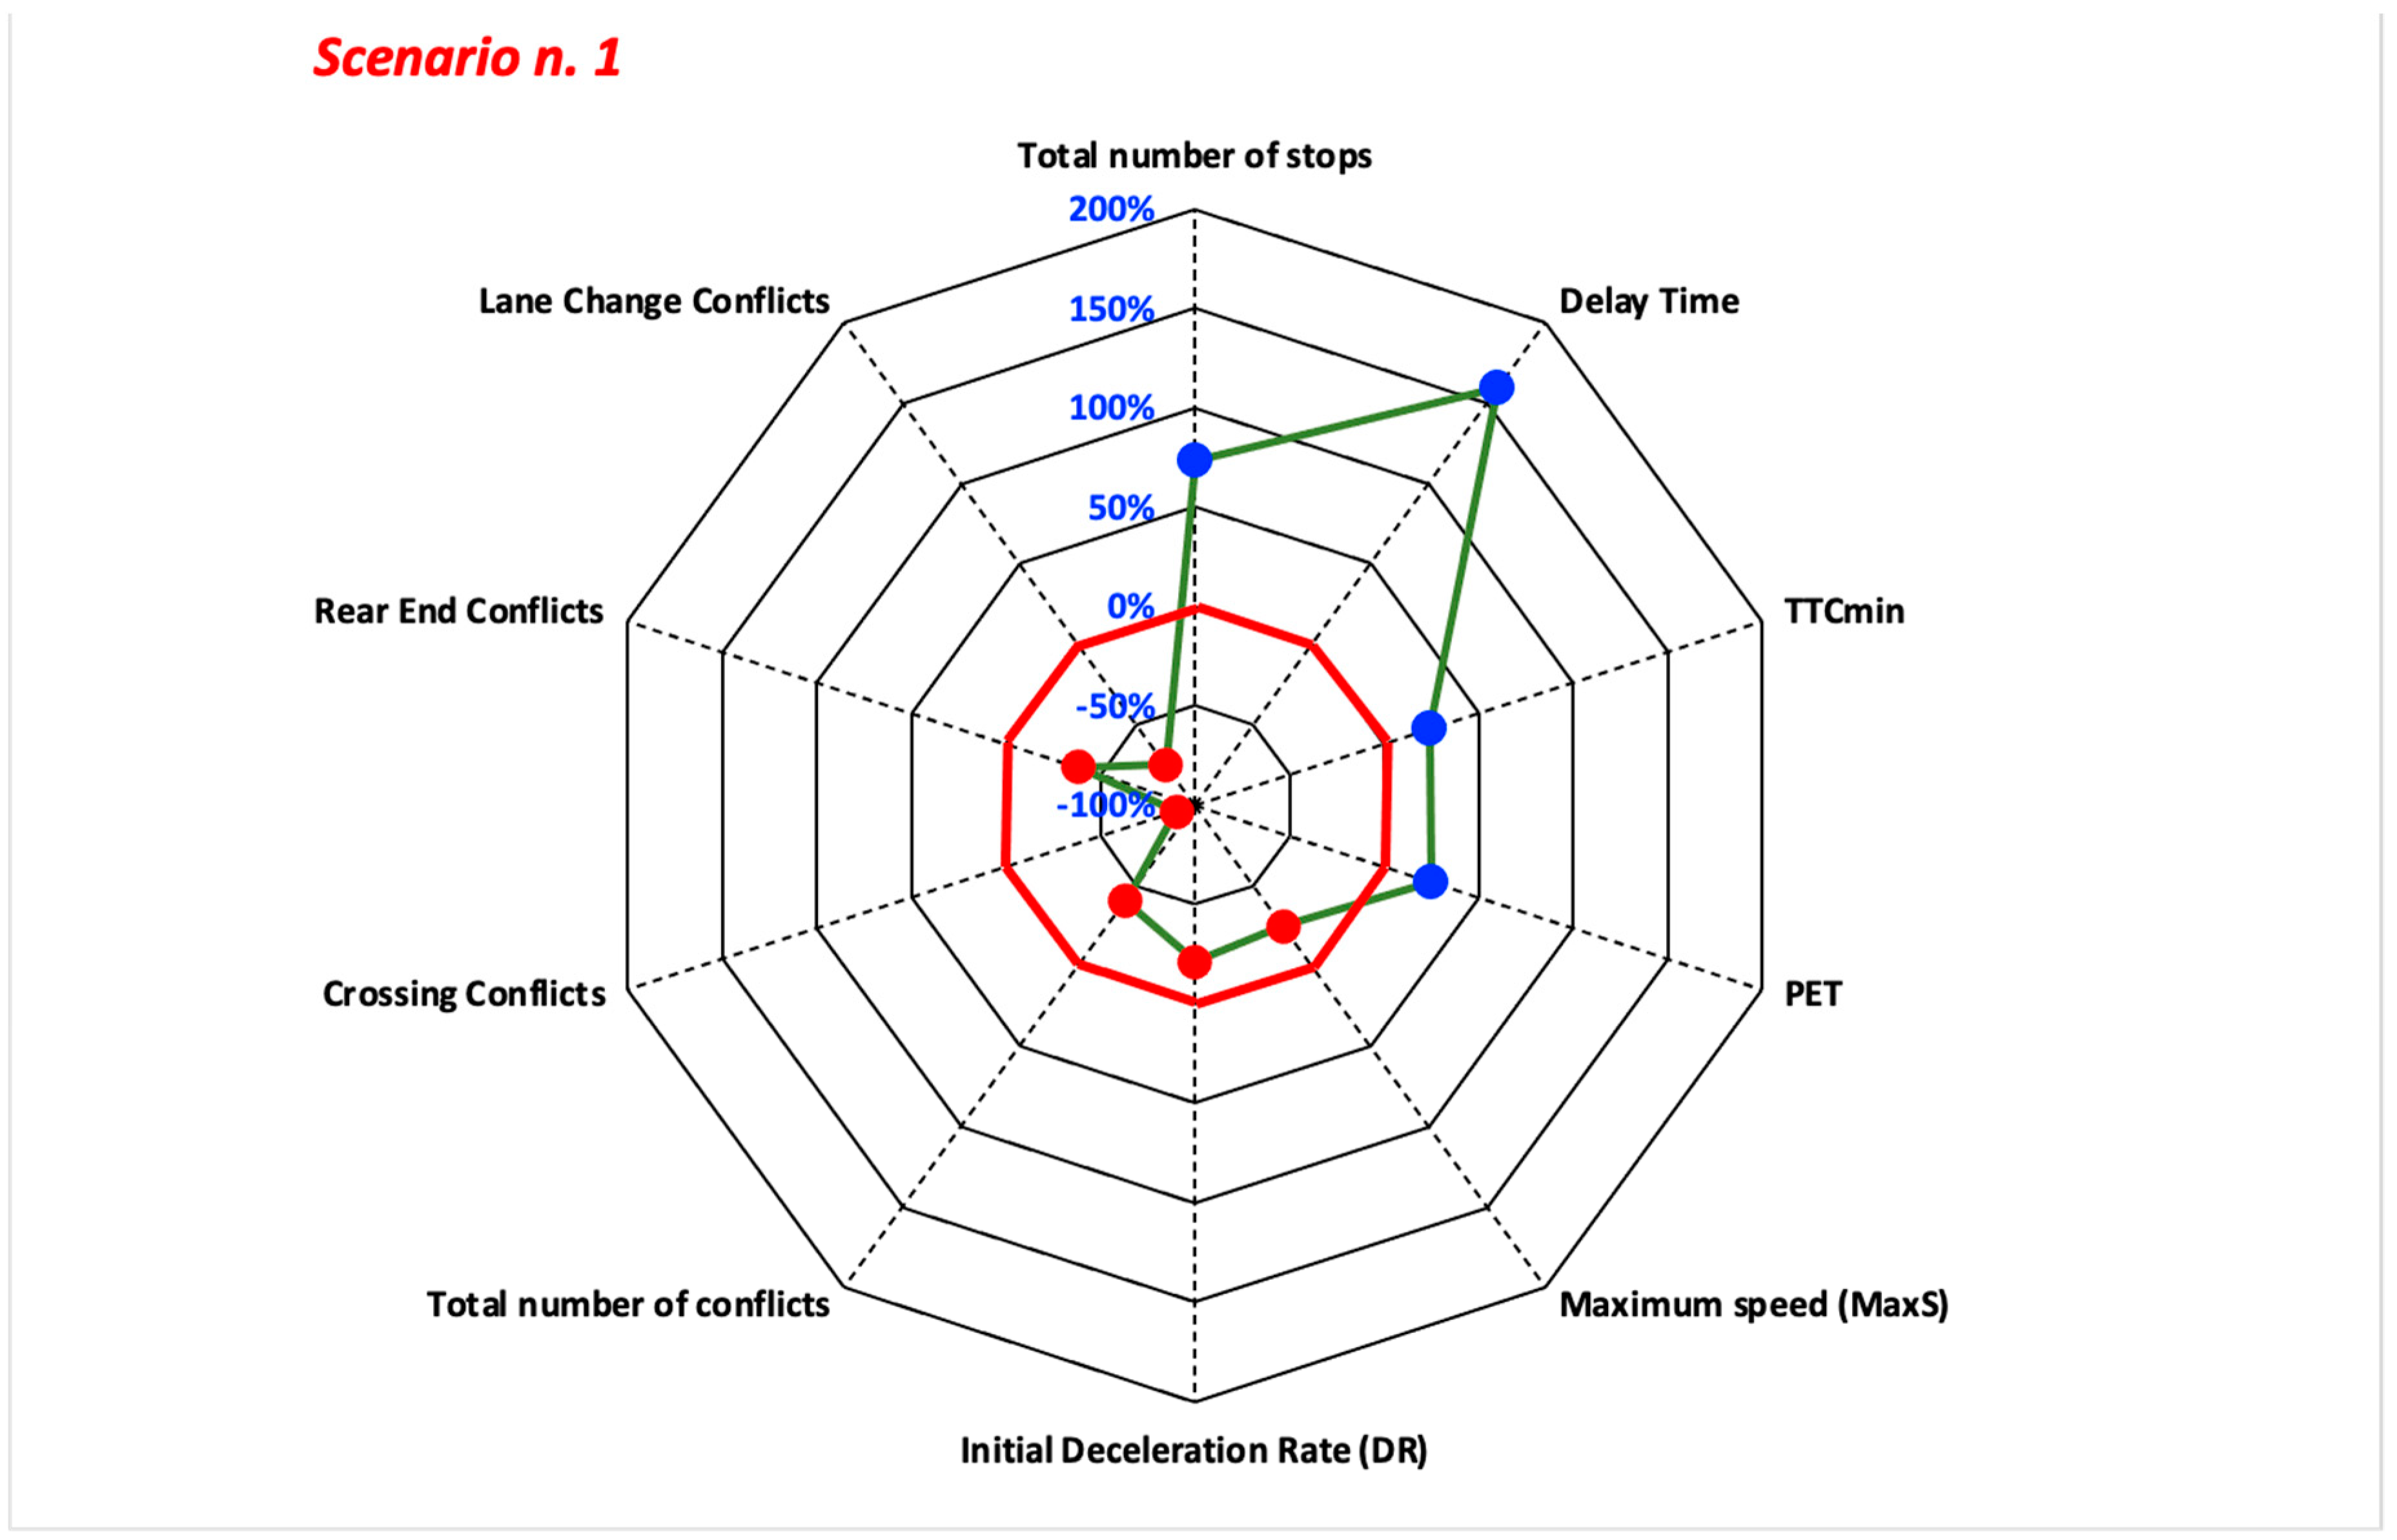
Figure 9.
Percentage variation of the 10 indicators considered (Scenario n. 2).

Figure 10.
Percentage variation of the 10 indicators considered (Scenario n. 3).
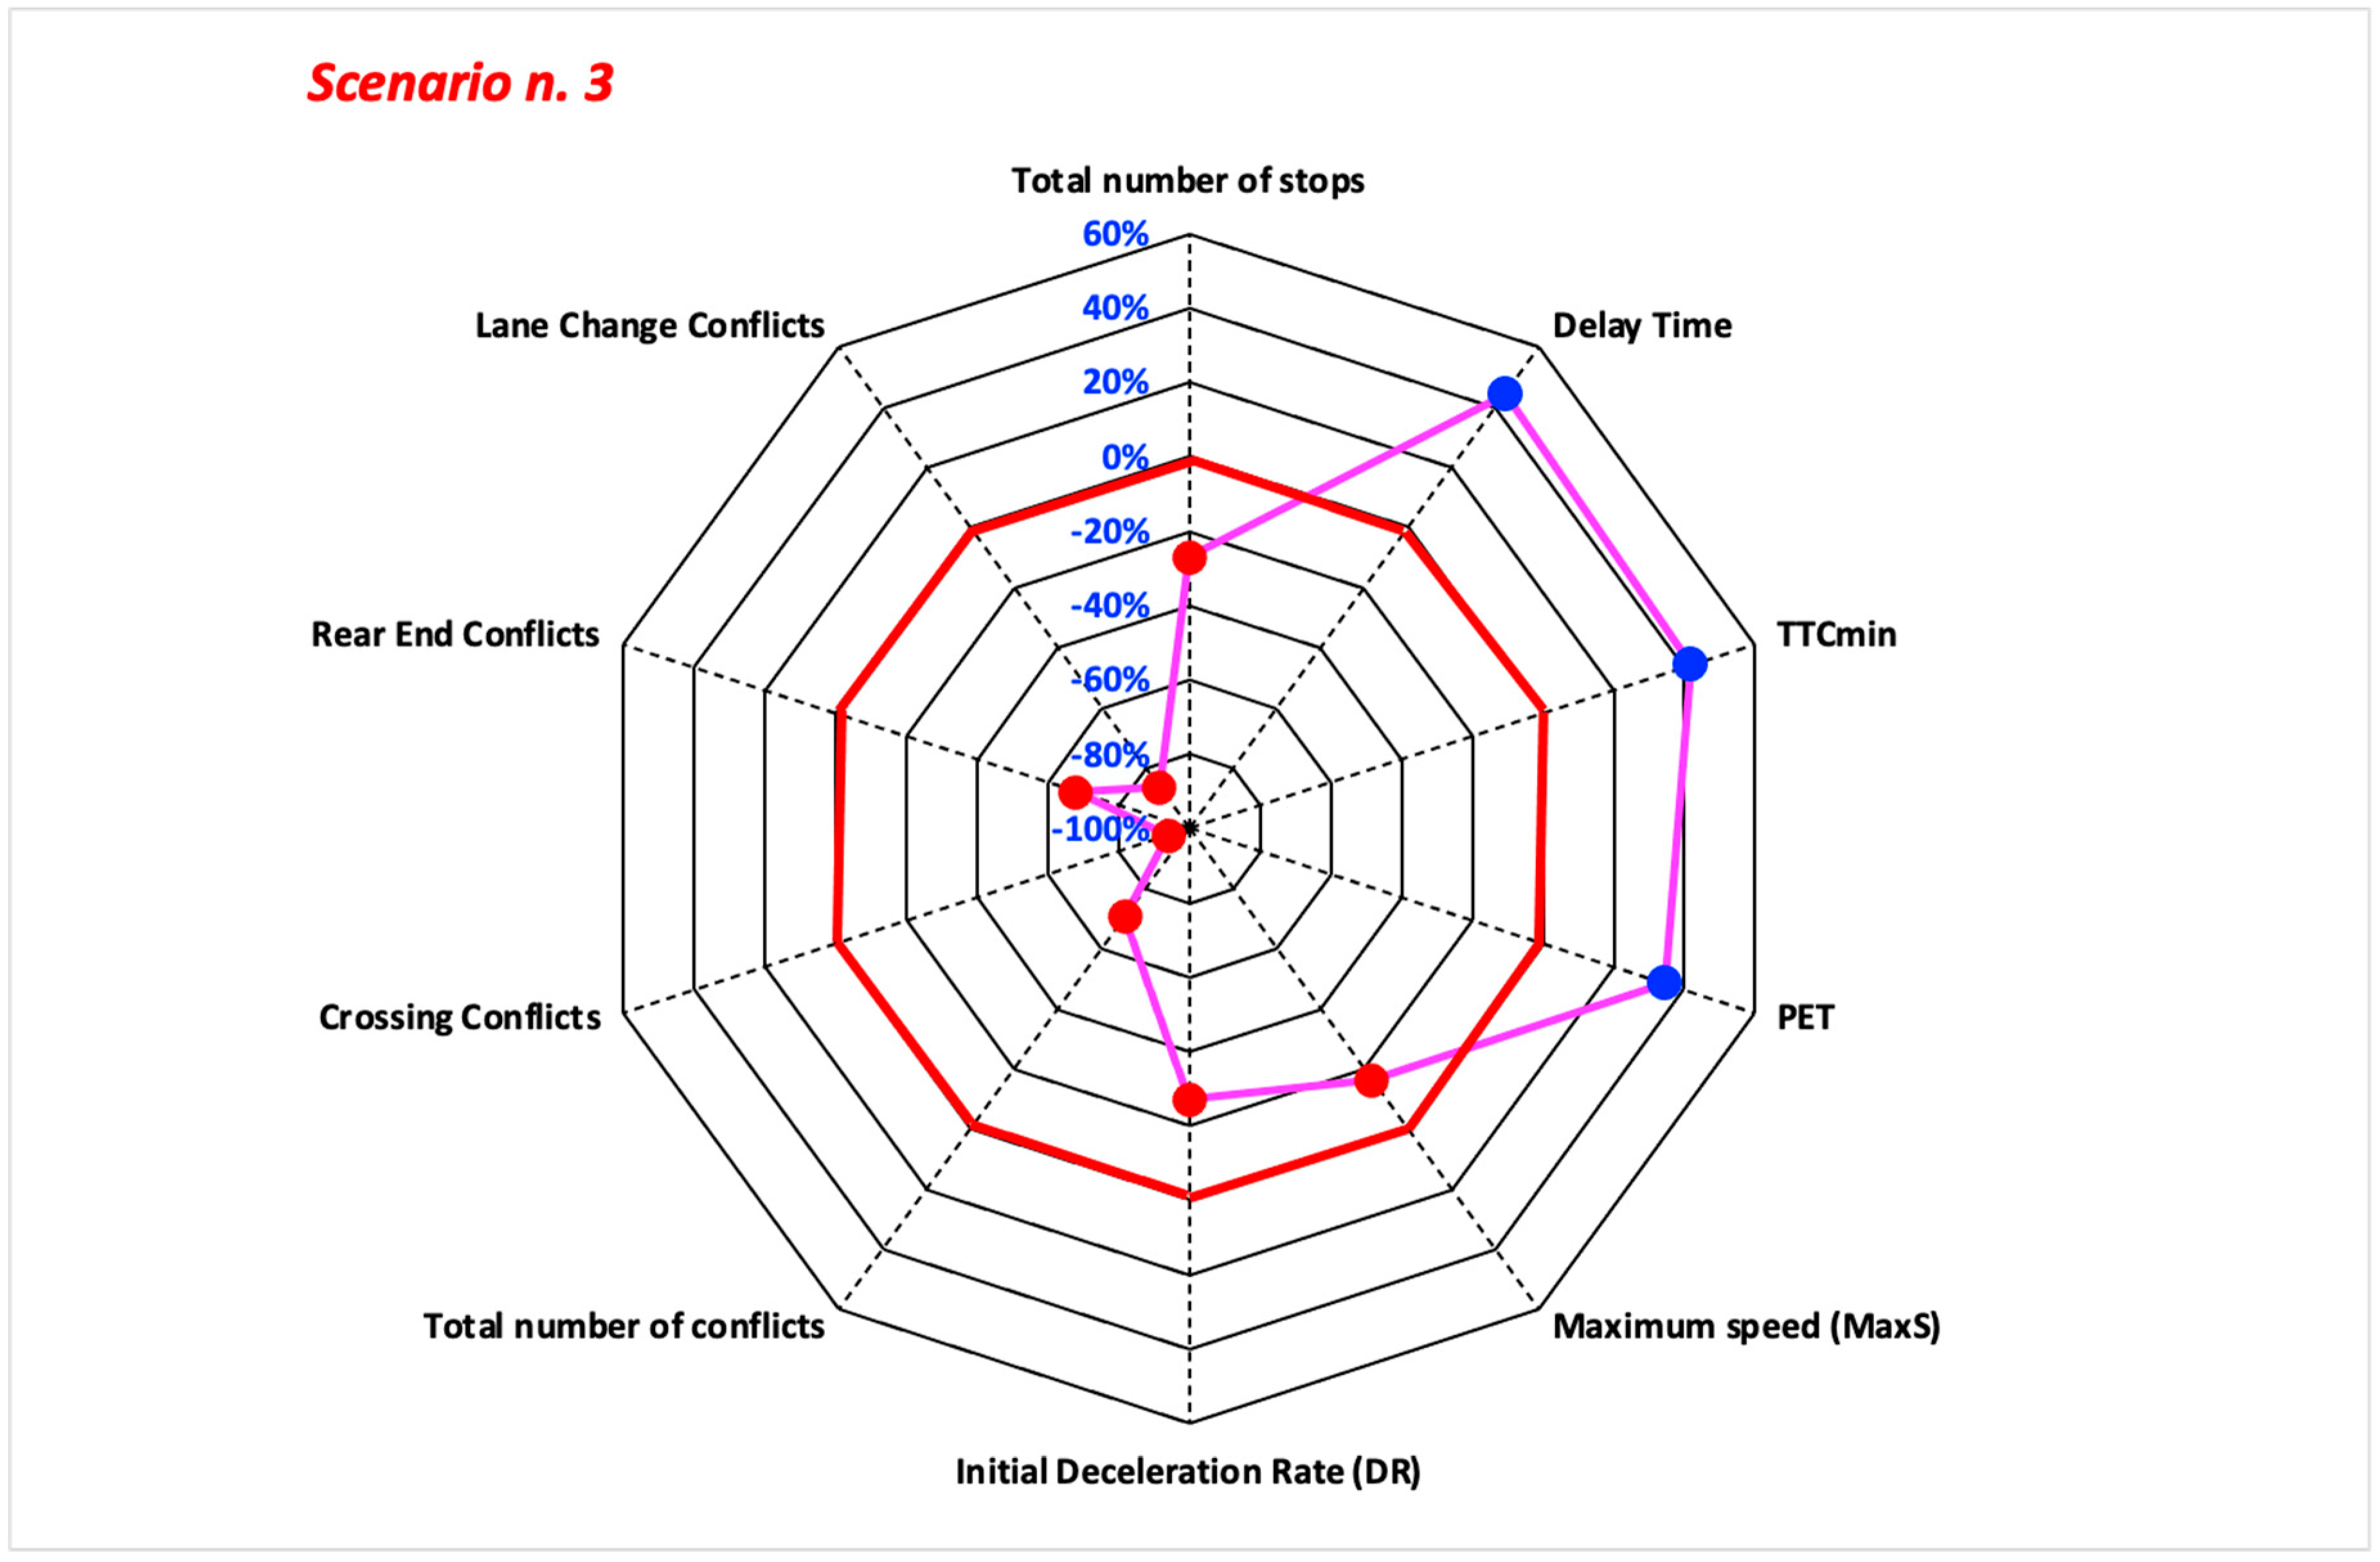
Figure 11.
Percentage variation of the 10 indicators considered (Scenario n. 4).
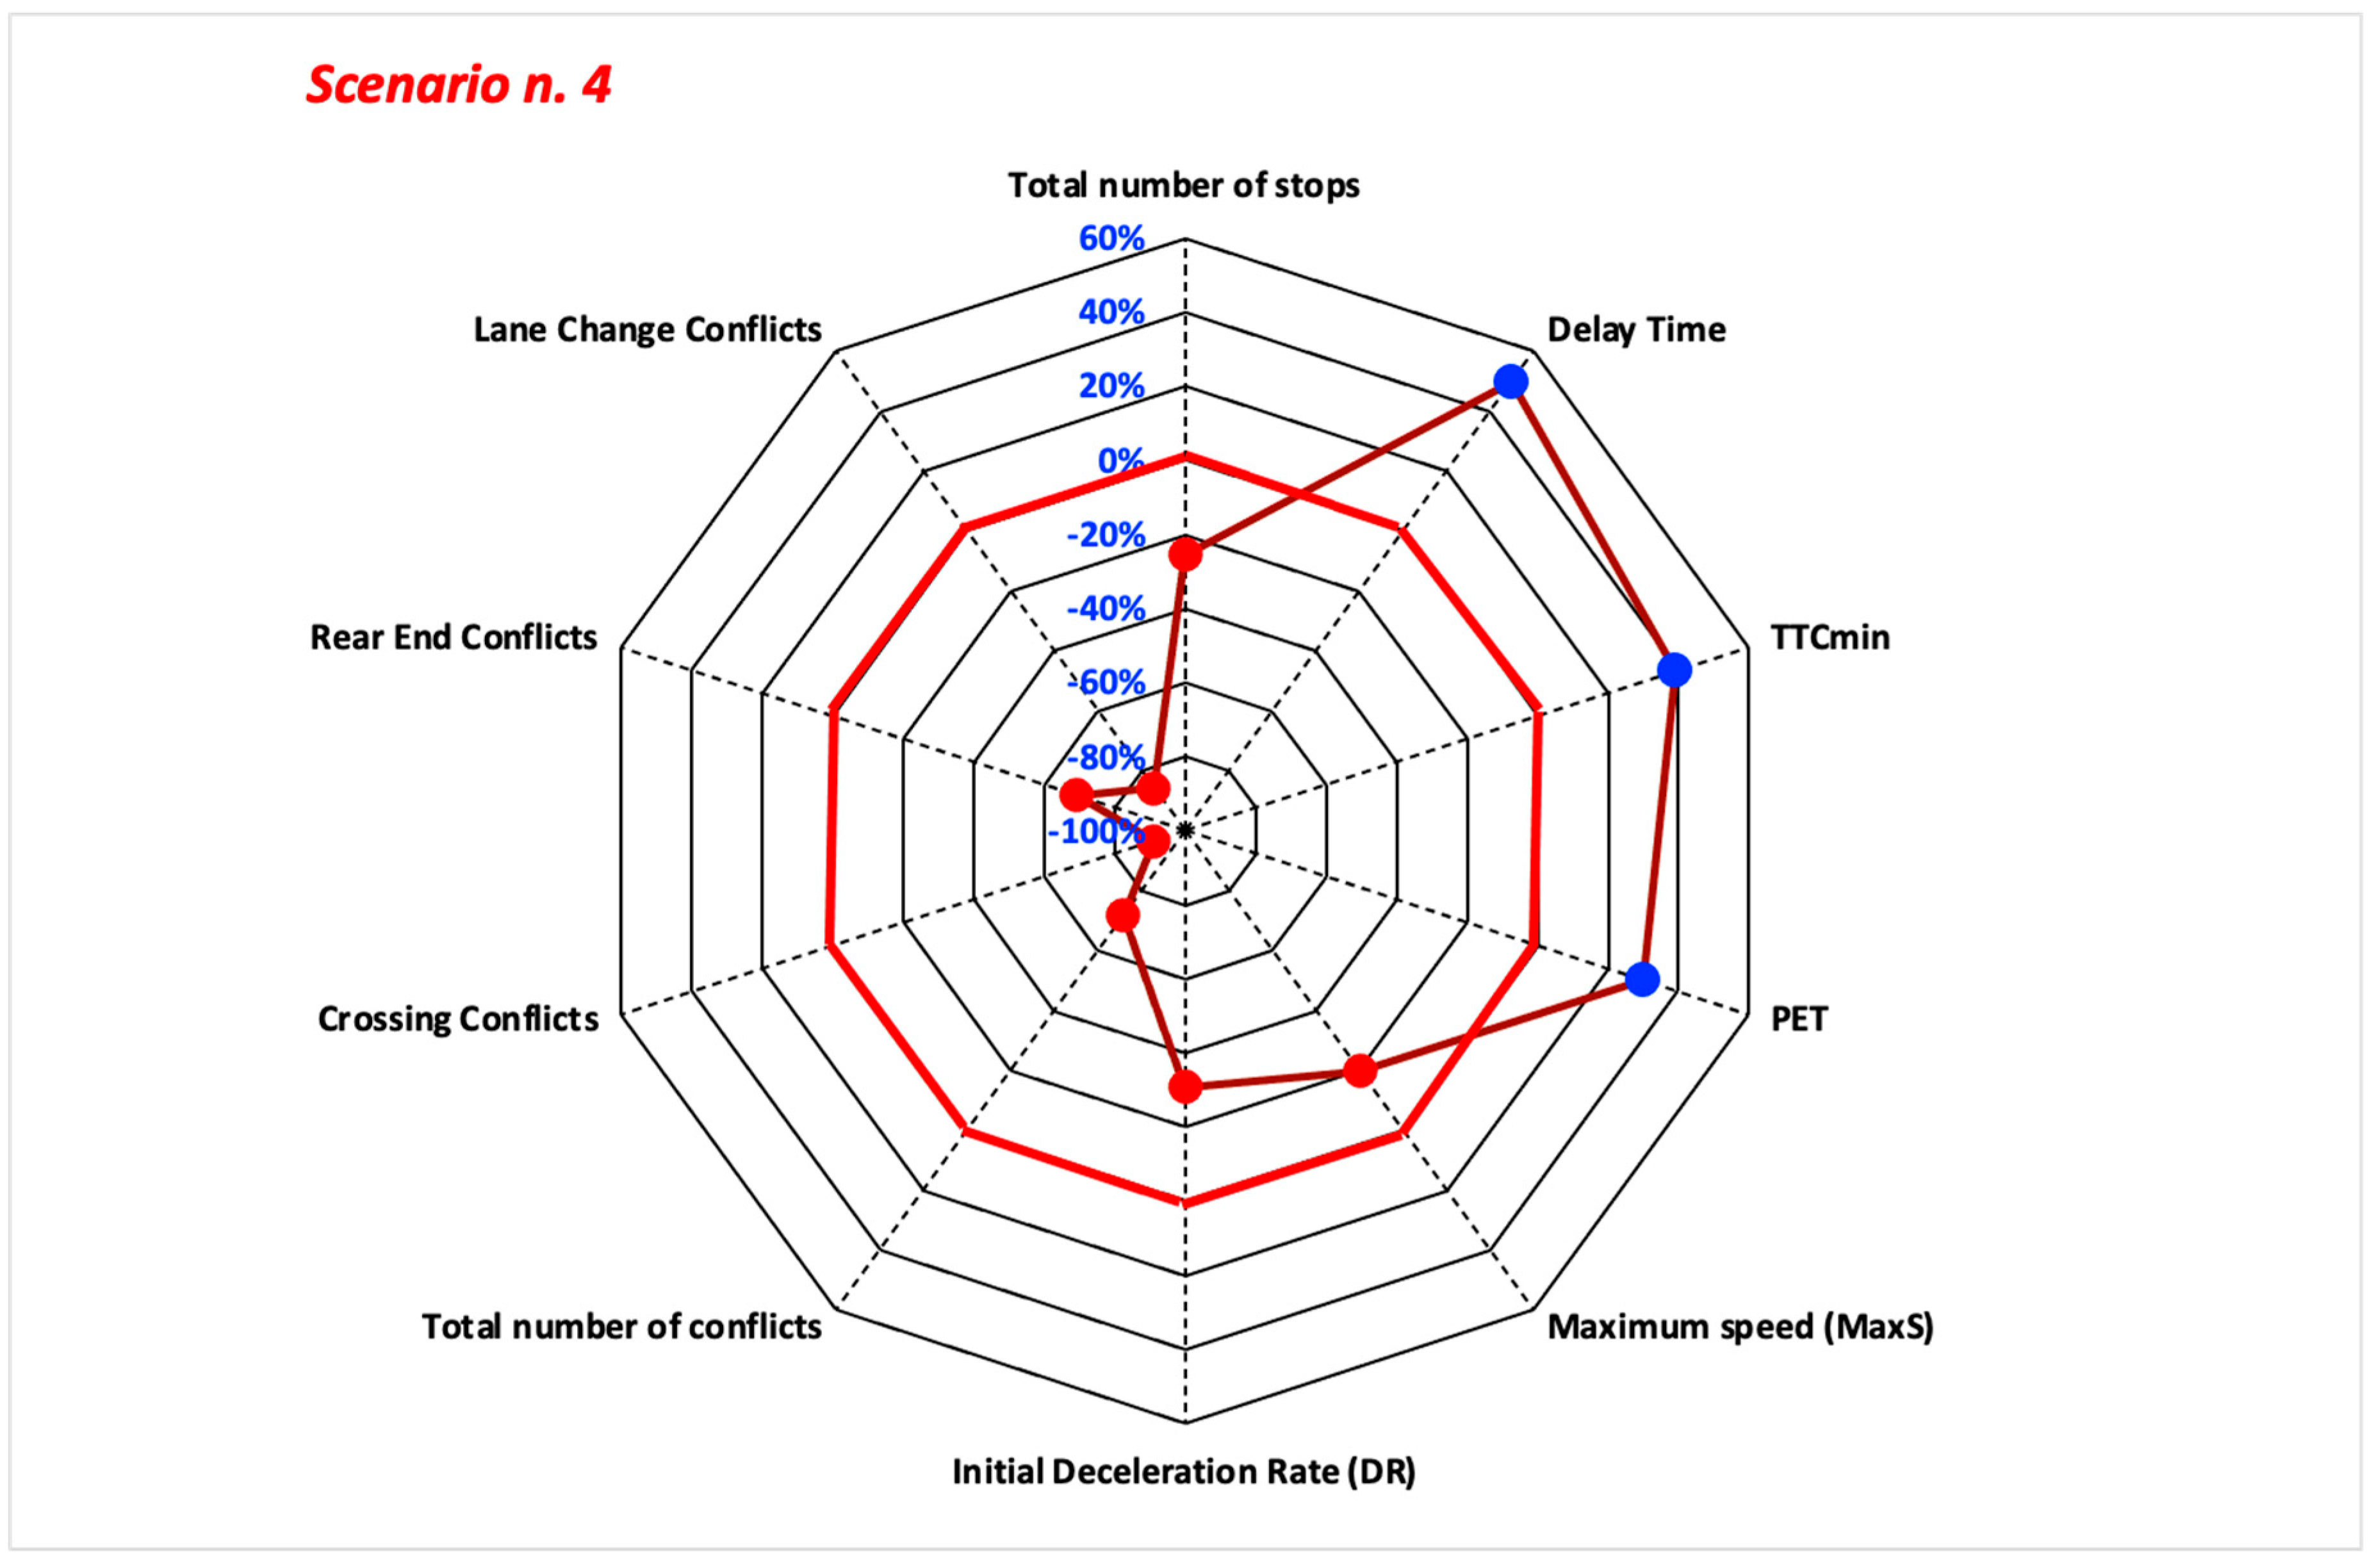
Figure 12.
Percentage variation of the 10 indicators considered (All scenarios).

Table 1.
Advantages and disadvantages of the main micro-simulation software.
| VISSIM | AIMSUN Next | PARAMICS | TRITONE | |
|---|---|---|---|---|
| Advantages | ||||
| User-defined algorithms for vehicle movement control. | X | X | ||
| Appropriate for traffic simulation, traffic data analysis, planning, etc. | X | X | X | X |
| Intersection type is not predefined. | X | |||
| The duration of traffic analysis can be defined by the user. | X | |||
| Includes psycho-physical model for car-following. | ||||
| Includes car-following models and other calibration methods. | X | |||
| Suitable for safety analysis based on vehicle trajectory. | X | X | X | |
| Disadvantages | ||||
| Developing a complete algorithm for safety analysis is difficult, especially for new users | X | |||
| There are few options for modeling accidents. | X | |||
| Coding the inputs and outputs is very time consuming and labor intensive. | X | X | ||
| The modeled trajectories are not realistic. | X | |||
| Traffic volume is determined using origin-destination matrices. | X |
Table 2.
Design parameters of turbo-roundabouts.
| Type of Turbo-Roundabout | ||||
|---|---|---|---|---|
| Design parameter | Mini | Standard | Medium | Large |
| R1 | 10.45 m | 12.00 m | 14.95 m | 19.95 m |
| R2 | 15.85 m | 17.15 m | 20.00 m | 24.90 m |
| R3 | 16.15 m | 17.45 m | 20.30 m | 25.20 m |
| R4 | 21.20 m | 22.45 m | 25.25 m | 29.95 m |
| r1 | 10.95 m | 12.50 m | 15.45 m | 20.45 m |
| r2 | 15.65 m | 16.95 m | 19.80 m | 24.70 m |
| r3 | 16.35 m | 17.65 m | 20.50 m | 25.40 m |
| r4 | 20.70 m | 21.95 m | 24.75 m | 29.45 m |
| Ds | 0.30 m | 0.30 m | 0.30 m | 0.30 m |
| ds | 0.70 m | 0.70 m | 0.70 m | 0.70 m |
| Bi | 5.40 m | 5.15 m | 5.05 m | 4.95 m |
| Be | 5.05 m | 5.00 m | 4.95 m | 4.75 m |
| bi | 4.70 m | 4.45 m | 4.35 m | 4.25 m |
| be | 4.35 m | 4.30 m | 4.25 m | 4.05 m |
| Dv | 5.75 m | 5.30 m | 5.15 m | 5.15 m |
| Du | 5.05 m | 5.00 m | 4.95 m | 4.75 m |
Table 3.
Performance and safety indicators for the road configuration where standard multi-lane roundabouts are present.
Table 3.
Performance and safety indicators for the road configuration where standard multi-lane roundabouts are present.
| Total Number of Stops | Delay Time [s/km] | TTCmin [s] | PET [s] | Maximum Speed (MaxS) [m/s] | Initial Deceleration Rate (DR) [m/s2] | Total Number of Conflicts | Crossing Conflicts | Rear End Conflicts | Lane Change Conflicts | |
|---|---|---|---|---|---|---|---|---|---|---|
| Scenario n. 1 | 1113 | 24.75 | 0.93 | 1.85 | 6.44 | 2.84 | 3364 | 10 | 2911 | 443 |
| Scenario n. 2 | 1313 | 35.89 | 0.91 | 1.91 | 5.82 | 2.87 | 4699 | 23 | 3982 | 694 |
| Scenario n. 3 | 2819 | 74.34 | 0.88 | 1.84 | 4.67 | 2.51 | 9028 | 34 | 7783 | 1211 |
| Scenario n. 4 | 3176 | 91.40 | 0.89 | 1.87 | 4.57 | 2.50 | 9683 | 45 | 8360 | 1278 |
Table 4.
Performance and safety indicators for the road configuration where turbo-roundabouts are present.
Table 4.
Performance and safety indicators for the road configuration where turbo-roundabouts are present.
| Total Number of Stops | Delay Time [s/km] | TTCmin [s] | PET [s] | Maximum Speed (MaxS) [m/s] | Initial Deceleration Rate (DR) [m/s2] | Total Number of Conflicts | Crossing Conflicts | Rear End Conflicts | Lane Change Conflicts | |
|---|---|---|---|---|---|---|---|---|---|---|
| Scenario n. 1 | 1926 | 64.16 | 1.15 | 2.31 | 4.86 | 2.24 | 2009 | 1 | 1798 | 112 |
| Scenario n. 2 | 1999 | 73.44 | 1.23 | 2.49 | 3.98 | 1.96 | 2417 | 2 | 2310 | 156 |
| Scenario n. 3 | 2056 | 107.44 | 1.25 | 2.47 | 3.82 | 1.83 | 2659 | 2 | 2490 | 167 |
| Scenario n. 4 | 2368 | 136.92 | 1.24 | 2.43 | 3.74 | 1.73 | 2741 | 4 | 2567 | 183 |
Disclaimer/Publisher’s Note: The statements, opinions and data contained in all publications are solely those of the individual author(s) and contributor(s) and not of MDPI and/or the editor(s). MDPI and/or the editor(s) disclaim responsibility for any injury to people or property resulting from any ideas, methods, instructions or products referred to in the content. |
© 2023 by the authors. Licensee MDPI, Basel, Switzerland. This article is an open access article distributed under the terms and conditions of the Creative Commons Attribution (CC BY) license (https://creativecommons.org/licenses/by/4.0/).
Share and Cite
MDPI and ACS Style
Leonardi, S.; Distefano, N. Turbo-Roundabouts as an Instrument for Improving the Efficiency and Safety in Urban Area: An Italian Case Study. Sustainability 2023, 15, 3223. https://doi.org/10.3390/su15043223
AMA Style
Leonardi S, Distefano N. Turbo-Roundabouts as an Instrument for Improving the Efficiency and Safety in Urban Area: An Italian Case Study. Sustainability. 2023; 15(4):3223. https://doi.org/10.3390/su15043223
Chicago/Turabian StyleLeonardi, Salvatore, and Natalia Distefano. 2023. "Turbo-Roundabouts as an Instrument for Improving the Efficiency and Safety in Urban Area: An Italian Case Study" Sustainability 15, no. 4: 3223. https://doi.org/10.3390/su15043223
Note that from the first issue of 2016, this journal uses article numbers instead of page numbers. See further details here.