Article

Impact of Key Drivers on Energy Intensity and GHG Emissions in Manufacturing in the Baltic States

by
Vaclovas Miskinis
,
Arvydas Galinis
,
Viktorija Bobinaite
*,
Inga Konstantinaviciute
and
Eimantas Neniskis
Lithuanian Energy Institute, Breslaujos 3, LT-44403 Kaunas, Lithuania
*
Author to whom correspondence should be addressed.
Sustainability 2023, 15(4), 3330; https://doi.org/10.3390/su15043330
Submission received: 25 January 2023 / Revised: 7 February 2023 / Accepted: 9 February 2023 / Published: 11 February 2023

Abstract

:
The improvement in energy efficiency (EE) and increasing consumption of renewable energy sources (RES) in manufacturing play an important role in pursuing sustainable development in the Baltic States and contribute to the transition to a low-carbon economy. This paper presents the results of a detailed analysis of the channel through which EE, along with structural activity changes, passes energy intensity and total energy savings and in combination with other key drivers results in reductions in greenhouse gas (GHG) emissions in manufacturing in Estonia, Latvia, and Lithuania during the period 2010–2020, taking into account the role of transformations in the energy and climate framework of the European Union (EU). The Fisher Ideal Index, the Kaya identity, the Logarithmic Mean Divisia Index (LMDI), and comparative analysis methods are used. The results of the impact analysis of key drivers on energy intensity showed different contributions towards improvements in EE and structural activity changes to changes in energy intensity in manufacturing, which decreased by 53.1% in Estonia, by 30.5% in Lithuania, and by 16.5% in Latvia. The dominant role of EE improvements on total energy savings is identified. The results of the GHG decomposition analysis showed that because of improvements in energy intensity, reductions in the share of fossil fuels, and increases in labour productivity, number of employees, and emissions intensity, the GHG emissions decreased by 35.5% in Estonia, 40.4% in Latvia, and 8.1% in Lithuania. The results confirm the need for new policies and the implementation of relevant commitments to save energy and increase the contribution of RES in all three countries.

1. Introduction

Climate change is becoming an increasingly serious challenge for many countries. Rising global average temperatures and global warming are leading to more frequent droughts, storms, forest fires, and other extreme weather events. To strengthen global action, prevent climate change, and continue efforts to limit the global average temperature increase to 1.5 °C above pre-industrial levels, as defined by the commitments of the Paris Agreement, urgent measures are needed in all countries. The issue of climate-friendly growth was at the heart of the programme of the UN climate change conference (COP27), and the historic decision to establish and operationalise the loss and damage fund promises a major economic transformation in countries around the world.
Estonia, Latvia, and Lithuania have national energy and climate plans and long-term strategies to mitigate climate change and reduce GHG emissions, as required by the energy policy of the EU Commission [1]. An assessment of their long-term strategies has been carried out by the commission. The main findings were presented in [2,3,4], including the analysis of the overall targets focused on GHG reduction, substitution of fossil fuels by RES, improvement of EE, policies, and measures for adaptation to climate change, estimated investment needs and socio-economic impacts of the transition to climate neutrality by 2050.
Climate change mitigation policies in three Baltic countries are based on the reduction in GHG emissions from fuel combustion, industrial processes, agriculture, and waste disposal and treatment. The contribution of land use, land-use change, and forestry activities is also important. The long-term strategies in Latvia and Lithuania include a target to make the European economy climate-neutral by 2050. The overall objective of the Estonian strategy is to reduce GHG emissions by approximately 80% by 2050 compared to the 1990 levels. The indicative milestones for emission reductions in individual sectors are also slightly different. The lack of projections on the share of renewable energy in Estonia and Latvia as well as on the expected emission reductions from industrial sectors in all three countries are considered by experts to be a major shortcoming of these strategies. Therefore, the countries need to implement their long-term national strategies, taking into account the identified shortcomings in line with the common principles of the EU energy and climate change policies.
Assessments of the national energy-climate plans were performed by researchers and energy experts in many countries. Their analysis was focused on comparison of foreseen national and European climate change mitigation goals by 2030 and discussion of energy policies, foreseen measures, and planned tools, taking into consideration specific features and expected challenges in each country. A significant gap between the national decarbonisation targets anticipated in the new climate package and their actual implementation in Germany was revealed in [5]. Assessment of the Italian energy-climate plan in [6] was limited to three dominant objectives: decarbonisation, EE, and the deployment of RES. Implementation of ambitious objectives requires a high level of coordination between the stakeholders and an establishment of relevant capacity in the public administration. In [7], ambitious goals fixed in the national plan, the probability of achieving the objectives, and difficulties that may be encountered in implementing the envisaged policies in Poland were discussed. The possibilities to achieve the targets foreseen in the national energy and climate plans in three Baltic countries were discussed in [8]. The analysis performed was concentrated in three main research fields—climate change mitigation, deployment of RESs, and changes in the household sector. This study covered a wide range of issues, including the assessment of national efforts, the progress of strategies, and climate change mitigation policies in the energy systems, in particular targeting the household sector.
Three Baltic countries have inherited from their Soviet past energy-intensive industries that depend on a large share of imported fossil fuels. The transformation of the manufacturing sector is very important not only in terms of economic development, but also in terms of opportunities to contribute meaningfully to climate change mitigation. Therefore, it is important and relevant to assess the real trends in RES deployment, GHG emission reductions, and the effectiveness and sustainability of policies in individual manufacturing industries at national and regional levels. This study contributes to the existing scientific literature by providing an integrated analysis of EE improvements, GHG emission trends, and the impact of key drivers on their reduction in manufacturing in Estonia, Latvia, and Lithuania.
The research aims are as follows:
  • To provide an in-depth analysis of energy intensity trends in manufacturing in Estonia, Latvia, and Lithuania over the period 2010–2020.
  • To examine the effects of EE and structural changes in activities underlying the decline in energy intensity in manufacturing in the Baltic countries.
  • To examine the effects of changes in the number of employees, labour productivity, declining energy intensity, RES deployment, and the variation in emissions intensity that underlie the decline in GHG emissions in manufacturing in three Baltic countries.
  • To compare the trends in the key drivers and their impact on the reduction in GHG emissions in three Baltic countries and in the EU−27 countries.
The effects of EE and changes in the structure of economic activities, which stimulate the reduction in energy intensity in manufacturing industries, have been identified using the Fisher Ideal Index. An extended Kaya identity and the Logarithmic Mean Divisia Index (LMDI) method were used to assess the impact of changes in the number of employees, labour productivity, energy intensity, RES deployment, and the variation in emissions intensity on the reduction in GHG emissions in Estonia, Latvia, and Lithuania and in the EU−27 countries. The methodology and results of this research describe its scientific novelty. This methodology allowed us to carry out an in-depth quantitative and qualitative analysis of the changes in manufacturing, and to identify the impact of driving factors on the reduction in energy-related GHG emissions. Specific features were identified in each country, taking into account peculiarities and the role of traditional industries and other manufacturing sectors.
The paper is structured as follows: Section 2 reviews the relevant literature, Section 3 presents the methodology of this paper and the sources of information used in the preparation of this research, and Section 4 presents the analysis of energy intensity trends in manufacturing and in individual industries, as well as the factors underlying the reduction in energy intensity trends in manufacturing. This section also presents the results of the analysis of GHG emission trends and the impact of driving factors that support and diminish further reductions in these emissions in three Baltic countries. Section 5 presents a discussion and comparison of indicators in the Baltic States and in the EU−27 countries. Concluding remarks are presented in Section 6.

2. Literature Review

The global long-term temperature goal set out in the Paris Agreement is very important as the fundamental direction of the international climate policy. As the world faces major challenges to reduce global GHG emissions, a comprehensive analysis of achievements, policies implemented, and relevant instruments at global and national levels is needed. Studies by many researchers have focused on the analysis of GHG emission trends, the expected potential for emission reductions, the factors that contribute to the change in energy-related emissions, etc. In [9], a computable general equilibrium model was used to assess GHG reduction scenarios in seven Asian countries. Challenges in the energy systems of individual countries were identified and the importance of national actions and policies was emphasised. In [10], based on the application of the Kaya identity, different scenarios of carbon emissions from fuel combustion up to 2050 were analysed. The importance of developed countries and major emitters to reduce their GHG emissions was emphasised. The role of RES as a leading factor in the transition to a low-carbon energy mix was highlighted. In [11], trends in carbon dioxide (CO2) emissions in China, the world’s largest emitter, were discussed. Four indicators, such as gross domestic product (GDP) per capita, population size, carbon intensity, and energy intensity, were identified as the main drivers of energy-related CO2 emissions. Economic growth and population size were identified as the main factors influencing the growth of CO2 emissions in the long-term. In [12], the factors underlying the change in energy-related CO2 emissions in the Chinese industrial sector over the period 1991–2010 were analysed using the LMDI method. A long-term relationship between industrial CO2 emissions and the driving factors (industrial value added, labour productivity, fossil fuel consumption, and CO2 emissions per unit of energy consumption) was demonstrated. The growth of industrial activity was defined as the main factor contributing to the increase in CO2 emissions, while the reduction in energy intensity was highlighted as the main factor contributing to the decrease in these emissions. In [13], based on the application of the LMDI method and the Kaya identity, the impact of carbon intensity, energy consumption structure, energy intensity, labour productivity, and industrial scale on the amount of CO2 emissions in China’s energy-intensive industries by 2030 and the potential for expected reductions were identified. In [14], a production-theoretical decomposition analysis and an index decomposition analysis were used to study the changes in CO2 emissions in Chinese industry. The roles of energy mix change, energy intensity change, economic activity growth, EE, energy saving technology change, GDP technical efficiency, and GDP technology change were evaluated. GDP change, technology change, and energy intensity change were defined as the dominant contributors to the reduction in CO2 emissions in the industrial sector. In [15], based on the application of the Kaya identity and indicators of population size, GDP per capita, energy intensity, emission intensity, the peak of energy consumption in China in 2035–2040, and the peak of CO2 emissions in 2030–2035 were revealed. In [16], a modified global change assessment model was applied to study the peak energy consumption and CO2 emissions in China’s industrial sector. Based on the quantitative analysis of two scenarios, energy consumption and CO2 emissions in this sector will peak by 2025. To achieve a gradual reduction in emissions growth by 2050, optimisation of the industrial structure and implementation of low-carbon energy policies were recommended.
EE improvements, increasing the contribution of RESs, and energy sufficiency (ES) are the most important factors for sustainable economic growth. An important role of these factors in mitigating global climate change has been identified by researchers and economists in many countries. Several indicators have been used in different studies to compare changes in EE. The most common indicator of EE used in statistics [17,18] is energy intensity, measured as gross inland energy consumption per unit of GDP. Although the assessment of overall EE and even the evaluation of energy saving potentials could be based on the comparison of such aggregated energy intensity indicators in different countries, the need for a more detailed analysis of changes in EE has been highlighted by many researchers [19,20,21]. The role of technical efficiency improvements was assessed in [19]. The extended Kaya identity was applied to assess the carbon abatement potential of technical efficiency improvements at different energy conversion stages of the energy system in China. Technical efficiency improvements, including electricity efficiency, conversion efficiency and passive efficiency, have the potential to reduce carbon emissions by 59% during the energy transition. In [20], a literature review of models for EE assessment and measurement in energy-intensive industries was presented and six factors influencing EE in individual sectors were discussed. In [21], it was emphasised that the comparative indicator of primary energy intensity cannot fully reflect the changes in EE in different countries. A detailed analysis of the changes in final energy intensity in individual sectors in the Baltic States was presented.
In [22], changes in EE were examined as a relationship between outputs and inputs in nine countries. Based on the application of the economic value-added method, the number of employees in the energy industry, energy consumption, and the amount of energy services were chosen as the inputs, while CO2 emissions per capita and industrial profit were chosen as the outputs. In [23], the main factors influencing the reduction in energy intensity at the provincial level in China were identified. Based on the application of decomposition analysis and econometric analysis, the significant role of rising income was highlighted and the need for fundamental changes in economic structure was emphasised. In [24], the changes in energy intensity from 2006–2010 and the policy mechanisms in China were evaluated. Based on the implementation of market-based mechanisms, the potential to modernise the traditional industrial structure and to reduce energy consumption and GHG emissions was identified. In [25], scenarios of energy demand in the industrial sector for 2009–2050 were estimated for the world regions. The study highlighted the importance of EE measures in this sector and provided insights into the energy-saving potential in different regions of the world. In [26], EE and new technologies used for RES deployment were assessed as the most important factors for an accelerated energy transition by 2050. The possibility to increase the share of RES from 15% in 2015 to 63% of the global primary energy supply in 2050 was shown in the study. In [27], a comparative analysis of the energy consumption and efficiency of the Japanese and Chinese manufacturing industries was presented. Based on the application of decomposition analysis, the improvement of EE was highlighted as the main factor contributing to the reduction in energy intensity in both countries. In [28], the importance of EE for climate change mitigation in the manufacturing sector in Latvia was discussed. The LMDI method was used to assess the role of activity changes, structural effects, and EE improvements on energy consumption in individual manufacturing industries. In [29], the problems of low-carbon development in the Polish energy sector were analysed. The need to increase the use of renewable energy was emphasised. Insufficient government support, relatively low GDP per capita, and insufficient use of innovation potential were identified as the main barriers to a shift away from coal.
Reduction in GHG emissions from the transport sector has an important role in climate change mitigation, but achieving this objective is challenging and requires the implementation of specific policies. In 2020, transport emissions accounted for 29.2% of energy-related emissions in the EU−27. In many countries, the share of transport emissions is even higher than 40%. Total energy-related GHG emissions in the EU−27 countries have fallen by 35.1% over three decades, but transport emissions are 3.0% higher than in 1990. In [30], the impact of uncertainties in the transport sector during the transition to a low-carbon energy system in the EU was analysed. The priority of decarbonising passenger transport and early deployment of electric vehicles were highlighted. In [31], growing contribution from advanced biofuels, based on tailored policy interventions, was identified as an essential measure for the gradual decarbonisation of the transport sector. In [32], public opinion, awareness, and knowledge were examined as important factors, together with large investments and government commitments, contributing to the social acceptance of biofuels in the Finnish transport sector. In [33], the development of alternative fuels, including electricity, gaseous, liquid, and solid fuels, was discussed as an important part of US energy policy. Liquid fuels were assessed as the dominant alternative in the transport sector, taking into account the existing transportation infrastructure and general trends in the alternative fuel market. In [34], based on the application of the extended STIRPAT model, the effects of population, economic activity, transport volume, transport energy intensity, modal split of transport activity, and energy source mix on GHG emission trends in the EU transport sector were identified. Improvements in transport energy intensity, the shift from road to rail, and the switch from oil products to electricity were identified as the most effective measures to reduce transport emissions. In [35], EE in the Japanese transport sector since the 1970s was studied. Little improvement was observed in the energy intensity of road transport, but low energy intensities of bus and rail transport had a positive impact on EE and CO2 emissions. In [36], the LMDI decomposition analysis was used to evaluate energy consumption and EE in China’s transport sector from 2003–2009. The activity effect was found as the main factor causing an increase in energy consumption and, conversely, the positive changes in energy intensity due to implementation of new EE policies in this sector were highlighted. In [37], the need to highlight the role of ES in climate plans and strategies in the EU countries was discussed. Efforts of governments should focus on less-energy-intensive services in different sectors. The study examined various sufficiency-related policy measures, most of which were identified in the transport sector, such as the reduction in travel distances, the implementation of modal shift policies, and the use of public transport.
Buildings have a high potential for reduction in GHG emissions due to the large amount of energy consumption and the large contribution of fossil fuels. The importance of EE improvements and the deployment of RESs were identified by many researchers as the most important policies and measures to change the structure of energy consumption in households, reduce GHG emissions, and facilitate the transition to a low-carbon future. In [38], the energy performance of building directive was revised and an overview of the recent policy developments as well the introduced provisions on new and existing buildings was presented. Though nearly-zero-energy buildings remain the current building standard for new buildings, insights into zero-energy buildings and market readiness for rapid implementation of this standard were provided in the study. In [39], building codes or standards and energy pricing systems in the residential sector were discussed. The study highlighted the lack of perfect information and rational decision-making, and the effectiveness of energy certificates and labels, feedback programmes, and energy audits. In [40], the benefits of energy-saving measures in Swiss residential buildings were demonstrated in terms of reduced energy consumption, improved indoor air quality, thermal comfort, and protection against external noise. According to the analysis presented in [41], EE improvements and GHG reductions have not yet reached the level of households’ willingness to pay. Behavioural and psychological barriers have been identified as the main reasons for the weak performance of climate change policies focused on the household sector. In [42], the consumption of energy sources in Polish single-person households and the main factors influencing energy poverty, including the income level, demographic, social, and socio-economic characteristics of residents, were assessed. In [43], ES, leading to an absolute reduction in energy demand, was emphasised as the best way to achieve net-zero climate goals. ES can contribute to a reduction in energy consumption and the investment needs in the energy sector. The potential for reduction in energy demand, associated GHG emission savings and the resulting change in the energy mix by limiting the heated floor area per capita in Lithuania and Hungary, was highlighted. In [44], ES was highlighted as an important energy policy instrument in the building sector, taking into account more efficient use of living space, development of the existing building stock, changes in behaviour, and quality of living standards. In [45], a review of studies focused on the assessment of willingness-to-pay energy for efficiency improvements and RES deployment was presented. In order to provide a basis for comparison, the common variables between different studies were identified and the key variables were selected. The paper is valuable as an analytical structure for future studies focused on assessing the impact of variation in key comparative elements.
The contribution of RESs in the residential sector to climate change mitigation is an important factor in many countries. However, the potential of RES deployment in this sector is still not realised due to many reasons and barriers. In [46], the low environmental awareness of the benefits of renewable energy, lack of infrastructure required for faster deployment of RESs, and financial barriers to the installation of renewable energy technologies were identified as the main barriers to sustainable energy consumption in households. In [47], the barriers to the use of renewable energy for electricity generation and heating in Croatia were discussed, including energy and environmental policies, subsidies for fossil fuels, the role of international financial institutions, the monopoly of electricity companies, the lack of necessary information, and administrative barriers. The need to implement appropriate regulatory instruments at a national level and to strengthen the role and responsibility of local authorities was highlighted. Based on the analysis presented in [48], the potential of RES deployment in households is still not realised due to behavioural and other barriers. High up-front costs and long pay-back periods, lack of information and knowledge, low priority of environmental concerns, lack of necessary infrastructure, and resistance to change human habits as the most common barriers to the acceptance of RES technologies were identified in the study. The role of decision-making in the implementation of RES technologies in the household sector, as well as the importance of developing appropriate policies and measures to promote RESs, were emphasised.
Research focusing on the analysis of EE trends and the role of RES in reducing energy-related GHG emissions in manufacturing is very limited. Therefore, we contribute to the existing literature by conducting an in-depth analysis of the factors influencing the change in EE and GHG emissions in manufacturing in three Baltic countries.

3. Methodology

The methodology and research were focused on answering the scientific questions: How does the energy intensity in manufacturing and its branches change? What are key drivers and their effects on energy intensity? What are the effects of changes in energy intensity on energy savings? How do changes in EE impact changes in GHGs in context of other drivers of emissions?

3.1. Data and Their Preparation

The analysis was performed considering a time series data from 2010–2020, which were collected from the databases of Statistics Estonia [49,50], Official Statistics Latvia [51,52], Statistics Lithuania [53,54], the National Inventory Submissions 2022 [55], and the Statistical Bureau of EU (Eurostat) [56,57,58,59]. While detailed data about energy consumption and economic development in manufacturing of the Baltic States were extracted from the systems of national accounts, the aggregated indicators were taken from the Eurostat database. Extracted data were revised and regrouped for comparability. Data availability enabled performing research both at an aggregated level of manufacturing and its branches in the Baltic States, thus revealing historical differences in the countries and their manufacturing and among variety of branches. The multifaceted analysis makes our study unique in the context of already-conducted studies, which were reviewed in Section 2. Statistics of the Baltic States provide data on various branches. A detailed rationale for the selection of particular branches for the study was based on the assessment of VA created by the branch and the volume of energy consumption (Table 1).
Manufacturing generates a relevant share of economic value and influences strongly overall economic growth in three Baltic countries. During 2010–2020, VA generated in this sector increased in Estonia by 3.4%, in Latvia by 3.1%, and in Lithuania by 4.5% per annum. Different trends are observed in branches both in VA generated and energy consumption. Manufacture of food products and beverages, wood and paper products, non-metallic mineral products, textile and leather products, and chemical products have traditionally been the most significant branches. A large population was employed in the sector. They generated the majority of products for the domestic market and for export. Traditional branches consumed a lot of energy resources, but they grew in terms of VA created at a moderate pace—in Estonia by 2.1%, in Latvia by 2.2%, and in Lithuania by 4.0% per annum. This growth was associated with changes in final energy consumption. It grew by 3.5% in Latvia and by 0.4% in Lithuania but decreased by 3.9% per annum in Estonia. Contribution of traditional branches into total VA generated by manufacturing decreased in all three countries. In 2020, share of these branches amounted to 50.5% in Estonia, 66.4% in Latvia, and 60.7% in Lithuania. Manufacture of basic metals and fabricated metal products, electrical equipment, machinery and equipment, transport equipment, computers, electronic and optical products, furniture, and other industries with the capability of creating high VA grew faster than traditional industries. Total VA generated by these industries increased over the last decade in all three countries at a rate of 5.1% per annum. It is important to emphasise that due to structural changes, rapid growth of economic activities was achieved by different consumption of energy resources. In 2020, total final energy consumption in these branches in Estonia was 39.6% and in Latvia 76.9% less, but in Lithuania was 58.0% higher, compared with the 2010 level.
After assessing the VA created by the branches and the volume of energy consumption (Table 1), we chose to analyse such branches as manufacture of food products and beverages, manufacture of wood and paper products, non-metallic mineral products, manufacture of chemical products, manufacture of textile and leather products, and other industries.

3.2. Calculation of Final Energy Intensity in Manufacturing and Its Branches

Energy intensity is defined as the quantity of energy required per unit of output or activity [60] and is determined as the ratio of the fundamental factors, which are total energy consumption and GDP [61]. Low energy intensity is desired by the country because it is related to an efficient allocation of energy resources for wealth creation and achievement of a high quality of life [62]. After choosing to examine the manufacturing and its branches, we focus on a particular case of energy intensity referred to energy consumed in manufacturing and its branches per value added. The energy intensity in manufacturing is computed by Equation (1):
e t = F E t V A t = i F E i ; t V A i ; t × V A i ; t V A t = i e i ; t × ω i ; t
where et is the energy intensity in manufacturing of each country in time t, kgoe/thousand EUR; FEt is the country’s energy consumption in manufacturing, kgoe; FEi;t represents energy consumption in branch i, kgoe; VAi;t is the value added generated in branch i, thousand EUR; and VAt is the total value added generated in manufacturing in time t, thousand EUR. Thus, et denotes energy consumption per unit of the country’s VAt in manufacturing in time t. In this paper, we detailed et by expressing it as the sum of energy intensities in separate branches in year t (ei;t) weighted by shares of their activity in the total value added in that year (ωi;t).
Trend and comparative analysis methods are applied to observe the historical changes in energy intensity in manufacturing and to evaluate the results in relation to different industrial branches and countries. The observed downward trend of the e t indicator tells us that energy intensity improved over the period.

3.3. Calculation of Energy Savings

The index decomposition analysis, which was analysed in [63,64], is used to calculate energy savings caused by changes in energy intensity in manufacturing, which itself is considered dependent on 2 drivers—improvement in EE and variations in structure of economic activity.
For that purpose, the energy intensity index is calculated. Its general expression is:
I t = e t e o = i e i ; t × ω i ; t i e i ; o × ω i ; o
where It is the energy intensity index in manufacturing in year t and eo is the energy intensity in manufacturing in the base year, kgoe/thousand EUR. In the paper, we considered that the base year was 2010.
The It is decomposed into the indices of energy efficiency (Ieff;t) and activity (Iact;t) [65], the key drivers of energy intensity in manufacturing in year t, by Equation (3):
I t = I e f f ; t × I a c t ; t
The Fisher Ideal Index, introducing relevant properties of a time reversal (symmetry) and a product test (the wider explanation of which is given in [66]), is applied to ensure an accurate decomposition of It. It is calculated as a geometric average of the indices of Laspeyres and Paasche [65,66] of energy efficiency and activity by Equation (4):
I e f f ; t = L e f f ; t × P e f f ; t   and   I a c t ; t = L a c t ; t × P a c t ; t
where L e f f ; t is the Laspeyres index of energy efficiency in year t; P e f f ; t is the Paasche index of energy efficiency in year t; L a c t ; t   is the Laspeyres index of activity in year t; and P a c t ; t — Paasche index of activity in year t.
As it is noted by [67], the Fisher Ideal Index is used to correct the upward bias of the Laspeyres index and the downward bias of the Paasche index. The Laspeyres indices of energy efficiency and activity in year t are calculated by Equation (5):
L e f f ; t = i e i ; t × ω i ; 0 i e i ; 0 × ω i ; 0 ,         L a c t ; t = i e i ; 0 × ω i ; t i e i ; 0 × ω i ; 0
The Paasche indices of energy efficiency and activity in year t are calculated by Equation (6):
P e f f ; t = i e i ; t × ω i ; t i e i ; 0 × ω i ; t ,         P a c t ; t = i e i ; t × ω i ; t i e i ; t × ω i ; 0
The total energy savings (Esav;t) are computed as a difference in energy that is consumed in branch i if energy intensity stays at the level as it was in the base year (2010) and the actual energy consumption in year t by Equation (7):
E s a v ; t = i ( ( e i ; o × V A i ; t ) F E i ; t )
The E s a v ; t are allocated to the effect of energy efficiency ( E e f f ; t ) and the effect obtained from the structural changes in activities ( E a c t ; t ) by Equation (8):
E s a v ; t = E e f f ; t + E a c t ; t = E s a v ; t ( ln ( I e f f ; t ) / ln ( I t ) ) + E s a v ; t ( ln ( I a c t ; t ) / ln ( I t ) )

3.4. Calculation of Changes in GHG Emissions

Seeking to assess the impact of energy intensity in manufacturing on GHG emissions, the Kaya identity [68] was used. The method is selected for its specificity to quantify total GHG emissions considering key drivers, including energy intensity. Following the Kaya identity, total GHG emissions in manufacturing are computed by Equation (9):
C t = L t × V A t L t × F E t V A t × F F t F E t × C t F F t
where C t is the total GHG emissions in manufacturing in year t, ktCO2eq.; L t is the number of employees in manufacturing in year t, in persons; and F F t is the total consumption of fossil fuels in manufacturing in year t, kgoe.
Emphasising the energy and economic meaning of variety of interrelated indicators, Equation (10) is equivalently re-written to:
C t = L t × E t × I t × F t × W t
where E t is the labour productivity in manufacturing in year t, thousand EUR per person; I t is the energy intensity in manufacturing in time t, kgoe/thousand EUR; F t is the share of fossil fuels in energy consumption in manufacturing in year t; and W t is the emissions intensity, ktCO2eq/kgoe.
The 5-driver model of GHG emissions described by Equation (10) shows that GHG emissions in manufacturing is an outcome of employment, labour productivity, energy intensity, fossil fuels, and emissions intensity in the sector. High values of key drivers result in high GHG emissions in manufacturing and vice versa. Thus, Equation (10) is used to quantify the level of GHG emissions in absolute values in year t. Additionally, indices of C t ,   L t , E t ,   I t , F t , W t are calculated considering the basic principles of I t estimations by Equation (2). Indices provide relevant explanatory insights about trends of GHG emissions. Namely, analysis of them allows us to identify groups of factors supporting and diminishing reductions in GHG emissions. Factors with upward indices are grouped as diminishing, but factors with downward indices are grouped as supporting reductions in GHG emissions.
The LMDI decomposition method [69] is applied to calculate relative changes in GHG emissions during the base year 0 and year t. The method is selected as it is recognised as matured [70], assuring perfect decomposition, deals well with zero values in a data series [71], is adaptable, easily used, and provides readily interpreted results [72]. It is commonly selected for policymaking and assessment of key drivers of GHG emissions [63,64,69]. An additive decomposition technique is selected. An absolute change in GHG emissions is decomposed by the effects:
Δ C t 0 = C t C 0 = Δ L t 0 + Δ E t 0 + Δ I t 0 + Δ F t 0 + Δ W t 0
where ΔLt−0 is the effect of employees between year t and base year 0, MtCO2eq.; ΔEt−0 is the effect of labour productivity between year t and base year 0, MtCO2eq.; ΔIt−0 is the effect of energy intensity between year t and base year 0, MtCO2eq.; ΔFt−0 is the effect of reduced consumption of fossil fuels due to their substitution by RES between year t and base year 0, MtCO2eq.; and ΔWt−0 is the effect of GHG emissions intensity between year t and base year 0, MtCO2eq.
The sum of changes in effect of all key drivers is equal to total change in GHG emissions. The effect of each key driver is calculated by Equations (12)–(16):
Δ L t 0 = C t C 0 l n C t l n C 0 × ln ( L t L 0 )
Δ E t 0 = C t C 0 l n C t l n C 0 × ln ( E t E 0 )
Δ I t 0 = C t C 0 l n C t l n C 0 × ln ( I t I 0 )
Δ F t 0 = C t C 0 l n C t l n C 0   x × ln ( F t F 0 )
Δ W t 0 = C t C 0 l n C t l n C 0 × ln ( W t W 0 )
The advantage of the 5-driver GHG emissions model is its ability to assess the impact of changes in EE (this is possible through the estimation of effect of energy intensity) on developments in GHG emissions in the context of other drivers. The comparison of effects substantiates the importance of EE achieving the goal of reducing GHG emissions.

4. Results

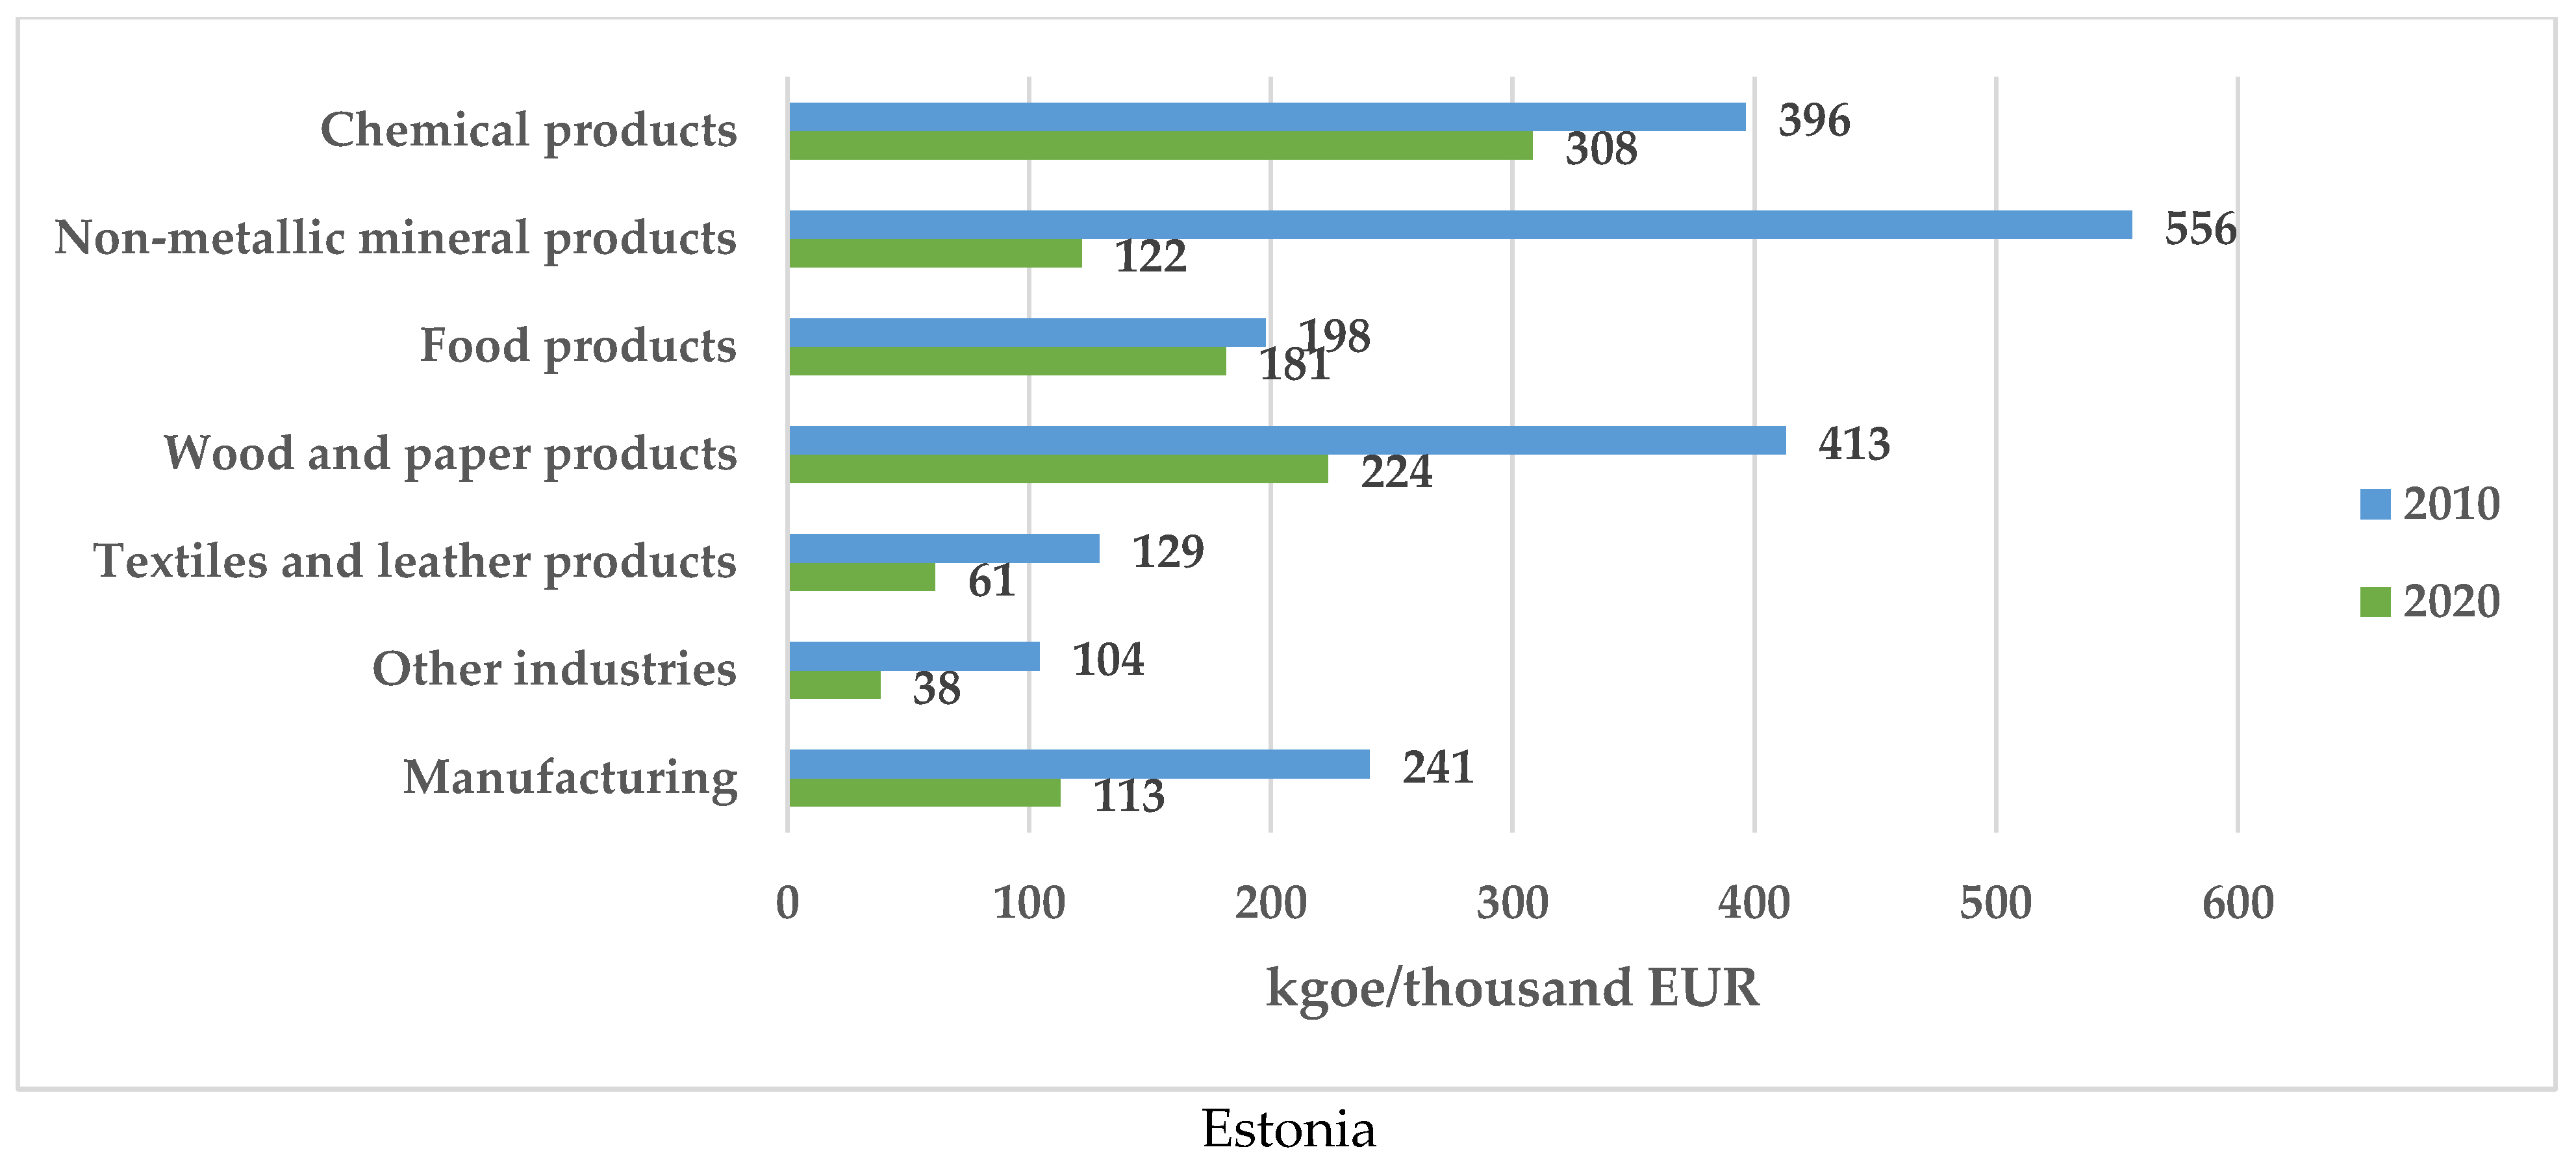
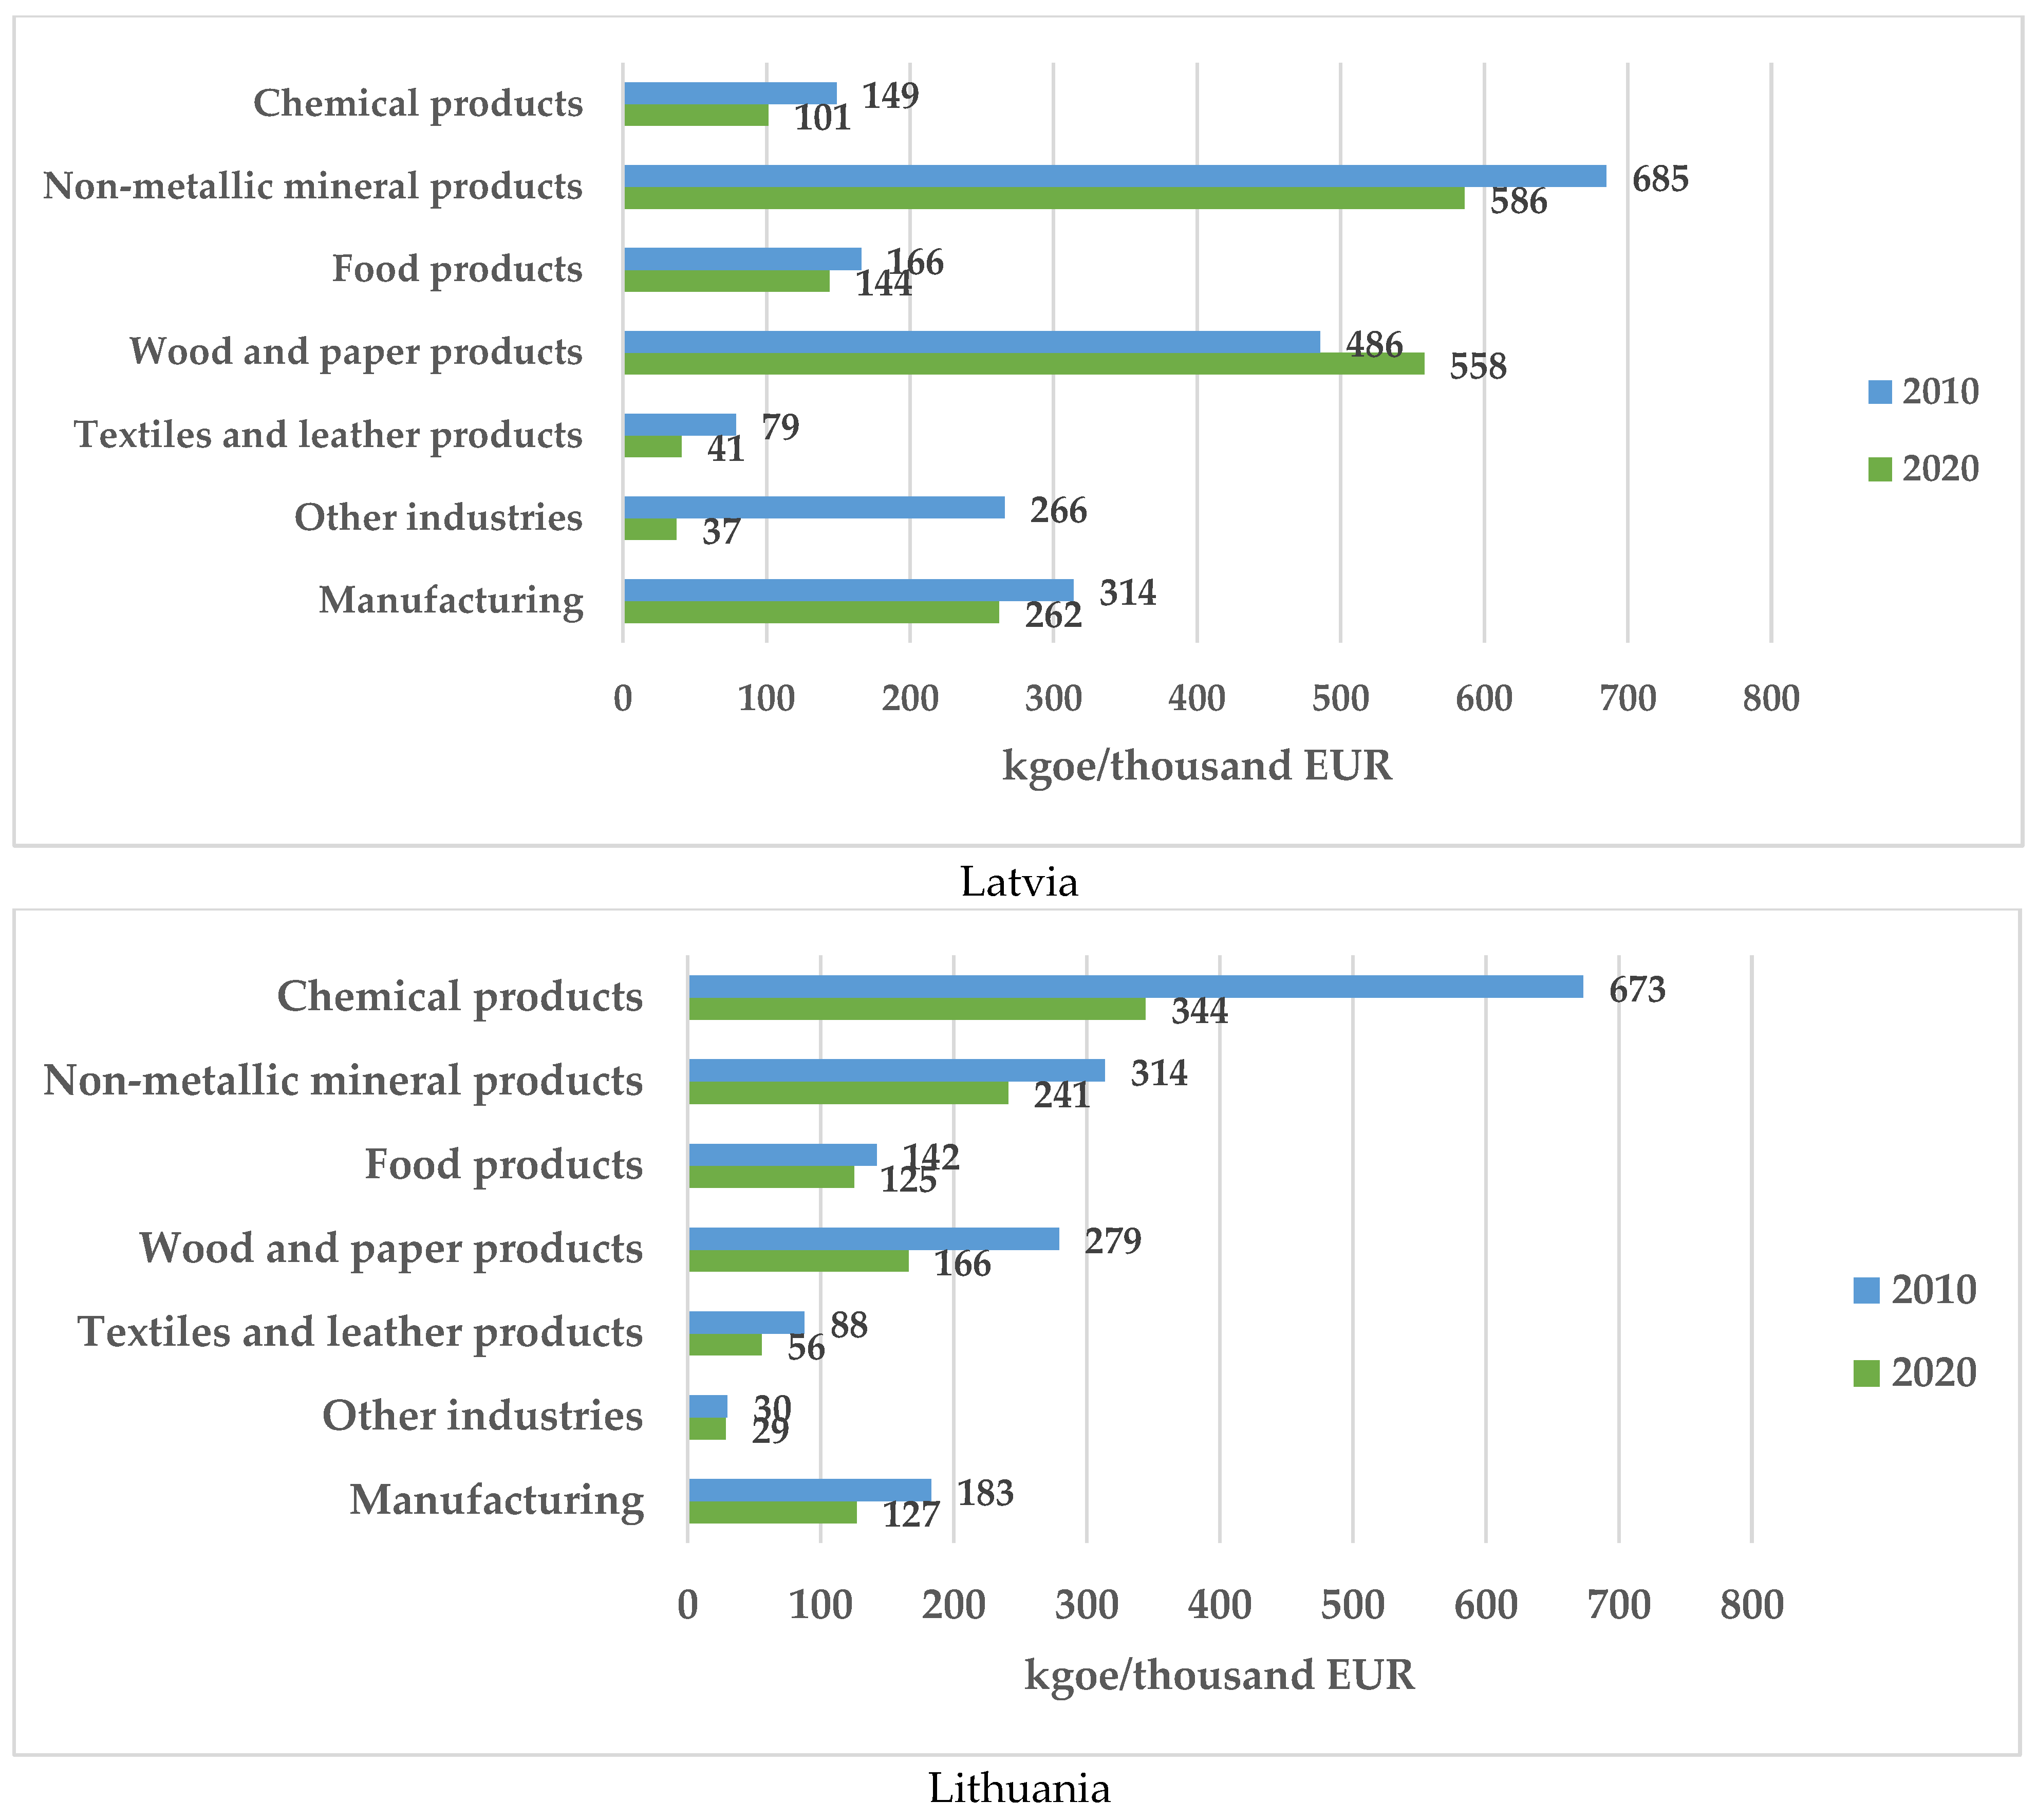
4.1. Developments in Energy Intensity

Energy intensity and its improvements in manufacturing of the Baltic States was different, as Figure 1 shows.
As it is shown in Figure 1, energy intensity improved in each country, but the improvement rate was quite different from 2010–2020. Energy intensity with an average decrease of 7.3% per annum improved the most in Estonia. In 2020, it was 113 kgoe per 1000 EUR and remained the lowest among the Baltic States. In Lithuania, the decrease was twice as slow at 3.6% per annum. In 2020, the country’s manufacturing sector consumed 127 kgoe per 1000 EUR. Energy intensity in Latvia decreased the slowest at 1.8% per annum. In 2020, it persisted several times higher than in the other studied countries at 262 kgoe per 1000 EUR. Changes in energy intensities demonstrate the advantage of manufacturing in Estonia over other countries.
Energy intensity and its improvements in industrial branches are different and significantly distinct from the average in manufacturing, as Figure 2 shows.
Over the last decade, Estonia made the greatest progress improving energy intensity in the manufacture of non-metallic mineral products, other manufacturing, manufacture of textile and leather products, and manufacture of wood, paper, and paper products. In the latter industrial branches, energy intensity improved by 78.1%, 63.2%, 52.7%, and 45.9%, respectively. Energy intensity in the manufacture of chemical products improved by 22.2%, but it was the highest among branches in the country in 2020. Manufacture of food and beverages is characterised not only by high energy intensity but also by low improvement (of 8.4%).
In Latvia, the most significant improvement in energy intensity was achieved in other industries, as the value of indicator was reduced by 7.1 times accounting for 37 kgoe per 1000 EUR in 2020. Energy intensity improved by 48.0% in the manufacture of textile and leather products and by 31.9% in the manufacture of chemical products. It improved by 14.4% in the manufacture of non-metallic mineral products, which is the most energy-intensive industrial branch, and by 13.3% in the manufacture of food products and beverages. Energy intensity got worse in the manufacture of wood, paper, and paper products, as energy consumption per value adding of 1000 EUR increased by 14.9%. The role of this branch in a balance of final energy consumption was essential with 61.1% in 2020. Taking into account these factors, one could perceive why energy intensity in manufacturing in Latvia decreased by 16.5% only and was fixed as the largest among the Baltic countries.
In Lithuania, the largest improvement in energy intensity was found in the manufacture of chemical products by 48.9%, which is the most intensive energy branch. It improved in the manufacture of wood, paper, and paper products by 40.5% and in the manufacture of textile and leather products by 36.5%. Improvement in energy intensity in other industries was modest—in the manufacture of non-metallic mineral products by 23.2% and in the manufacture of food products and beverages by 12.0%.

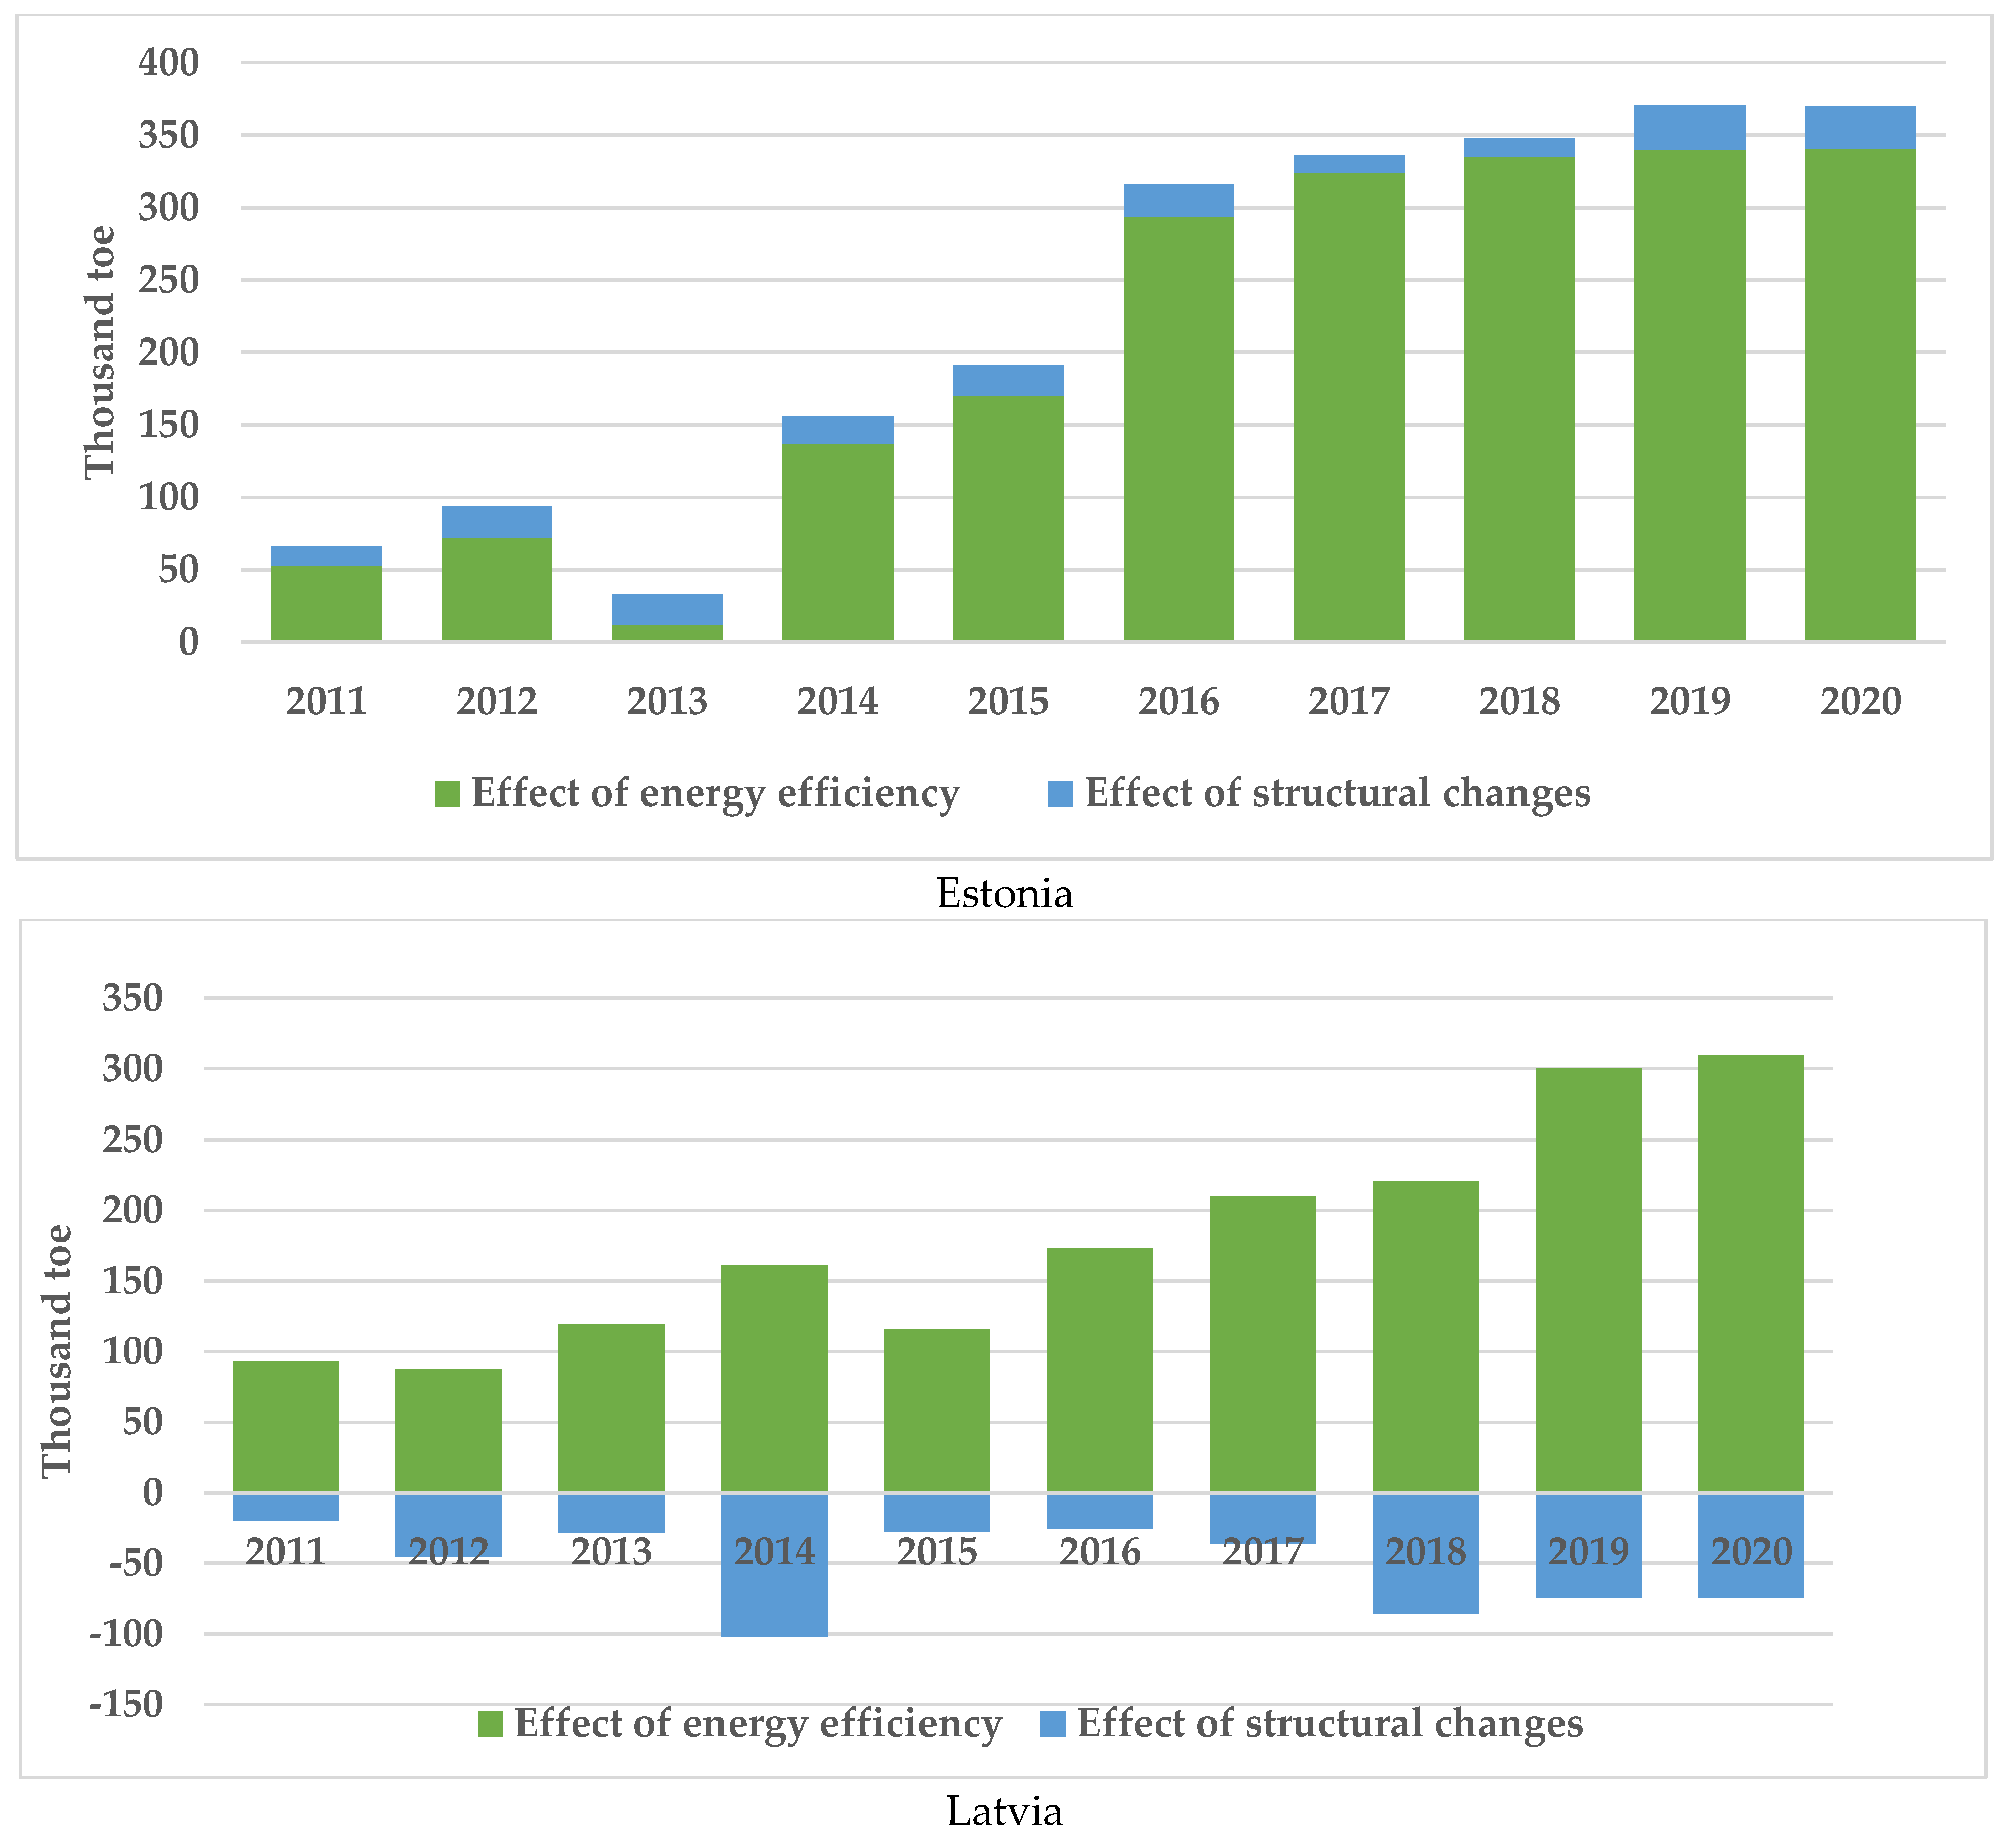
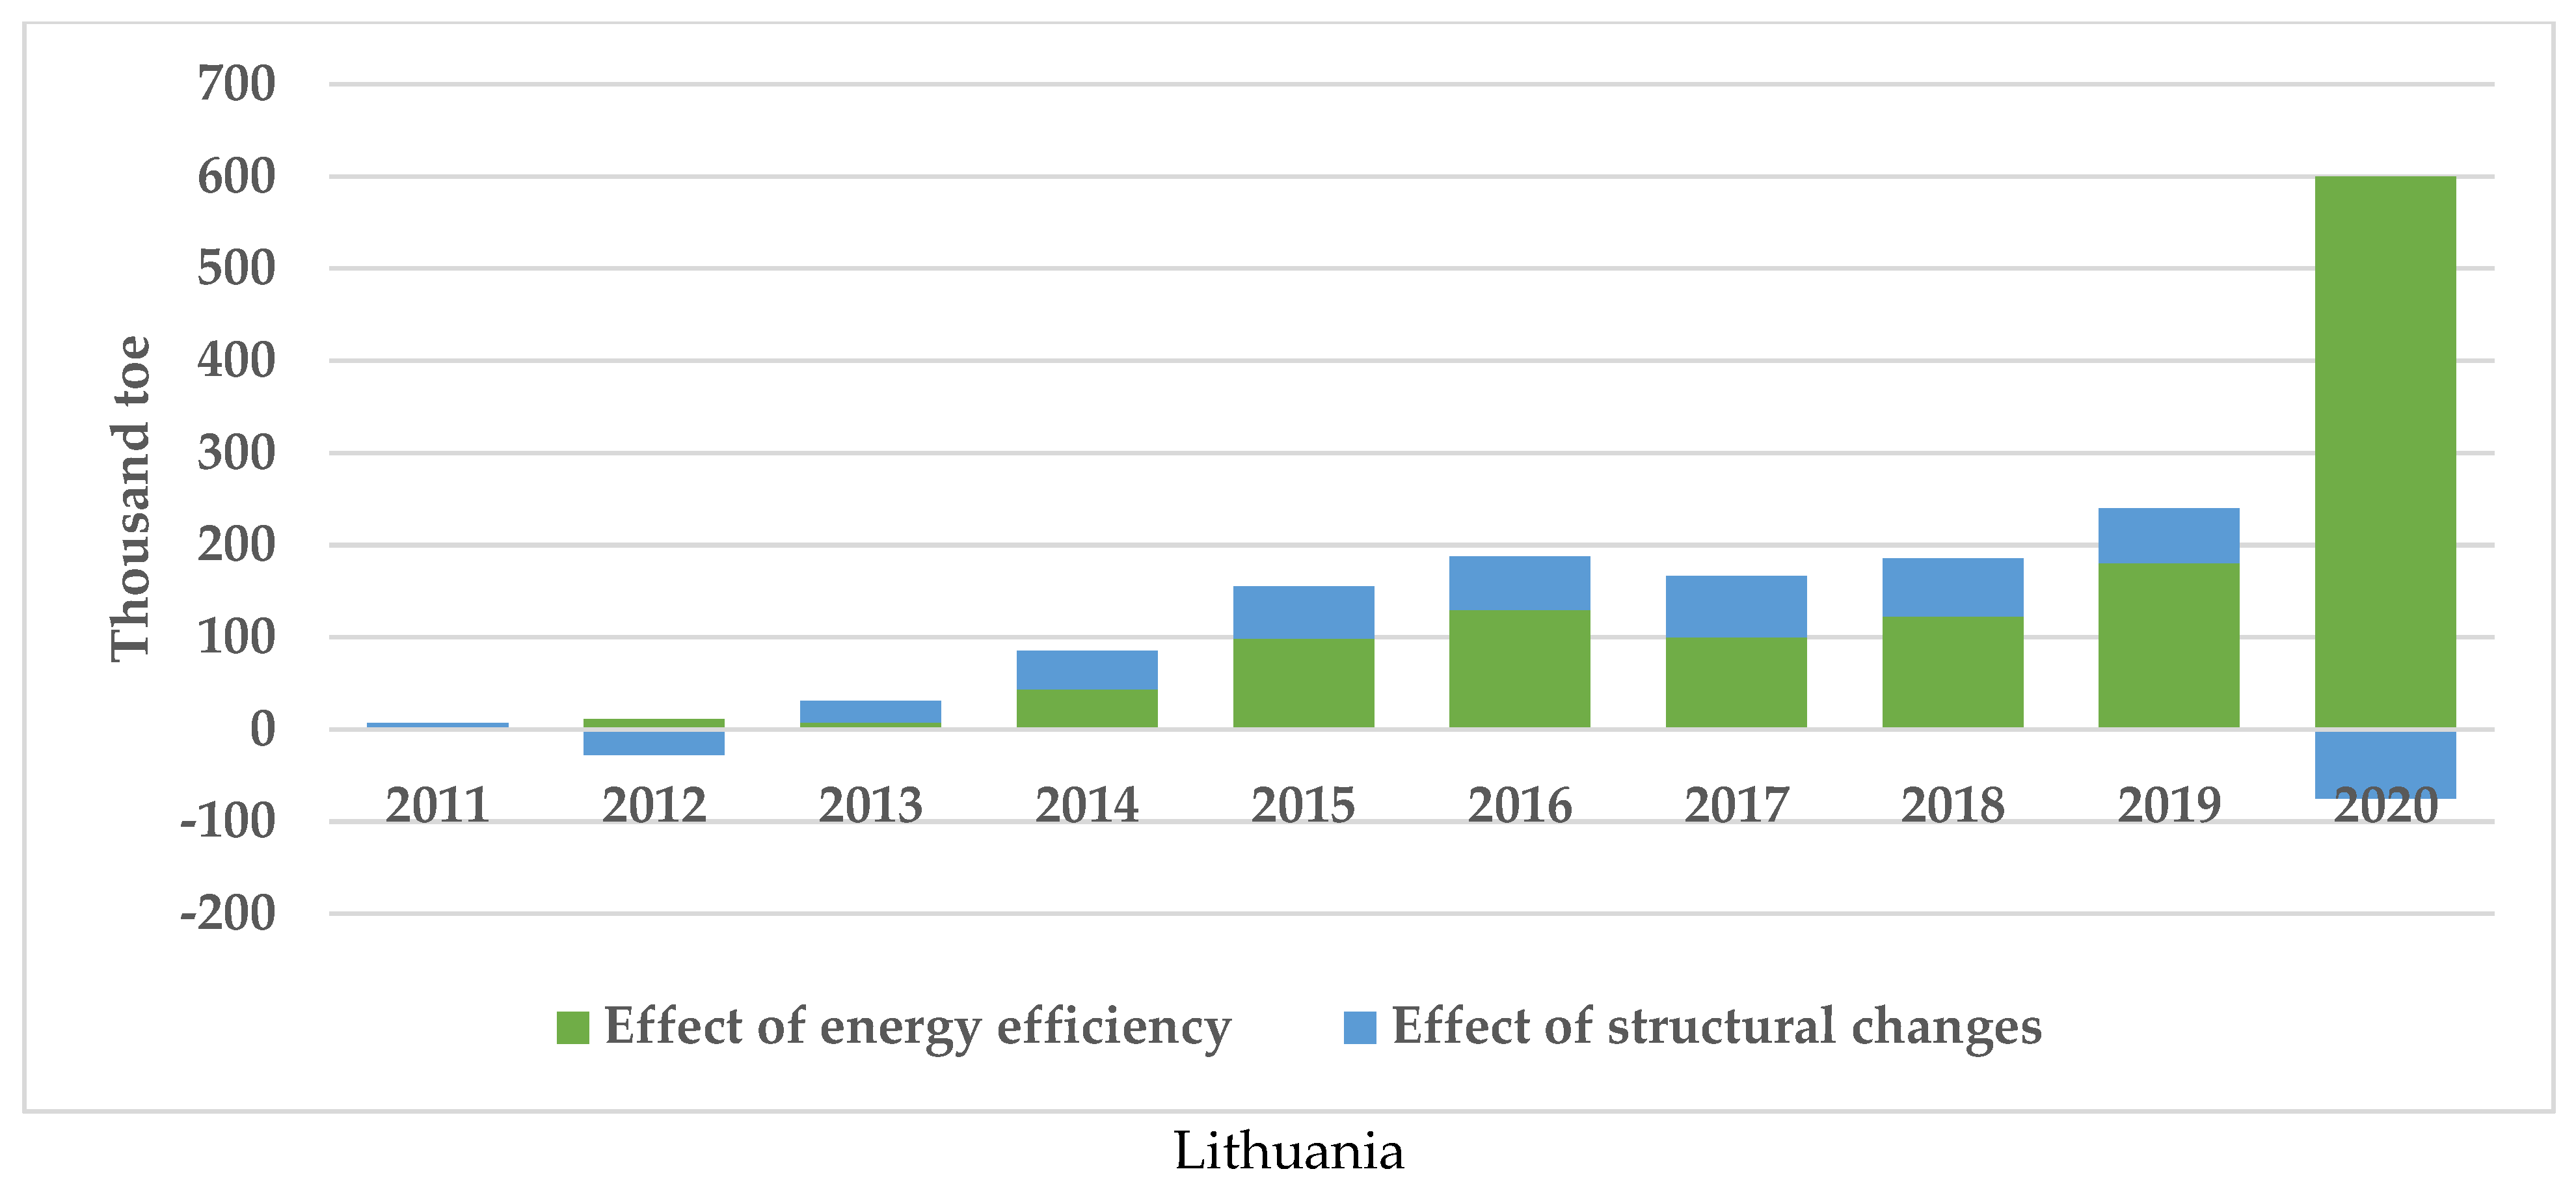
4.2. Impact of Developments in Energy Intensity and Its Key Drivers on Energy Savings

The results of the energy intensity index and its decomposition into the indices of energy efficiency and activity explaining improvements in energy intensity in accordance with the key drivers are presented in Table 2.
Estimates of the energy intensity index (Table 2) show that energy intensity in manufacturing in Estonia improved by 53%, in Lithuania by 31%, and in Latvia by 17% over the studied period. Due to positive changes in EE, energy intensity improved by 50%, 34%, and 21%, respectively, as shown by the energy efficiency index. The contributions of changes in economic activities remained minor, as the activity index presents. Several interesting practices are observed, which are worth highlighting. Estonia demonstrates excellence by improving energy intensity in the manufacture of non-metallic mineral products by 87%. EE improvements were the main driver, reducing energy intensity by 78%, the most among the industrial branches in the country. The contribution of changes in economic activity to the 41% improvement in energy intensity is also significant. Energy intensity in the manufacture of wood and wood products in Latvia increased by 26%. It is the only manufacturing branch in the Baltic countries with a significantly worsened energy intensity. The decomposition of the energy intensity index shows that energy intensity increased by 15% as a result of energy efficiency and by 10% due to favourable changes in economic activity.
Taking into account the results of the analysis of the indices, the total energy savings by effect of key driver of energy intensity in manufacturing in the Baltic countries are estimated (Figure 3).
Figure 3 shows that energy savings have increased due to annual improvements in energy intensity in manufacturing. During a decade, 2.28 Mtoe of energy was saved in manufacturing in Estonia, followed by 1.57 Mtoe in Lithuania, and 1.27 Mtoe in Latvia. EE was a key driver of total energy savings. It was responsible for 91.1% of total energy savings in Estonia and for 82.7% in Lithuania. The contribution of structural changes in activities to total energy savings in these countries was 8.9% and 17.3%, respectively. In Latvia, structural change in activities was a driving force that reduced energy savings by 1.3 Mtoe over the study period due to an increase in the share of the two most energy-intensive industries in energy consumption.

4.3. Impact on GHG Emissions

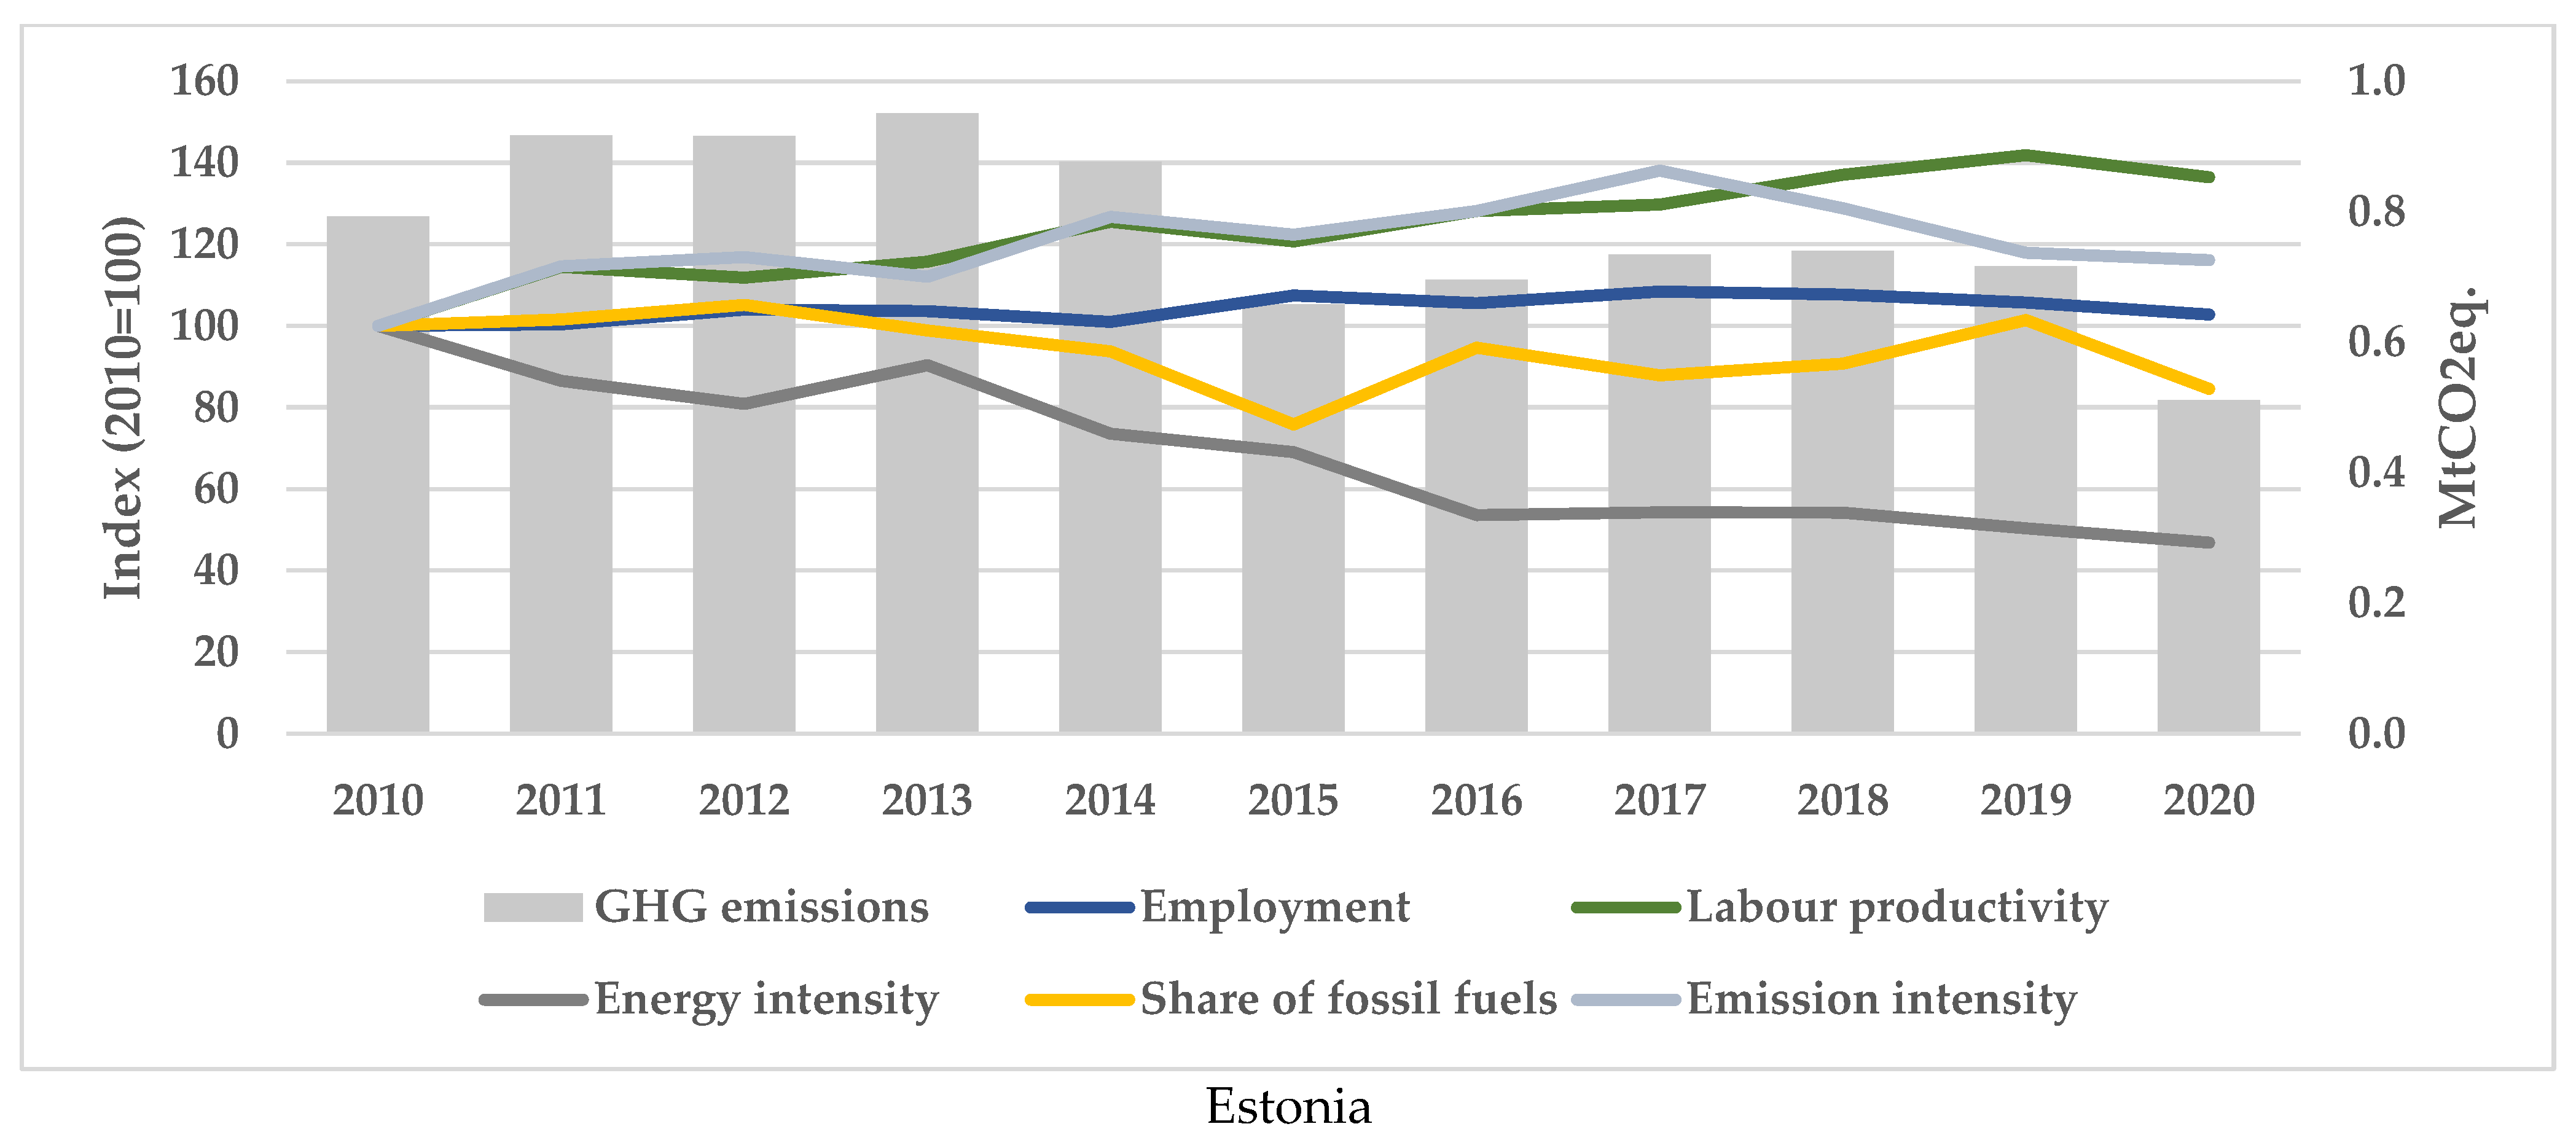
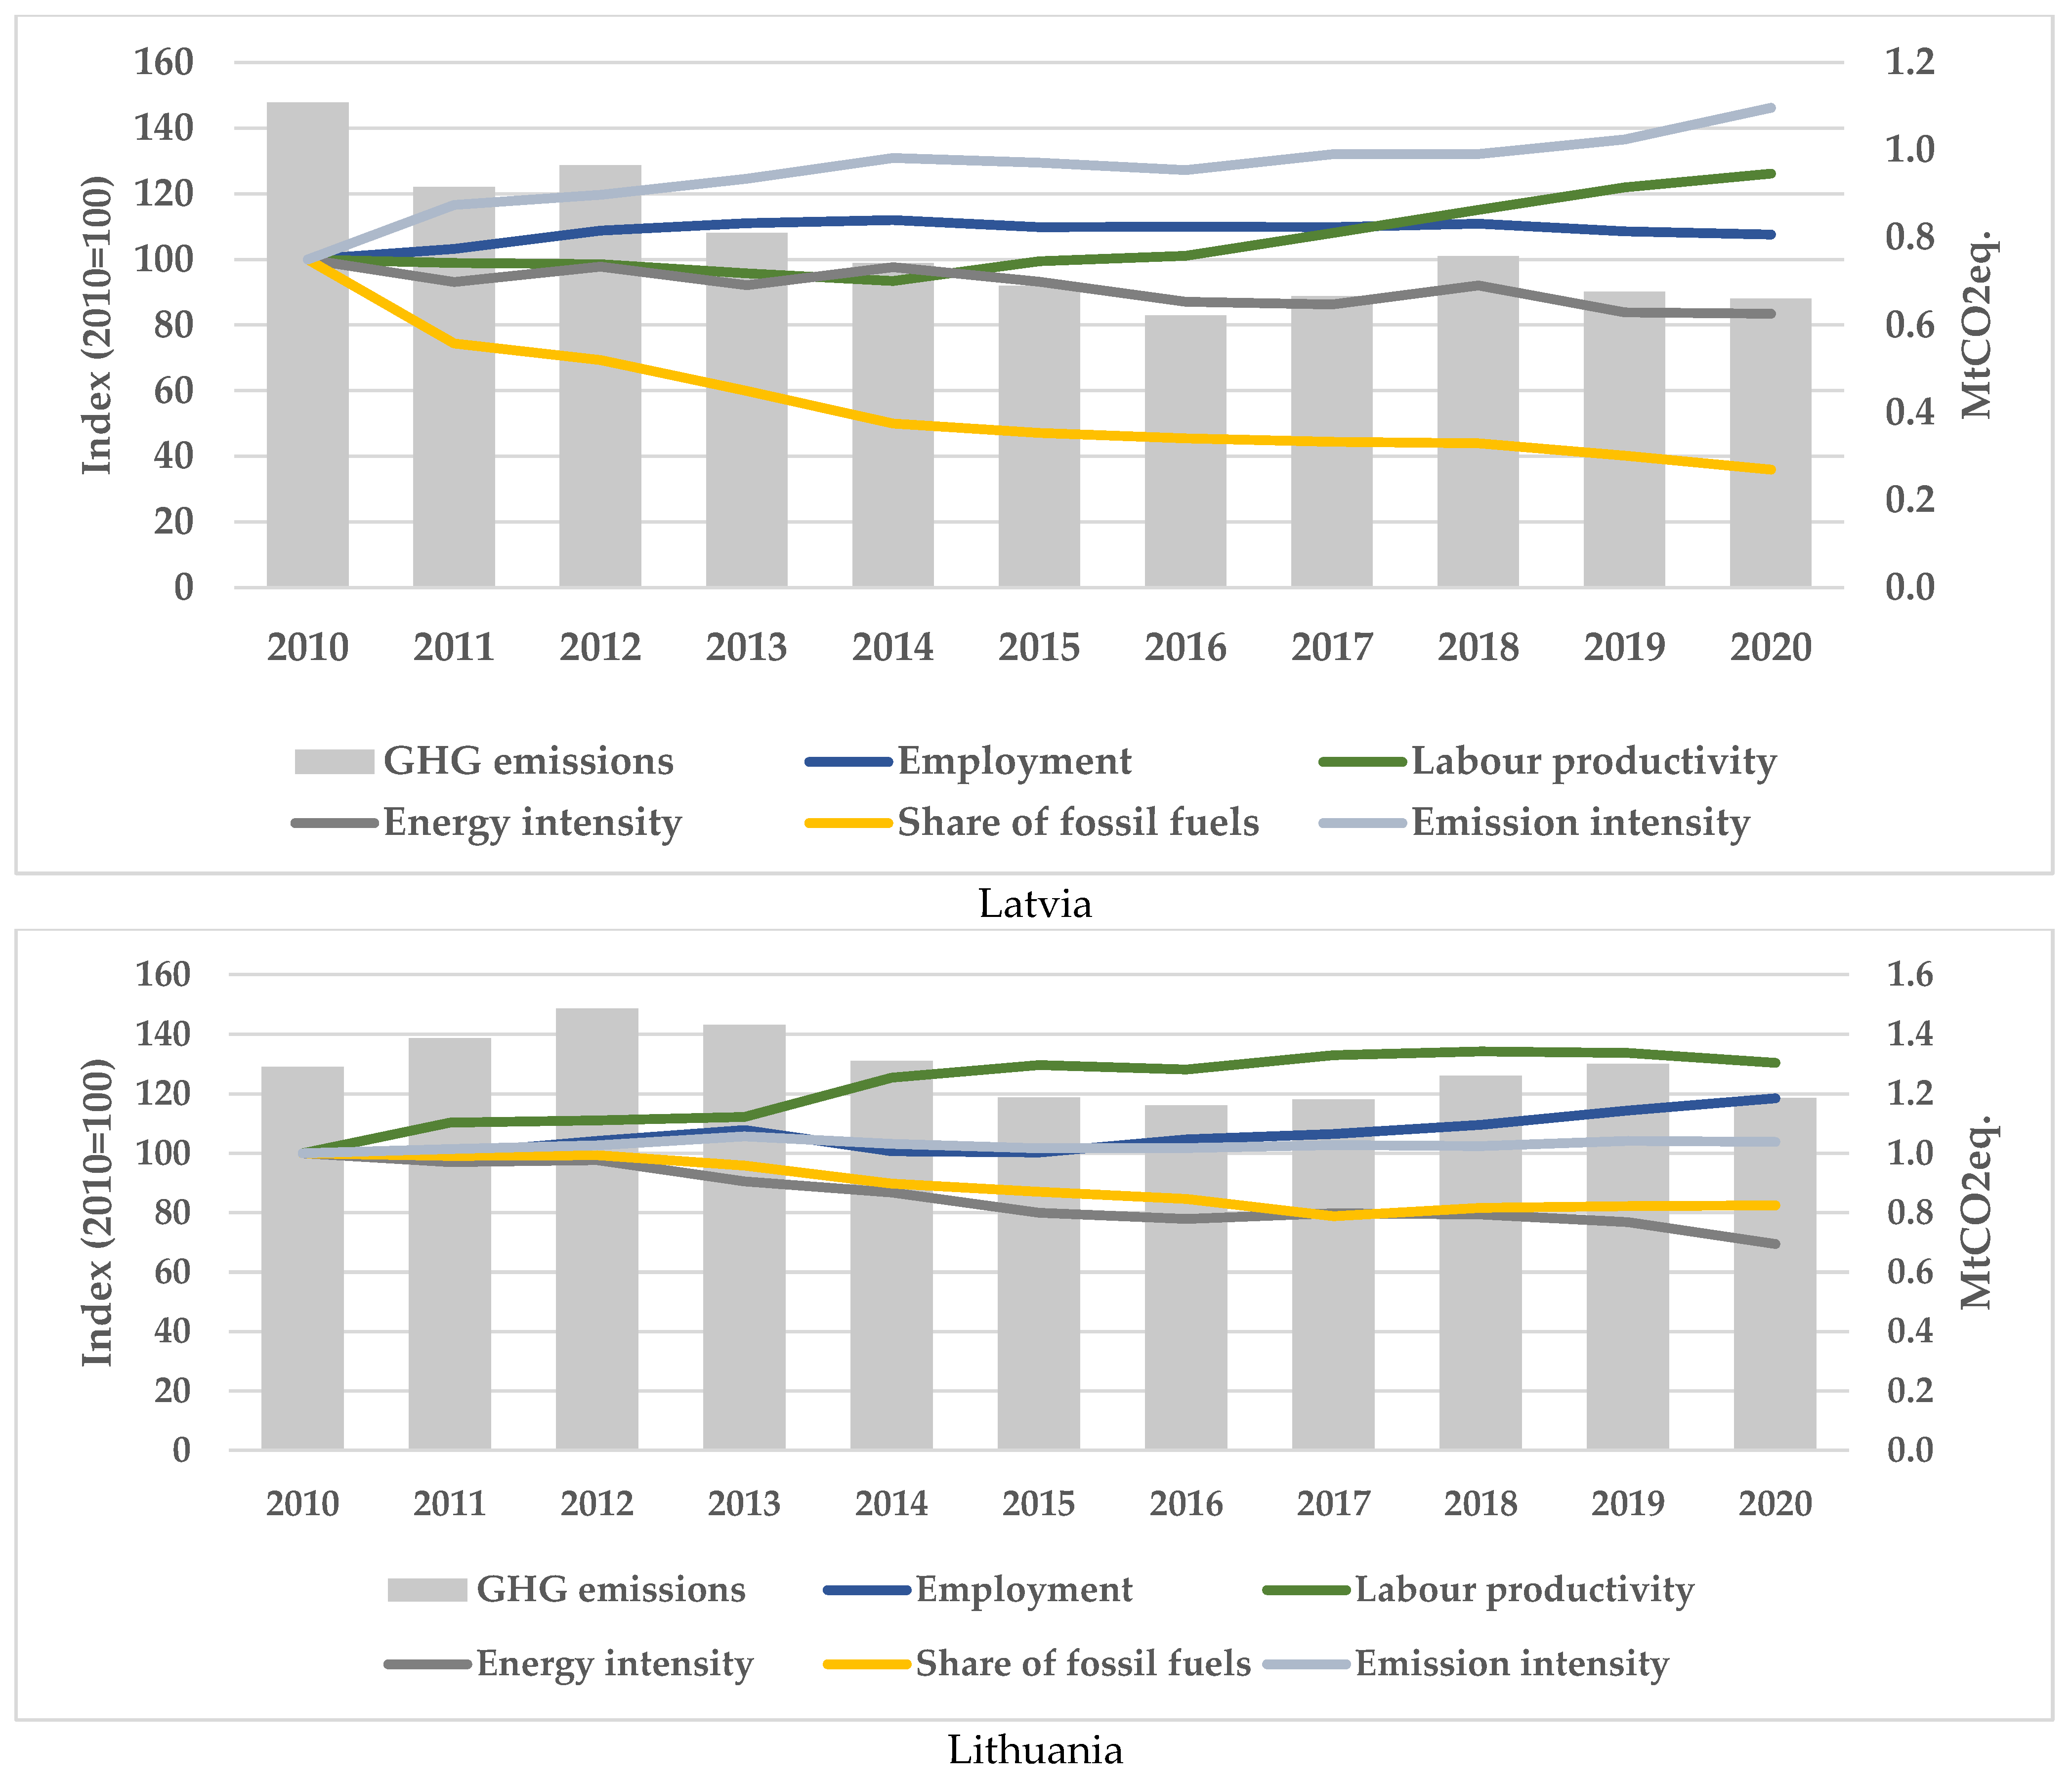
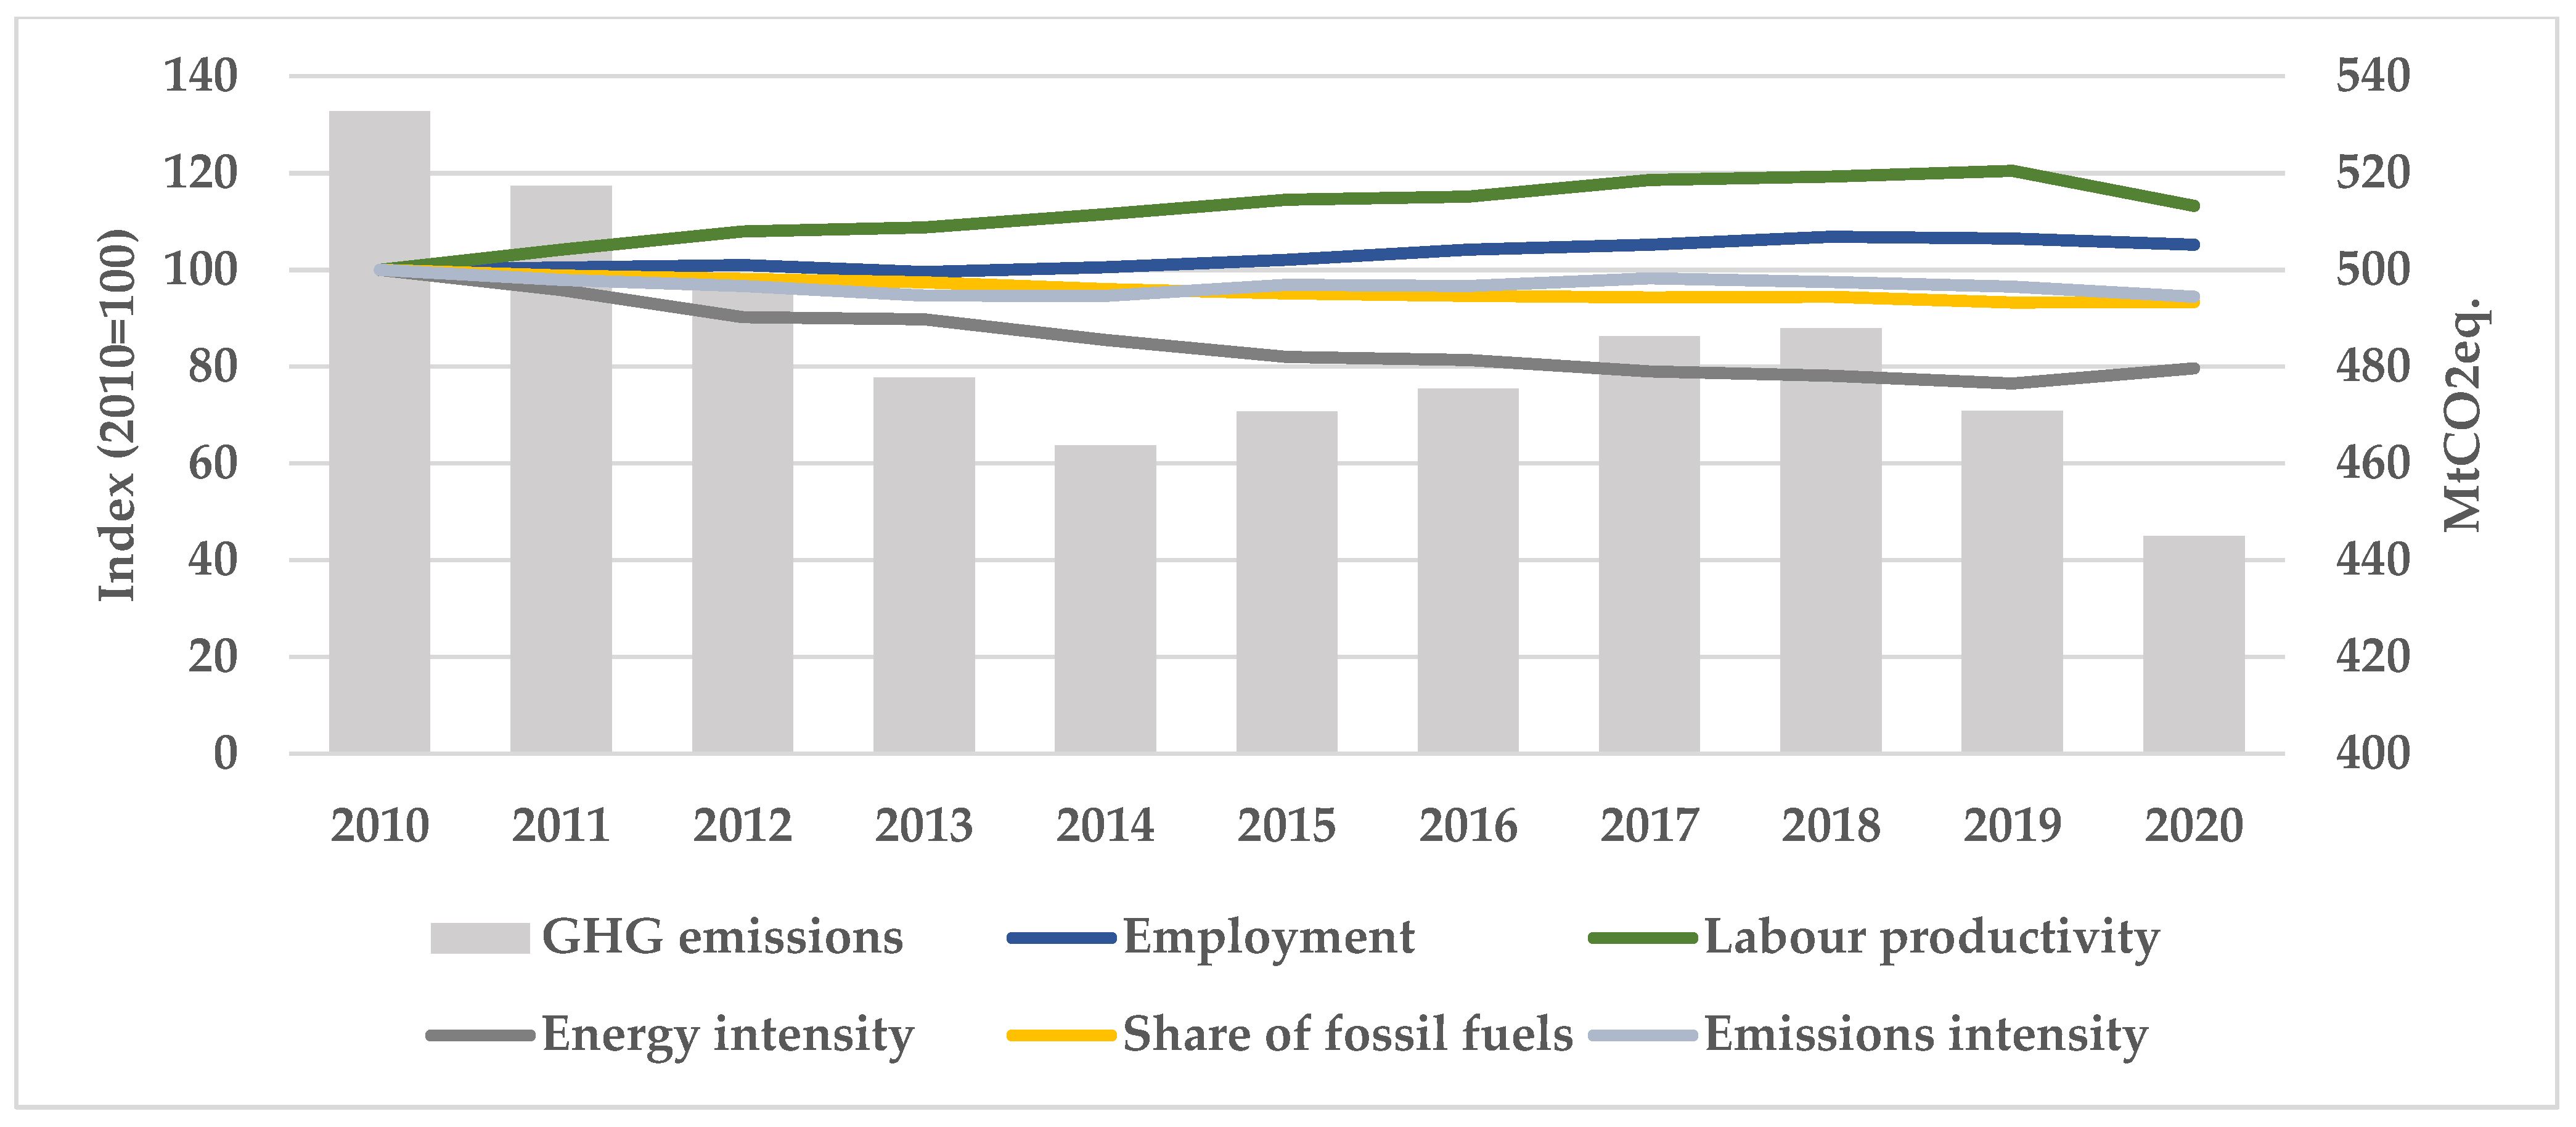
4.3.1. Trends in GHG Emissions and Their Key Drivers

From 2010–2020, GHG emissions reduced in the Baltic States by 40.4% in Latvia, by 35.5% in Estonia, and only by 8.1% in Lithuania (Figure 4).
As shown in Figure 4, reductions in GHG emissions were supported by improvements in energy intensity and reductions in the share of fossil fuels but they were diminished by increases in labour productivity, emissions intensity, and employment. Over the period 2010–2020, energy intensity was improved by 53.2% in Estonia, 30.5% in Lithuania, and only 16.5% in Latvia. Owing to integration of renewable energy technologies, the share of fossil fuels decreased by almost three times in Latvia. The decreases in the share of fossil fuels remained small in Lithuania (by 17.6%) and Estonia (by 15.4%). At the end of the study period, fossil fuels accounted for 39.8% in the fuel consumption structure in Lithuania and to 33.9% in Estonia, while 17.2% was achieved in the Latvian manufacturing sector. The peculiarity of Latvian manufacturing is the consumption of fossil fuels, which has the highest and each year the most increasing emissions intensity among the Baltic countries. In comparison, Lithuania continued to have both the lowest emissions intensity and the slowest rate of growth. This allowed us to mitigate the impact of the high share of fossil fuels on GHG emissions in the country. An increase in labour productivity is a common feature in all three countries. From 2010–2020, it increased by 26.2% in Latvia, 30.5% in Lithuania, and 36.4% in Estonia. An increase in number of employees is the slowest among the key drivers. In 2020, total number of employees in Estonia was by 2.8% higher in Estonia, 7.6% higher in Latvia, and 18.5% higher in Lithuania, compared with their 2010 levels. Thus, the driver was conditionally important in Lithuanian manufacturing only.

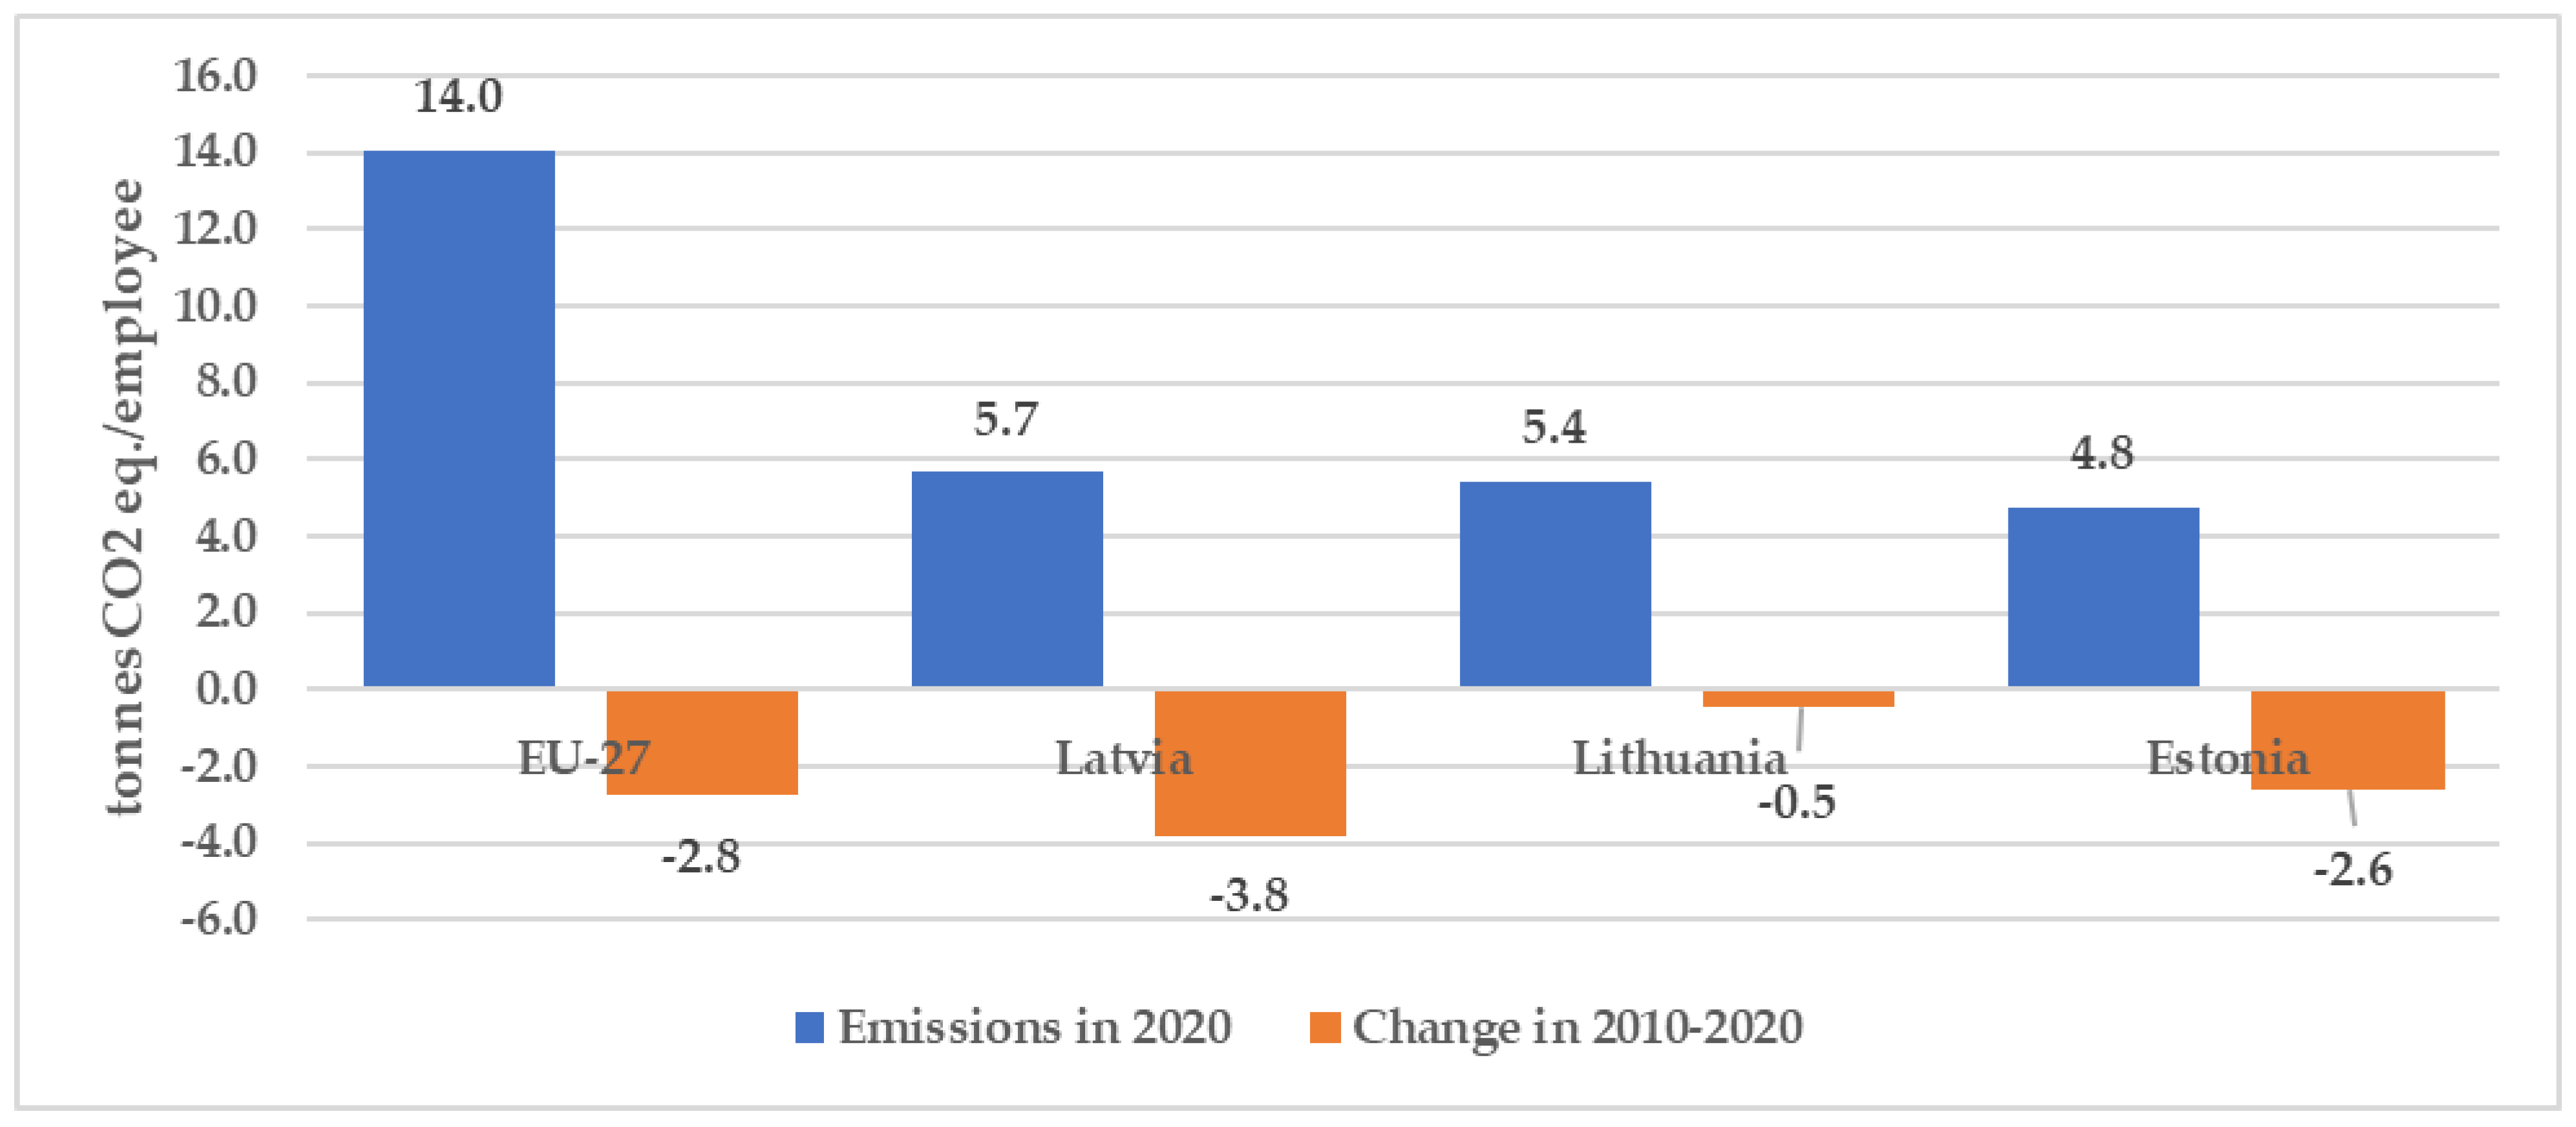
4.3.2. Absolute Changes in GHG Emissions by Effect of Key Drivers

After determining the drivers that supported and diminished reductions in GHG emissions in manufacturing in the Baltic States, this section of the paper analyses the absolute changes in GHG emissions through the contribution of a single driver. The results are presented in Figure 5.
The results of the decomposition analysis (Figure 5) show that due to the display of a group of diminishing drivers, each year more and more GHG emissions were emitted. In 2020, diminishing drivers increased GHG emissions by 312.9 ktCO2eq. in Estonia, by 586.3 ktCO2eq. in Lithuania, and by 593.0 ktCO2eq. in Latvia. Due to improvements in labour productivity in Estonian and Lithuanian manufacturing, GHGs increased by 199.3 ktCO2eq. and 329.2 ktCO2eq., respectively, in 2020. Owing to an increase in emissions intensity, GHG emissions increased by 328.8 ktCO2eq. in Latvia in that year. The effect of employees was found relevant in Lithuania. The driver was responsible for a 36% increase in GHG emissions in the country in 2020. The display of a group of supporting drivers resulted in decreases in GHG emissions. In 2020, the supporting drivers decreased GHG emissions by 594.2 ktCO2eq. in Estonia, by 690.3 ktCO2eq. in Lithuania, and by 1041.4 ktCO2eq. in Latvia. Energy intensity is estimated as a key driver supporting reductions in GHG emissions in Lithuania and Estonia. Due to improvements in energy intensity, GHG emissions decreased by 451.3 ktCO2eq. and 486.6 ktCO2eq. Deployment of renewable energy technologies in Latvian manufacturing contributed to a decrease in GHG emissions by 885.0 ktCO2eq. (85% of the structure).

5. Discussion

In this study, we combined several independent research directions into a single unit, which in a systematic way described a channel through which the effect of EE in manufacturing passed the reductions in GHG emissions. In detail, our research contributed to research directions dealing with drivers of energy intensity [23], impacts of EE on energy consumption [28], and effects of improving energy intensity on reductions in GHG emissions [11,12,14,15]. The results of our analysis justified the relevant role of EE policy and measures implemented in manufacturing in the Baltic States, improving energy intensity in the sectors and in this way contributing to energy savings and reductions in associated GHGs in relation to other drivers of emissions. The research is unique. No similar studies combining various research directions and studies for the Baltic States’ manufacturing sectors by their branches have been performed previously. Therefore, the results of this study cannot be directly compared with the results of other studies. Seeking to achieve a comparability of the results, additional calculations were made. Cases of the Baltic Sea region and EU−27 were examined. The results demonstrated that the Baltic States share the downward trend of GHG emissions with EU−27 countries (Figure 6).
From 2010–2020, total GHG emissions in EU−27 manufacturing decreased by 16.5% and accounted for 445.1 MtCO2eq. It is important to highlight the moderate increase in GHG emissions of 3.7% during 2015–2018 and their significant decline of 8.8% over the last two years. In 2020, the contributions of manufacturing in Latvia, Estonia, and Lithuania to reductions in total GHGs in EU−27 were 0.5%, 0.3%, and 0.1%, respectively. Unlike in the Baltic States, emissions intensity in the EU−27 decreased and was a driver supporting reductions in GHG emissions. As in the Baltic countries, an improvement in energy intensity was a key driver decreasing emissions in the EU−27, followed by a share of fossil fuels, which also reduced. At the end of the period, the share of fossil fuels in the EU−27 was higher than in the Baltic States. Labour productivity and number of employees increased in manufacturing and was assigned to a group of factors diminishing reductions in GHG emissions in the EU−27.
Changes in GHG emissions in manufacturing and rates of key drivers over 2010–2020 in the Baltic countries and in the EU−27 countries are summarised in Table 3.
The reduction rate of GHG emissions in Lithuania was lower than in other Baltic countries and in the EU−27 countries. It is important to emphasise that GHG emissions in three Baltic countries decreased despite the labour productivity and number of employees in this sector growing at comparatively high rates. Labour productivity in the EU−27 increased less than in the Baltic States. The number of employees in Lithuania and Latvia increased faster than in Estonia and in the EU−27 countries. Thus, the analysis demonstrated absolute decoupling of GHG emissions in manufacturing from growth of economic activity during the study period despite certain variations in other drivers. Emission intensity increased in all three Baltic countries as follows: in Estonia by 16.1%, in Latvia by 46.2%, and in Lithuania by 3.9%. Contrariwise, emissions intensity in the EU−27 countries decreased by 5.6%.
The decomposition analysis revealed the impact of key drivers on reductions in GHG emissions in the EU−27 countries (Figure 7).
Decreasing energy intensity was responsible for the largest reduction in emissions, by 64.4% in the EU−27 countries in comparison with 65.4% in Lithuania, 81.9% in Estonia, and 15% in Latvia (Figure 5). Due to the installation of RESs and reduced emissions intensity, GHGs reduced by an additional 19.5% and 16.1% in EU−27 countries, respectively. In Latvia, a decrease in the share of fossil fuels accounted for 85% in GHG reductions (Figure 5). While in the EU−27 countries GHGs decreased because of reductions in emissions intensity, they grew in the Baltic States (Figure 5). Improvements in labour productivity contributed to the increase in GHG emissions over the study period by 71.0%, and an increase in the number of employees by 29% in the EU−27 countries. It is important to highlight the effects of drivers in promoting reductions in GHG emissions was much stronger than the effect of improving labour productivity and an increased number of employees. Thus, GHG emissions in absolute value in the EU−27 countries have been decreasing since 2010. The combined effect of all factors promoting and diminishing this reduction was less intensive during 2015–2018.
In order to demonstrate the correct comparative results of the decomposition analysis in the Baltic States and in the EU−27 countries, changes in GHG emissions and the effect of each key driver over 2010–2020 are summarised in Table 4. All parameters are presented in tonnes of CO2 eq. per employee and indicate total increase or decrease in GHG emissions caused by the change of each driver over the study period.
The largest reduction in GHG emissions per employee was observed in Latvia with 3.83 tCO2eq. This indicator in Estonia was 2.62 tCO2eq. and was similar to the EU−27 countries with 2.77 tCO2eq. The smallest reduction in emissions per employee was in Lithuania (by 0.48 tCO2eq.). We specify that an increase in GHG emissions per employee in the Baltic countries and in the EU−27 countries was mainly driven by improvements in labour productivity and an increased number of employees. The decreasing energy intensity and substitution of fossil fuels by RESs were the major drivers contributing to the reduction in GHGs per employee in all countries. Owing to intensive deployment of RESs in the Baltic countries, emissions intensity increased and contributed to an increase in GHG emissions per employee. Vice versa, an effect of decreased emissions intensity in the EU−27 countries was relevant in the reduction in emissions.
Despite distinct reductions in GHG emissions from 2010–2020, emissions per employee in manufacturing in the Baltic countries were quite similar in 2020 (Figure 8).
As is shown in Figure 8, in 2020, emissions were equal to 14.04 tCO2 eq. per employee in the EU−27 countries. In Estonia, Lithuania, and Latvia they were comparatively low, i.e., 4.76 tCO2eq., 5.44 tCO2eq., and 5.65 tCO2eq., respectively.
The comparison of relative GHG emissions in manufacturing in various countries could be based on an indicator of emissions per capita (Figure 9).
As it is shown in Figure 9, emissions per capita in the Baltic countries have been decreasing over the last decade comparatively slowly. A similar reduction in GHG emissions per capita was observed in other countries of the Baltic Sea region and in the EU−27 countries. A more intensive decrease in GHG emissions per capita was observed in Finland (0.69 tCO2eq.). The smallest reduction in GHG emissions per capita was fixed in Lithuania (0.04 tCO2eq.) and Poland (0.01 tCO2eq. only). In 2020, the highest GHG emissions per capita were in Germany with 1.4 tCO2eq., in Finland with 1.1 tCO2eq., and in Poland with 0.8 tCO2eq. GHG emissions in manufacturing in the Baltic countries are comparatively low per capita, in Lithuania by 2.3 times, in Estonia by 2.6 times, and in Latvia by 2.9 times less than in the EU−27 countries. Nevertheless, additional appropriate measures should be applied to reduce GHG emissions in this sector in all three Baltic countries.

6. Conclusions and Recommendations

An integrated analysis of energy intensity improvements, GHG emission trends, and the impact of key drivers on their reduction in six sectors of manufacturing in the Baltic countries over the period 2010–2020 was conducted and presented in this paper. It was found that improvements in EE play a role reducing energy intensities in manufacturing and saving energy, which in combination with other drivers, result in reductions in GHG emissions. Based on the results the following conclusions are drawn.
An in-depth analysis of energy intensity trends in manufacturing in Estonia, Latvia, and Lithuania revealed strengths and challenges in energy consumption in manufacturing. Rather different changes in energy intensity were observed both in the individual manufacturing branches and in each country. The largest decrease in energy intensity in Estonia was fixed in the manufacture of non-metallic mineral products, with a decrease of 78.1%. Although energy intensity in the manufacture of chemical products fell by 22.2%, and in the manufacture of food products and beverages by only 8.4%, the results of combined efforts were impressive, and energy intensity in the country’s manufacturing sector fell by 53.1%. The overall energy intensity in manufacturing in Latvia is the largest among the Baltic countries and has only decreased by 16.5%. It was strongly underpinned by an impressive fall in energy intensity in other manufacturing, down by 7.1 times. Due to the faster improvements in EE in traditional industries, the overall energy intensity in manufacturing in Lithuania decreased by 30.5%. The largest decrease in energy intensity in the country was recorded in the manufacture of chemical products at 48.9%.
The results of the investigation of the effects of EE and structural changes in the activity underlying the decline in energy intensity in manufacturing in the Baltic countries showed that the improvement in EE was a dominant driver of energy intensity for energy savings in manufacturing. Improvements in EE account for 91.1% of total energy savings in Estonian manufacturing, followed by 82.7% in Lithuania. The effect of structural change in activity was 8.9% and 17.3%, respectively. The analysis shows that the share of two energy-intensive branches in the total energy consumption in Latvian manufacturing increased from 58.7% in 2010 to 82.3% in 2020, leading to a negative structural effect (−40.8%) in the country.
The results of the identification and assessment of the key drivers responsible for the changes in GHG emissions in the Baltic countries revealed that reductions in GHG emissions were promoted by improvements in energy intensity and reductions in the share of fossil fuels, but they were diminished by increases in labour productivity, emissions intensity, and the number of employees. Improvements in energy intensity accounted for 65% of the reduction in GHG emissions in Lithuanian manufacturing and 82% in Estonian manufacturing. A reduction in the share of fossil fuels in Latvian manufacturing led to an 85% reduction in GHG emissions. Improvement in labour productivity was a key driver of GHG emissions growth in Estonia and Lithuania. It accounted for 65% of the increase in GHG emissions in Estonia and for 56% in Lithuania. A rise in emissions intensity accounted for a 55% increase in emissions in Latvia. These results are partly consistent with the results for the EU−27 countries. While manufacturers in the Baltic States used fuels with an increasing emission intensity, the EU−27 countries moved towards using less emission-intensive fuels. GHG emissions fell in three Baltic countries, despite relatively high growth rates of VA generated in manufacturing. Thus, the analysis shows an absolute decoupling of GHG emissions in this sector from the growth of economic activities over the study period despite some variation in effects from other drivers.
The results of the comparative analysis of the changes in GHG emissions per capita in the Baltic States and the EU−27 countries showed that these emissions in manufacturing were comparatively low in the Baltic States—2.3 times lower in Lithuania, 2.6 times lower in Estonia, and in 2.9 times lower in Latvia than in the EU−27 countries. Nevertheless, additional appropriate measures to reduce GHG emissions in this sector are needed in all three Baltic countries.
The study conducted has value at national and regional levels taking into account the importance of the identified peculiarities in EE, RES deployment, and GHG emission reduction trends in manufacturing industries. The results are important for the policy makers to compare the changes in three Baltic countries, within the EU−27 and with the targets set by the European Commission.
The research will be expanded in the future. The key drivers of energy intensity and GHG emissions will be analysed as a function of various factors. This will require knowledge deepening in terms of identification of those factors and creation and adaptation of functions in the Equations (2) and (10) used in this study. Moreover, we plan to deepen the knowledge about the processes taking place in each manufacturing branch and to evaluate them mathematically in those equations.

Author Contributions

All authors contributed to designing and writing this paper. Specific tasks were undertaken as follows: V.M. prepared the draft of the paper; A.G. supervised this work; V.B. performed the economic analysis and editing; and I.K. and E.N. collected data and compiled the references. All authors have read and agreed to the published version of the manuscript.

Funding

This research received no external funding.

Institutional Review Board Statement

Not applicable.

Informed Consent Statement

Not applicable.

Data Availability Statement

Data available in a publicly accessible repository that does not issue DOIs. Publicly available datasets were analyzed in this study. This data can be found here: [https://ec.europa.eu/eurostat/web/main/data/database; https://osp.stat.gov.lt/statistiniu-rodikliu-analize#/; https://unfccc.int/ghg-inventories-annex-i-parties/2022; https://andmed.stat.ee/en/; https://data.stat.gov.lv/ (accessed during 20 September–17 November 2022)].

Acknowledgments

The authors express their deepest gratitude to anonymous reviewers of this journal for their comments and suggestions that enhanced the merit of this work.

Conflicts of Interest

The authors declare no conflict of interest.

Abbreviations

EEenergy efficiency
ESenergy sufficiency
EUEuropean Union
ECEuropean Commission
Eurostatstatistical bureau of the European Union
GDPgross domestic product
GHGgreenhouse gas
IEAInternational Energy Agency
kgoekilogramme of oil equivalent
LEILithuanian Energy Institute
LMDILogarithmic Mean Divisia Index
RESrenewable energy sources
toetonne of oil equivalent
VAvalue added

References

  1. A Clean Planet for All—A European Strategic Long-Term Vision for A Prosperous, Modern, Competitive and Climate Neutral Economy. Available online: https://eur-lex.europa.eu/legal-content/EN/TXT/?uri=CELEX:52018DC0773 (accessed on 10 September 2022).
  2. Summary of Main Findings in Estonia. Available online: https://ec.europa.eu/clima/sites/lts/lts_ee_summary_en.pdf (accessed on 11 September 2022).
  3. Summary of Main Findings in Latvia. Available online: https://ec.europa.eu/clima/sites/lts/lts_lv_summary_en.pdf (accessed on 11 September 2022).
  4. Summary of Main Findings in Lithuania. Available online: https://ec.europa.eu/clima/sites/lts/lts_lt_summary_en.pdf (accessed on 10 September 2022).
  5. Buchmann, M.; Kusznir, J.; Brunekreeft, G. Assessment of the drafted German integrated National Energy and Climate Plan. Econ. Policy Energy Environ. 2019, 85–96. [Google Scholar] [CrossRef]
  6. De Paoli, L. The Italian draft National Energy-Climate Plan. Econ. Policy Energy Environ. 2019, 97–118. [Google Scholar] [CrossRef]
  7. Pluta, M.; Suwała, W.; Wyrwa, A. Review of the Polish integrated National Energy and Climate draft Plan 2021–2030. Econ. Policy Energy Environ. 2019, 149–160. [Google Scholar] [CrossRef]
  8. Štreimikienė, D.; Kyriakopoulos, G.L.; Stankūnienė, G. Review of Energy and Climate Plans of Baltic States: The Contribution of Renewables for Energy Production in Households. Energies 2022, 15, 7728. [Google Scholar] [CrossRef]
  9. Fujimori, S.; Krey, V.; van Vuuren, D.; Oshiro, K.; Sugiyama, M.; Chunark, P.; Limmeechokchai, B.; Mittal, S.; Nishiura, O.; Park, C.; et al. A framework for national scenarios with varying emission reductions. Nat. Clim. Change 2021, 11, 472–480. [Google Scholar] [CrossRef]
  10. Lu, J.; Chen, H.; Cai, X. From global to national scenarios: Exploring carbon emissions to 2050. Energy Strategy Rev. 2022, 41, 100860. [Google Scholar] [CrossRef]
  11. Zheng, X.; Lu, Y.; Yuan, J.; Baninla, Y.; Zhang, S.; Stenseth, N.C.; Hessen, D.O.; Tian, H.; Obersteiner, M.; Chen, D. Drivers of change in China’s energy-related CO2 emissions. Proc. Natl. Acad. Sci. USA 2020, 117, 29–36. [Google Scholar] [CrossRef]
  12. Ouyang, X.; Lin, B. An analysis of the driving forces of energy-related carbon dioxide emissions in China’s industrial sector. Renew. Sustain. Energy Rev. 2015, 45, 838–849. [Google Scholar] [CrossRef]
  13. Lin, B.; Tan, R. Sustainable development of China’s energy intensive industries: From the aspect of carbon dioxide emissions reduction. Renew. Sustain. Energy Rev. 2017, 77, 386–394. [Google Scholar] [CrossRef]
  14. Wang, M.; Feng, C. Understanding China’s industrial CO2 emissions: A comprehensive position framework. J. Clean. Prod. 2017, 166, 1335–1346. [Google Scholar] [CrossRef]
  15. Yuan, J.; Xu, Y.; Hu, Z.; Zhao, C.; Xiong, M.; Guo, J. Peak energy consumption and CO2 emissions in China. Energy Policy 2014, 68, 508–523. [Google Scholar] [CrossRef]
  16. Zhou, S.; Wang, Y.; Yuan, Z.; Ou, X. Peak energy consumption and CO2 emissions in China’s industrial sector. Energy Strategy Rev. 2018, 20, 113–123. [Google Scholar] [CrossRef]
  17. Eurostat Database. Energy Intensity of GDP in Chain Linked Volumes (2010). Available online: https://ec.europa.eu/eurostat/databrowser/view/nrg_ind_ei/default/table?lang=en (accessed on 6 November 2022).
  18. International Energy Agency. World Energy Balances; OECD/IAE: Paris, France, 2021. [Google Scholar]
  19. Lin, Y.; Ma, L.; Li, Z.; Ni, W. The carbon reduction potential by improving technical efficiency from energy sources to final services in China: An extended Kaya identity analysis. Energy 2023, 263, 125963. [Google Scholar] [CrossRef]
  20. Li, M.; Tao, W. Review of methodologies and polices for evaluation of energy efficiency in high energy-consuming industry. Appl. Energy 2017, 187, 203–215. [Google Scholar] [CrossRef]
  21. Miskinis, V.; Galinis, A.; Konstantinavičiute, I.; Lekavicius, V.; Neniskis, E. Comparative analysis of energy efficiency trends and driving factors in the Baltic States. Energy Strategy Rev. 2020, 30, 100514. [Google Scholar] [CrossRef]
  22. Cui, Q.; Kuang, H.; Wu, C.; Li, Y. The changing trend and influencing factors of energy efficiency: The case of nine countries. Energy 2014, 64, 1026–1034. [Google Scholar] [CrossRef]
  23. Song, F.; Zheng, X. What drives the change in China’s energy intensity: Combining decomposition analysis and econometric analysis at the provincial level. Energy Policy 2012, 51, 445–453. [Google Scholar] [CrossRef]
  24. Yang, M.; Patino-Echeverri, D.; Yang, F.; Williams, E. Industrial energy efficiency in China: Achievements, challenges and opportunities. Energy Strategy Rev. 2015, 6, 20–29. [Google Scholar] [CrossRef]
  25. Kermeli, K.; Graus, W.H.J.; Worrel, E. Energy efficiency improvement potentials and a low energy demand scenario for the global industrial sector. Energy Effic. 2014, 7, 987–1011. [Google Scholar] [CrossRef]
  26. Gielen, D.; Boshell, F.; Saygin, D.; Basilian, M.D.; Wagner, N.; Gorini, R. The role of renewable energy in the global energy transformation. Energy Strategy Rev. 2019, 24, 38–50. [Google Scholar] [CrossRef]
  27. Zhao, Y.; Ke, J.; Ni, C.C.; McNeil, M.; Khanna, N.Z.; Zhou, N.; Fridley, D.; Li, Q. A comparative study of energy consumption and efficiency of Japanese and Chinese manufacturing industry. Energy Policy 2014, 70, 45–56. [Google Scholar] [CrossRef]
  28. Dolge, K.; Azis, R.; Lund, P.D.; Blumberga, D. Importance of Energy Efficiency in Manufacturing Industries for Climate and Competitiveness. Environ. Clim. Technol. 2021, 25, 306–317. Available online: https://sciendo.com/article/10.2478/rtuect-2021-0022 (accessed on 10 September 2022). [CrossRef]
  29. Dzikuc, M.; Gorączkowska, J.; Piwowar, A.; Dzikuc, M.; Smolenski, R.; Kułyk, P. The analysis of the innovative potential of the energy sector and low-carbon development: A case study for Poland. Energy Strategy Rev. 2021, 38, 100769. [Google Scholar] [CrossRef]
  30. Korkmaz, P.; Schmid, D.; Fahl, U. Incorporating uncertainties towards a sustainable European energy system: A stochastic approach for decarbonization paths focusing on the transport sector. Energy Strategy Rev. 2021, 38, 100707. [Google Scholar] [CrossRef]
  31. Panoutsou, C.; Germer, S.; Karka, P.; Papadokostantakis, S.; Kroyan, Y.; Wojcieszyk, M.; Maniatis, K.; Marchand, P.; Landalv, I. Advanced biofuels to decarbonise European transport by 2030: Markets, challenges, and policies that impact their successful market uptake. Energy Strategy Rev. 2021, 34, 100633. [Google Scholar] [CrossRef]
  32. Moula, M.M.E.; Nyari, J.; Bartel, A. Public acceptance of biofuels in the transport sector in Finland. Int. J. Sustain. Built Environ. 2017, 6, 434–441. [Google Scholar] [CrossRef]
  33. Zhao, B. Why will dominant alternative transportation fuels be liquid fuels, not electricity or hydrogen? Energy Policy 2017, 108, 712–714. [Google Scholar] [CrossRef]
  34. Andrés, L.; Padilla, E. Driving factors of GHG emissions in the EU transport activity. Transp. Policy 2018, 61, 60–74. [Google Scholar] [CrossRef]
  35. Lipscy, P.Y.; Schipper, L. Energy efficiency in the Japanese transport sector. Energy Policy 2013, 56, 248–258. [Google Scholar] [CrossRef]
  36. Chung, W.; Zhou, G.; Yeung, I.M.H. A study of energy efficiency of transport sector in China from 2003 to 2009. Appl. Energy 2013, 112, 1066–1077. [Google Scholar] [CrossRef]
  37. Zell-Ziegler, C.; Thema, J.; Best, B.; Wiese, F.; Lage, J.; Schmidt, A.; Toulouse, E.; Stagl, S. Enough? The role of sufficiency in European energy and climate plans. Energy Policy 2021, 157, 112483. [Google Scholar] [CrossRef]
  38. Maduta, C.; Melica, G.; D’Agostino, D.; Bertoldi, P. Towards a decarbonised building stock by 2050: The meaning and the role of zero emission buildings (ZEBs) in Europe. Energy Strategy Rev. 2022, 44, 101009. [Google Scholar] [CrossRef]
  39. Ramos, A.; Gago, A.; Labandeira, X.; Linares, P. The role of information for energy efficiency in the residential sector. Energy Econ. 2015, 52, 517–529. [Google Scholar] [CrossRef]
  40. Banfi, S.; Farsi, M.; Filippini, M.; Jakob, M. Willingness to pay for energy-saving measures in residential buildings. Energy Econ. 2008, 30, 503–516. [Google Scholar] [CrossRef]
  41. Streimikiene, D.; Balezentis, T.; Alebaite, I. Climate change mitigation in households between market failures and psychological barriers. Energies 2020, 13, 2797. [Google Scholar] [CrossRef]
  42. Piekut, M. Patterns of energy consumption in Polish one-person households. Energies 2020, 13, 5699. [Google Scholar] [CrossRef]
  43. Bobinaite, V.; Konstantinaviciute, I.; Galinis, A.; Bartek-Lesi, M.; Rácz, V.; Dézsi, B. Energy Sufficiency in the Household Sector of Lithuania and Hungary: The Case of Heated Floor Area. Sustainability 2022, 14, 16162. [Google Scholar] [CrossRef]
  44. Best, B.; Thema, J.; Zell-Ziegler, C.; Wiese, F.; Barth, J.; Breidenbach, S.; Nascimento, L.; Wilke, H. Building a database for energy sufficiency policies [version 2; peer review: 2 approved]. F1000Research 2022, 11, 229. [Google Scholar] [CrossRef]
  45. Štreimikienė, D.; Baležentis, A.; Ališauskaitė-Šeškienė, I.; Stankūnienė, G.; Simanavičienė, Ž. A Review of Willingness to Pay Studies for Climate Change Mitigation in the Energy Sector. Energies 2019, 12, 1481. [Google Scholar] [CrossRef]
  46. Štreimikienė, D.; Kyriakopoulos, G.L.; Lekavičius, V.; Pažėraitė, A. How to support sustainable energy consumption in households? Acta Montan. Slovaca. 2022, 27, 479–490. [Google Scholar] [CrossRef]
  47. Luttenberger, L.R. The barriers to renewable energy use in Croatia. Renew. Sustain. Energy Rev. 2015, 49, 646–654. [Google Scholar] [CrossRef]
  48. Štreimikienė, D.; Lekavičius, V.; Stankūnienė, G.; Pažėraitė, A. Renewable Energy Acceptance by Households: Evidence from Lithuania. Sustainability 2022, 14, 8370. [Google Scholar] [CrossRef]
  49. Value Added (ESA 2010) by Year at Chain-Linked Volume in Estonia (Reference Year 2015). Available online: https://andmed.stat.ee/en/stat/majandus__rahvamajanduse-arvepidamine__sisemajanduse-koguprodukt-(skp)__sisemajanduse-koguprodukt-tootmise-meetodil/RAA0045/table/tableViewLayout2 (accessed on 17 October 2022).
  50. Energy Balance Sheet by Type of Fuel or Energy in Estonia. Annual Statistics 2022. Available online: https://andmed.stat.ee/en/stat/majandus__energeetika__energia-tarbimine-ja-tootmine__aastastatistika/KE0240/table/tableViewLayout2 (accessed on 4 October 2022).
  51. Total Gross Value Added at Chain-Linked Volume in Latvia (Reference Year 2015). Available online: https://data.stat.gov.lv/pxweb/en/OSP_PUB/START__VEK__IK__IKP/IKP060/table/tableViewLayout1/ (accessed on 30 September 2022).
  52. Energy Balance in Latvia 2008–2021. Available online: http://data.csb.gov.lv/pxweb/en/vide/vide__ikgad__energetika/?tablelist=true&rxid=a79839fe-11ba-4ecd-8cc3-4035692c5fc8 (accessed on 6 October 2022).
  53. Total Value Added in Lithuania at Chain-Linked Volume (Reference Year 2015). Available online: https://osp.stat.gov.lt/statistiniu-rodikliu-analize?indicator=S7R208#/ (accessed on 3 October 2022).
  54. Environment and Energy in Lithuania. Available online: http://osp-old.stat.gov.lt/web/guest/statistiniu-rodikliu-analize/ (accessed on 20 September 2022).
  55. National Inventory Submissions 2022. Available online: https://unfccc.int/ghg-inventories-annex-i-parties/2022 (accessed on 5 November 2022).
  56. Eurostat Database. Final Energy Consumption in Industry by Type of Fuel [TEN00129]. Available online: https://ec.europa.eu/eurostat/databrowser/view/ten00129/default/table?lang=en (accessed on 15 November 2022).
  57. Eurostat Database. Gross Value Added and Income by A*10 Industry Breakdowns [NAMA_10_A10__Custom_3859420]. Available online: https://ec.europa.eu/eurostat/databrowser/view/NAMA_10_A10__custom_3858659/default/table?lang=en (accessed on 15 November 2022).
  58. Eurostat Database. Employment by Sex, Age and Economic Activity (from 2008 Onwards, NACE Rev. 2)—1000 [lfsa_egan2]. Available online: https://eige.europa.eu/gender-statistics/dgs/indicator/ta_wrklab_lab_employ_inter_sector__lfsa_egan2/datatable (accessed on 8 November 2022).
  59. Eurostat Database. Population on 1 January by Age and Sex [Demo_Pjan]. Available online: https://ec.europa.eu/eurostat/databrowser/view/demo_pjan/default/table?lang=en (accessed on 17 November 2022).
  60. Office of Energy Efficiency & Renewable Energy. Energy Efficiency vs. Energy Intensity. Analysis. Available online: https://www.energy.gov/eere/analysis/energy-efficiency-vs-energy-intensity (accessed on 28 January 2023).
  61. Golušin, M.; Dodić, S.; Popov, S. Chapter 2—Energy and Sustainable Development. In Sustainable Energy Management; Academic Press: Cambridge, MA, USA, 2013; pp. 7–57. ISBN 9780124159785. [Google Scholar] [CrossRef]
  62. Martínez, D.M.; Ebenhack, B.W.; Wagner, T.P. Chapter 3—Primary energy trends. In Energy Efficiency; Elsevier Science: Amsterdam, The Netherlands, 2019; pp. 67–99. ISBN 9780128121115. [Google Scholar] [CrossRef]
  63. Ang, B.W.; Zhang, F.Q. A survey of index decomposition analysis in energy and environmental studies. Energy 2000, 25, 1149–1176. [Google Scholar] [CrossRef]
  64. Ang, B.W. Decomposition analysis for policy making in energy: Which is the preferred method? Energy Policy 2004, 32, 1131–1139. [Google Scholar] [CrossRef]
  65. Boyd, G.A.; Roop, J.M. A Note on the Fisher Ideal Index Decomposition for Structural Change in Energy Intensity. Energy J. 2004, 25, 87–102. [Google Scholar] [CrossRef]
  66. De Boer, P.; Rodrigues, J.F.D. Decomposition Analysis: When to Use Which Method? Econ. Syst. Res. 2019, 32, 1–28. [Google Scholar] [CrossRef]
  67. Corporate Finance Institute. Fisher Price Index. 2022. Available online: https://corporatefinanceinstitute.com/resources/economics/fisher-price-index/ (accessed on 10 January 2023).
  68. Kaya, Y. Impact of Carbon Dioxide Emission Control on Gnp Growth: Interpretation of Proposed Scenarios; IPCC Energy and Industry Subgroup, Response Strategies Working Group: Paris, France, 1990. [Google Scholar]
  69. Ang, B.W. The LMDI approach to decomposition analysis: A. practical guide. Energy Policy 2005, 33, 867–871. [Google Scholar] [CrossRef]
  70. Xiang, X.; Ma, X.; Ma, Z.; Ma, M.; Cai, W. Python-LMDI: A Tool for Index Decomposition Analysis of Building Carbon Emissions. Buildings 2022, 12, 83. [Google Scholar] [CrossRef]
  71. Daldoul, M.; Dakhlaoui, A. Using the LMDI Decomposition Approach to Analyze the Influencing Factors of Carbon Emissions in Tunisian Transportation Sector. Int. J. Energy Econ. Policy 2018, 8, 22–28. Available online: https://www.econjournals.com/index.php/ijeep/article/view/7016/3988 (accessed on 26 January 2023).
  72. Dai, Y.; Zhu, J.; Song, H. Using LMDI approach to analyze changes in carbon dioxide emissions of China’s logistics industry. J. Ind. Eng. Manag. (JIEM) 2015, 8, 840–860. [Google Scholar] [CrossRef] [Green Version]
Figure 1. Energy intensity in manufacturing in the Baltic States from 2010–2020 (own estimations based on [49,50,51,52,53,54]).
Sustainability 15 03330 g001
Figure 2. Energy intensity in manufacturing branches of the Baltic States in 2010 and 2020 (own estimations based on [49,50,51,52,53,54]).
Sustainability 15 03330 g002aSustainability 15 03330 g002b
Figure 3. Total energy savings in manufacturing in the Baltic States due to reductions in energy intensity (own estimations based on [49,50,51,52,53,54]).
Sustainability 15 03330 g003aSustainability 15 03330 g003b
Figure 4. Changes in GHG emissions and their key drivers in manufacturing in the Baltic States (own estimations based on [49,50,51,52,53,54,55]).
Sustainability 15 03330 g004aSustainability 15 03330 g004b
Figure 5. Absolute changes in GHG emissions by a key driver in manufacturing in the Baltic States (own estimations).
Sustainability 15 03330 g005aSustainability 15 03330 g005b
Figure 6. Changes in associated GHG emissions and their key drivers in the EU−27 (own estimations based on [55,56,57,58]).
Sustainability 15 03330 g006
Figure 7. Decomposition dynamics and changes in GHG emissions in the EU−27 countries (own estimations).
Sustainability 15 03330 g007
Figure 8. GHG emissions per employee from manufacturing in 2020 and change from 2010–2020 (own estimations based on [55,58]).
Sustainability 15 03330 g008
Figure 9. GHG emissions per capita from manufacturing in 2020 and change from 2010–2020 (own estimations based on [55,59]).
Sustainability 15 03330 g009
Table 1. Comparative indicators of manufacturing in 2020, % (own estimations based on [49,50,51,52,53,54]).
EstoniaLatviaLithuania
Energy UseValue AddedEnergy UseValue AddedEnergy UseValue Added
Food products and beverages20.312.69.717.619.519.8
Wood and paper products41.621.061.128.715.712.0
Non-metallic mineral products9.68.921.39.518.79.9
Chemical products9.23.42.66.834.612.8
Textile and leather products2.54.60.63.82.76.3
Other industries16.849.54.833.68.939.3
Table 2. Energy intensity indicators and intensity indices in the Baltic States (own estimations based on [49,50,51,52,53,54]).
Energy Intensity, kgoe/Thousand EURIntensity IndexEfficiency IndexActivity Index
20102020202020202020
Estonia
Food products and beverages1981810.730.920.79
Wood and paper products4132240.570.541.05
Non-metallic mineral products5561220.130.220.59
Chemical products3963080.460.780.59
Textile and leather products129610.310.470.66
Other manufacturing104380.430.371.17
Total manufacturing2411130.470.500.94
Latvia
Food products and beverages1661440.650.870.75
Wood and paper products4865581.261.151.10
Non-metallic mineral products6855860.700.860.82
Chemical products1491010.560.680.82
Textile and leather products79410.330.520.64
Other manufacturing266370.170.141.21
Total manufacturing3142620.830.791.06
Lithuania
Food products and beverages1421250.710.880.81
Wood and paper products2791660.670.591.13
Non-metallic mineral products3142410.940.771.22
Chemical products6733440.630.511.22
Textile and leather products88560.510.630.80
Other manufacturing30291.020.961.07
Total manufacturing1831270.690.661.05
Table 3. Changes in GHG emissions in manufacturing and key drivers from 2010–2020, % (own estimations).
GHG EmissionsNumber of EmployeesLabour ProductivityEnergy IntensityShare of Fossil FuelsEmissions Intensity
Estonia−4.290.273.15−7.30−1.661.51
Latvia−5.050.732.35−1.79−9.723.87
Lithuania−0.841.712.69−3.58−1.910.38
EU−27−1.780.511.25−2.25−0.69−0.57
Table 4. Change in GHG emissions in manufacturing and effects of key drivers, tCO2eq./employee during 2012–2020 (own estimations based on [55,56,57,58]).
ΔC/EmployeeEmployee EffectLabour ProductivityEnergy IntensityEffect of Fossil FuelsEmission Intensity
Estonia−2.620.161.85−4.53−1.000.89
Latvia−3.830.541.72−1.34−7.572.81
Lithuania−0.480.961.51−2.07−1.100.21
EU−27−2.770.781.91−3.51−1.06−0.88
Disclaimer/Publisher’s Note: The statements, opinions and data contained in all publications are solely those of the individual author(s) and contributor(s) and not of MDPI and/or the editor(s). MDPI and/or the editor(s) disclaim responsibility for any injury to people or property resulting from any ideas, methods, instructions or products referred to in the content.

