
Assessment of Energy Efficiency in the European Union Countries in 2013 and 2020


1
Institute of Management and Quality Sciences, Maria Curie-Skłodowska University, Plac Marii Curie-Skłodowskiej 5, 20-031 Lublin, Poland
2
Institute of Economics and Finance, University of Rzeszów, Ćwiklińskiej 2, 35-601 Rzeszów, Poland
3
Department of European Studies and Economic Integration, Krakow University of Economics, Rakowicka 27, 31-510 Kraków, Poland
*
Author to whom correspondence should be addressed.
Sustainability 2023, 15(4), 3414; https://doi.org/10.3390/su15043414
Submission received: 31 December 2022
/
Revised: 7 February 2023
/
Accepted: 9 February 2023
/
Published: 13 February 2023
(This article belongs to the Collection Business Performance and Socio-environmental Sustainability)
Abstract
:In the face of the current energy crisis and the need to implement the objectives of climate and energy policy, it seems necessary to examine energy efficiency. Accordingly, this article aims to assess the energy efficiency of European Union (EU) countries. The assessment is performed using data envelopment analysis (DEA), a non-parametric method of measurement of relative efficiency. Ireland recorded the highest energy efficiency both in 2013 and 2020. The average efficiency of all countries assessed was lower in 2020 than in 2013. The number of fully efficient countries had decreased in 2020 compared to 2013. The differentiation of countries in terms of energy efficiency had increased in 2020. The research made it possible to express the efficiencies of countries using a single indicator applied to establish countries’ rankings. The lowest-ranked states are encouraged to improve their technologies for transforming inputs into outputs following the technologies of the benchmark countries. Moreover, a new approach to defining and measuring energy efficiency is proposed. We define energy efficiency as the ratio of services, goods and/or energy obtained to the energy input. In analysing energy efficiency, we emphasise dynamic perspectives rather than static ones.
1. Introduction
In recent years, scientific interest in climate and energy policy has been soaring. Initially, the researchers were primarily interested in targets related to reducing greenhouse gas (GHG) emissions and increasing the share of renewable energy sources in the energy mix of European Union (EU) countries [1,2,3]. The issue of energy efficiency received less attention. Only over time has there been a shift of interest also to the issues related to energy efficiency and the ways to increase it and to seeking sources for a faster, cheaper and more sustainable energy transition for EU countries. Energy has come to stay as a factor that determines sustainable development (SD) [4,5]. Consequently, this is reflected in the planned and undertaken activities at the international level. In January 2016, the 193 United Nations (UN) member states started to implement the 17 Sustainable Development Goals (SDGs) of the 2030 Agenda for Sustainable Development.
The implementation of the EU climate and energy policy is considered necessary for achieving the 7th and 13th SDGs of the UN. The goals and their associated 169 targets take into account all three dimensions of SD: economic, social and environmental [6]. In the area directly related to energy aspects, the seventh and thirteenth goals should be mentioned. The seventh goal is about ensuring access for all to sources of stable, sustainable and modern energy at a price affordable for all. Energy is necessary to ensure security (including energy security), to combat the undesirable effects of climate change and to improve well-being and economic development. Ensuring universal access to energy, improving energy efficiency or transforming the energy sector to include more renewable energy in the energy balances of individual economies are fundamental, basic objectives of the EU’s climate and energy policy as well [7]. Goal 7.3 assumes that, by 2030, energy efficiency will be improved by at least 32.5% compared with the 2007 reference year [8]. Moreover, the new ambition translates into a target of increasing primary energy efficiency by 39% and of increasing final energy efficiency by 36% compared with the 2007 reference year [9].
Currently, the European Commission (EC), as part of the European Green Deal (EGD) programme, is working on legislative solutions to implement the world’s most ambitious climate change targets. The EGD programme aims to transform the EU into a modern, resource-efficient and competitive economy, in which economic growth is decoupled from resource consumption. Moreover, on 14 July 2021, the ‘Fit for 55’ package was announced, which is a set of new legislation in the area of climate policy. The ‘Fit for 55’ package includes a recast of the Energy Efficiency Directive (EED), aligning its provisions to the −55% GHG target [10]. The EED [10] is currently designed to meet the existing goal of 32.5% energy efficiency improvements by 2030. The recast EED requires member states to almost double their annual energy savings obligations, make exemplary efforts in the public sector, address energy poverty and take other measures to deliver 9% more energy savings than foreseen under existing EU legislation. As part of the REPowerEU plan (May 2022) to address the ongoing energy crisis, the EC proposed a targeted EED amendment requiring 13% more energy savings by 2030 [10].
At the same time, it was established that the entire EU is to become climate neutral by 2050. To achieve these targets, a number of legislative measures need to be taken to reduce emissions in individual countries. These include: the reform of the Emissions Trading Scheme (EU ETS), the extension of emission allowances to new sectors of the economy, the introduction of a carbon tariff at the EU border, which is also expected to strengthen the competitiveness of the EU economy vis-à-vis countries without a climate policy, higher renewable energy targets (RES) targets in the EU and the introduction of stricter emission standards for the land transport sector [11].
Energy efficiency is an important component for achieving energy savings (Figure 1), as it allows production of the same services and quantity of goods with reduced energy consumption [12].
Regarding the abovementioned aspects, the motivation for the following analysis and research was to explore the importance of and assess the energy efficiency for an effective energy transition. Improving energy efficiency is one of the objectives of the EU’s climate and energy policy, as well as of internationally accepted solutions such as the SDGs. The far-reaching global changes in energy markets and the need to combat climate change and preserve the environment unchanged for future generations make the topic of improving energy efficiency relevant, important and necessary for research. The analysis includes studies that take into account energy efficiency research in both theoretical and practical terms, with far-reaching sources in individual sectors.
Although there are scientific articles in journals [13,14,15,16,17,18,19] and various types of reports [20,21] regarding the assessment of energy efficiency of countries, this problem in the context of meeting the adopted EU targets requires further research. In addition to assessing the current state of the countries’ efficiency assessment, it is important to evaluate the progress in energy efficiency over recent years. In particular, the research which allows comparison of the efficiency of objects to other comparable and relatively homogeneous objects is important. This approach is conducive to a relative simplicity of interpretation of the obtained effects, which are in the form of a single indicator, namely the efficiency indicator. With its help, the process of transforming the numerous adopted inputs into numerous outputs is evaluated. Obtaining such results is possible owing to the use of the data envelopment analysis (DEA) method, which the authors of this study applied to measure the energy efficiency of EU countries [22]. What is important is that the applied DEA does not require familiarity of the functional relationship when assessing the impact of numerous input variables on numerous output variables [16]. Thus, it facilitates the multi-criteria assessment of a phenomenon, at the same time eliminating the methodological and interpretative problems resulting from the use of parametric methods [23].
In order to fill the identified research gap in the assessment of energy efficiency of EU countries, the research objective and research questions were formulated. Therefore, the purpose of this article was to assess the energy efficiency of the EU countries. The following research questions were formulated:
- How is energy efficiency defined in the literature?
- How is energy efficiency measured?
- Which EU countries were energy efficient according to the DEA method in 2013 and 2020?
- Which EU countries improved/worsened their energy efficiency in 2020 compared to 2013, based on the understanding of this phenomenon under the DEA method?
The article is organised as follows. Section 1 is devoted to the introduction, both to the issues discussed and to the research carried out. Section 2 presents the current knowledge in the field of energy efficiency and energy efficiency measures. Section 3 describes the methodology of empirical research. The research results and discussion are presented in Section 4, whereas conclusions, limitations and further research are covered in Section 5.
2. Literature Review
2.1. Energy Efficiency—Theoretical Aspects
The need to combat not only climate change but also its consequences has led to widespread interest among researchers in this issue. As part of this, specific objectives have been set with different timeframes, the implementation of which is expected to lead to positive changes in the area of combating climate change and to bring about a sustainable transformation of the energy sector in EU member states [24].
In the literature, energy efficiency is defined in various ways. The definition at the micro level is often based on the energy consumption associated with a single unit of the service produced. At the macro level, a common indicator to identify the “efficiency” of a country or economy is the energy intensity, i.e., the ratio between the energy consumption and the country’s GDP [12]. Furthermore, depending on the scientific discipline, different elements and aspects of it are emphasised. Within research in the field of economics, economists distinguish between engineering or technical energy efficiency and economic energy efficiency. The former compares the number of inputs, including amounts of energy, used to produce a given output (or vice versa) to a best-practice level or frontier and constitutes one of the economic efficiency components in general. The economic energy efficiency, on the other hand, controls the levels of other inputs and considers the cost effectiveness and profit/utility maximisation and the efficiency with which they are used [13].
Irrek and Thomas [25] list the following different areas for energy efficiency consideration:
- Energy efficiency considered from a macroeconomic point of view in a free market economy;
- Energy conversion efficiency in terms of energy supply (energy provision), which is of interest to the technical sciences;
- The increase in energy efficiency considered on the energy demand side and achieved through technical, organisational, institutional and structural changes and changes in the behaviour of economic actors;
- An increase in energy efficiency achieved through changes in the leisure activity habits of households.
The dominant definition of energy efficiency is its simplest formulation as the ratio of outputs, services, goods or energy to energy input. Thus, it is a measure of the efficiency of energy use in economic activities. Mastalerska [26] identifies energy efficiency as a key factor in desirable environmental effects, improved competitiveness and national energy security of a country. Through this improvement, a relative supply surplus is created, as well as the material and energy intensity of the economy.
Energy efficiency is also seen as the fastest, cleanest and cheapest ‘source’ of improving energy needs. Research on energy efficiency concerns a search of the ways to optimise the use of energy in the environment in which it is used. Business operations in the energy sector are complex due to the complexity and capital intensity of the resources and processes used. In the current market conditions, an additional challenge consists of the implementation of SD, including in relation to particular environmental and social objectives [27]. Hence, firstly, the understanding of the concept of energy efficiency varies, and, secondly, the catalogue of instruments leading to energy efficiency is also broad and debatable. Çengel understands energy efficiency as reducing energy consumption to a minimum level but in such a way as to do so without reducing living standards, quality of production and profitability [28]. A similar approach is presented by Kryk [29], a researcher who maintains that increasing energy efficiency is one of the most cost-effective ways to increase the security of the energy supply and reduce GHG emissions and other pollutants.
With this in mind, many definitions focus on energy saving and lower energy consumption, but there is a growing recognition that health, well-being and thermal comfort issues are important and need to be addressed [30,31]. It seems appropriate to approach the understanding of energy efficiency more broadly as a concept of economically saving energy while maintaining daily life, comfort and well-being on the one hand [32] and efficient production processes on the other.
There is also a significant group of researchers who believe that energy efficiency is an umbrella term and that there are no quantitative measures that are not ambiguous [33]. It is, therefore, necessary to rely on multiple indicators to measure changes in energy efficiency. In general, energy efficiency refers to using less energy to produce the same number of services or amount of useful output [33].
An integral part of defining energy efficiency is analysing the introduction of possible measures to increase energy efficiency, understood as using less energy while maintaining an unchanged level of economic activity [34]. Improving energy efficiency is, thus, generally recognised as a cost-effective means of reducing energy consumption. This can be achieved if the same level of goods and services is produced using less energy or if more goods and services are produced using the same level of energy [35]. A similar opinion is provided by Ceylan and Gunay [36], who state that improving energy efficiency can reduce the need for investment in energy infrastructure, lower fuel costs, increase competitiveness, enhance energy security by reducing dependence on imported fossil fuels and, at the same time, help save the environment by reducing GHG emissions and local air pollution. It is, thus, a proposal that goes beyond the classical understanding of improving energy efficiency, understood as saving energy while maintaining the same level and quality of goods and services offered.
Particularly noteworthy is the industrial sector, which must undergo a transformation towards greater energy efficiency in the interests of competitiveness and global environmental protection. The problem of ever-increasing energy demand and emerging energy shortages is becoming a serious issue for industry in general, which is particularly dependent on energy [37,38,39,40].
The ongoing research takes also into account efficiency improvements in households. Indeed, it is a crucial issue for these operators, as it affects not only consumption and costs but also various side effects such as improved household health and well-being, comfort, air quality, efficiency, energy security or energy poverty [41]. Improving energy efficiency in households is considered not only as a way to reduce household bills but also as a way to improve health with reduced hospital admissions [42], reduced mortality associated with excessively low temperatures [43], increased energy security and stability [44,45] and improved economic productivity [46].
A review of the literature on the subject led to the conclusion that there are increasing proposals to implement energy conservation policies and to consider energy efficiency as one of the SDGs, rather than as a separate issue [47,48]. A review of the literature on the subject led to the conclusion that definitions of energy efficiency cover a very broad spectrum of aspects: from the simplest definition of energy efficiency as energy savings to energy efficiency including environmental aspects. Therefore, according to the authors of this article, it is not justified to define energy efficiency as a state. Ensuring energy efficiency is a process in which it is necessary to take into account the use of different instruments and measures depending on the goal of the action and the desired effects.
2.2. Energy Efficiency Measures
At the most general level, we may define energy efficiency (ε) as the ratio of useful outputs (O) to physical energy inputs (IE) for a system (ε = O/IE) and energy intensity (EI = IE/O) as the inverse of this measure. The relevant system may differ in terms of the products it delivers and in terms of the scale. Depending on the system and the purpose for which it is used, it may be appropriate to use thermodynamic measures, physical measures or economic measures. Energy efficiency measures also differ in the way they qualitatively aggregate different energy inputs and in the way they allocate energy inputs between multiple and co-produced products [13].
“Empirical and modelling studies relating to energy efficiency improvements vary in terms of:
- how they define the numerator and denominator of relevant energy efficiency measures (e.g., first law thermodynamic, second law thermodynamic, physical, economic);
- the system boundaries to which these definitions apply (e.g., devices, households, firms, sectors, national economies);
- the methods used to aggregate different energy types (i.e., whether and how differences in energy quality are accounted for);
- the source of improvements in energy efficiency (e.g., exogenous technical change, price-induced substitution, mandatory standards);
- the cost of achieving those improvements (e.g., zero-cost technical change, high-cost regulatory standards; and
- whether those improvements control for (or are assumed to be independent of) improvements in the productivity of other inputs or increases in the utility obtained from other commodities” [49].
Research on energy efficiency is conducted by applying different methods and using differentiated data sources. For obvious reasons, there is no uniform approach for research on energy efficiency. Different approaches are taken by economists and researchers in the field of technical sciences. As part of the review of research conducted on energy efficiency, it was noted, however, that one of the dominant approaches is the use of the index proposed by the EC: ODEX [20,21]. This indicator is obtained by aggregating changes in unit energy consumption observed at a given time at specific end-use levels. The ODEX indicator does not show the current level of energy intensity but the progress in relation to the base year; a decrease in the value of the indicator means an increase in energy efficiency [50]. The ODEX relates to the energy consumption of the productive industries or sub-sectors, to their physical production, as defined by the production index for most industries, and not to their added value. The calculated values for all sub-sectors are then weighted and aggregated to give an overall sector score. In this way, ODEX removes the distorting effects of changes in value added that are not related to the volume of production [14].
This indicator is used, among others, in research on progress in the implementation of the energy and climate package in the industrial sector [51] and in investigating EU energy efficiency policy initiatives affecting the building sector [52,53,54]. An interesting approach relies also on the use of the Mesures d’Utilisation Rationnelle de l’Energie (MURE) database (ODEX index) to measure energy policy intensity in a dynamic panel model for 29 European countries [55,56] or on an econometric approach toward the estimation of the rebound effect in energy efficiency [57]. In the area of regulatory policies, research also concerns improving households’ living conditions and contributing to the alleviation of energy poverty [58]. The studies investigating energy use in EU open-field agriculture should also be mentioned, as they provide an overview of energy use and its concentrations [59].
The second type of mainstream research on energy efficiency, which has gained popularity in recent years, is the use of the DEA model, applied also in the research results presented in this article. The DEA method is widely used for energy efficiency testing as a method for assessing total energy efficiency [18].
Bearing in mind the innovative approach proposed in this paper, attention should also be paid to other proposals for the use of the DEA method for energy efficiency testing. The DEA method was also used to confirm the effect of the substitution of renewable sources for energy import and to benchmark the performance of selected EU countries in terms of efficiency and productivity of renewable sources in the years 2004–2014 from the perspective of energy security [22]. This method was also used to study the energy efficiency of the 29 regions of China in terms of GDP between 1995 and 2002 [60], the energy efficiency of Chinese provinces from 2005 to 2009 [61] and economic growth in 47 Japanese districts for the period of 1993–2003 [62]. This method was also applied to study the change in the energy productivity of the Chinese regions in terms of GDP for the years between 2000 and 2004 [63].
Referring to the definitions and approaches presented, it is worth paying attention to the studies conducted by researchers who treat energy efficiency as energy saving. Energy efficiency is then treated as the cheapest resource; the cost of electricity obtained from energy efficiency is usually between 1 and 3 cents (USD) per kWh [28].
The literature review focused on two aspects: 1. theoretical issues concerning the definition of energy efficiency, as well as the inclusion of different elements in the research, and 2. how to measure energy efficiency. The literature study designed this way identified the primary research gap and the problems that needed to be addressed in the presented research. The research we carried out to fill the identified research gap: 1. continued research in the area of energy efficiency using the DEA method, making it the most up to date, 2. included a new approach taking into account new elements at the input and presenting original effects at the output, 3. considered a new approach: from a static understanding of energy efficiency to a dynamic one. To close the research gap and raise issues, the research questions were supplemented with the following hypotheses:
H1:The level of diversity of EU countries in terms of energy efficiency was increased in 2020 compared to 2013.
H2:In 2020, the number of fully energy-efficient countries had decreased compared to in 2013 within the meaning of the DEA method.
3. Methods and Materials
3.1. Method
DEA is a method that allows for the evaluation of the relative technical efficiencies of a set of comparable entities which use multiple inputs to produce multiple outputs. It uses linear programming (LP) techniques, in which the measurement of efficiency is defined as a ratio between the weighted sum of outputs and inputs. The analysed entities are usually called decision-making units (DMUs). All DMUs are homogeneous, which means that they have the same types of inputs and outputs and are independent, i.e., no constraint binds the input and output levels of one DMU with the inputs and outputs of another one [64].
In the DEA, we assume that there are n DMUs to be evaluated. Each DMU consumes a different number of m inputs to produce s outputs. This means that the jth DMU (j = 1,…,n) consumes xij inputs (i = 1,…,m) to produce yrj outputs (r = 1,…,s). We also assume that inputs xij and outputs yrj are non-negative, and each DMU has at least one positive input and one positive output. Thus, the efficiency of DMUs (θj) is given by the formula:
where ur (r = 1,…,s) and vi (i = 1,…,m) are the weights assigned to the rth output and the ith input, respectively. To find the efficiency of the jth DMU relative to the other DMUs, Charnes et al. [65] developed the following well-known CCR model, which measures the best relative efficiency of DMUs. This mathematical programming model is described by Equations (2)–(4):
where ur and vi are decision variables. By o ∈ {1,…,n}, we denote the index of DMU to be currently evaluated. Equation (2), without additional restrictions (Equations (3) and (4)), has an infinite number of solutions. Equation (3), which means that the ratio of outputs to inputs must be less than or equal to 1, satisfies the normalised value in the interval of (0;1] value of the efficiency measure of a given DMU. Equation (4) ensures a non-negative sign of the calculated weights of the decision variables.
With the application of the Charnes–Cooper [66] transformation, the above programming problem can be reduced to the linear form, which is easier in calculation and interpretation. This form, in the case of the input-oriented model, is determined by Equation (5) [67]:
In the case of the output-oriented model, the linear programming problem in Equations (2)–(4) is defined by Equation (6) [67]:
The CCR model presented above is further transformed into a dual linear programming (DLP) problem (e.g., [67]). In the case of the input-oriented model, the solution of the dual problem is to find the minimum value , which allows for such a reduction in inputs, so that the level of outputs stays at the same level. In turn, in the case of an output-oriented model, the solution is to find the maximum value , which allows an increase in the outputs with an unchanged level of inputs.
A DMU is CCR efficient if = 1 and there exists at least one optimal (v*, u*), with v* > 0 and u* > 0. Otherwise, the DMU is CCR inefficient. Thus, CCR inefficiency means that either = < 1 or = 1, and at least one element of (v*, u*) is zero for every optimal solution of LP. The optimal values of the decision variables inform how strong the influence of a particular input or output is on the DEA efficiency indicator of a given unit.
3.2. Data and Variables
The application of the CCR DEA model requires the specification of both the DMUs, as well as the variables used for an efficiency assessment. In this paper, energy efficiency was examined for 24 EU countries, i.e., 24 DMUs. Three member states (Luxembourg, Malta and Cyprus) were excluded from the research as the DEA method assumes that the objects under evaluation are as homogeneous as possible. Luxembourg is characterised by a much higher level of GDP per capita than the EU average. Malta, like Luxembourg, may be specified as a country with a predominant services share in the economy, with a special role of tourism. This feature is shared with Cyprus, along with the fact that these island states are among the smallest in the world. The selection of the countries could disturb the results of the research if the assumption of the homogeneity of objects is not fulfilled.
The description of the variables selected for the analysis and their values were taken from the Eurostat database [64]. So, in the set of inputs, they were, appropriately:
I1—Final energy consumption in households per capita [SDG_07_20]. The indicator measures how much electricity and heat every citizen consumes at home, excluding energy used for transportation. Since the indicator refers to final energy consumption, only energy used by end consumers is considered. The related consumption of the energy sector itself is excluded.
I2—Final energy consumption [SDG_07_11]. The indicator measures the energy end use in a country excluding all non-energy use of energy carriers (e.g., natural gas used not for combustion but for producing chemicals). “Final energy consumption” only covers the energy consumed by end users, such as industry, transport, households, services and agriculture; it excludes energy consumption of the energy sector itself and losses occurring during the transformation and distribution of energy.
I3—Primary energy consumption [SDG_07_10]. The indicator measures the total energy needs of a country excluding all non-energy use of energy carriers (e.g., natural gas used not for combustion but for producing chemicals). “Primary energy consumption” covers the energy consumption by end users such as industry, transport, households, services and agriculture, plus the energy consumption of the energy sector itself for production and transformation of energies, losses occurring during the transformation of energies (e.g., the efficiency of electricity production from combustible fuels) and the transmission and distribution losses of energy.
The set of results included:
O1—Energy productivity [SDG_07_30]. The indicator measures the amount of economic output that is produced per unit of gross available energy. The gross available energy represents the quantity of energy products necessary to satisfy all demand of entities in the geographical area under consideration. The economic output is either given as in the unit of euros (EUR) in chain-linked volumes to the reference year 2010 at 2010 exchange rates or in the PPS unit (purchasing power standard). The former is used to observe the evolution over time for a specific region, while the latter allows comparison of member states in a given year.
O2—Real GDP per capita. The indicator is calculated as the ratio of real GDP to the average population of a specific year. GDP measures the value of total final output of goods and services produced by the economy within a certain period of time. It includes goods and services that have markets (or which could have markets) and products which are produced by general government and non-profit institutions. It is a measure of economic activity and is also used as a proxy for the development in a country’s material living standards.
Thus, three inputs and two outputs were used to measure the efficiency of transforming inputs into outputs in the field of energy efficiency of EU countries.
The selection of variables for the study was guided by substantive and statistical criteria.
I1–I3 inputs and O1 output are used to measure SDG 7, i.e., ensure access to affordable, reliable, sustainable and modern energy for all. The O2 output, on the other hand, is a commonly used measure of economic well-being. The empirical data describing the states under study were extracted from the Eurostat database [68].
A linear optimisation program was used to calculate the efficiency indicators [69]. In the research procedure, the CRS (constant returns to scale) model was selected to calculate the energy efficiency measure. The study adopted an input orientation. The energy efficiency of 24 countries was measured for two time periods, i.e., 2013 and 2020. In 2013, Croatia joined the EU. This was also the moment when European economies began to gradually recover from the 2008–2009 crisis. In turn, the year 2020 is the time for which the most up-to-date values of the adopted variables are available.
4. Results
4.1. Inputs and outputs selection
It is very important to select the input and output variables prior to performing DEA (Table 1). The correlation analysis was performed to validate the isotonic relationship between the input and output variables both for 2013 and 2020 (Table 1 and Table 2).
All inputs were positively correlated with the output variables, that is, an increase in any input did not result in a decrease in the output [70].
4.2. Descriptive Statistics
For the preliminary analysis, we performed a statistical evaluation of inputs and outputs. We applied basic descriptive measures, i.e., maximum, minimum, mean, median, lower quartile, upper quartile, standard deviation, coefficient of variation (VC) and coefficient of asymmetry (AC) (Table 3).
In 2013, the average level of final energy consumption in households per capita (I1) was 40.60 kg of oil equivalent (KGOE). The highest I1 was noted in Germany (221.00 KGOE), while the lowest was in Estonia (2.90). The differentiation level among countries for the value of the I1 indicator was high (133.16%). The median was lower than the average, which meant an asymmetric distribution of this variable.
Twelve countries had values lower than 19.20 KGOE, and twelve of them had higher ones. I1 was positively skewed (2.27), indicating that, for the majority of countries, final energy consumption in households per capita was lower than the average.
In 2013, the highest value of the I2 variable was observed for Finland (951.00 KGOE) and the lowest for Portugal (252 KGOE). The values of the median and the mean were close to each other, indicating a relatively symmetrical distribution of this variable. This fact was also confirmed by the asymmetry coefficient close to zero (−0.27). In the case of the I2 variable, much lower differentiation was observed (31.37%).
A high level of differentiation was observed for the I3 variable (136.08). The lowest level of the I3 variable was observed in Latvia (4.40) and the highest in Germany (308.30). A positive asymmetry coefficient (2.29) meant that most countries had lower than average values of the I3 variable.
In 2013, the highest energy productivity, measured in chain-linked volumes (2010) in EUR per kg of oil equivalent and PPS per kg of oil equivalent (O1), was observed in Denmark (13.19) and the lowest in Bulgaria (2.28). The median and mean values were approximate for this variable. Half of the countries reached values lower than the median. The countries were more differentiated regarding the O2 variable, i.e., the real GDP per capita, measured in EUR per capita. The level of this variable differentiation amounted to 56.07%. In 2013, the highest GDP per capita was observed in Denmark (44,410.0) and the lowest in Bulgaria (5390.0). Half of the countries showed a value higher/lower than the median, i.e., lower than 16,895.0.
Similar characteristics of descriptive statistics are presented for the data received for 2020. The values of the basic descriptive statistics are presented in Table 4.
In 2020, the level of input differentiation (I1–I3) was lower than in 2013. The highest differentiation was noted, similarly to in 2013, within the I3 input, then in the I1, and the lowest was in the case of the I2 variable. The countries in which the lowest and highest I1 input values were observed did not change, and these were, respectively, Estonia and Germany. Similarly to in 2013, also in 2020, the same countries with the lowest and highest inputs were noted in the case of I2 variable—these were Portugal and Finland, respectively. The high disproportions between the surveyed countries within the I3 input, i.e., primary energy consumption, were confirmed by the value of the variability coefficient (129.25%). The value of the variable for Germany was over 61 times higher than for Latvia. Three quarters of the surveyed countries reached values lower than the upper quartile, amounting to 51.15 KGOE.
The highest value of the O1 variable was observed in 2020 in Ireland, and the lowest, similarly to in 2013, was in Bulgaria. In 2020, the level of differentiation of this variable increased as compared to 2013 by 11.57 percentage points. Half of the countries reached lower/higher values than the median (6.61). In 2020, the highest GDP per capita among the surveyed countries was noted in Ireland, and the lowest, similarly to in 2013, was in Bulgaria. The level of differentiation of this variable increased compared to that in 2013.
4.3. CCR Model Results
The CCR model results related to inputs for the 2013 data are shown in Table 5.
In 2013, five member states fully efficiently transformed inputs into outputs. These were Estonia, Ireland, Latvia, Portugal and Spain. High values of the efficiency coefficient of transforming inputs into outputs—close to one—were noted for Slovenia and Denmark, 99.36% and 94.59%, respectively. The average value of the indicator amounted to 71.45%, which means that the surveyed countries could acquire the same outputs at inputs lower by 28.55% on average. The value of the median was slightly below the average and amounted to 70.72%. The lowest efficiency indicators were noted for Poland and then for Hungary and Bulgaria. They amounted, respectively, to 28.80, 31.13 and 33.25. Low efficiency indicators were also found for other “new” member states. These were the Czech Republic (36.17) and Romania (39.64). For example, Poland, the weakest country in 2013 regarding energy efficiency, should base its technology of transforming inputs into outputs on the technologies implemented in Portugal (0.440) and Spain (0.14). The coefficient of variation amounted to 34.05%, indicating the average differentiation of the surveyed countries in terms of energy efficiency (Table 6).
The optimal technology for Poland—the country with the lowest efficiency in 2013—based on the technology of the countries showing the highest relative efficiency is defined in Table 7. This technology consists of 44% technology implemented in Portugal and 14% technology implemented in Spain. The countries participating in Poland-oriented optimal joint technology, i.e., Portugal and Spain, would have been able to achieve the results acquired by this country with significantly lower input, amounting to I1—16.9 KGOE, I2—171.9 KGOE and I3—23.3 KGOE.
The EU states transforming the inputs into results in a fully efficient way played a benchmark role for inefficient countries regarding this aspect (Table 5). Estonia played a benchmark role for Slovenia—the country should follow the pattern of technology of transforming the inputs into outputs observed also for Ireland. It was Portugal and Ireland that most often played a benchmark role, respectively, 15 and 14 times. Latvia, though fully efficient, never played a benchmark role, while efficient Spain played a benchmark role five times. The ranking of countries regarding the 2013 efficiency indicator is shown in Figure 2.
In 2020, the average efficiency of the 24 surveyed EU countries was lower than in 2013 and amounted to 54.23% (Table 6). The effects achieved could be obtained by the surveyed countries with inputs lower by 45.77% on average. Bulgaria was characterised by the lowest efficiency in transforming the inputs into outputs (Table 8). The value of the efficiency indicator for this country amounted to 19.91%. Low values of energy efficiency were also noted for Hungary and Poland, 21.48% and 23.50%, respectively. The only fully efficient country was Ireland (100%). The value of the median amounted to 51.38%, which means that half of the countries were characterised by lower/higher efficiency than the abovementioned value. The median value was close to the mean, which means a relatively symmetrical distribution of the efficiency values around the mean/median. The diversity of countries in terms of the efficiency ratio was higher in 2020 than in 2013 and amounted to 41.26%. Fully efficient Ireland served as a model as many as 23 times. Figure 3 shows the ranking of the surveyed countries in terms of energy efficiency in 2020.
The optimal technology for Bulgaria—the country with the lowest efficiency in 2020—based on the model of technologies developed in the countries representing the highest relative efficiency is defined in Table 9. It consists of 11% technology implemented in Ireland. This country participating in the optimal Bulgaria-oriented technology would be able to achieve the effects acquired by Bulgaria with significantly lower outlay, amounting to I1—1.199 KGOE, I2—69.19 KGOE and I3—1.441 KGOE.
The level of countries’ differentiation in terms of energy efficiency was measured by the coefficient of variation, which, in 2013, amounted to 34.05%. Its value indicates the average diversity of countries in terms of the efficiency of transforming inputs into outputs. In 2020, the value of the coefficient of variation measuring this diversity increased and amounted to 42.15%. It meant an increase in differences between countries in terms of energy efficiency by 8.1 percentage points. In 2013, five countries were fully efficient in converting inputs into outputs. These were: Estonia, Ireland, Latvia, Portugal and Spain. Among energy-efficient countries, there were both “old” and “new” member states. In 2020, the number of fully energy-efficient countries fell to one. This country was Ireland, representing the “old” member states. The above results allowed for the positive verification of both hypotheses. The disparities between the 24 countries surveyed in 2020 in terms of the efficiency of converting inputs into outputs had increased as compared to 2013. At the same time, the number of countries that fully efficiently transformed inputs into outputs had decreased from five to one.
The presented results are in line with the literature. According to Makridou et al. [71], Luxembourg, Ireland, the Netherlands, the United Kingdom and Cyprus achieved the highest energy efficiency scores, whereas Hungary, the Czech Republic, Poland, Bulgaria and Romania had the lowest scores. Their results confirmed that countries with more service-oriented economies are more energy efficient than more industrial-oriented economies. Nevertheless, they proved that, in the period of the analysis (2000–2009), most of the low-performing countries (except for Romania) achieved considerable energy efficiency improvements. The assessment of the energy efficiency of European countries in the years 1995–2007 conducted by Ceylan and Gunay [36] showed that the energy efficiency of all countries improved. The countries with the highest energy efficiency scores in almost all years were Greece, Turkey, Malta, Iceland, the United Kingdom and Luxemburg, and the countries with the lowest efficiency scores were Finland, Belgium, Estonia, Slovenia and Romania. According to their research, most of the EU-15 countries, such as Austria, Belgium, France, Germany, Spain, Sweden and the United Kingdom, continuously increased their efficiency scores. The energy inefficiency of most of the “new” EU member states, e.g., the Czech Republic, Romania and Bulgaria, was confirmed by Simeonovski et al. [15].
4.4. Discussion
The research conducted by the authors made it possible to obtain answers to the research questions posed in the study. The theoretical and empirical analysis rendered it possible to answer the research questions posed in the introduction. A review of the literature on the subject led to the conclusion that there is no single, universally accepted definition of energy efficiency. Depending on the approach, processes taking place in individual sectors and the assumptions adopted, different proposals and approaches are presented. Yet, despite the limitations resulting from the analysis, two dominant groups of approaches were distinguished. The first proposal is to define energy efficiency as a state measured by the relationship between the results (benefits) and the energy input (costs incurred). According to the authors of this paper, increasing energy efficiency is a dynamic process that should take into account both macroeconomic and microeconomic approaches. This process is related to the management of energy consumption, which, in the first place, means limiting its growth and then satisfying the same level of energy needs of the entities, using less energy.
The second prevailing theoretical approach narrows the understanding of energy efficiency to energy savings. In the authors’ opinion, this approach is too narrow and limits the scope of analysis. Energy saving is one of the components of energy efficiency. Another important element may be a change in the behaviour of energy consumers or the use of new technologies to produce more energy-efficient goods. Bearing in mind the above, the definition of energy efficiency as a process of managing and limiting the growth of energy consumption seems to be the most accurate. Activities defined as energy efficient consist of providing a higher level of service with the same amount of energy or the same level of service with less energy.
In turn, the results of the empirical analysis made it possible to answer further research questions. Ireland was a fully efficient country within the meaning of the DEA method in both 2013 and 2020. In 2013, Ireland acted as a benchmark 14 times, i.e., the countries that were not fully effective in converting inputs into outputs could improve their efficiency in the best way by following the example of the technology used by Ireland. This country also served as a benchmark in 2020 as many as 23 times. In Ireland, numerous successful programmes have been implemented to support energy efficiency, energy saving and the production of energy from renewable sources. Ireland is a country that economically uses diversified energy, and, consequently, it has one of the highest GDPs per capita in the EU [72]. Ireland has recently developed a large set of policies oriented toward increasing energy efficiency and renewable energy production [73].
On the other hand, Estonia was a country which deteriorated in terms of energy efficiency. From a fully efficient country in 2020, this country fell to the second position in the ranking, with an efficiency ratio of 95.96%. Estonia is one of the “new” member states, and, among them, it should be considered a leader in terms of energy efficiency. It is one of the most independent EU countries in terms of energy, including in its role as a net exporter of energy.
Latvia, occupying a high position in the energy efficiency ranking in 2013 and representing the “new” member states, fell to seventh position in 2020, with a result of 69.60%. However, it was ranked in 2020 ahead of the countries with high GDPs per capita, such as Denmark and Sweden.
The countries of the Iberian Peninsula—Spain and Portugal—fully efficient in 2013, in the 2020 ranking were in the third and fifth positions, respectively. Both countries belong to the “old” EU, and they build their energy independence on the basis of both conventional energy sources—especially in Spain—and unconventional ones.
Apart from Estonia, Ireland, Latvia, Portugal and Spain, the remaining 19 countries were not fully energy efficient in 2013. Among them, the closest to full efficiency was Slovenia, with a score of 99.36%, ahead of Denmark, the Netherlands and Sweden. The subsequent ranking positions, from 10 to 19, were occupied by countries with comparable performance indicators. Worse results were recorded in 2013 for Romania, the Czech Republic, Bulgaria and Hungary, with the worst results in Poland. What is important is that these countries represent the “new” EU countries, for which improving energy efficiency may prove to be a challenge.
Among the “new” member states, Slovakia deteriorated in terms of energy efficiency. It fell in the ranking from 19th position in 2013, with a result of 55.86%, to 20th position, with a result of 30.24%. Slovakia, together with Romania, the Czech Republic, Poland, Hungary and Bulgaria, achieved the lowest values of the energy efficiency index, occupying the lowest positions in both the 2020 and 2013 rankings. The problem of countries occupying low-ranking positions lies in the low efficiency of converting inputs into outputs. These countries can improve their efficiency by modeling their technology on benchmark countries.
The conducted research allowed us to verify the research hypotheses put forward in the literature review. The level of countries’ differentiation in terms of energy efficiency was measured by the coefficient of variation, which, in 2013, amounted to 34.05%. Its value indicates the average diversity of countries in terms of the efficiency of transforming inputs into outputs. In 2020, the value of the coefficient of variation measuring this diversity had increased and amounted to 42.15%. It means there was an increase in differences between countries in terms of energy efficiency of 8.1 percentage points. In 2013, five countries were fully efficient in converting inputs into outputs. These were: Estonia, Ireland, Latvia, Portugal and Spain. Among energy-efficient countries, there were both “old” and “new” member states. In 2020, the number of fully energy-efficient countries fell to one. This country was Ireland, representing the “old” member states.
To sum up, the above results allowed for positive verification of both hypotheses. The disparities between the 24 countries surveyed in 2020 in terms of the efficiency of converting inputs into outputs had increased as compared to those in 2013. At the same time, the number of countries that fully efficiently transformed inputs into outputs had decreased from five to one.
The article had its limitations, which included the selection of the research method. DEA has its advantages and disadvantages. It is an approximate method which allows for estimation of the efficiency but not for its precise measuring. It provides information on the relative efficiency, i.e., the efficiency of the object compared with other objects. For this reason, each change in the frame of reference affects the assessment of the efficiency of a given object. As an approximate method, it can support the development and monitoring of economic policies or the processes of solving extensive, even global problems, such as global warming or climate change [74]. Another limitation consisted of the selection of the research sample. The survey covered the EU countries based on the data availability, standardised indicators and the possibility of comparisons. However, we excluded three member states (Luxembourg, Malta and Cyprus) from the studies as they could have disturbed the research results.
5. Conclusions, Limits of Research and Future Research
The translation of the global targets adopted in the wider international arena to the level of an integrating grouping such as the EU should, therefore, be seen as an unambiguously positive development. Effective implementation of the objectives thus set will contribute to the creation and development of more sustainable and inclusive communities, as well as to the development of mechanisms for resilience to the undesirable effects of climate change.
The present article contributes to the theory by extending the domain of SD, energy efficiency and methods of its measurement and fills a research gap with a new approach to analysing energy efficiency. Due to the observed discrepancies in terms of the general definition and research, the paper presented a new perspective on energy efficiency. Firstly, we defined energy efficiency as the ratio of services, goods and/or energy obtained to the energy input. Moreover, while analysing energy efficiency, we emphasised a dynamic perspective rather than a static perspective. Secondly, we constructed a single indicator to measure energy efficiency, which took into account many variables. The advantage of the study was the assessment of the efficiency of converting inputs into outputs in the two time periods, i.e., in 2013 and 2020. It allowed us to observe the changes in the efficiency of a selected set of objects—24 EU countries. In addition, the GDP per capita indicator was included among the result variables, which rendered it possible to link the energy efficiency of the countries with the level of average welfare of the surveyed states. The proposed ranking of 24 EU countries rendered it possible to indicate the best and worst countries in terms of energy efficiency. For the countries taking the worst ranking positions, we proposed to improve their technology based on benchmarking patterns.
The obtained research results made it possible to formulate managerial and theoretical implications. As SD is considered in three areas [75], it is necessary to look at and carry out energy efficiency improvements in these areas. When considering it in the economic area, it should be emphasised that a country’s level of energy efficiency can influence investment location decisions and the implementation of innovative technologies in businesses. A low level of a country’s energy efficiency may discourage investment in a country, particularly for energy-intensive solutions. Therefore, policy makers of countries with a low energy efficiency level should continue or intensify efforts to improve it. This is particularly relevant for countries that ranked low. With the knowledge provided in the article, it is possible to benefit from the experiences of countries at the top of the ranking. Furthermore, it is also worthwhile to improve the technologies used in the direction set by the benchmark countries. This is an important recommendation for the government of countries with low energy efficiency. The search for technologies that will improve the energy efficiency of countries can be an important part of SD. In addition, it is worthwhile to conduct discussions and implement measures aimed at introducing structural changes in the economy directed at moving away from energy-intensive industries to low-energy-intensive and high-value-added sectors.
In the social area, on the other hand, it is possible to involve a variety of actors who work towards improving energy efficiency. It can create synergies. It is also worth considering financial support for educational activities aimed at consumers and businesses entities teaching how to reduce energy consumption. In addition, it is necessary to show the possibilities of obtaining energy from alternative sources to policy makers and entrepreneurs.
Thirdly, in the environmental field, it is worth looking for technologies that improve energy efficiency and those that work to improve the climate protection. It should be borne in mind that progress towards the desired goals of SD is achieved by simultaneous progress in all three dimensions.
In conclusion, it is important to emphasise that taking action in a number of dimensions can have a positive effect, which is why action by consumers, businesses and policy makers alike is required. However, it is important to bear in mind that energy efficiency consists of several aspects, and, therefore, action should be taken in an integrated way. It is important for the governments of individual countries to carry out educational activities aimed at residents and businesses which inform them of opportunities to save and reduce energy consumption. In addition, it is advisable to implement changes in the law aimed at supporting investments in the area of improving energy efficiency.
Bearing in mind the presented limitations of the study, we plan to conduct further research aimed at analysing country-specific and sector-specific efforts. Additionally, we plan to consider the approach of individual governments in their climate and energy policies.
Author Contributions
Conceptualisation, A.K., B.F. and M.Z.; methodology, B.F.; software, B.F.; validation, B.F., A.K. and M.Z.; formal analysis, B.F.; investigation, B.F.; resources, M.Z.; data curation, B.F.; writing—original draft preparation, M.Z., B.F. and A.K.; writing—review and editing, M.Z., B.F. and A.K.; visualisation, B.F.; supervision, A.K.; project administration, A.K.; funding acquisition, M.Z. All authors have read and agreed to the published version of the manuscript.
Funding
This research was conducted within the framework of project no. 15/EES/2020/POT of the Krakow University of Economics.
Institutional Review Board Statement
Not applicable.
Informed Consent Statement
Not applicable.
Data Availability Statement
Data are available on request.
Conflicts of Interest
The authors declare no conflict of interest.
References
- Stigka, E.K.; Paravantis, J.A.; Mihalakakou, G.K. Social Acceptance of Renewable Energy Sources: A Review of Contingent Valuation Applications. Renew. Sustain. Energy Rev. 2014, 32, 100–106. [Google Scholar] [CrossRef]
- Owusu, P.A.; Asumadu-Sarkodie, S. A Review of Renewable Energy Sources, Sustainability Issues and Climate Change Mitigation. Cogent Eng. 2016, 3, 1167990. [Google Scholar] [CrossRef]
- Abolhosseini, S.; Heshmati, A.; Altmann, J. A Review of Renewable Energy Supply and Energy Efficiency Technologies. SSRN J. 2014. [Google Scholar] [CrossRef]
- Chenari, B.; Dias Carrilho, J.; Gameiro da Silva, M. Towards Sustainable, Energy-Efficient and Healthy Ventilation Strategies in Buildings: A Review. Renew. Sustain. Energy Rev. 2016, 59, 1426–1447. [Google Scholar] [CrossRef]
- Harris, J.; Diamond, R.; Iyer, M.; Payne, C.; Blumstein, C.; Siderius, H.-P. Towards a Sustainable Energy Balance: Progressive Efficiency and the Return of Energy Conservation. Energy Effic. 2008, 1, 175–188. [Google Scholar] [CrossRef]
- Galdeano-Gómez, E.; Pérez-Mesa, J.C.; Godoy-Durán, Á. The Social Dimension as a Driver of Sustainable Development: The Case of Family Farms in Southeast Spain. Sustain Sci 2016, 11, 349–362. [Google Scholar] [CrossRef]
- Kettner, C.; Kletzan-Slamanig, D. Is There Climate Policy Integration in European Union Energy Efficiency and Renewable Energy Policies? Yes, No, Maybe. Env. Pol. Gov. 2020, 30, 141–150. [Google Scholar] [CrossRef]
- Directive (EU) 2018/2002 of the European Parliament and of the Council of 11 December 2018 Amending Directive 2012/27/EU on Energy Efficiency (Text with EEA Relevance). 2018, Volume 328. Available online: https://eur-lex.europa.eu/legal-content/EN/TXT/PDF/?uri=CELEX:32018L2002&rid=7 (accessed on 30 December 2022).
- Sustainable Development in the European Union—2022 Edition. Available online: https://ec.europa.eu/eurostat/web/products-flagship-publications/-/ks-09-22-019 (accessed on 29 December 2022).
- Revising the Energy Efficiency Directive: Fit for 55 Package | Think Tank | Parlament Europejski. Available online: https://www.europarl.europa.eu/thinktank/pl/document/EPRS_BRI(2021)698045 (accessed on 29 December 2022).
- Europejski Zielony Ład. Available online: https://commission.europa.eu/strategy-and-policy/priorities-2019-2024/european-green-deal_pl (accessed on 30 December 2022).
- Bertoldi, P. Policies for Energy Conservation and Sufficiency: Review of Existing Policies and Recommendations for New and Effective Policies in OECD Countries. Energy Build. 2022, 264, 112075. [Google Scholar] [CrossRef]
- Saunders, H.D.; Roy, J.; Azevedo, I.M.L.; Chakravarty, D.; Dasgupta, S.; de la Rue du Can, S.; Druckman, A.; Fouquet, R.; Grubb, M.; Lin, B.; et al. Energy Efficiency: What Has Research Delivered in the Last 40 Years? Annu. Rev. Environ. Resour. 2021, 46, 135–165. [Google Scholar] [CrossRef]
- Cahill, C.J.; Bazilian, M.; Ó Gallachóir, B.P. Comparing ODEX with LMDI to Measure Energy Efficiency Trends. Energy Effic. 2010, 3, 317–329. [Google Scholar] [CrossRef]
- Simeonovski, K.; Kaftandzieva, T.; Brock, G. Energy Efficiency Management across EU Countries: A DEA Approach. Energies 2021, 14, 2619. [Google Scholar] [CrossRef]
- Mardani, A.; Zavadskas, E.K.; Streimikiene, D.; Jusoh, A.; Khoshnoudi, M. A Comprehensive Review of Data Envelopment Analysis (DEA) Approach in Energy Efficiency. Renew. Sustain. Energy Rev. 2017, 70, 1298–1322. [Google Scholar] [CrossRef]
- Yu, D.; He, X. A Bibliometric Study for DEA Applied to Energy Efficiency: Trends and Future Challenges. Appl. Energy 2020, 268, 115048. [Google Scholar] [CrossRef]
- Xu, T.; You, J.; Li, H.; Shao, L. Energy Efficiency Evaluation Based on Data Envelopment Analysis: A Literature Review. Energies 2020, 13, 3548. [Google Scholar] [CrossRef]
- Mardani, A.; Streimikiene, D.; Balezentis, T.; Saman, M.; Nor, K.; Khoshnava, S. Data Envelopment Analysis in Energy and Environmental Economics: An Overview of the State-of-the-Art and Recent Development Trends. Energies 2018, 11, 2002. [Google Scholar] [CrossRef]
- Report from the Commission to the European Parliament and the Council on the Operation of the European Supervisory Authorities (ESAs)—Publications Office of the EU. Available online: https://op.europa.eu/en/publication-detail/-/publication/ca2a7583-da7d-11ec-a95f-01aa75ed71a1/language-en (accessed on 29 December 2022).
- Energy Efficiency Trends & Policies|ODYSSEE-MURE. Available online: https://www.odyssee-mure.eu/ (accessed on 30 December 2022).
- Gökgöz, F.; Güvercin, M.T. Energy Security and Renewable Energy Efficiency in EU. Renew. Sustain. Energy Rev. 2018, 96, 226–239. [Google Scholar] [CrossRef]
- Czyż-Gwiazda, E. Koncepcje Pomiaru Efektywności Funkcjonowania Organizacji–Zastosowanie Metody DEA w Ocenie Efektywności Organizacji. Zarządzanie I Finans. 2013, 1, 103–116. [Google Scholar]
- Jonek-Kowalska, I. Multi-Criteria Evaluation of the Effectiveness of Energy Policy in Central and Eastern European Countries in a Long-Term Perspective. Energy Strategy Rev. 2022, 44, 100973. [Google Scholar] [CrossRef]
- Irrek, W.; Thomas, S. Defining Energy Efficiency; Wuppertal Institut: Wuppertal, Germany, 2008. [Google Scholar]
- Mastalerska, M. Znaczenie efektywności energetycznej dla bezpieczeństwa energetycznego kraju. Polityka Energetyczna 2011, 14, 281–296. [Google Scholar]
- Trzeciak, M.; Jonek-Kowalska, I. Monitoring and Control in Program Management as Effectiveness Drivers in Polish Energy Sector. Diagnosis and Directions of Improvement. Energies 2021, 14, 4661. [Google Scholar] [CrossRef]
- Çengel, Y.A. Energy Efficiency as an Inexhaustible Energy Resource with Perspectives from the U.S. and Turkey. Int. J. Energy Res. 2011, 35, 153–161. [Google Scholar] [CrossRef]
- Kryk, B. Efektywność Energetyczna w Kontekście Wyzwania Zasobooszczędnego Gospodarowania Na Przykładzie Modernizacji Budynków w Polsce. Zesz. Nauk. Uniw. SzczeciŃSki. Finans. Rynk. Finans. Ubezpieczenia 2013, 57, 317–330. [Google Scholar]
- Benetti, G.; Caprino, D.; Della Vedova, M.L.; Facchinetti, T. Electric Load Management Approaches for Peak Load Reduction: A Systematic Literature Review and State of the Art. Sustain. Cities Soc. 2016, 20, 124–141. [Google Scholar] [CrossRef]
- Gasparrini, A.; Guo, Y.; Hashizume, M.; Lavigne, E.; Zanobetti, A.; Schwartz, J.; Tobias, A.; Tong, S.; Rocklöv, J.; Forsberg, B.; et al. Mortality Risk Attributable to High and Low Ambient Temperature: A Multicountry Observational Study. Lancet 2015, 386, 369–375. [Google Scholar] [CrossRef]
- Butler, K.; Gordon, R.; Roggeveen, K.; Waitt, G.; Cooper, P. Social Marketing and Value in Behaviour?: Perceived Value of Using Energy Efficiently among Low Income Older Citizens. JSOCM 2016, 6, 144–168. [Google Scholar] [CrossRef]
- Patterson, M.G. What Is Energy Efficiency? Energy Policy 1996, 24, 377–390. [Google Scholar] [CrossRef]
- Miciuła, I. Polityka Energetyczna Unii Europejskiej Do 2030 Roku w Ramach Zrównoważonego Rozwoju. Stud. I Pr. WNEiZ 2015, 42, 57–68. [Google Scholar] [CrossRef]
- Amjadi, G.; Lundgren, T.; Zhou, W. A Dynamic Analysis of Industrial Energy Efficiency and the Rebound Effect: Implications for Carbon Emissions and Sustainability. Energy Effic. 2022, 15, 54. [Google Scholar] [CrossRef]
- Ceylan, D.; Gunay, E.N.O. Energy Efficiency Trends and Policies: Cross-Country Comparison in Europe. In Proceedings of the International Conference of Economic Modelling (ECOMOD), Istanbul, Turkey, 7–10 July 2010. [Google Scholar]
- Vikhorev, K.; Greenough, R.; Brown, N. An Advanced Energy Management Framework to Promote Energy Awareness. J. Clean. Prod. 2013, 43, 103–112. [Google Scholar] [CrossRef]
- Li, L.; Zhou, M. Sustainable Manufacturing Systems: An Energy Perspective, 1st ed.; Wiley: Hoboken, NJ, USA, 2022; ISBN 978-1-119-57824-6. [Google Scholar]
- de Ramos, K.M. Industrial Energy Efficiency. Clim. Energy 2022, 39, 28–32. [Google Scholar] [CrossRef]
- Malinauskaite, J.; Jouhara, H.; Ahmad, L.; Milani, M.; Montorsi, L.; Venturelli, M. Energy Efficiency in Industry: EU and National Policies in Italy and the UK. Energy 2019, 172, 255–269. [Google Scholar] [CrossRef]
- McAndrew, R.; Mulcahy, R.; Gordon, R.; Russell-Bennett, R. Household Energy Efficiency Interventions: A Systematic Literature Review. Energy Policy 2021, 150, 112136. [Google Scholar] [CrossRef]
- Howden-Chapman, P.; Preval, N. Cobenefits of Insulating Houses: Research Evidence and Policy Implications. In Wellbeing; Cooper, C.L., Ed.; John Wiley & Sons, Ltd.: Chichester, UK, 2014; pp. 1–20. ISBN 978-1-118-53941-5. [Google Scholar]
- Taylor, J.; Symonds, P.; Wilkinson, P.; Heaviside, C.; Macintyre, H.; Davies, M.; Mavrogianni, A.; Hutchinson, E. Estimating the Influence of Housing Energy Efficiency and Overheating Adaptations on Heat-Related Mortality in the West Midlands, UK. Atmosphere 2018, 9, 190. [Google Scholar] [CrossRef] [Green Version]
- Selvakkumaran, S.; Limmeechokchai, B. Energy Security and Co-Benefits of Energy Efficiency Improvement in Three Asian Countries. Renew. Sustain. Energy Rev. 2013, 20, 491–503. [Google Scholar] [CrossRef]
- Ayres, R.; Turton, H.; Casten, T. Energy Efficiency, Sustainability and Economic Growth. Energy 2007, 32, 634–648. [Google Scholar] [CrossRef]
- Anderson, D.M.; Belzer, D.B.; Livingston, O.V.; Scott, M.J. Assessing National Employment Impacts of Investment in Residential and Commercial Sector Energy Efficiency: Review and Example Analysis. 2014. Available online: https://www.pnnl.gov/main/publications/external/technical_reports/PNNL-23402.pdf (accessed on 8 January 2023).
- Renna, P.; Materi, S. A Literature Review of Energy Efficiency and Sustainability in Manufacturing Systems. Appl. Sci. 2021, 11, 7366. [Google Scholar] [CrossRef]
- Yang, M.; Hong, Y.; Yang, F. The Effects of Mandatory Energy Efficiency Policy on Resource Allocation Efficiency: Evidence from Chinese Industrial Sector. Econ. Anal. Policy 2022, 73, 513–524. [Google Scholar] [CrossRef]
- Brockway, P.E.; Sorrell, S.; Semieniuk, G.; Heun, M.K.; Court, V. Energy Efficiency and Economy-Wide Rebound Effects: A Review of the Evidence and Its Implications. Renew. Sustain. Energy Rev. 2021, 141, 110781. [Google Scholar] [CrossRef]
- GUS Energy Efficiency in Poland 2010–2020. Available online: https://stat.gov.pl/en/topics/environment-energy/energy/energy-efficiency-in-poland-2010-2020,8,1.html (accessed on 30 December 2022).
- Pach-Gurgul, A.; Ulbrych, M. Efektywność Energetyczna Polski i Polskiego Sektora Przemysłowego w Kontekście Koncepcji Zrównoważonego Rozwoju. Pr. KGP PTG 2019, 33. [Google Scholar] [CrossRef]
- Economidou, M.; Todeschi, V.; Bertoldi, P.; D’Agostino, D.; Zangheri, P.; Castellazzi, L. Review of 50 Years of EU Energy Efficiency Policies for Buildings. Energy Build. 2020, 225, 110322. [Google Scholar] [CrossRef]
- Rosenow, J.; Eyre, N. Reinventing Energy Efficiency for Net Zero. Energy Res. Soc. Sci. 2022, 90, 102602. [Google Scholar] [CrossRef]
- Safarzadeh, S.; Rasti-Barzoki, M.; Hejazi, S.R. A Review of Optimal Energy Policy Instruments on Industrial Energy Efficiency Programs, Rebound Effects, and Government Policies. Energy Policy 2020, 139, 111342. [Google Scholar] [CrossRef]
- Bertoldi, P.; Mosconi, R. Do Energy Efficiency Policies Save Energy? A New Approach Based on Energy Policy Indicators (in the EU Member States). Energy Policy 2020, 139, 111320. [Google Scholar] [CrossRef]
- Paramati, S.R.; Shahzad, U.; Doğan, B. The Role of Environmental Technology for Energy Demand and Energy Efficiency: Evidence from OECD Countries. Renew. Sustain. Energy Rev. 2022, 153, 111735. [Google Scholar] [CrossRef]
- Baležentis, T.; Butkus, M.; Štreimikienė, D.; Shen, Z. Exploring the Limits for Increasing Energy Efficiency in the Residential Sector of the European Union: Insights from the Rebound Effect. Energy Policy 2021, 149, 112063. [Google Scholar] [CrossRef]
- Papantonis, D.; Tzani, D.; Burbidge, M.; Stavrakas, V.; Bouzarovski, S.; Flamos, A. How to Improve Energy Efficiency Policies to Address Energy Poverty? Literature and Stakeholder Insights for Private Rented Housing in Europe. Energy Res. Soc. Sci. 2022, 93, 102832. [Google Scholar] [CrossRef]
- Paris, B.; Vandorou, F.; Balafoutis, A.T.; Vaiopoulos, K.; Kyriakarakos, G.; Manolakos, D.; Papadakis, G. Energy Use in Open-Field Agriculture in the EU: A Critical Review Recommending Energy Efficiency Measures and Renewable Energy Sources Adoption. Renew. Sustain. Energy Rev. 2022, 158, 112098. [Google Scholar] [CrossRef]
- Hu, J.-L.; Wang, S.-C. Total-Factor Energy Efficiency of Regions in China. Energy Policy 2006, 34, 3206–3217. [Google Scholar] [CrossRef]
- Zeng, H.-L.; Wei, Y.-M.; Zhang, Y. Regional Total Factor Energy Efficiency: An Empirical Analysis of Industrial Sector in China. Appl. Energy 2012, 97, 115–123. [Google Scholar] [CrossRef]
- Honma, S.; Hu, J.-L. Total-Factor Energy Efficiency of Regions in Japan. Energy Policy 2008, 36, 821–833. [Google Scholar] [CrossRef]
- Chang, T.-P.; Hu, J.-L. Total-Factor Energy Productivity Growth, Technical Progress, and Efficiency Change: An Empirical Study of China. Appl. Energy 2010, 87, 3262–3270. [Google Scholar] [CrossRef]
- Guzik, B. Podstawowe Modele DEA w Badaniu Efektywności Gospodarczej i Społecznej; Wydawnictwo Uniwersytetu Ekonomicznego w Poznaniu: Poznań, Poland, 2009. [Google Scholar]
- Charnes, A.; Cooper, W.W.; Rhodes, E. Measuring the Efficiency of Decision Making Units. Eur. J. Oper. Res. 1978, 2, 429–444. [Google Scholar] [CrossRef]
- Charnes, A.; Cooper, W.W. Programming with Linear Fractional Functionals. Nav. Res. Logist. Q. 1962, 9, 181–186. [Google Scholar] [CrossRef]
- Cooper, W.; Seiford, L.; Zhu, J. Data Envelopment Analysis: History, Models, and Interpretations. In Handbook on Data Envelopment Analysis; Cooper, W.W., Seiford, L., Zhu, J., Eds.; International Series in Operations Research & Management Science; Springer: New York, NY, USA, 2011; Volume 164, pp. 1–39. [Google Scholar]
- Home—Eurostat. Available online: https://ec.europa.eu/eurostat (accessed on 29 December 2022).
- EMS Data Envelopment Analysis Software. Available online: https://www.holger-scheel.de/ems/ (accessed on 30 December 2022).
- Lee, P. Ranking Decision Making for Eco-Efficiency Using Operational, Energy, and Environmental Efficiency. Sustainability 2022, 14, 3489. [Google Scholar] [CrossRef]
- Makridou, G.; Andriosopoulos, K.; Doumpos, M.; Zopounidis, C. Measuring the Efficiency of Energy-Intensive Industries across European Countries. Energy Policy 2016, 88, 573–583. [Google Scholar] [CrossRef]
- Cyrek, M.; Cyrek, P. Rural Specificity as a Factor Influencing Energy Poverty in European Union Countries. Energies 2022, 15, 5463. [Google Scholar] [CrossRef]
- Andreoni, V. From the Celtic Tiger to the Celtic Phoenix: The Metabolic Profile of Ireland and the Main Drivers of Energy Change. J. Clean. Prod. 2020, 246, 118975. [Google Scholar] [CrossRef]
- Sueyoshi, T.; Yuan, Y.; Goto, M. A Literature Study for DEA Applied to Energy and Environment. Energy Econ. 2017, 62, 104–124. [Google Scholar]
- Grzebyk, M.; Stec, M. Sustainable Development in EU Countries: Concept and Rating of Levels of Development: Measures of Sustainability. Sust. Dev. 2015. [Google Scholar] [CrossRef]
Figure 1.
The energy pyramid.
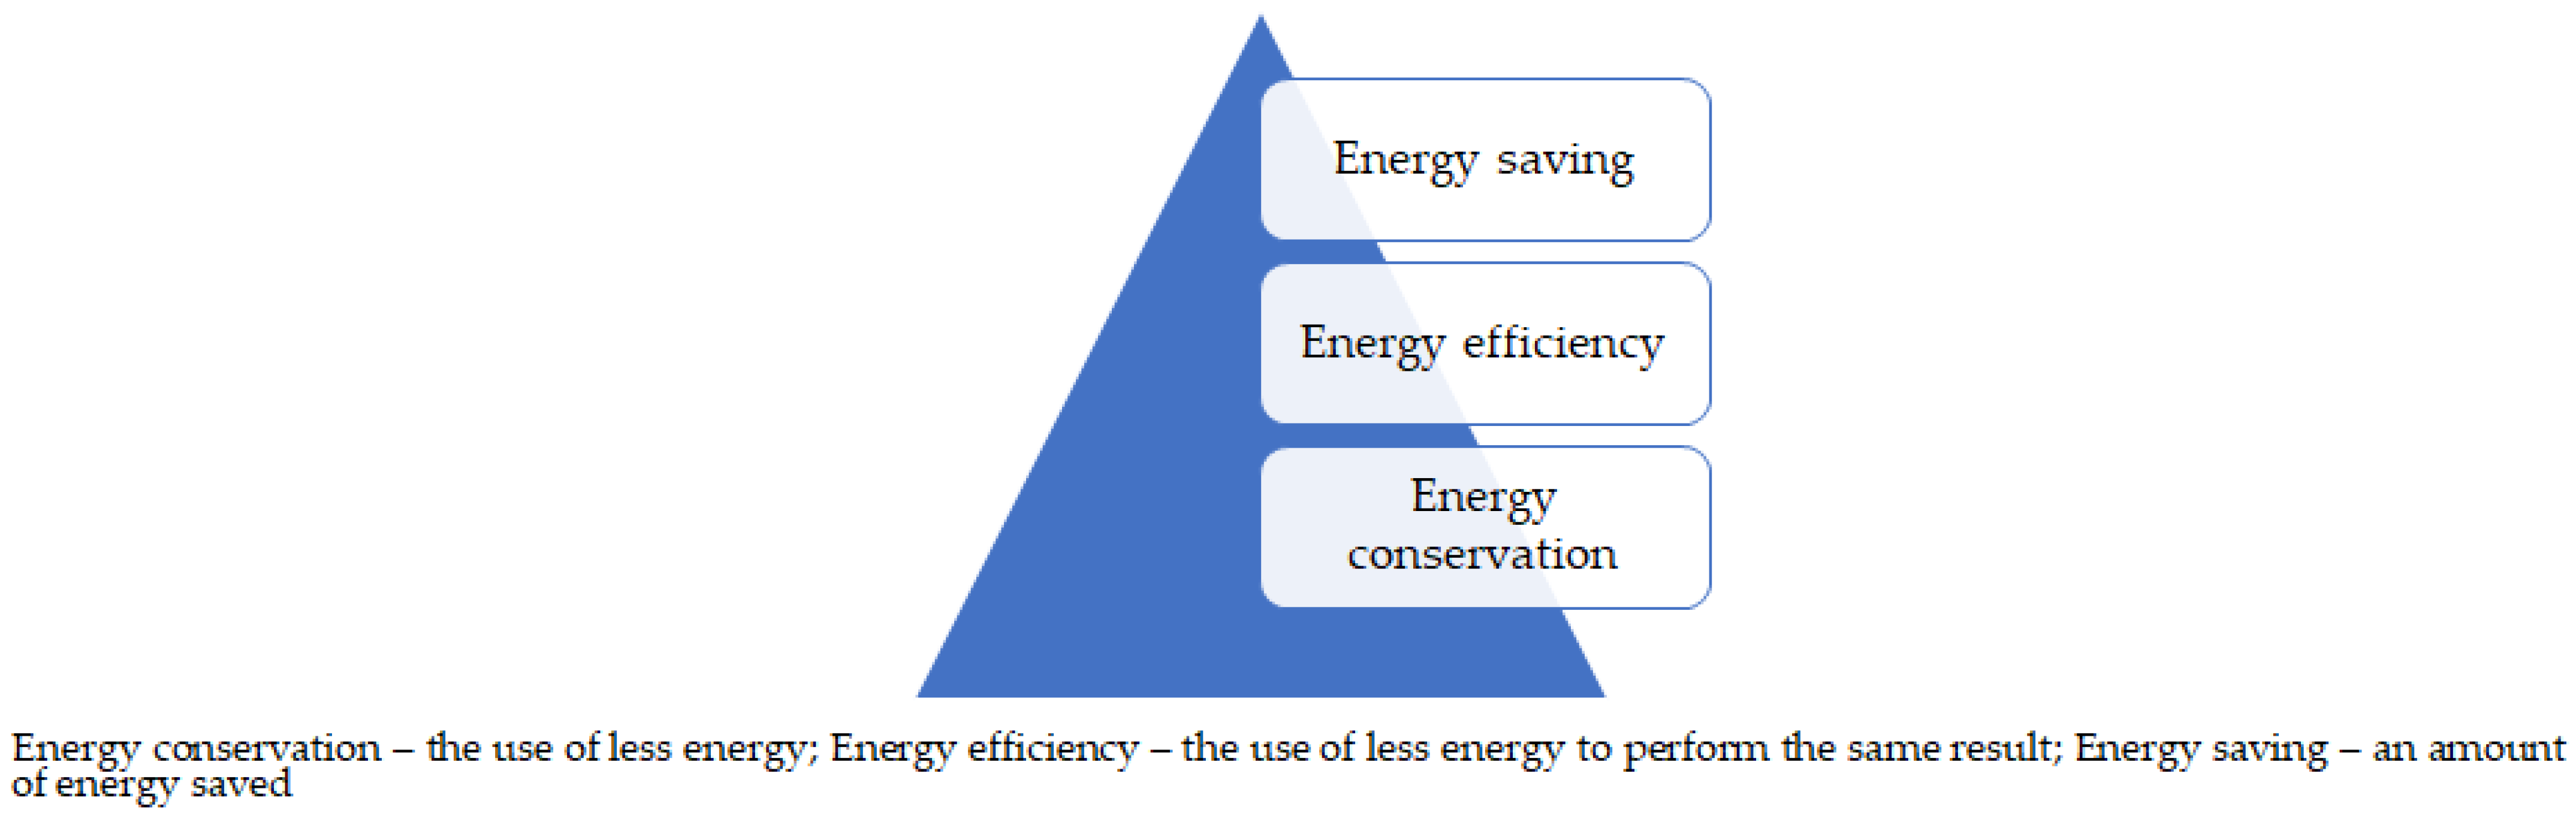
Figure 2.
EU countries’ energy efficiency ranking (2013).

Figure 3.
EU countries’ energy efficiency ranking (2020).


Table 1.
Correlation matrix (2013).
| 2013 | I1 | I2 | I3 | O1 | O2 |
|---|---|---|---|---|---|
| I1 | 1.0000 | ― | ― | ― | ― |
| I2 | 0.1816 | 1.0000 | ― | ― | ― |
| I3 | 0.9953 * | 0.1707 | 1.0000 | ― | ― |
| O1 | 0.2828 | 0.2535 | 0.2554 | 1.0000 | ― |
| O2 | 0.3363 | 0.6641 * | 0.3152 | 0.7805 * | 1.0000 |
* significant at the level of 0.05.
Table 2.
Correlation matrix (2020).
| 2020 | I1 | I2 | I3 | O1 | O2 |
|---|---|---|---|---|---|
| I1 | 1.0000 | ― | ― | ― | ― |
| I2 | 0.0570 | 1.0000 | ― | ― | ― |
| I3 | 0.9936 * | 0.0358 | 1.0000 | ― | ― |
| O1 | 0.1565 | 0.1962 | 0.1413 | 1.0000 | ― |
| O2 | 0.1984 | 0.5136 * | 0.1820 | 0.8535 * | 1.0000 |
* significant at the level of 0.05.
Table 3.
Descriptive statistics (2013).
| Statistics (2013) | N | Mean | Median | Minimum | Maximum | Lower Quartile | Upper Quartile | Standard Deviation (SD) | Coefficient of Variation (VC) | Coefficient of Asymmetry (AC) |
|---|---|---|---|---|---|---|---|---|---|---|
| I1 | 24 | 40.60 | 19.20 | 2.90 (Estonia) | 221.00 (Germany) | 9.70 | 44.25 | 54.07 | 133.16 | 2.27 |
| I2 | 24 | 600.92 | 628.50 | 252.00 (Portugal) | 951.00 (Finland) | 446.50 | 741.50 | 188.50 | 31.37 | −0.27 |
| I3 | 24 | 57.38 | 26.90 | 4.40 (Latvia) | 308.30 (Germany) | 14.40 | 57.40 | 78.09 | 136.08 | 2.29 |
| O1 | 24 | 6.37 | 5.78 | 2.28 (Bulgaria) | 13.19 (Denmark) | 4.27 | 7.81 | 2.81 | 44.14 | 0.91 |
| O2 | 24 | 22,121.67 | 16,895.00 | 5390.00 (Bulgaria) | 44,410.00 (Denmark) | 10,615.00 | 34,075.00 | 12,403.31 | 56.07 | 0.35 |
Table 4.
Descriptive statistics (2020).
| Statistics (2020) | N | Mean | Median | Minimum | Maximum | Lower Quartile | Upper Quartile | Standard Deviation (SD) | Coefficient of Variation (VC) | Coefficient of Asymmetry (AC) |
|---|---|---|---|---|---|---|---|---|---|---|
| I1 | 24 | 37.54 | 20.65 | 2.80 (Estonia) | 201.70 (Germany) | 9.90 | 39.40 | 47.88 | 127.55 | 2.28 |
| I2 | 24 | 573.42 | 568.00 | 293.00 (Portugal) | 957.00 (Finland) | 506.50 | 691.50 | 155.52 | 27.12 | 0.15 |
| I3 | 24 | 51.23 | 26.80 | 4.30 (Latvia) | 262.50 (Germany) | 14.30 | 51.15 | 66.22 | 129.25 | 2.18 |
| O1 | 24 | 7.81 | 6.61 | 2.47 (Bulgaria) | 22.61 (Ireland) | 5.03 | 9.23 | 4.35 | 55.71 | 2.12 |
| O2 | 24 | 24,593.33 | 18,560.00 | 6380.00 (Bulgaria) | 62,570.00 (Ireland) | 13,390.00 | 34,850.00 | 14,315.27 | 58.21 | 0.97 |
Table 5.
CCR model results (2013).
| No. | DMU | Score | FEC | FEC in h. pc. | PEC | Ep | GDP pc. | Benchmarks | {F} FEC {I} | {F} FEC in h. pc. {I} | {F} PEC {I} | {S} EP {O} | {S} GDP pc {O} |
|---|---|---|---|---|---|---|---|---|---|---|---|---|---|
| 1 | Austria | 73.65% | 0 | 0.95 | 0.05 | 0 | 1 | 13 (0.67) 19 (0.71) | 2.06 | 0 | 0 | 4.66 | 0 |
| 2 | Belgium | 66.40% | 0.08 | 0.92 | 0 | 0 | 1 | 13 (0.34) 19 (1.30) | 0 | 0 | 0.44 | 7.83 | 0 |
| 3 | Bulgaria | 33.25% | 0.25 | 0.75 | 0 | 1 | 0 | 13 (0.12) 19 (0.10) | 0 | 0 | 1.77 | 0 | 751.15 |
| 4 | Croatia | 67.79% | 1 | 0 | 0 | 1 | 0 | 13 (0.41) | 0 | 139.06 | 0.05 | 0 | 4742.38 |
| 5 | Czechia | 36.17% | 0.06 | 0.94 | 0 | 0 | 1 | 13 (0.24) 19 (0.39) | 0 | 0 | 3.42 | 2.21 | 0 |
| 6 | Denmark | 94.59% | 0.03 | 0.97 | 0 | 0 | 1 | 13 (1.19) 19 (0.02) | 0 | 0 | 0.77 | 2.02 | 0 |
| 7 | Estonia | 100.00% | 1 | 0 | 0 | 0 | 1 | 1 | |||||
| 8 | Finland | 61.08% | 0.05 | 0.95 | 0 | 0 | 1 | 13 (0.75) 19 (0.44) | 0 | 0 | 0.53 | 7.04 | 0 |
| 9 | France | 66.04% | 0.08 | 0.92 | 0 | 0 | 1 | 19 (0.29) 23 (1.22) | 0 | 0 | 18.61 | 4.09 | 0 |
| 10 | Germany | 62.82% | 0 | 1 | 0 | 0 | 1 | 23 (1.53) | 15.06 | 0 | 17.09 | 4.06 | 0 |
| 11 | Greece | 79.26% | 0.34 | 0.66 | 0 | 1 | 0 | 13 (0.18) 19 (0.64) | 0 | 0 | 2.68 | 0 | 373.22 |
| 12 | Hungary | 31.13% | 0.24 | 0.76 | 0 | 1 | 0 | 13 (0.25) 19 (0.16) | 0 | 0 | 0.45 | 0 | 1345.46 |
| 13 | Ireland | 100.00% | 0 | 0.15 | 0.85 | 1 | 0 | 14 | |||||
| 14 | Italy | 67.48% | 0 | 0.93 | 0.07 | 0 | 1 | 19 (0.52) 23 (0.79) | 7.53 | 0 | 0 | 0.45 | 0 |
| 15 | Latvia | 100.00% | 0 | 0 | 1 | 1 | 0 | 0 | |||||
| 16 | Lithuania | 80.97% | 1 | 0 | 0 | 1 | 0 | 13 (0.36) | 0 | 177.34 | 0.03 | 0 | 2361.95 |
| 17 | Netherlands | 87.95% | 0 | 0.97 | 0.03 | 0 | 1 | 19 (2.25) 23 (0.09) | 2.41 | 0 | 0 | 10.19 | 0 |
| 18 | Poland | 28.80% | 0.04 | 0.96 | 0 | 0 | 1 | 19 (0.44) 23 (0.14) | 0 | 0 | 1.57 | 0.37 | 0 |
| 19 | Portugal | 100.00% | 0 | 0.94 | 0.06 | 1 | 0 | 15 | |||||
| 20 | Romania | 39.64% | 0.4 | 0.6 | 0 | 1 | 0 | 13 (0.03) 19 (0.52) | 0 | 0 | 0.61 | 0 | 2870.37 |
| 21 | Slovakia | 55.86% | 0.05 | 0.95 | 0 | 0 | 1 | 13 (0.28) 19 (0.18) | 0 | 0 | 1.29 | 0.58 | 0 |
| 22 | Slovenia | 99.36% | 0.58 | 0 | 0.42 | 0 | 1 | 7 (0.37) 13 (0.34) | 0 | 124 | 0 | 0.09 | 0 |
| 23 | Spain | 100.00% | 0 | 1 | 0 | 0 | 1 | 5 | |||||
| 24 | Sweden | 82.63% | 0.07 | 0.93 | 0 | 0 | 1 | 13 (0.53) 19 (1.31) | 0 | 0 | 3.93 | 8.66 | 0 |
Legend: FEC—final energy consumption, FEC in h. pc.—final energy consumption in households per capita, PEC—primary energy consumption, EP—energy productivity, GDP pc.—gross domestic product per capita.
Table 6.
Energy efficiency descriptive statistics.
| Descriptive Statistics | Minimum | Maximum | Mean | Median | SD | CV | CA |
|---|---|---|---|---|---|---|---|
| Energy efficiency (2013) | 28.80% | 100.00% | 71.45% | 70.72% | 0.2433 | 34.05% | −0.41 |
| Energy efficiency (2020) | 19.91% | 100.00% | 54.23% | 51.38% | 0.2286 | 42.15% | 0.3033 |
Table 7.
Optimal technology calculation for Poland (2013).
| Benchmark | Portugal | Spain | Optimal Technology | Actual Technology | Optimal Value as % of Empirical Value |
|---|---|---|---|---|---|
| Coefficient λ0j | 0.44× | 0.14× | |||
| I1 | 6.6 | 10.3 | 16.9 | 71.0 | 23.85% |
| I2 | 128.9 | 43.0 | 171.9 | 557.0 | 30.86% |
| I3 | 8.6 | 14.7 | 23.3 | 96.5 | 24.12% |
| O1 | 3.5 | 1.3 | 4.8 | 4.7 | 100.87% |
| O2 | 7510.8 | 3129.0 | 10,639.8 | 12,750.0 | 83.45% |
Table 8.
CCR model results (2020).
| No. | DMU | Score | FEC | FEC in h. pc. | PEC | Rp | GDP pc. | Benchmarks | {F} FEC {I} | {F} FEC in h. pc. {I} | {F} PEC {I} | {S} EP {O} | {S} GDP pc {O} |
|---|---|---|---|---|---|---|---|---|---|---|---|---|---|
| 1 | Austria | 47.35% | 0 | 1 | 0 | 0 | 1 | 13 (0.57) | 6.02 | 0 | 6.48 | 3 | 0 |
| 2 | Belgium | 49.33% | 0 | 1 | 0 | 0 | 1 | 13 (0.54) | 10.36 | 0 | 14.4 | 5.47 | 0 |
| 3 | Bulgaria | 19.91% | 0 | 1 | 0 | 1 | 0 | 13 (0.11) | 0.67 | 0 | 1.96 | 0 | 455.38 |
| 4 | Croatia | 43.44% | 1 | 0 | 0 | 1 | 0 | 13 (0.25) | 0 | 86.49 | 0.01 | 0 | 4043.95 |
| 5 | Czechia | 26.10% | 0 | 1 | 0 | 0 | 1 | 13 (0.28) | 3.28 | 0 | 6.06 | 1.68 | 0 |
| 6 | Denmark | 67.03% | 0 | 0 | 1 | 0 | 1 | 13 (0.77) | 0.28 | 16.82 | 0 | 0.24 | 0 |
| 7 | Estonia | 95.96% | 1 | 0 | 0 | 0 | 1 | 13 (0.24) | 0 | 531.84 | 0.91 | 1.25 | 0 |
| 8 | Finland | 37.97% | 0 | 1 | 0 | 0 | 1 | 13 (0.58) | 2.36 | 0 | 3.55 | 6.92 | 0 |
| 9 | France | 53.43% | 0 | 1 | 0 | 0 | 1 | 13 (0.49) | 64.09 | 0 | 104.8 | 1.8 | 0 |
| 10 | Germany | 49.33% | 0 | 1 | 0 | 0 | 1 | 13 (0.55) | 93.35 | 0 | 122.14 | 2.42 | 0 |
| 11 | Greece | 54.29% | 0 | 1 | 0 | 1 | 0 | 13 (0.35) | 3.87 | 0 | 6.04 | 0 | 5543.77 |
| 12 | Hungary | 21.48% | 0 | 1 | 0 | 1 | 0 | 13 (0.21) | 1.52 | 0 | 2.32 | 0 | 407.28 |
| 13 | Ireland | 100.00% | 0.1 | 0.9 | 0 | 1 | 0 | 23 | |||||
| 14 | Italy | 55.19% | 0 | 1 | 0 | 1 | 0 | 13 (0.45) | 51.6 | 0 | 66.93 | 0 | 3520.78 |
| 15 | Latvia | 69.60% | 0 | 0 | 1 | 1 | 0 | 13 (0.22) | 0.21 | 268.53 | 0 | 0 | 1845.17 |
| 16 | Lithuania | 48.46% | 0 | 0 | 1 | 0 | 1 | 13 (0.22) | 0.06 | 108.02 | 0 | 0.05 | 0 |
| 17 | Netherlands | 75.31% | 0 | 1 | 0 | 0 | 1 | 13 (0.64) | 27.08 | 0 | 35.38 | 6.14 | 0 |
| 18 | Poland | 23.50% | 0 | 1 | 0 | 1 | 0 | 13 (0.21) | 14.35 | 0 | 19.88 | 0 | 311.94 |
| 19 | Portugal | 75.43% | 0 | 1 | 0 | 1 | 0 | 13 (0.35) | 7.37 | 0 | 9.99 | 0 | 4985.86 |
| 20 | Romania | 35.13% | 0 | 1 | 0 | 1 | 0 | 13 (0.23) | 5.65 | 0 | 7.73 | 0 | 5763.98 |
| 21 | Slovakia | 30.24% | 0 | 1 | 0 | 0 | 1 | 13 (0.24) | 0.4 | 0 | 1.35 | 0.45 | 0 |
| 22 | Slovenia | 80.22% | 1 | 0 | 0 | 0 | 1 | 13 (0.32) | 0 | 211.53 | 0.67 | 0.69 | 0 |
| 23 | Spain | 80.94% | 0 | 1 | 0 | 1 | 0 | 13 (0.40) | 55.29 | 0 | 79.67 | 0 | 2445.54 |
| 24 | Sweden | 61.87% | 0 | 1 | 0 | 0 | 1 | 13 (0.69) | 11.44 | 0 | 16.67 | 6.29 | 0 |
Legend: FEC—final energy consumption, FEC in h. pc.—final energy consumption in households per capita, PEC—primary energy consumption, EP—energy productivity, GDP pc.—gross domestic product per capita.
Table 9.
Optimal technology calculation for Bulgaria (2013).
| Benchmark | Ireland | Optimal Technology | Actual Technology | Optimal Value as Percentage of Empirical Value |
|---|---|---|---|---|
| Coefficient λ0j | 0.11× | |||
| I1 | 10.9 | 1.199 | 8.8 | 13.63% |
| I2 | 629 | 69.19 | 308 | 22.46% |
| I3 | 13.1 | 1.441 | 16.5 | 8.73% |
| O1 | 12.62 | 1.3882 | 2.28 | 60.89% |
| O2 | 36,940 | 4063.4 | 5390 | 75.39% |
Disclaimer/Publisher’s Note: The statements, opinions and data contained in all publications are solely those of the individual author(s) and contributor(s) and not of MDPI and/or the editor(s). MDPI and/or the editor(s) disclaim responsibility for any injury to people or property resulting from any ideas, methods, instructions or products referred to in the content. |
© 2023 by the authors. Licensee MDPI, Basel, Switzerland. This article is an open access article distributed under the terms and conditions of the Creative Commons Attribution (CC BY) license (https://creativecommons.org/licenses/by/4.0/).
Share and Cite
MDPI and ACS Style
Karasek, A.; Fura, B.; Zajączkowska, M. Assessment of Energy Efficiency in the European Union Countries in 2013 and 2020. Sustainability 2023, 15, 3414. https://doi.org/10.3390/su15043414
AMA Style
Karasek A, Fura B, Zajączkowska M. Assessment of Energy Efficiency in the European Union Countries in 2013 and 2020. Sustainability. 2023; 15(4):3414. https://doi.org/10.3390/su15043414
Chicago/Turabian StyleKarasek, Aneta, Barbara Fura, and Magdalena Zajączkowska. 2023. "Assessment of Energy Efficiency in the European Union Countries in 2013 and 2020" Sustainability 15, no. 4: 3414. https://doi.org/10.3390/su15043414
Note that from the first issue of 2016, this journal uses article numbers instead of page numbers. See further details here.