1. Introduction
Under the background of China’s reform and opening up, many “workshop” village-level industrial parks have appeared in the Pearl River Delta region of China. Historically, village-level industrial parks have contributed significantly to the local economy. However, with the development of society, especially with the advent of Industry 4.0 [
1] and “Made in China 2025” [
2,
3], these types of village-level industrial parks, with low buildings, unreasonable layout, and a low land utilization rate, has not met the needs of social development. Consequently, a new type of intensive village industrial park arises, which consists of multiple multistory standard buildings. In the new village-level industrial parks, different types of enterprises are concentrated, and are even located in the same building (see
Figure 1). When an accident occurs in an enterprise, it may cause harm to neighboring enterprises and employees [
4], or even cause a domino effect. Accordingly, how to reduce the risk level of new-type village industrial parks by the scientific layout of enterprises has become the focus of research. Our study optimizes the layout from a park management perspective. In addition, the cost invested by the park management is concentrated in the construction stage of the park, and the profit mainly comes from rent affected by the layout results. Therefore, it is necessary to consider rental profit.
The layout problem has a long history, and several studies have been conducted on the layout of facilities inside a plant [
5] presented a combined quantitative and qualitative approach to the facilities layout problem. A mixed integer nonlinear programming (MINLP) model was created by Penteado and Ciric [
6] to determine the ideal layout of process equipment in a chemical plant. However, the issue of the multistory layout was not taken into account in these investigations. Research on multistory layouts has gained popularity as the number of multistory workshops has increased. In the context of the facility layout problem, Kia et al. [
7], and Latifi et al. [
8], offered two three-dimensional models. The optimization of three-dimensional layouts at the level of industrial parks, with enterprises as the smallest layout unit, is, however, a topic that has received little research. In addition, most studies have focused on layout costs [
9], such as pipeline and land costs. Nevertheless, rental profit has rarely been considered in previous studies. Furthermore, with the development of society, safety problems have become a critical issue in supporting the sustainable development of society. Industry 5.0, proposed by the European Union, also emphasizes people-oriented and sustainable development [
10].
Although there have been significant advances in the field, there are still research gaps in current research. First, there is a lack of research on the layout problem considering multibuilding, multistory, and multienterprise factors. Secondly, there is little research on the trade-off between risk and rental profits. To address the above gaps, this study used three biobjective mathematical optimization models to obtain the trade-off between minimizing risk and maximizing rental profit. In this sense, this study mainly focuses on the following key questions:
- (1)
What type of risk needs to be considered? Do different types of risks have a significant impact on layout results?
- (2)
How can we formulate a biobjective model for the three-dimensional layout problem considering multibuilding, multistory, and multienterprise factors?
- (3)
How can we linearize and solve the proposed nonlinear mathematical programming model?
- (4)
What are the managerial insights for decision-makers in handling this new type of layout problem?
To solve the problem of enterprise layout optimization with the aforementioned questions, mathematical programming modeling was performed in this study. Compared with existing studies, this study makes the following main contributions: (a) it focuses on the two objectives of minimizing risk and maximizing rental profits; (b) it considers a three-dimensional layout optimization problem with multibuilding, multistory, and multienterprise factors, where the calculation scale of this study is larger than that of the two-dimensional layout design cases; and (c) it considers the risks of the park from multiple perspectives, such as the risk of enterprises on different floors and the mutual influence among enterprises. The remainder of this paper is structured as follows. The key issues of this study are reviewed in
Section 2, where research gaps are also discussed. The enterprise layout problem, with its objectives and presumptions, is described in
Section 3. To address this problem, biobjective mathematical models are constructed in
Section 4, and the linearized and solution strategies are developed in
Section 5. In a case study presented in
Section 6, the computed findings support the model’s efficacy.
Section 7 summarizes the results and highlights future directions.
2. Literature Review
2.1. Layout Object
Layout design optimization impacts the design of many products and industrial systems [
11]. The research objects were mainly facilities, products, and enterprises/factories [
12]. Existing studies mostly focus on the facility layout problem [
12,
13]. Patsiatzis et al. [
14] studied the single-floor process plant layout problem, considering the piping cost, property damage, and cost of protection devices. Xu et al. [
15] and Medina-Herrera et al. [
16] proposed mathematical models for facility layout in chemical plants. These studies take facilities as the smallest unit of the layout. Our study aims to optimize the layout of different enterprises in an industrial park, that is, the overall regional layout. Wang et al. [
17] studied the effects of multiple hazard sources on plant layout in industrial parks. Wu and Wang [
18] proposed a systematic optimization method for the chemical area layout, considering safety and environmental issues. Traditional regional layouts are generally single-floor and do not involve multistory buildings. However, enterprises are becoming increasingly intensive. In such a situation, as a secondary allocation problem, the enterprise layout design problem represents an important combinatorial optimization problem, which is an urgent task to be solved.
2.2. The Multistory Layout Problem
Many studies have been conducted on two-dimensional facility layout problems [
19,
20]. With an increase in new industrial parks and high-rise buildings, research on multistory layout problems has gradually become a trend. A multistory layout needs to consider the impact of different floors on the layout objective. Fewer studies have investigated the layout of multistory plant facilities [
7]. For instance, O’Neill et al. [
21] introduced the z-axis on a two-dimensional basis for the facilities layout inside a factory, which inspired this work. Latifi et al. [
8] used positive variables to describe the position of the center of the facility. The layout location of the park is fixed. This study chooses binary variables to represent the locations of the enterprises and constructs multiple mathematical models in the form of a three-dimensional layout to study the overall layout of enterprises in industrial parks.
2.3. The Layout Principle
Existing industrial layout problems focus on the economy, and aim at minimizing the total layout cost [
20,
22]. Following on, Rw et al. [
23] set the pipeline cost as an objective function to optimize the layout. Earlier et al. [
24] considered reducing material handling costs among all departments, and the cost of rent. In 2021, Hosseini et al. [
25]. used material handling costs and machine rearrangement costs to determine the best layout. These studies conduct layout optimization from the perspective of enterprises. Similarly, minimizing pipeline investment costs, pump power costs, land costs, and surface construction costs, were considered as the goals of optimal layout [
26]. Our study takes the enterprise as the smallest layout unit and considers the interests of the park management to optimize the layout. The cost invested by the park management is concentrated in the construction stage of the park, and the profit mainly comes from rent. Unlike previous studies that considered minimizing costs, this study sets maximizing rental profits as an objective function. A similar study exists that focuses on profit [
27].
Previous studies involving safety have considered risk factors such as cost or layout constraints [
28]. Further, Vazquez-Roman et al. [
29] used land, pipeline, and risk costs as objective functions, and also considered the effects of toxic release constraints. With the development of society, the importance of safety is increasing as it is a critical issue to support sustainable development. Safety and risk assessment, which are presently increasing, were seldom considered in previous studies in the past century [
30]. Interestingly, Wang et al. [
31] proposed a multiobjective optimization method to achieve different trade-offs between the economy and security. This study concerns safety issues and rental profit in the layout process.
2.4. The Mathematical Model
Mathematical programming methods have been widely used to solve industrial layout problems [
32]. For instance, de Lira-Flores et al. [
33] proposed a MINLP method to obtain the optimal facility layout for processing plants. Further, Brunoro Ahumada et al. [
34] incorporated the risk diagram and safety distance into a mixed-integer linear programming (MILP) model for facility layout optimization. None of the studies considered time. Many sustainable dynamic layout models have also been developed in recent years [
35,
36,
37]. Generally, the location of an enterprise in an industry park does not change frequently; therefore, our models did not add time variables. For the linear programming model, the branch and bound and simplex algorithms can be used for accurate solutions [
38]. The nonlinear programming model can be transformed into a linear programming model for an accurate solution, and the metaheuristic algorithm can also be used to provide solutions [
39,
40]. For instance, Wang et al. [
41] optimized the layout of industrial parks based on a genetic algorithm. Further, Alves et al. [
42] used simulated annealing to move units throughout the chemical plant until a workable layout was found to minimize the impact on the surrounding community, in the event of an accident. The optimal solution of the mathematical programming model obtained using the metaheuristic algorithm is the approximate optimal solution. Our study proposes a specific linearization strategy to use the exact solution method.
2.5. Summary
In addition to the above discussion,
Table 1 summarizes a review of relevant studies. Because this study focuses on the safety and rental profit in park layout, international journals that have the highest relevant contributions have been researched. These include: Safety Science; Process Safety and Environmental Protection; the Annals of Operations Research; the Journal of Loss Prevention in the Process Industries; and Computers and Chemical Engineering. As can be seen from
Table 1, the vast majority of studies consider costs; none focus on rental profits. In addition, numerous studies are devoted to optimizing the two-dimensional layout of the facility. Therefore, our study focuses on a three-dimensional layout optimization problem, with multibuilding, multistory, and multienterprise factors. Three biobjective models are presented, considering the risks from multiple perspectives and rental profit. To solve this problem, a linearization strategy is proposed, and the epsilon-constraint method is adopted to solve the reformulated models.
3. Problem Description
3.1. The New-Type Village Industrial Park
This new type of village industrial park has several intensive modern standard plants. There are multiple multistory buildings in the industrial park. They are separately leased to multiple independent enterprises, and unified management is implemented by the park property. Enterprises are densely distributed in industrial parks, which significantly improves land utilization rates. There are different types of enterprises in the park. For instance, common industries in Shunde Industrial Park include: machinery and equipment; household appliances; packaging and printing; electronic information; biological medicine; and other industries. Each enterprise has different sources of hazard and different safety risk values, located on different floors. Meanwhile, enterprises located in the same building share the building infrastructure, are close to each other, and influence each other. In general, the determining factors of the overall safety risk of the industrial park include: (a) the enterprise inherent safety risk; (b) the enterprise location safety risk; (c) the enterprise association safety risk; and (d) the domino effect.
3.2. Risk Statement
3.2.1. Enterprise Inherent Safety Risks
Generally, different types of enterprise are located in the industrial park, where many types of accidents may occur, such as fire, explosion, object strike, mechanical injury, poisoning, and asphyxiation. The risk points within the enterprise should be investigated and identified and the type of accident, based on relevant standards, should be determined. An appropriate risk assessment method was adopted to determine the security risk value of an enterprise. The value of the enterprise’s inherent safety risk only considers the risk factors of the enterprise; the influence of surrounding enterprises is not considered and does not vary with the location change. In addition, owing to the different nature of the industry, enterprises generally have different risk factors, and their inherent safety risk values differ.
3.2.2. Enterprise Location Safety Risks
From the qualitative perspective of engineering experience, the risk values of enterprises located on different floors are different. The quantitative evaluation method can be used to evaluate the enterprise location safety risk. The objective of this method is to evaluate the possibility of potential accidents and the severity of the consequences; thus, the risk value is the combination of the above likelihood and severity. A change in the location of the same enterprise may result in a change in the likelihood or severity of an accident. The enterprise location safety risk can be obtained by the following formula:
where
is the risk value of Enterprise A on floor
,
is the possibility of Enterprise A having an accident on the floor
, and
is the loss caused by the accident of Enterprise A on floor
.
This study provides some visual examples to better illustrate the location safety risk. Enterprises with heavy equipment are almost impossible to collapse when they are located on the ground floor of a building; however, there is a risk of collapse when they are located at the top of the building. Enterprises with an explosion risk should be arranged on the top floor of the building, as the spread range and consequences caused by an explosion accident are more likely to be smaller than those on the bottom floor, as shown in
Figure 2. In this study, the difference in the risk values of enterprises located on different floors is considered, that is, the location risk of enterprises is considered.
3.2.3. Enterprise Association Safety Risks
Enterprises located in the same building in the park may influence each other because they are close to each other and share buildings. Enterprises that produce or use corrosive solutions and gases will increase the risk of accidents if they are surrounded by enterprises that emit large amounts of dust. Enterprises with a potential gas leak will bring additional risks to surrounding enterprises. An explosion in one enterprise may cause an explosion within another potentially explosive enterprise. The enterprise association safety risks can be obtained by the following formula [
46]:
where
is the association risk of Enterprise A to Enterprise B,
is the possibility that Enterprise A will have an accident,
represents the likelihood that an event in Enterprise A will result in a second accident in Enterprise B, and
indicates the damages caused by the second accident in Enterprise B.
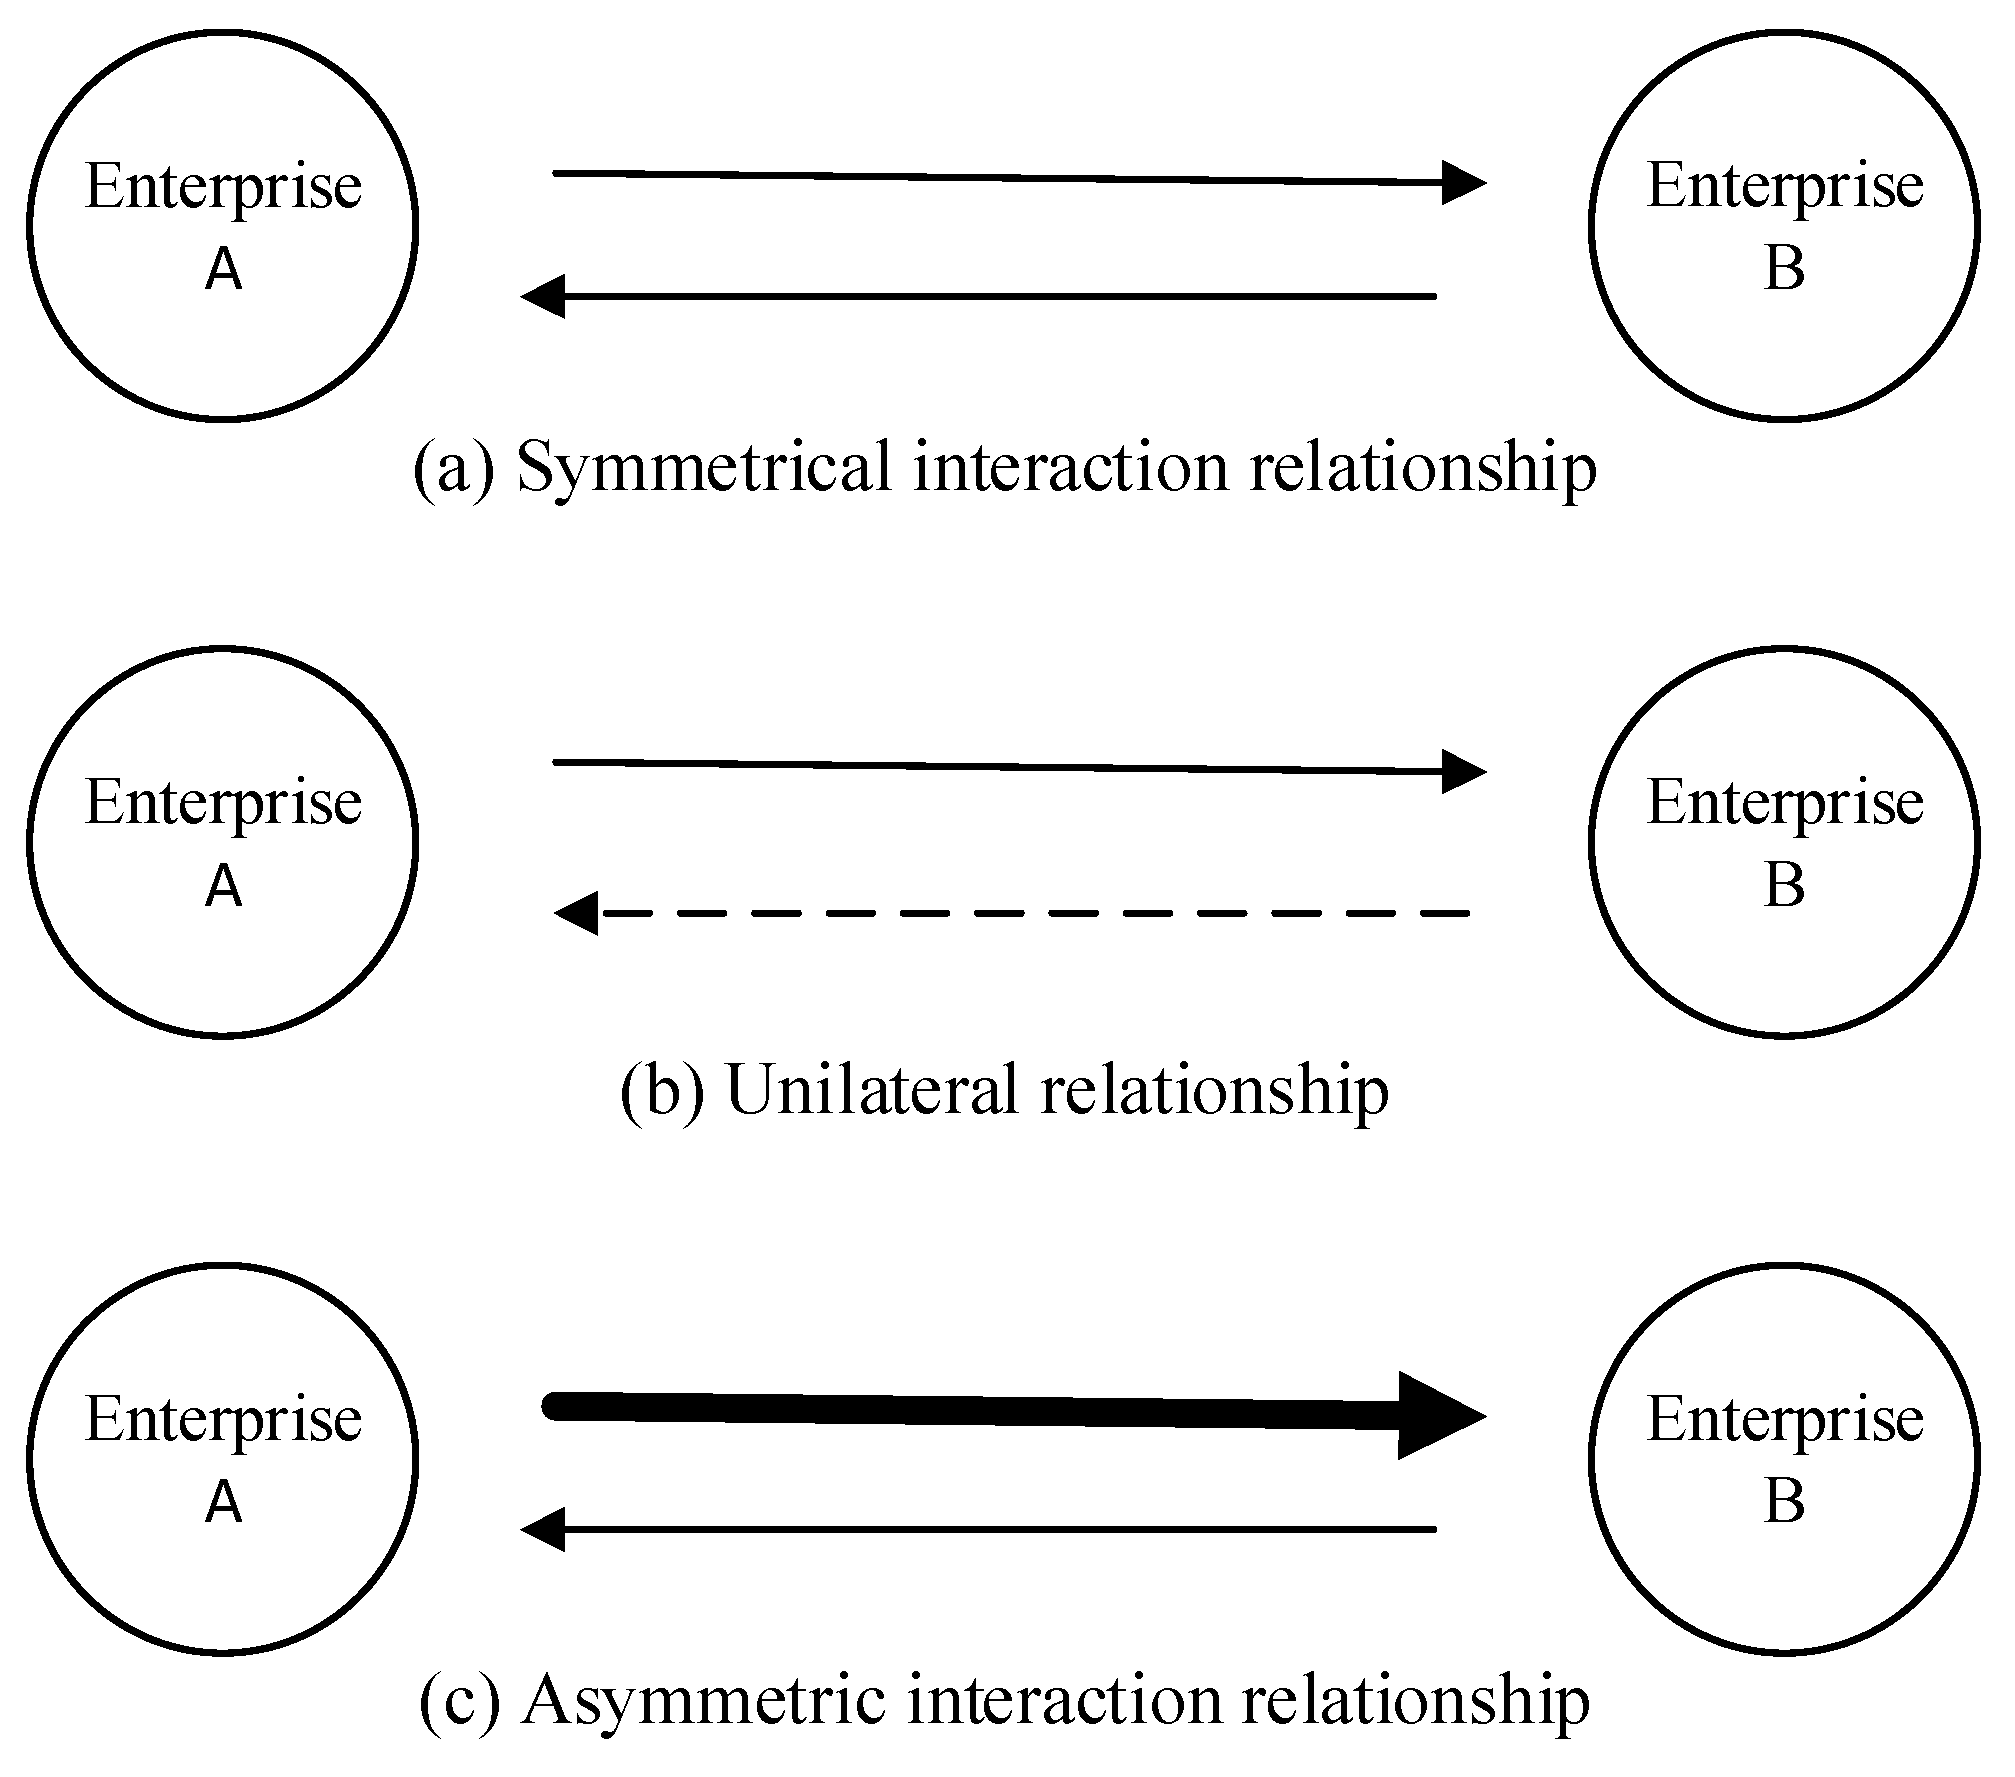
In general, as shown in
Figure 3, the influence between enterprises can be roughly divided into three categories: (a) the symmetrical interaction relationship: Enterprises A and B have the same association safety risks; (b) the unilateral relationship: the impact of Enterprise B on Enterprise A is negligible; and (c) the asymmetric interaction relationship: Enterprises A and B have different association safety risks. There are often many enterprises in industrial parks, and the association safety risk among enterprises significantly influences the overall risk level of the park. The width of the arrows represents different degrees of influence.
3.2.4. Domino Effect
The domino effect [
47,
48] is the idea that in an interconnected system a small initial energy can lead to a series of chain reactions. The geographical closeness between enterprises in industrial parks, especially among enterprises with large-hazard sources, leads to the enhancement of the domino effect. That is, when an accident occurs in one enterprise, it often directly or indirectly influences one or more enterprises and compromises the safety of other enterprises. For example, an accident in an enterprise leads to the accidental release of energy, such as fire, explosion, or gas leakage, which leads to the failure of facilities in other nearby enterprises, resulting in a series of accidents. The consequences of the accident are larger, and the loss is more serious, than that of the initial accident. This chain reaction increases the severity of accidents. The domino effect is a key issue to be considered when enterprises optimize the layout of industrial parks. The strength of the domino effect can be represented by the enterprise association safety risk.
The enterprises’ inherent risks generally do not change significantly with the change of location, but the layout of enterprises in the park will have a significant impact on the location risks and association risks. Therefore, our study considers the location and association risks during the layout process.
3.3. Profit
In addition to safety issues, profit is also the focus of park management, which is affected by many factors, such as factory rent, management costs, and government support. Among these, rent is affected by the layout results and is an important source of profit for the park. The new-type village industrial park generally consists of several multistory buildings; different enterprises have different affordability values for each floor. For example, enterprises with a larger flow of goods are more willing to pay higher rent for the first floor; therefore, it is possible to maximize rental profit by optimizing the park layout.
3.4. Objectives
In general, the optimized layout of enterprises aims to obtain the trade-off between minimizing the overall risk and maximizing the rental profit. Based on different types of risk, we have established three biobjective mathematical programming models: (a) Model 1: the first goal aims to achieve the minimum enterprise location safety risk and the second goal is to maximize the rental profit; (b) Model 2: the first goal aims to achieve the minimum enterprise association safety risk and the second goal is to maximize the rental profit; (c) Model 3: the first goal aims to achieve the minimum enterprise location and association safety risk and the second goal is to maximize the rental profit.
3.5. Presumptions
Before presenting the proposed biobjective mathematical models, four assumptions are postulated:
- (1)
Enterprises are treated as plane figures of different sizes, which can be placed in the free spaces of any building in the industrial park.
- (2)
An enterprise can only be located on one floor of the building because small- and medium-sized enterprises almost exclusively occupy village-level industrial parks. The few enterprises that need to be located on multiple floors are treated as multiple independent enterprises.
- (3)
The situation in which the location of some enterprises are determined in advance is allowed. Additionally, the impact of these enterprises on the overall risk value and rental profit of the park is considered. Enterprises need to be entirely housed in an industrial park and do not overlap with each other.
The association risk can only exist between two enterprises if they are housed in the same building. The influences between enterprises situated in different buildings were not considered in this study; we can find a similar presumption in Liu et al. [
27].
4. The Safety-Oriented Optimization Model
This section provides three biobjective mathematical optimization models to formulate three problems with different concerns, in the following three subsections. The notations used in these three models are first provided before presenting the three models. Please note that some notations are the same for the three models.
4.1. Mathematical Model 1
4.1.1. Notations
Parameters:
→ Set of enterprises, indexed by .
→ Set of buildings, indexed by .
→ Set of floors, indexed by .
→ Size of floor in building .
→ Area required by enterprise .
→ Risk value of enterprise on floor .
→ Expected rent of enterprise on floor .
Decision variables:
4.1.2. Model Formulation
The model 1 is defined using Equations (3)–(6).
The first Objective Function (3) is to minimize the total location safety risk value, and the second Objective Function (4) is to maximize the total rental profit. Constraint (5) guarantees that the sum of the enterprise area of each floor cannot exceed this monolayer area. Constraint (6) requires an enterprise to have only one location and cannot be located in more than one location. It is worth noting that when the location of some enterprises has been determined, it is necessary to change Constraint (5); that is, the layer area to the space area that can be laid out.
4.2. Mathematical Model 2
4.2.1. Notations
Parameters:
→ Associated risk value with enterprises and .
Decision variables:
→
→
→
4.2.2. Model Formulation
The model 2 is defined using Equations (3)–(6).
The first Objective Function (7) is to minimize the overall associated safety risk value, and the second Objective Function (8) is the maximization of the total rental profit. Constraint (9) guarantees that the sum of the enterprise area of each floor cannot exceed this monolayer area. Constraint (10) and (11) restrict each enterprise from being placed in one location. Constraint (12) guarantees that each enterprise can only be assigned to one building. To explain Constraint (13), a clear illustration is provided. All the enterprises are assumed to be in the same building. Thus, the enterprise association risk matrix (i.e., Equation (14)) can be obtained, where represents the associated safety risk caused by the influence of enterprise on enterprise . The symmetrical elements (i.e., and ) do not have to be equal.
The possibility of association safety risk (i.e.,
and
) exists only if enterprises
and
are located in the same building. Accordingly,
was selected as the decision variable determined by
and
. That is,
can be 1 only when both enterprises
and
exist in building
. The relationships among decision variables (i.e.,
,
, and
) can be divided into four types, as summarized in
Table 2.
4.3. Mathematical Model 3
Mathematical Formulation:
Max Φ2
s.t.
Constraints (9)–(13).
The first Objective Function (15) is to minimize the sum of the location safety and association safety risk value.
5. Linearization and Solution Methodologies
In this section, the proposed biobjective models can be effectively solved using the IBM CPLEX Optimizer, due to the development of specific linearization and solution approaches.
5.1. Linearization Strategy
Because Constraint (13) in the proposed Models 2 and 3 is nonlinear, it is necessary to develop a linearization method. Although the heuristic method is significant in solving nonlinear problems, the difficulty in searching for the global optimum is a significant challenge. Consequently, this study develops a specific linearization method that introduces several critical parameters into the model to reformulate the proposed Models 2 and 3. To linearize the proposed nonlinear Models 2 and 3, the key problem is the removal of the MIN function in Constraint (13). In this study, a large positive number
and a natural number
are introduced into the proposed Models 2 and 3 such that the nonlinear Constraint (13) can be substituted by two linear constraints, which are given by:
where
ρ∊(1, 2) and
is a large number. Therefore, the proposed Models 2 and 3 can be reformulated as linear mathematical optimization models. Before presenting the reformulated linear mathematical optimization models, the validity of the substitute linear constraints is provided as follows:
Theorem 1. Constraint (13) is equivalent to the Inequalities in (16) and (17), while ρ∊(1, 2).
Proof. As presented in
Table 2 and Constraint (13),
is the minimizer value between
and
. Instead of using the MIN function in Constraint (13), a combination of Inequalities (16) and (17) is used. It suffices to show
assumes the minimizer value of
and
whereas ρ∈(1, 2). Because
and
can only assume binary values (i.e., 0 or 1), as shown in
Table 2, four different combinations exist (i.e., Types 1–4). Thus, we validated the effectiveness of the combination of Inequalities in (16) and (17) in these four combinations.
- (1)
Type 1
Given
and
, we have the below inequalities:
Because
ρ ∈ (1, 2), it is easy to see that
is a small positive value. Let us use
notation to represent
and then we have
. Please note that
is a large positive value. Since the above two inequalities need to be satisfied, then we have:
Since
can only assume binary values,
is 1 with the above restriction in (20).
- (2)
Types 2 and 3
Given
and
OR
and
, we have the below inequalities:
Because ρ∈(1, 2), it is easy to see that
is a negative value. Let us use notation
to represent
and then we have
. Since the above two inequalities need to be simultaneously satisfied, then we have:
Since can only assume binary values, is 0 with the above restriction in (23).
- (3)
Type 4
Given
and
, we have the below inequalities:
Because ρ∈(1, 2), it is easy to see that
is a small positive value. Let us use
notation to represent
and then we have
. Since the above two inequalities need to be satisfied, then we have:
Since can only assume binary values, is 0 with the above restriction in (26). Then, we complete the proof. □
Theorem 2. To ensure that the combination in Inequalities (16) and (17) is equivalent to Constraint (13), the minimum value for is 2.
Proof. As stated in the above-mentioned proof for Theorem 1, it is assumed that
has a large positive value. To satisfy Inequalities (20), (23), and (26), it suffices to show that:
Then, we have a combination of inequalities, which is given as below:
Since ρ∈(1, 2), it is easy to see that . Then, we complete the proof that the minimum value for is 2. □
5.2. Reformulated Models
Model 2:
With the combination of Inequalities (16) and (17), the proposed nonlinear mathematical optimization Model 2 can be reformulated as follows:
Min Φ1
Max Φ2
s.t.
Constraints (9)–(13)
In this study, we assume and = 500.
Model 3:
Similarly, the proposed nonlinear mathematical optimization Model 3 can be reformulated as follows:
Min Ω1
Max Φ2
s.t.
5.3. The Epsilon-Constraint Method
The models proposed in this paper are three biobjective models. Epsilon-constraint, weighted sum, weighted metric, and lexicographic goal programming approaches are some of the traditional biobjective optimization methods that are commonly applied in practice. The weighted sum and weighted metric methods require the introduction of new parameters. The lexicographic goal programming approach is used when there exists a clear priority ordering amongst the goals to be achieved. The two goals we focus on have no obvious priority. The epsilon-constraint method is used in this work to provide the nondominated solutions because of the advantages, which can be found in Gao and Cao [
49]. The main idea of this method is to convert an objective function into a constraint and establish a connection between the two objectives by gradually decreasing or increasing the
value [
50]. The three modes can be formulated as follows:
Model 1:
Max Ψ2
Constraints (5) and (6)
Model 2:
Max Φ2
Constraints (9)–(12), (16) and (17)
Model 3:
Max Φ2
Constraints (9)–(12), (16) and (17)
Taking Model 1 as an example, the steps of the epsilon-constraint method are as follows: (i) the minimum value of the single objective function is calculated under Constraints (5) and (6); (ii) solve the Model 1 given in Constraints (5) and (6); (iii) substituting the layout result into Function (3) to obtain the corresponding nondominated solutions; and (iv) change the value of , and then repeat steps (ii) and (iii). Thus, the Pareto frontier is obtained.
6. Case Study
This study focuses on the layout of multiple enterprises in a village-level industrial park, and it is unique to consider multistory buildings. The effectiveness of the proposed models and methods was tested using a case study of a Shunde industrial park, and the following results are presented. This section comprises four subsections. In the first part, case data are introduced and processed. Subsequently, data are substituted into the three proposed models for calculation, and the results are presented. In part three, the sensitivity analysis was performed by changing the parameter values, and some management opinions were proposed based on the simulation results. The IBM ILOG CPLEX Optimization Studio (Version:12.6) was applied to solve the proposed biobjective models. All the experiments were run on a computer with an 11th Gen Intel(R) Core (TM) i5-1135G7 @ 2.40 GHz and 16 GB memory, with a Windows 10 operating system (Lenovo (Beijing) Co., Ltd., Beijing, China).
6.1. Data Introduction
In this subsection, the layout of an industrial park in Shunde is considered as a case study to evaluate the three proposed models. The building information for this industrial park is presented in
Table 3. The industrial park has four buildings with five floors each, and 20 enterprises need to be rationally arranged in the park. The type of enterprise include: packaging and printing; machinery and equipment; household appliances; electronic information; biological medicine; and e-commerce. The area and number of floors of all enterprises are known. Given that it is challenging to obtain comprehensive and accurate data, we assumed the risk and rent parameters based on the type of settled enterprise, the local environment, and the local economy.
6.2. Illustrative Results
Here, the main results for the three-dimensional layout problem of the enterprise are presented by considering different risk types and rental profit. The value of
increases by 50 each time, and the Pareto frontiers are shown in
Figure 4. These two objective functions are generally in conflict with one another, as is evident from
Figure 4. We cannot guarantee that the lowest level of risk and the highest rental profit will be achieved at the same time. The second objective function value worsens as the first objective function value is decreased. The new industrial park layout needs to pay attention to risks, but the park management will consider rental profit in the actual layout process. Therefore, the Pareto solution can provide a reference for decision-makers, who can choose the corresponding layout scheme according to the actual needs of the park. None of the nondominated solutions in the set can be stated to be preferable to others. Therefore, for the decision-makers to determine the “most desired” alternative, more preference data is required.
The minimum overall risk levels of the park calculated using Models 1, 2, and 3 were 194, 1031, and 1225, respectively. The corresponding rental profits were CNY 1,544,125, 1,575,281, and 1,541,801. The layout results of the three scenarios are shown in
Figure 5a,c,e, where I1-I20 represent 20 enterprises. Model 2 considers only the association safety risk, which only exists in enterprises in the same building. The association safety risk was unrelated to the floor number, so the lowest risk scenario is more likely to obtain a larger rental profit than the other models. The maximum rental profit calculated through the three models is the same (i.e., CNY 1,588,165). The specific layout results with the greatest rental profit are shown in
Figure 5b,d,f. It can be found that in the case of a certain rental profit, there are multiple layout results. The layout results of the three models are not the same.
6.3. Sensitivity Analysis
Sensitivity analysis was performed by changing the key parameters in this subsection. In this analysis, the case data were used as reference values.
6.3.1. Sensitivity to Floors
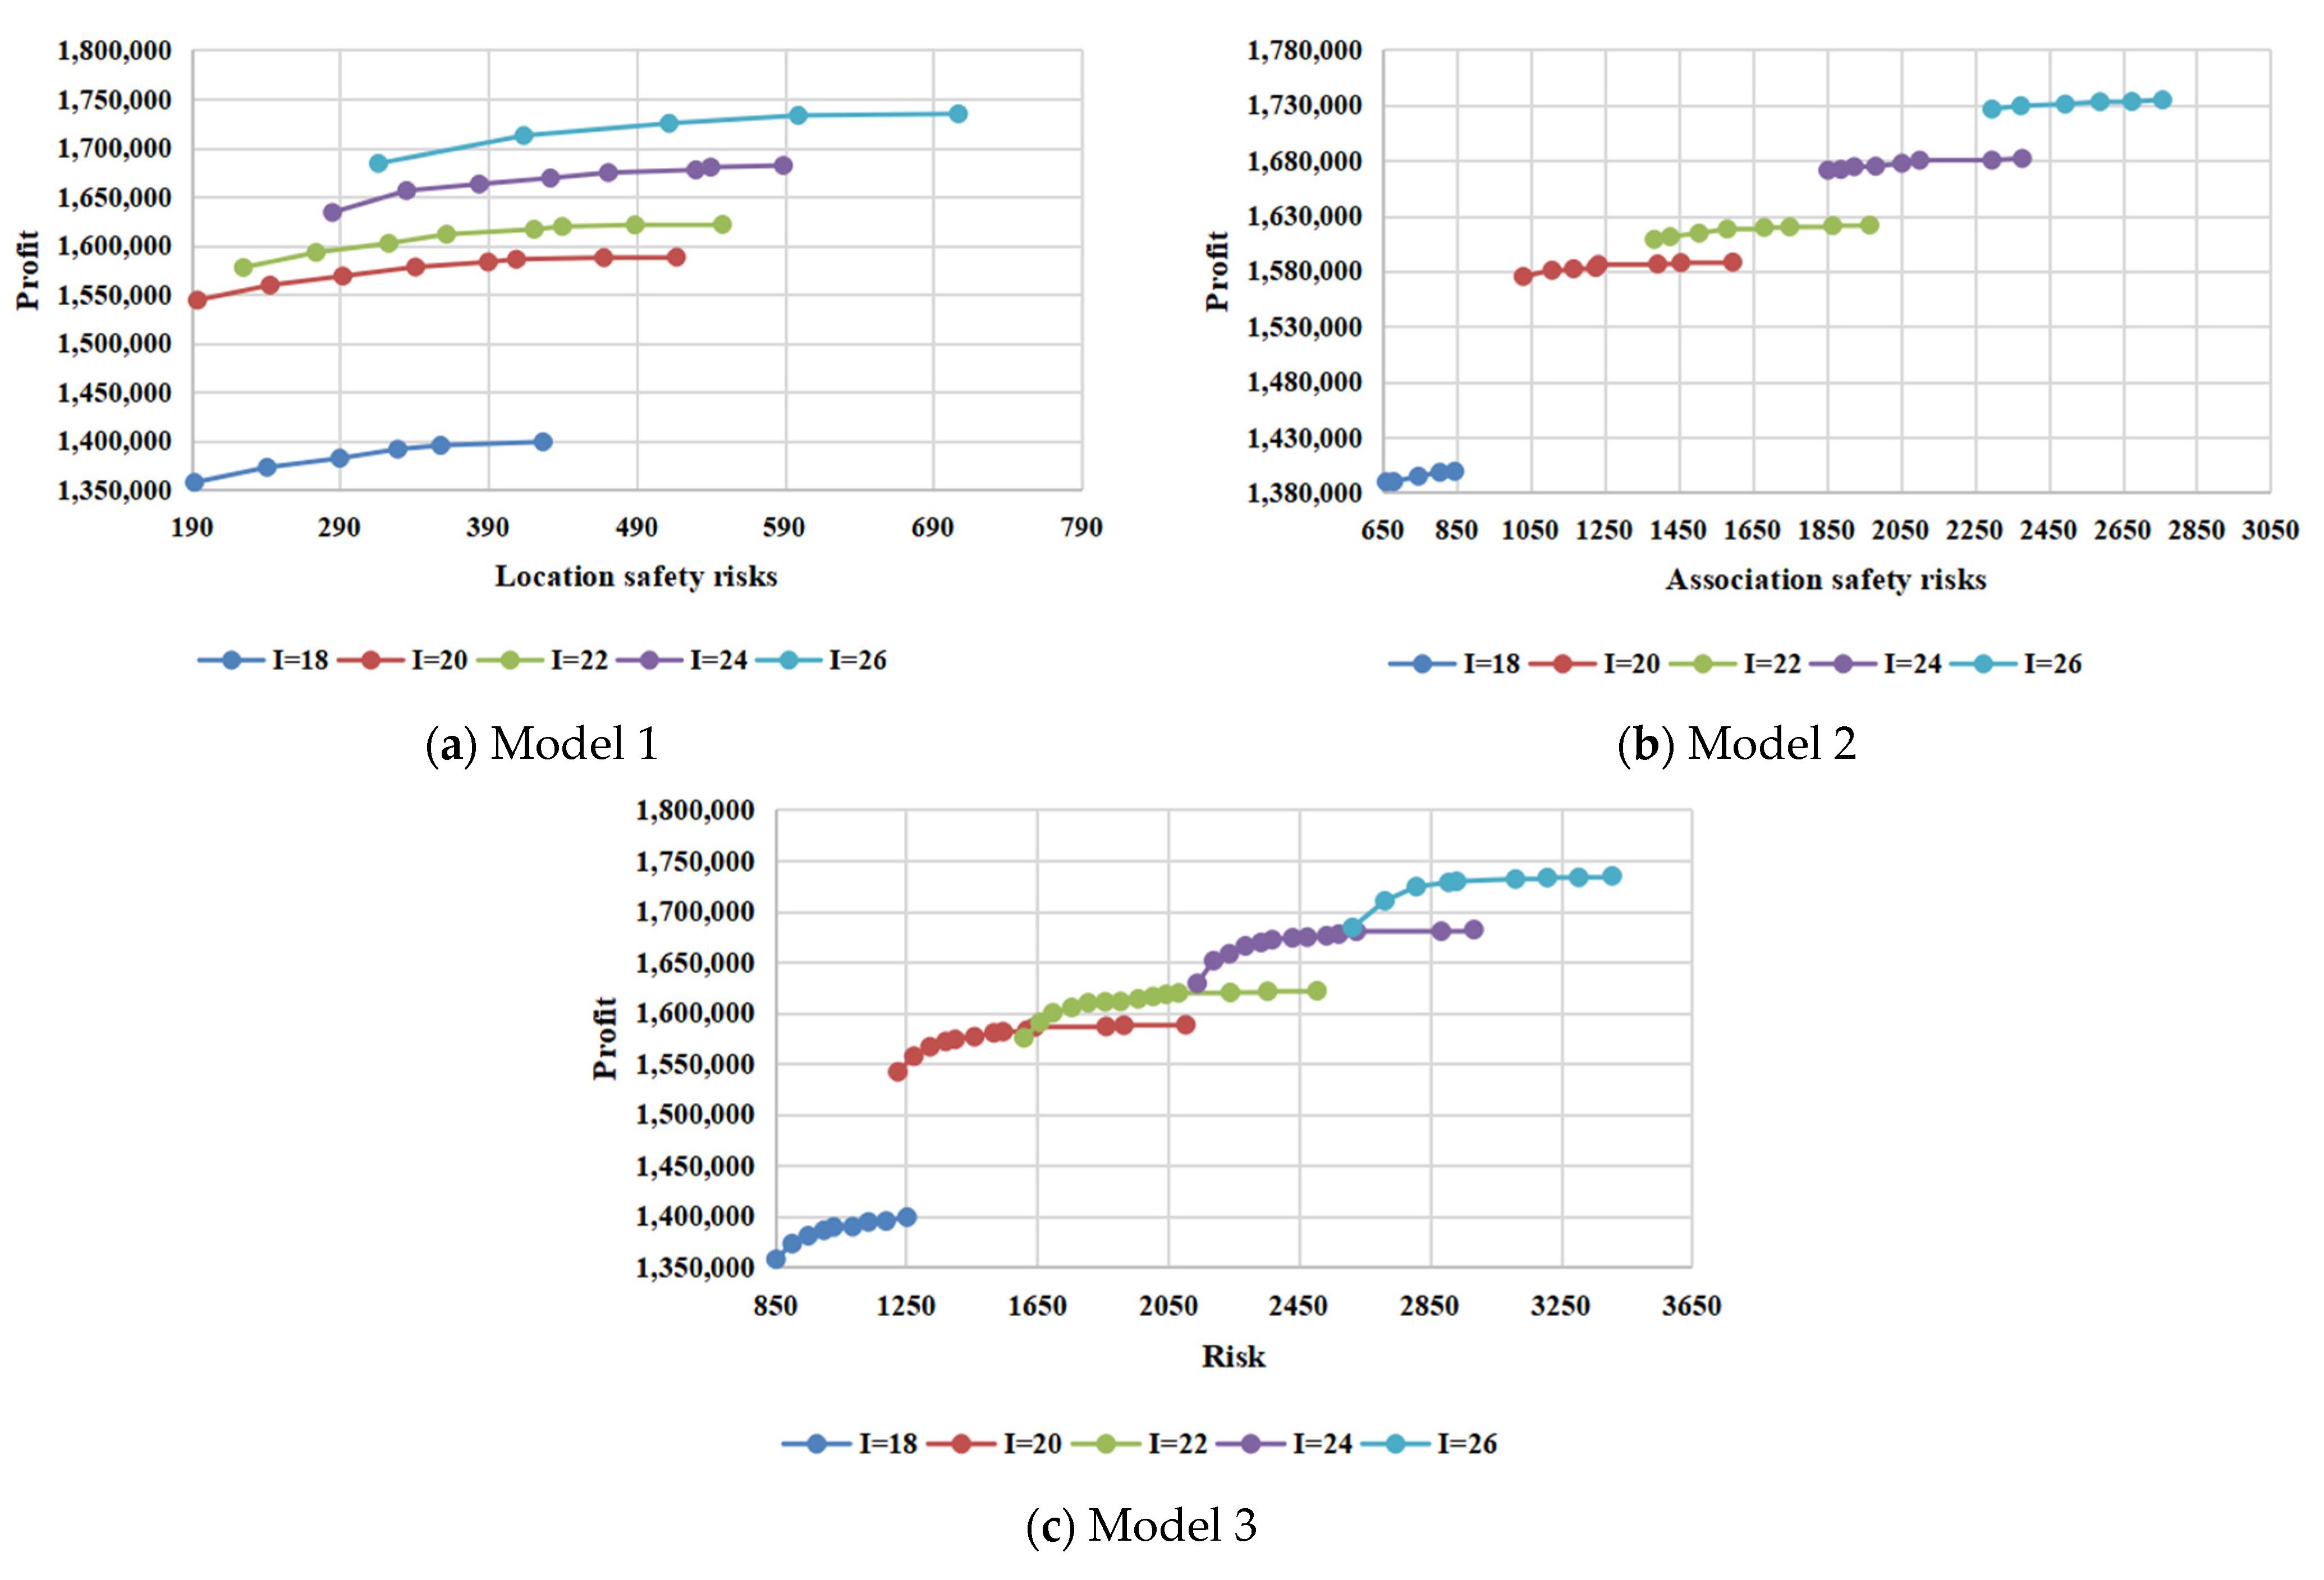
The impact of the number of floors on the overall risk value, and the rental profit of the park, were analyzed by changing the number of floors from five to eight. The optimal Pareto solutions of three models with different floors are partially shown in
Table 4,
Table 5 and
Table 6. It is obvious that the minimum risk value and maximum rental profit do not improve in any way with the different number of floors. Model 1 only considers the location risk, which is affected by the number of floors. The minimum risk value has not changed because there is enough layout space. The location safety risk is not considered in Model 2, and the floor constraint in Model 2 only reflects the area constraint. With sufficient layout space, the risk value in Model 2 is almost independent of the number of floors. It is foreseeable that increasing the number of floors has no impact on maximum rental profit because enterprises are more willing to pay higher rents for the lower floors.
The comparisons of the Pareto fronts of the three models are shown in
Figure 6. In Model 2, the four Pareto frontiers almost overlap. Furthermore, it is interesting to find that increasing the number of floors with a fixed risk value has the potential to have a negative impact on rental profits.
6.3.2. Sensitivity to the Number of Buildings
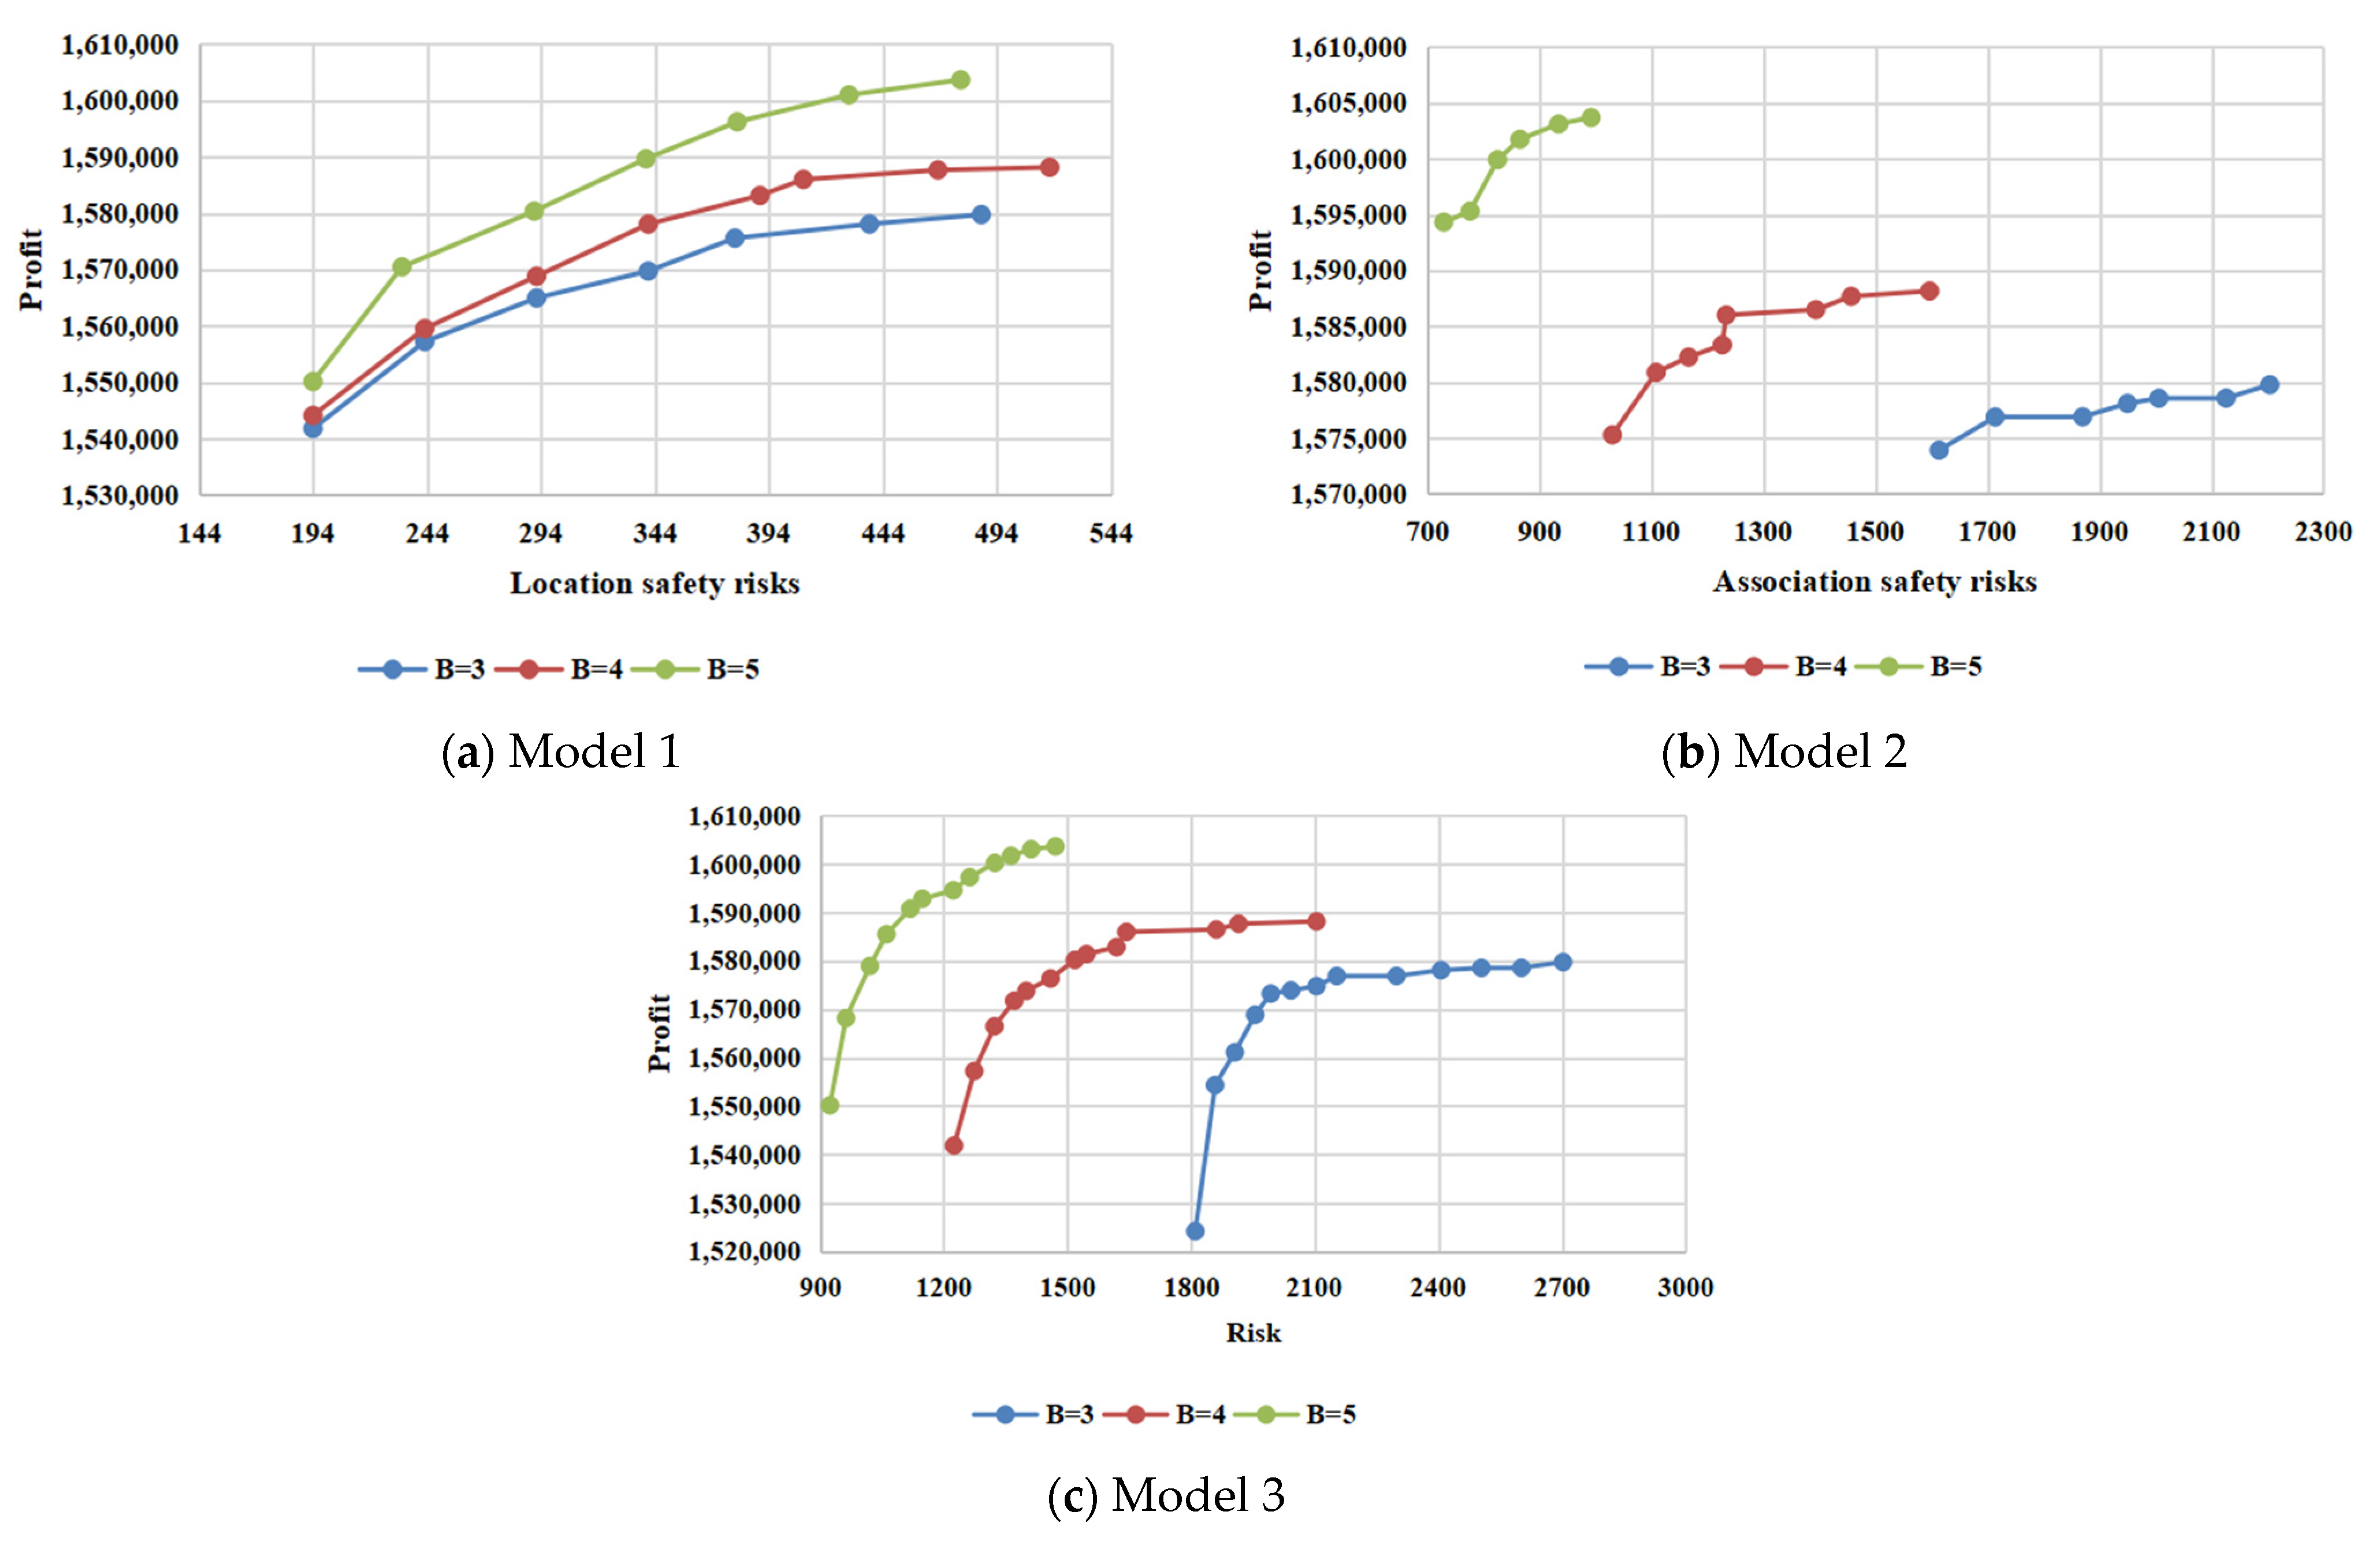
In different parks there were differences in the number of buildings. Based on the case data, one building was reduced and one building was added, to analyze the change in the overall risk value and profit of the park. The Pareto frontiers are shown in
Figure 7, and the comparisons of the Pareto fronts of the three models are shown in
Figure 8. Model 1 is the least sensitive to changes in the number of buildings. In Model 1, the minimum value of the location risk remains unchanged for different building numbers, indicating that the floor space is relatively sufficient when the number of buildings is three, four, and five. As the number of buildings increases, the minimum risk values calculated by Models 2 and 3 are significantly reduced. Only enterprises located in the same building may be associated with safety risks. Therefore, the number of buildings in the park significantly influences the association safety risk value. We can assume that there are sufficient buildings in extreme cases, such that each enterprise can be independently distributed in different buildings. In this case, the association safety risk value of enterprises in the park was 0. As the number of buildings increases, the maximum rental profit calculated by all three models rises by the same amount.
Enterprises prefer to lease the lower floors, and the increase in the number of buildings provides more layout space for higher rental profit.
6.3.3. Sensitivity to the Number of Enterprises
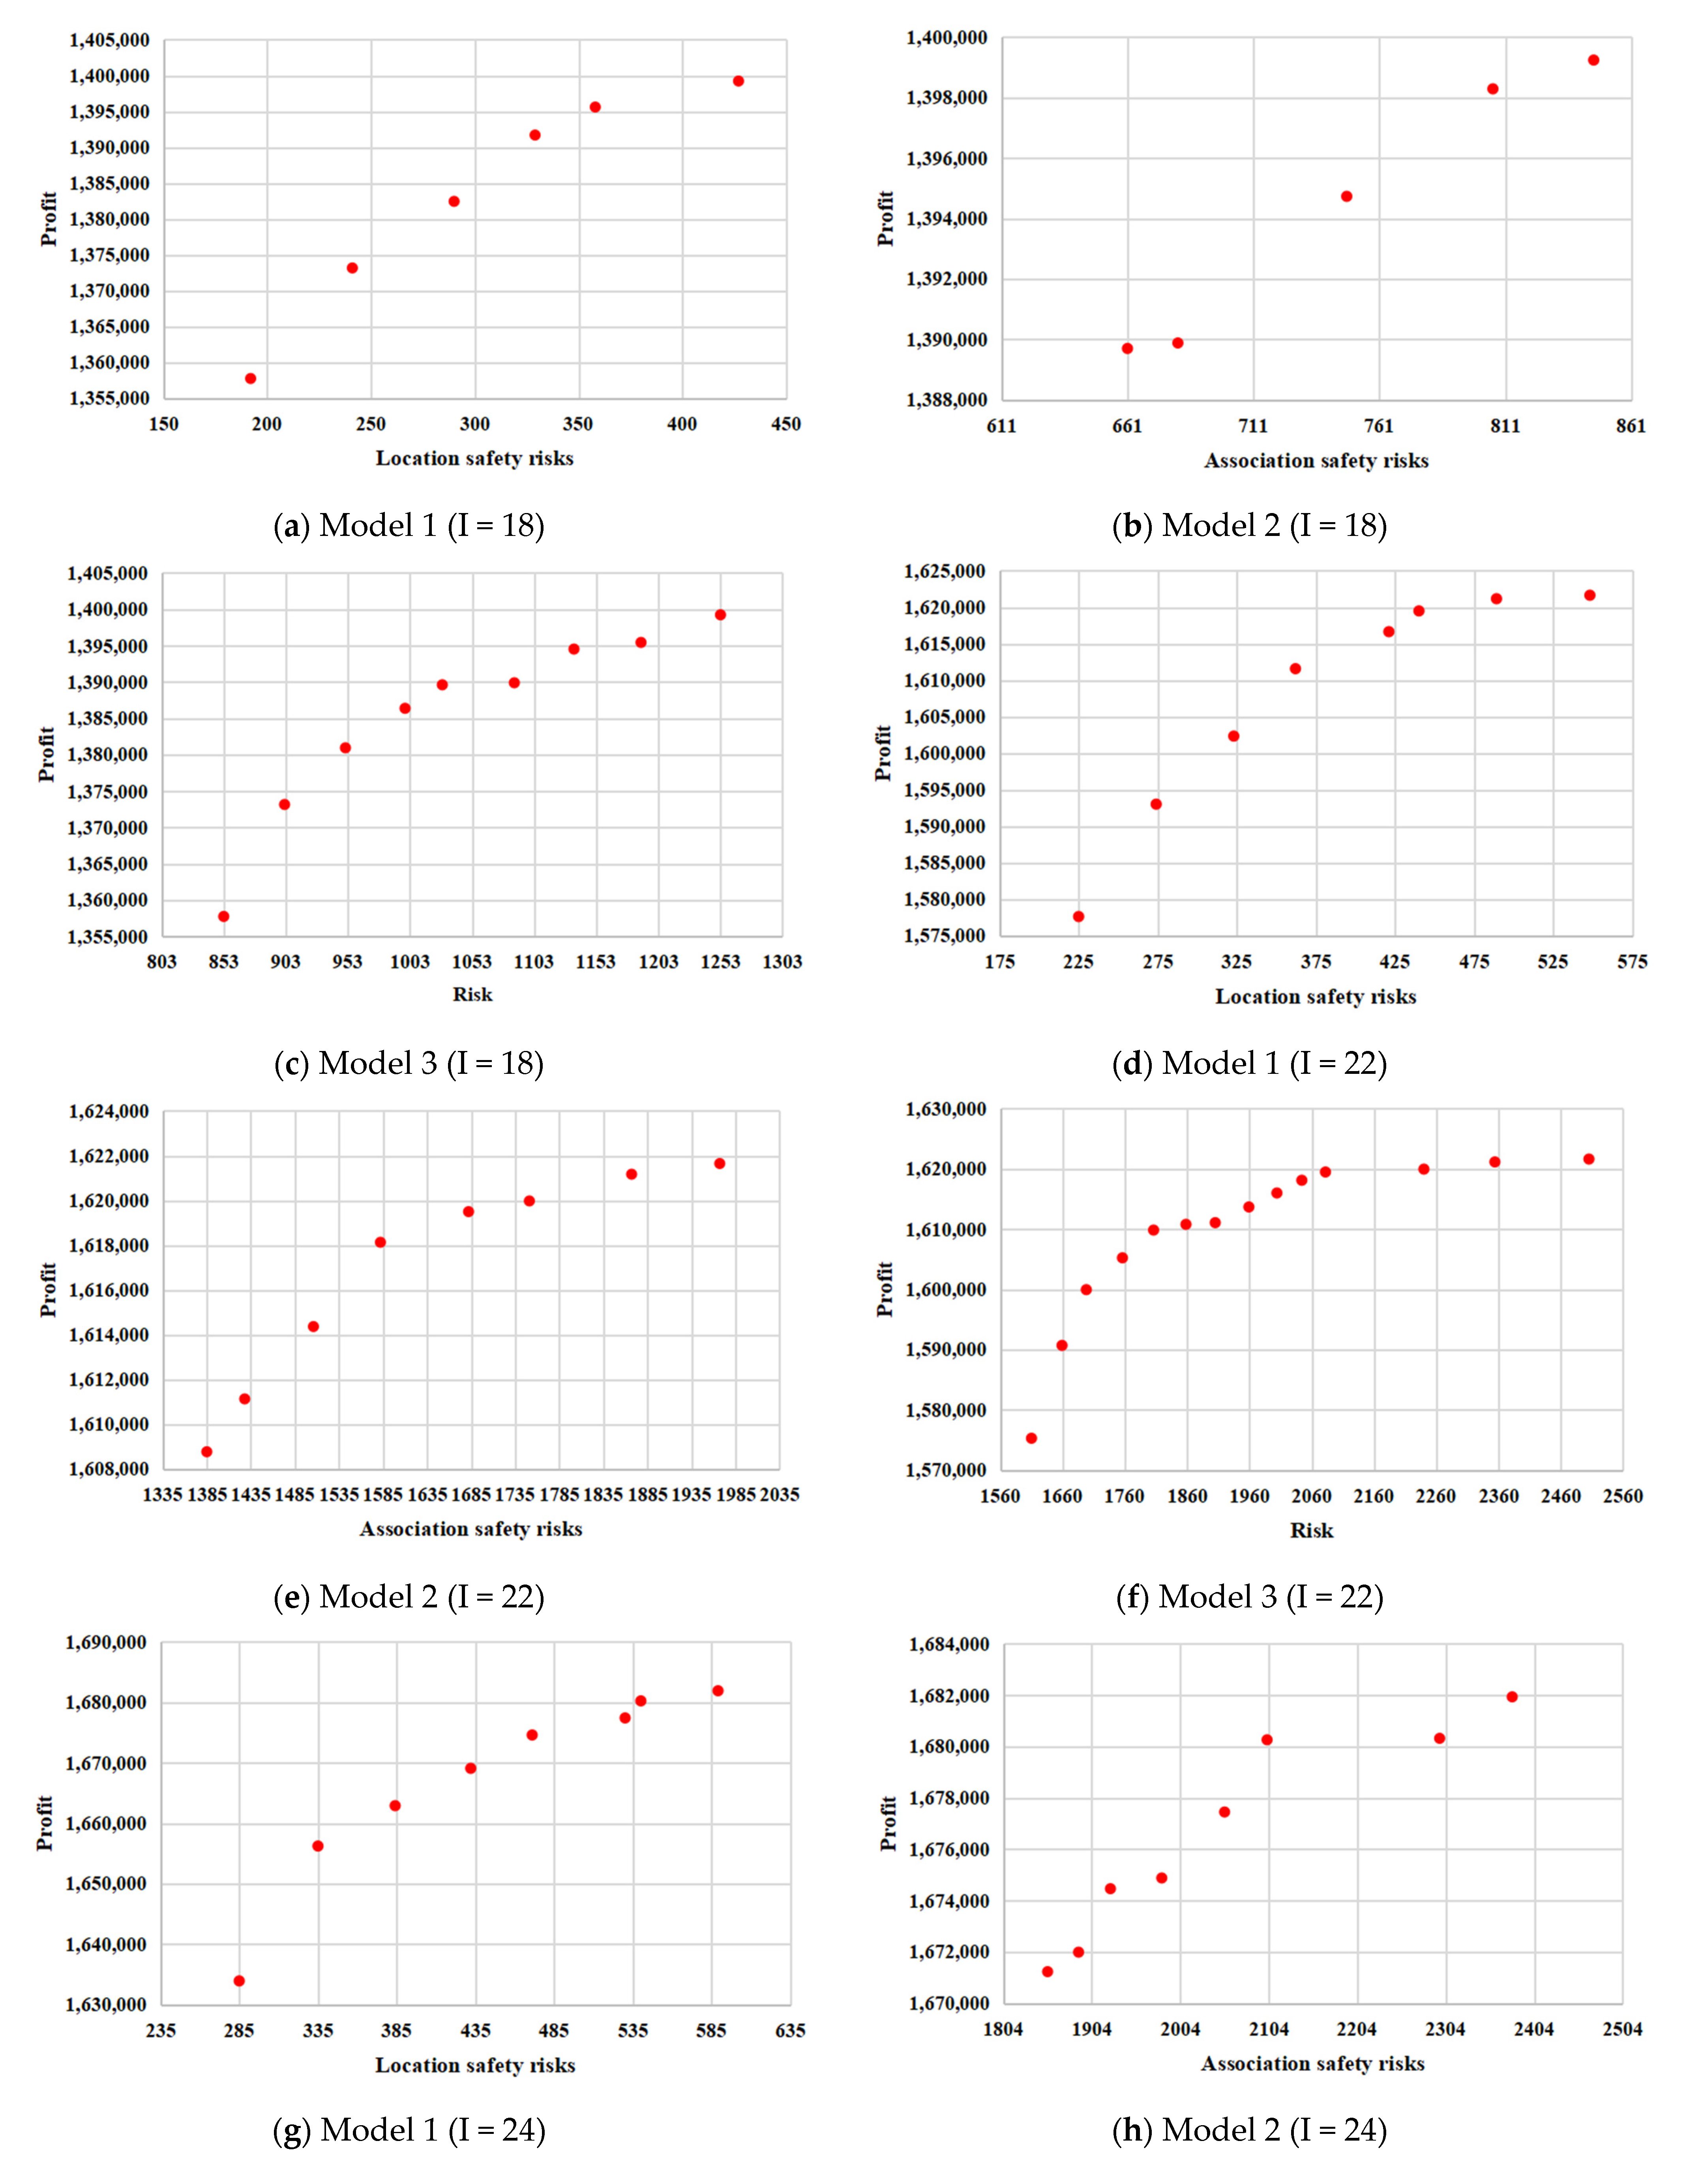
The number of enterprises is changed from 18 to 26, and the resulting risk value and rental profit are output. The Pareto frontiers for the three models are presented in
Figure 9, and the variations of the Pareto frontiers with a different number of enterprises are shown in
Figure 10. It is evident from the figures that as the number of enterprises increase, the minimum risk value and maximum rental profit increases. For example, when the number of enterprises increases from 18 to 26, the minimum risk value calculated using Model 2 increases from 661 to 2297; the maximum rental profit calculated using Model 2 increases from CNY 1,399,245 to CNY 1,734,798. This situation is easy to explain. The increase in the number of enterprises will lead to a more intensive distribution of enterprises, and the choice of space of each enterprise will be reduced such that the total risk value may increase. Moreover, the enterprise itself has a location risk and associated risk with other enterprises. Adding enterprises involves adding new risks and rental profits to the park.
In the calculation process of Model 1, we observed an interesting phenomenon: the increased overall risk value is the lowest location safety risk of the additional enterprises. Therefore, for Model 1, the layout space is relatively affluent. Models 2 and 3 are sensitive to changes in the enterprise. This also indicates that an increase in the number of enterprises still dramatically impacts the total associated risk value in the case of sufficient layout space. Maximum rental profits do not show this phenomenon.
6.3.4. Sensitivity to Risk
The risk of enterprises entering the park is full of uncertainty. This study assumes an enterprise as an example to observe the change in enterprise layout, by changing its location risk and the association risk, when the overall risk of the park is minimal. The risk values for the parks mentioned in this subsection are minimized.
- (1)
Change in the enterprise location safety risk
Enterprise 1 is used as an example to demonstrate the influence of a change in location safety risk on enterprise layout. The result of the enterprise layout in the park is calculated using Models 1 and 3, when the overall risk of the park is minimal. The location safety risk of Enterprise 1 is changed from 30, 30, 20, 1, 1 to 1, 1, 20, 30, and 30, respectively. The results of the layout with the minimum overall risk levels of the park are shown in
Figure 11 and
Figure 12, and the minimum risk value of the park remains the original value.
A comparison of
Figure 5a and
Figure 11 show that with a change in the location risk of Enterprise 1, the original layout of Enterprise 1 changes from the 5th floor to the 1st floor. In Model 3, Enterprise 5 was changed from the original layout from the 5th floor to the 1st floor (see
Figure 5e and
Figure 12). Moreover, the contribution of Enterprise 1 to the overall risk value of the park remains unchanged. It also shows that this model can optimize the layout of the enterprise according to the location safety risk to achieve the lowest overall risk value.
- (2)
Change in the enterprise association safety risk
According to
Figure 5c,e, Enterprises 1 and 20 in Models 2 and 3 are arranged in the same building. To display the change in enterprise layout, the association safety risk value
between Enterprises 1 and 20 is increased from 1 to 70, and the enterprise layout changes.
As shown in
Figure 13, Enterprise 1 is in Building 2, and Enterprise 20 is in Building 4 after the association safety risk is changed. After raising the associated risks between Enterprises 1 and 20, the two are distributed in different buildings after re-layout (see
Figure 13 and
Figure 14). The minimum risk values of the park calculated using Models 2 and 3 are 1091 and 1285, respectively, which have changed. The total risk value calculated using Model 2 increased by 60 compared with the original, which is smaller than the increase in the association risk value (i.e.,
). The results of Model 3 are similar. The numerical simulation results show that the two models can effectively avoid the layout of enterprises that significantly influence each other in the same building, to reduce the possibility of the domino effect of accidents in the park.
6.3.5. Sensitivity to Problem Sizes
We evaluate the solution performances for six distinct problem sizes to confirm the efficacy of the proposed approach. Some of the parameters are shown in
Table 7, and the remaining parameters are consistent with the case in
Section 6.1. We record the time required to find a Pareto-optimal solution. The objective function values and required CPU time are reported in
Table 7. When there are fewer than 24 enterprises, our method is incredibly effective at providing solutions (see
Table 7). In addition, Model 1 is always the easiest to solve. Overall, the models become harder to solve as the size of the problem grows.
In this study, three biobjective models are proposed for multienterprise layout. Patsiatzis et al. [
14] and Li and Smith [
19] proposed models to solve the multifacility layout problem and provided the two-dimensional layout results. Our study gives the distribution of enterprises in multiple buildings and floors. In addition, the study found that Models 2 and 3 are sensitive to changes in the number of buildings. Liu and Huang et al. [
27] proposed a bi-lever model that considers the associated risk and rental profit, prioritizing risk factors. Safety is, without doubt, very significant. However, in practice, profit is also a matter of concern for management. In this study, a set of Pareto nondominant solutions were obtained, and management can choose the appropriate layout scheme according to the actual situation. In addition, this study considers risk factors from multiple angles and has stronger applicability.
According to the calculation results of the models and sensitivity analysis, several views are proposed, as follows: (a) the industrial park managers shall reasonably position the park and select the appropriate type of enterprise. Enterprises with small association safety risks should be selected as far as possible to reduce the possibility of domino accidents in the park; (b) the number of dangerous enterprises will be limited at the park enterprise access stage, and it is better to ensure that the park has sufficient layout space to reduce the risk level of the park; (c) minimizing risk value and maximizing rental profit conflict with each other, and additional preference information is needed to make the decision; and (d) before enterprises enter the park, a unified layout for enterprises will be designed, which can reduce the overall risk level of the park.
7. Conclusions
This study examines the layout planning of enterprises in a multistory building park. Thus, three biobjective mathematical optimization models were proposed, considering different risk types and rental profit to describe the problems. In the proposed models, the risks considered include: (a) the location safety risk; and (b) the association safety risk. The two types of risks are affected by the layout results. Owing to the nonlinearity of the proposed Models 2 and 3, a linearization approach was considered that introduces several critical parameters into the model, which may inspire further research. Subsequently, a case was presented to calculate the models to obtain the trade-off between minimizing the risk and maximizing the rental profit. Finally, the characteristics and applicability of the three models were obtained, with a sensitivity analysis of several crucial parameters. Furthermore, managerial implications are drawn from the case study. The critical conclusions and insights obtained in this study are summarized as follows:
(1) The three mathematical programming models constructed in this study give the trade-off between the objective functions. The safety and profit of an industrial park can be guaranteed during the planning stage, which has received little attention in previous studies. In addition, our proposed linearization strategy enables the model to be solved precisely. The simulation results in
Section 6 show the applicability of the model and method. In the case of relatively sufficient layout space, Model 1 is insensitive to the number of buildings, Model 2 is insensitive to the change in floors, and Model 3 has a high sensitivity to the changes in all the parameters which are analyzed. It is worth noting that Model 1 has a fast calculation time and is easier to solve. Furthermore, changes in the number of enterprises have a significant impact on the calculation results of all three models, which can be found in the sensitivity analysis.
(2) The multistory layout required the consideration of the enterprise location safety risk. Presently, most of the new industrial parks have multistory buildings, and it is necessary to perform a three-dimensional layout. The enterprise association safety risk can be impacted significantly by the layout of the park. Thus, it is necessary to introduce the association safety risk into the reference factors of the optimal layout. The entire association safety risk of the park is most influenced by the number of buildings, but less influenced by the number of floors. In addition, a consideration of the association safety risk in the layout can effectively avoid an accidental domino effect.
(3) The rental profit is also a key concern for park management. When the parameters of the three models coincide, the maximum rental profit calculated by the three models is the same. Rental profits are insensitive to changes in the number of floors. Changes in the number of buildings and enterprises have a greater impact on rental profits.
Despite these contributions, our study has several limitations. The association safety risk only considers whether enterprises are in the same building or not, rather than the effect of distance. In addition, there is a lack of detailed explanation and constraints on single-layer layouts. Therefore, potential future research works can be carried out to: (a) introduce distance constraints to the association safety risk and improve models; (b) divide the building into more specific spaces and add a detailed description of the two-dimensional plan layout; and (c) to study the potential benefits of reducing risk.
Author Contributions
Methodology, X.L., X.X. and X.G.; Software, X.G.; Formal analysis, X.G.; Investigation, G.H., S.O. and X.G.; Resources, G.H., X.X., Z.M. and Y.P.; Data curation, S.O., Z.M. and Y.P.; Writing—original draft, X.L.; Writing—review & editing, G.H., S.O., X.G. and I.M.H.; Supervision, X.G.; Project administration, X.G.; Funding acquisition, X.G. All authors have read and agreed to the published version of the manuscript.
Funding
This work was funded by Interdisciplinary Research Project for Young Teachers of USTB (Fundamental Research Funds for the Central Universities, Grant No. FRF-IDRY-21-016) and Researchers Supporting Project number (RSP2023R389), King Saud University, Riyadh, Saudi Arabia.
Institutional Review Board Statement
Not applicable.
Informed Consent Statement
Not applicable.
Data Availability Statement
Not applicable.
Conflicts of Interest
The authors declare no conflict of interest.
References
- Molano, J.I.R.; Lovelle, J.M.C.; Montenegro, C.E.; Granados, J.J.R.; Crespo, R.G. Metamodel for integration of Internet of Things, Social Networks, the Cloud and Industry 4.0. J. Ambient. Intell. Humaniz. Comput. 2017, 9, 709–723. [Google Scholar] [CrossRef]
- Li, L. China’s manufacturing locus in 2025: With a comparison of “Made-in-China 2025” and “Industry 4.0”. Technol. Forecast. Soc. Change 2018, 135, 66–74. [Google Scholar] [CrossRef]
- Müller, J.M.; Voigt, K.-I. Sustainable Industrial Value Creation in SMEs: A Comparison between Industry 4.0 and Made in China 2025. Int. J. Precis. Eng. Manuf. Green Technol. 2018, 5, 659–670. [Google Scholar] [CrossRef] [Green Version]
- Heikkil, A.M.; Malmén, Y.; Nissil, M.; Kortelainen, H. Challenges in risk management in multi-company industrial parks. Saf. Sci. 2010, 48, 430–435. [Google Scholar] [CrossRef]
- Rosenblatt, M.J. The facilities layout problem: A multi-goal approach. Int. J. Prod. Res. 1979, 17, 323–332. [Google Scholar] [CrossRef]
- Penteado, F.D.; Ciric, A.R. An MINLP approach for safe process plant layout. Ind. Eng. Chem. Res. 1996, 35, 1354–1361. [Google Scholar] [CrossRef]
- Kia, R.; Khaksar-Haghani, F.; Javadian, N.; Tavakkoli-Moghaddam, R. Solving a multi-floor layout design model of a dynamic cellular manufacturing system by an efficient genetic algorithm. J. Manuf. Syst. 2014, 33, 218–232. [Google Scholar] [CrossRef]
- Latifi, S.E.; Mohammadi, E.; Khakzad, N. Process plant layout optimization with uncertainty and considering risk. Comput. Chem. Eng. 2017, 106, 224–242. [Google Scholar] [CrossRef]
- Ingole, S.; Singh, D. Unequal-area, fixed-shape facility layout problems using the firefly algorithm. Eng. Optim. 2017, 49, 1097–1115. [Google Scholar] [CrossRef]
- Xu, X.; Lu, Y.; Vogel-Heuser, B.; Wang, L. Industry 4.0 and Industry 5.0—Inception, conception and perception. J. Manuf. Syst. 2021, 61, 530–535. [Google Scholar] [CrossRef]
- Bénabès, J.; Poirson, E.; Bennis, F. Integrated and interactive method for solving layout optimization problems. Expert Syst. Appl. 2013, 40, 5796–5803. [Google Scholar] [CrossRef]
- Derhami, S.; Smith, J.S.; Gue, K.R. A simulation-based optimization approach to design optimal layouts for block stacking warehouses. Int. J. Prod. Econ. 2020, 223, 107525. [Google Scholar] [CrossRef]
- Altuntas, S.; Selim, H.; Dereli, T. A fuzzy DEMATEL-based solution approach for facility layout problem: A case study. Int. J. Adv. Manuf. Technol. 2014, 73, 749–771. [Google Scholar] [CrossRef]
- Patsiatzis, D.I.; Knight, G.; Papageorgiou, L.G. An MILP Approach to Safe Process Plant Layout. Chem. Eng. Res. Des. 2004, 82, 579–586. [Google Scholar] [CrossRef]
- Xu, Y.; Wang, Z.; Zhu, Q. An Improved Hybrid Genetic Algorithm for Chemical Plant Layout Optimization with Novel Non-overlapping and Toxic Gas Dispersion Constraints. Chin. J. Chem. Eng. 2013, 21, 412–419. [Google Scholar] [CrossRef]
- Medina-Herrera, N.; Jimenez-Gutierrez, A.; Grossmann, I.E. A mathematical programming model for optimal layout considering quantitative risk analysis. Comput. Chem. Eng. 2014, 68, 165–181. [Google Scholar] [CrossRef] [Green Version]
- Wang, R.; Wang, Y.; Gundersen, T.; Wu, Y.; Liu, M. A layout design method for an industrial park based on a novel arrangement algorithm—Consideration of pipe network and multiple hazard sources. Chem. Eng. Sci. 2020, 115929. [Google Scholar] [CrossRef]
- Wu, Y.; Wang, Y. A chemical industry area-wide layout design methodology for piping implementation. Chem. Eng. Res. Des. 2017, 118, 81–93. [Google Scholar] [CrossRef]
- Li, J.; Smith, A.E. Block layout for attraction-based enterprises. Eur. J. Oper. Res. 2018, 266, 1100–1112. [Google Scholar] [CrossRef]
- Yang, C.-L.; Chuang, S.-P.; Hsu, T.-S. A genetic algorithm for dynamic facility planning in job shop manufacturing. Int. J. Adv. Manuf. Technol. 2010, 52, 303–309. [Google Scholar] [CrossRef]
- O’Neill, S.; Wrigley, P.; Bagdasar, O. A mixed-integer linear programming formulation for the modular layout of three-dimensional connected systems. Math. Comput. Simul. 2021, 201, 739–754. [Google Scholar] [CrossRef]
- Ghassemi Tari, F.; Ahadi, K. Cellular layout design using Tabu search, a case study. RAIRO Oper. Res. 2019, 53, 1475–1488. [Google Scholar] [CrossRef]
- Rw, A.; Yan, W.B.; Yw, A.; Xiao, F.B.; Ml, A. An Industrial Park Layout Design Method Considering Pipeline Length Based on FLUTE Algorithm. Comput. Aided Chem. Eng. 2018, 44, 193–198. [Google Scholar]
- Che, A.; Zhang, Y.; Feng, J. Bi-objective optimization for multi-floor facility layout problem with fixed inner configuration and room adjacency constraints. Comput. Ind. Eng. 2017, 105, 265–276. [Google Scholar] [CrossRef]
- Hosseini, S.S.; Azimi, P.; Sharifi, M.; Zandieh, M. A new soft computing algorithm based on cloud theory for dynamic facility layout problem. RAIRO Oper. Res. 2021, 55, S2433–S2453. [Google Scholar] [CrossRef]
- Wang, R.; Zhao, H.; Wu, Y.; Wang, Y.; Feng, X.; Liu, M. An industrial facility layout design method considering energy saving based on surplus rectangle fill algorithm. Energy 2018, 158, 1038–1051. [Google Scholar] [CrossRef]
- Liu, X.; Huang, G.; Gao, X.; Li, H.; Ou, S.; Hezam, I.M. Large-Scale 3D Multi-Story Enterprise Layout Design in a New Type of Industrial Park in China. Appl. Sci. 2022, 12, 8110. [Google Scholar] [CrossRef]
- Caputo, A.C.; Pelagagge, P.M.; Palumbo, M.; Salini, P. Safety-based process plant layout using genetic algorithm. J. Loss Prev. Process Ind. 2015, 34, 139–150. [Google Scholar] [CrossRef]
- Vazquez-Roman, R.; Lee, J.H.; Jung, S.; Mannan, M.S. Optimal facility layout under toxic release in process facilities: A stochastic approach. Comput. Chem. Eng. 2010, 34, 122–133. [Google Scholar] [CrossRef]
- Al-Zubaidi, S.Q.D.; Fantoni, G.; Failli, F. Analysis of drivers for solving facility layout problems: A Literature review. J. Ind. Inf. Integr. 2021, 21, 100187. [Google Scholar] [CrossRef]
- Wang, R.; Wang, Y.; Gundersen, T.; Wu, Y.; Liu, M. A Multi-objective Optimization Method for Industrial Park Layout Design—The Trade-off between Economy and Safety. Chem. Eng. Sci. 2021, 235, 116471. [Google Scholar] [CrossRef]
- Chen, Y.; Jiang, Y.; Wahab, M.I.M.; Long, X. The facility layout problem in non-rectangular logistics parks with split lines. Expert Syst. Appl. 2015, 42, 7768–7780. [Google Scholar] [CrossRef]
- De Lira-Flores, J.A.; López-Molina, A.; Gutiérrez-Antonio, C.; Vázquez-Román, R. Optimal plant layout considering the safety instrumented system design for hazardous equipment. Process Saf. Environ. Prot. 2019, 124, 97–120. [Google Scholar] [CrossRef]
- Brunoro Ahumada, C.; Quddus, N.; Mannan, M. A method for facility layout optimisation including stochastic risk assessment. Process Saf. Environ. Prot. 2018, 117, 616–628. [Google Scholar] [CrossRef]
- Emami, S.; Nookabadi, A.S. Managing a new multi-objective model for the dynamic facility layout problem. Int. J. Adv. Manuf. Technol. 2013, 68, 2215–2228. [Google Scholar] [CrossRef]
- Şahin, R.; Niroomand, S.; Durmaz, E.D.; Molla-Alizadeh-Zavardehi, S. Mathematical formulation and hybrid meta-heuristic solution approaches for dynamic single row facility layout problem. Ann. Oper. Res. 2020, 295, 313–336. [Google Scholar] [CrossRef]
- Tayal, A.; Gunasekaran, A.; Singh, S.P.; Dubey, R.; Papadopoulos, T. Formulating and solving sustainable stochastic dynamic facility layout problem: A key to sustainable operations. Ann. Oper. Res. 2016, 253, 621–655. [Google Scholar] [CrossRef] [Green Version]
- Nabli, H. An overview on the simplex algorithm. Appl. Math. Comput. 2009, 210, 479–489. [Google Scholar] [CrossRef]
- Arnaout, J.-P. Worm optimization for the multiple level warehouse layout problem. Ann. Oper. Res. 2017, 269, 29–51. [Google Scholar] [CrossRef]
- Tuzkaya, G.; Gülsün, B.; Tuzkaya, U.R.; Onut, S.; Bildik, E. A comparative analysis of meta-heuristic approaches for facility layout design problem: A case study for an elevator manufacturer. J. Intell. Manuf. 2011, 24, 357–372. [Google Scholar] [CrossRef]
- Wang, R.; Wu, Y.; Wang, Y.; Feng, X. An industrial area layout design methodology considering piping and safety using genetic algorithm. J. Clean. Prod. 2017, 167, 23–31. [Google Scholar] [CrossRef]
- Alves, D.; Medeiros, J.D.; Araújo, O. Optimal determination of chemical plant layout via minimization of risk to general public using Monte Carlo and Simulated Annealing techniques. J. Loss Prev. Process Ind. 2016, 41, 202–214. [Google Scholar] [CrossRef]
- Guirardello, R.; Swaney, R.E. Optimization of process plant layout with pipe routing. Comput. Chem. Eng. 2005, 30, 99–114. [Google Scholar] [CrossRef]
- Martinez-Gomez, J.; Nápoles-Rivera, F.; Ponce-Ortega, J.M.; Serna-González, M.; El-Halwagi, M.M. Optimization of facility location and reallocation in an industrial plant through a multi-annual framework accounting for economic and safety issues. J. Loss Prev. Process Ind. 2015, 33, 129–139. [Google Scholar] [CrossRef]
- Ejeh, J.O.; Liu, S.; Papageorgiou, L.G. An MILP model for safe multi-floor process plant layout using the domino hazard index. Process Saf. Environ. Prot. 2021, 148, 137–165. [Google Scholar] [CrossRef]
- Wang, X.; Wu, Q. Study on calculation model for safety correlation of enterprise in chemical industrial park. J. Saf. Sci. Technol. 2013, 9, 112–116. [Google Scholar]
- Alileche, N.; Olivier, D.; Estel, L.; Cozzani, V. Analysis of domino effect in the process industry using the event tree method. Saf. Sci. 2017, 97, 10–19. [Google Scholar] [CrossRef]
- Zhang, X.; Chen, G. Modeling and algorithm of domino effect in chemical industrial parks using discrete isolated island method. Saf. Sci. 2011, 49, 463–467. [Google Scholar] [CrossRef]
- Gao, X.; Cao, C. Multi-commodity rebalancing and transportation planning considering traffic congestion and uncertainties in disaster response. Comput. Ind. Eng. 2020, 149, 106782. [Google Scholar] [CrossRef]
- Bérubé, J.-F.; Gendreau, M.; Potvin, J.-Y. An exact ϵ-constraint method for bi-objective combinatorial optimization problems: Application to the Traveling Salesman Problem with Profits. Eur. J. Oper. Res. 2009, 194, 39–50. [Google Scholar] [CrossRef]
Figure 1.
A schematic diagram of the distribution of enterprises in the new industrial park.
Figure 1.
A schematic diagram of the distribution of enterprises in the new industrial park.
Figure 2.
An illustrative example of the enterprise location safety risk.
Figure 2.
An illustrative example of the enterprise location safety risk.
Figure 3.
The enterprise association safety risk.
Figure 3.
The enterprise association safety risk.
Figure 4.
The Pareto frontier of case problems.
Figure 4.
The Pareto frontier of case problems.
Figure 5.
The specific enterprise layout result obtained from the three models.
Figure 5.
The specific enterprise layout result obtained from the three models.
Figure 6.
Variations of the Pareto frontiers with different floors.
Figure 6.
Variations of the Pareto frontiers with different floors.
Figure 7.
The Pareto frontier with a different number of buildings.
Figure 7.
The Pareto frontier with a different number of buildings.
Figure 8.
Variations of the Pareto frontiers with different building numbers.
Figure 8.
Variations of the Pareto frontiers with different building numbers.
Figure 9.
The Pareto frontier with a different number of enterprises.
Figure 9.
The Pareto frontier with a different number of enterprises.
Figure 10.
Variations of the Pareto frontiers with a different number of enterprises.
Figure 10.
Variations of the Pareto frontiers with a different number of enterprises.
Figure 11.
The enterprise layout obtained from Model 1 (the location safety risk was changed).
Figure 11.
The enterprise layout obtained from Model 1 (the location safety risk was changed).
Figure 12.
The enterprise layout obtained from Model 3 (the location safety risk was changed).
Figure 12.
The enterprise layout obtained from Model 3 (the location safety risk was changed).
Figure 13.
The enterprise layout obtained from Model 2 (the association safety risk was changed).
Figure 13.
The enterprise layout obtained from Model 2 (the association safety risk was changed).
Figure 14.
The enterprise layout obtained from Model 3 (the association safety risk was changed).
Figure 14.
The enterprise layout obtained from Model 3 (the association safety risk was changed).
Table 1.
A summary of the literature pertaining to the layout optimization problem.
Table 1.
A summary of the literature pertaining to the layout optimization problem.
| Article | Main Problem | Layout Principle | Risk | Multistory Layout | Model | Approach |
|---|
| Patsiatzis et al. [14] | Facility layout | Cost | Yes | No | MILP | Exact |
| Guirardello and Swaney [43] | Process plant layout | Pipe cost | No | Yes | MILP | Exact |
| Xu et al. [15] | Facility layout | Minimum distance and security factor | Yes | No | MINLP | Heuristic |
| Medina-Herrera et al. [16] | Facility layout | Cost | Yes | Yes | MINLP | Exact |
| Martinez-Gomez et al. [44] | Facility layout | Cost; fatalities | Yes | No | MILP | Exact |
| Wu and Wang [18] | Chemical industry area layout | Cost | No | No | MILP | Heuristic |
| Wang et al. [41] | Industrial area layout | Pipe cost and risk cost | Yes | No | MINLP | Heuristic |
| Latifi et al. [8] | Facility layout | Cost and risk of various accidents | Yes | Yes | MINLP | Heuristic |
| Li and Smith [19] | Facility layout | Attraction distribution, entity shape, and adjacency requirements | No | No | INLP | Heuristic |
| de Lira-Flores et al. [33] | Facility layout | Cost | Yes | No | MINLP | Exact |
| Wang et al. [17] | Industrial park layout | Cost | Yes | No | MILP | Heuristic |
| Wang et al. [31] | Industrial park layout | Cost and expected annual fatalities | Yes | No | MILP | Heuristic |
| Ejeh et al. [45] | Facility layout | Cost | Yes | Yes | MILP | Exact |
| O’Neill et al. [21] | Facility layout | Cost | No | Yes | MILP | Heuristic |
| This study | Industrial park layout | Risk; rental profit | Yes | Yes | MILP and MINLP | Exact |
Table 2.
A relational table of decision variables.
Table 2.
A relational table of decision variables.
| Type ID | | | |
|---|
| 1 | 1 | 1 | 1 |
| 2 | 0 | 1 | 0 |
| 3 | 1 | 0 | 0 |
| 4 | 0 | 0 | 0 |
Table 3.
The basic building information of the park.
Table 3.
The basic building information of the park.
| Building ID | Number of Floors | Floor Area () |
|---|
| 1 | 6 | 2332 |
| 2 | 6 | 3475 |
| 3 | 6 | 8211 |
| 4 | 6 | 2180 |
Table 4.
The optimal Pareto solutions of Model 1 with different floors (partial).
Table 4.
The optimal Pareto solutions of Model 1 with different floors (partial).
| ID | S = 5 | S = 6 | S = 7 | S = 8 |
|---|
| Risk | Profit (CNY) | Risk | Profit (CNY) | Risk | Profit (CNY) | Risk | Profit (CNY) |
|---|
| 1 (Minimum risk value) | 194 | 1,544,125 | 194 | 1,528,408 | 194 | 1,522,828 | 194 | 1,464,778 |
| 2 | 292 | 1,568,835 | 293 | 1,562,117 | 293 | 1,551,803 | 293 | 1,541,751 |
| 3 | 390 | 1,583,164 | 391 | 1,576,049 | 372 | 1,565,825 | 391 | 1,557,093 |
| 4 | 409 | 1,586,014 | 489 | 1,580,855 | 479 | 1,576,239 | 490 | 1,569,655 |
| 5 | 468 | 1,587,687 | 587 | 1,587,687 | 568 | 1,582,128 | 588 | 1,579,012 |
| 6 (Maximum rental profit) | 517 | 1,588,165 | 656 | 1,588,165 | 794 | 1,588,165 | 784 | 1,588,165 |
Table 5.
The optimal Pareto solutions of Model 2 with different floors (partial).
Table 5.
The optimal Pareto solutions of Model 2 with different floors (partial).
| ID | S = 5 | S = 6 | S = 7 | S = 8 |
|---|
| Risk | Profit (CNY) | Risk | Profit (CNY) | Risk | Profit (CNY) | Risk | Profit (CNY) |
|---|
| 1 (Minimum risk value) | 1031 | 1,575,281 | 1031 | 1,575,281 | 1031 | 1,575,281 | 1031 | 1,575,281 |
| 2 | 1109 | 1,580,877 | 1109 | 1,580,877 | 1109 | 1,580,877 | 1109 | 1,580,877 |
| 3 | 1167 | 1,582,247 | 1227 | 1,583,342 | 1227 | 1,583,342 | 1227 | 1,583,342 |
| 4 | 1227 | 1,583,342 | 1285 | 1,586,014 | 1294 | 1,586,014 | 1325 | 1,586,014 |
| 5 | 1394 | 1,586,492 | 1394 | 1,586,492 | 1403 | 1,586,492 | 1403 | 1,586,492 |
| 6 | 1457 | 1,587,687 | 1490 | 1,587,687 | 1479 | 1,587,687 | 1530 | 1,587,687 |
| 7 (Maximum rental profit) | 1597 | 1,588,165 | 1610 | 1,588,165 | 1597 | 1,588,165 | 1597 | 1,588,165 |
Table 6.
The optimal Pareto solutions of Model 3 with different floors (partial).
Table 6.
The optimal Pareto solutions of Model 3 with different floors (partial).
| ID | S = 5 | S = 6 | S = 7 | S = 8 |
|---|
| Risk | Profit (CNY) | Risk | Profit (CNY) | Risk | Profit (CNY) | Risk | Profit (CNY) |
|---|
| 1 (Minimum risk value) | 1225 | 1,541,803 | 1225 | 1,528,408 | 1225 | 1,508,928 | 1225 | 1,464,778 |
| 2 | 1274 | 1,557,225 | 1304 | 1,559,795 | 1324 | 1,551,803 | 1324 | 1,541,751 |
| 3 | 1323 | 1,566,477 | 1419 | 1,569,083 | 1412 | 1,562,591 | 1421 | 1,555,452 |
| 4 | 1371 | 1,571,763 | 1500 | 1,573,889 | 1510 | 1,569,273 | 1519 | 1,564,266 |
| 5 | 1400 | 1,573,801 | 1613 | 1,579,097 | 1618 | 1,573,801 | 1617 | 1,571,121 |
| 6 | 1518 | 1,580,209 | 1723 | 1,582,864 | 1715 | 1,580,209 | 1716 | 1,575,947 |
| 7 | 1619 | 1,582,864 | 1772 | 1,586,014 | 1793 | 1,582,247 | 1812 | 1,581,406 |
| 8 | 1861 | 1,586,492 | 2010 | 1,586,492 | 1922 | 1,586,014 | 2108 | 1,586,492 |
| 9 | 1915 | 1,587,687 | 2044 | 1,587,687 | 2069 | 1,586,492 | 2211 | 1,587,687 |
| 10 (Maximum rental profit) | 2104 | 1,588,165 | 2266 | 1,588,165 | 2312 | 1,588,165 | 2424 | 1,588,165 |
Table 7.
The comparison of the CPU times of different problem sizes.
Table 7.
The comparison of the CPU times of different problem sizes.
| ID | Problem Size | Model 1 | Model 2 | Model 3 |
|---|
| B | S | I | | | CPU Time | | | CPU time | | | CPU Time |
|---|
| 1 | 4 | 5 | 18 | 192 | 1,357,747 | 0.08 s | 661 | 1,389,700 | 5.64 s | 853 | 1,357,747 | 2.85 s |
| 2 | 4 | 5 | 20 | 194 | 1,544,125 | 0.08 s | 1031 | 1,575,281 | 2.38 s | 1225 | 1,541,803 | 2.33 s |
| 3 | 4 | 5 | 22 | 225 | 1,577,613 | 0.08 s | 1385 | 1,608,769 | 24.12 s | 1610 | 1,575,291 | 24.33 s |
| 4 | 4 | 5 | 24 | 285 | 1,633,922 | 0.08 s | 1854 | 1,671,235 | 180.3 s | 2139 | 1,628,990 | 71.44 s |
| 5 | 4 | 5 | 26 | 316 | 1,684,032 | 0.08 s | 2297 | 1,726,463 | 1196.44 s | 2613 | 1,684,032 | 1416.24 s |
| 6 | 4 | 5 | 28 | 318 | 1,720,768 | 0.09 s | 2726 | 1,763,537 | 2601.26 s | 3044 | / | >1 h |
| Disclaimer/Publisher’s Note: The statements, opinions and data contained in all publications are solely those of the individual author(s) and contributor(s) and not of MDPI and/or the editor(s). MDPI and/or the editor(s) disclaim responsibility for any injury to people or property resulting from any ideas, methods, instructions or products referred to in the content. |
© 2023 by the authors. Licensee MDPI, Basel, Switzerland. This article is an open access article distributed under the terms and conditions of the Creative Commons Attribution (CC BY) license (https://creativecommons.org/licenses/by/4.0/).


 ,
, 


