

A Bibliometric Analysis and Visualization of Aviation Carbon Emissions Studies
1
School of Civil Aviation, Zhengzhou University of Aeronautics, Zhengzhou 450015, China
2
Faculty of Engineering, Universiti Putra Malaysia, Serdang 43400, Malaysia
3
Gas Company, China Petrochemical Corporation, Beijing 100728, China
4
College of Chemical Engineering, Fuzhou University, Fuzhou 350180, China
*
Author to whom correspondence should be addressed.
Sustainability 2023, 15(5), 4644; https://doi.org/10.3390/su15054644
Submission received: 25 December 2022
/
Revised: 5 February 2023
/
Accepted: 24 February 2023
/
Published: 6 March 2023
(This article belongs to the Special Issue Technologies and Innovations for Sustainable Storage and Transportation of Oil and Gas)
Abstract
:Carbon peaking and carbon neutrality are gaining global consensus, and carbon reduction in aviation is necessary and urgent. The main objective of this research paper is to map and analyze the knowledge graph of aviation carbon emissions research from a bibliometric perspective. Publications related to aviation carbon emissions indexed by Scopus for the period 1992 to 2021 were analyzed primarily using CiteSpace software. This paper presents a bibliometric analysis of current research progress from four perspectives: (1) descriptive analysis of publications, involving annual distribution, authors, and journals; (2) analysis of co-cited authors and their countries; (3) co-citation analysis of cited references; and (4) co-occurrence analysis of keywords. A series of domain knowledge maps were constructed to visualize the core of aviation carbon emissions research and to distill the research perspectives on aviation carbon emissions in the past 20 years. The latest and most important research results in the field obtained through the combing provide certain references for the research and development of aviation carbon emissions.
1. Introduction
Carbon peaking and carbon neutrality are gaining global consensus, with macro and industry policies and technological innovations for carbon reductions in many countries in full swing. Air transport is currently the fastest, most accessible, and most time-efficient mode of transport in the human economy, and plays an irreplaceable role in enabling international trade and economic development. According to carbon emissions data provided by Emission Database for Global Atmospheric Research (EDGAR), international aviation will account for approximately 1% of total global emissions in 2020. The IEA states that between 2013 and 2019, prior to the COVID-19 epidemic, global carbon emissions from air transport already exceeded 70% of the ICAO’s projected values [1]. By 2050, aviation will be responsible for 25% of global carbon emissions if current trends continue. There is an exceptional need and urgency for carbon reduction in the aviation sector.
Currently, governments, NGOs, and airline companies are actively promoting the implementation of aviation carbon reduction measures. For instance, the historic Carbon Offsetting and Reduction Scheme for International Aviation (CORSIA) was adopted by the 39th Assembly of the International Civil Aviation Organization (ICAO) in October 2016, creating the first global industry market mechanism for lowering emissions. According to the CORSIA plan, the global aviation sector must gradually meet the following goals by 2050 [2]: (1). CO2 emissions in 2035 should not exceed 2020 emission levels, i.e., carbon peaking; (2). In 2050, CO2 emissions should be at or below 50% of 2005 levels. The ultimate objective is to stabilize net global aviation carbon emissions at 2019 levels and to achieve carbon-neutral growth (580 million tons of carbon). The first sector in the world to adopt national government-approved global carbon-neutral growth measures is aviation. Even with the huge impact of the Newcastle pneumonia epidemic and the serious financial difficulties faced by the aviation industry, global airlines still need to keep in mind the reduction targets to which they originally committed.
For the international aviation industry, its own huge volume, irreplaceability, and the cross-border, cross-policy operations it encompasses make the twin carbon issues it entails even more complex and multilateral. Scholars have continued to track this area and have been presenting their latest research findings from time to time. Current research focuses on the carbon reduction targets and policy environment set by the global aviation industry, the possible and likely carbon reduction measures in the air transport sector (operational, taxation, trading and cooperation, etc.), the design leaps being made and likely to be made by aircraft themselves to achieve carbon reduction targets (airframe structural optimization, electric and hydrogen energy, etc.), and the multilateral policy responses to carbon in the global air transport industry. Scholarly thinking on this topic continues to intensify. Since 1970, Scopus has included over 2000 papers related to aviation carbon emissions, with the number gradually increasing from 1 in 1970 to 251 in 2021.
Initially, scholars have focused on the impact of the EU-Emission Trading Scheme (EU-ETS) on aviation. Firstly, Domingos, N. (2012) assessed three arguments against aviation’s unilateral inclusion in the EU-ETS and concluded that international aviation needs to take into account economic impacts, legality, and political considerations to address climate change [3]. Scheelhaase (2012) analyzed the impact of the EU-ETS on airlines using an empirical model-based projection approach, showing that airlines’ operating costs, fares, and competitiveness would be significantly and adversely affected, noting that airlines are expected to purchase more than 50% of their quotas by 2020 [4]. Gongalves, V.K. (2013) further analyzed the EU-ETS’ inclusion of aviation in the decree from the perspective of legal disputes and political implications, concluding that the EUETS’ unilateral inclusion of global EU-ETS is unilaterally incorporated into the global aviation legislation, which is unreasonable, and points out that the issue of international aviation emissions is a global issue that should be based on global legitimacy and requires the concerted efforts of countries around the world to address climate change using market-based emission re-duction mechanisms [5].
In a study of ICAO’s carbon reduction measures, Abeyratne, R. argues that a package of measures by ICAO, including assistance to developing countries, measures for international aviation based on the market, and the use of alternative fuels, would have a significant impact on aviation emissions reductions. Gill, M. (2016) argues that the ICAO’s proposed global carbon offsetting scheme is simpler than the other two [6,7]. Petsonk, A. (2016) argues that addressing differences in the allocation of carbon offset responsibilities across countries is key to a global carbon reduction scheme based on market-based measures, suggesting that 100% of industry growth should be used as a weighting to open a responsibility allocation The scheme would then be moderately adjusted to encourage national air carriers to invest in industry-wide emission reduction projects and achieve actual emission reductions [8].
As the literature on aircraft carbon emissions has expanded, a structured dataset encompassing a range of data such as titles, years of publication, authors, journals, keywords, and references has emerged. When faced with a volume of data that grows geometrically each year, traditional manual collection and analysis become increasingly inefficient. Thanks to Bibliometric and Visual Analysis, a quantitative evaluation of this material and its links can determine the structure of knowledge on any research topic [9]. Several empirical statistical laws serve as the foundation of bibliometrics. Examples include Law of Bradford, which determines the distribution of papers in journals in a given discipline, Lotka’s Law, which characterizes the distribution of authors in scientific and technical literature, Zipf’s Law, which characterizes the distribution of word frequencies in the literature, and others. With the advent of knowledge mapping technology, citation analysis methods and techniques based on the above laws have been continuously updated in recent years, and research on knowledge mapping across multiple disciplines has progressed rapidly. The bibliometric analysis increases the objectivity and scientific rigor of the literature review process, improves the accuracy of the application of scientific publications, and can avoid or diminish the subjective preference of researchers for publications [10].
A series of bibliometric analyses have been carried out in the fields of transportation and urban sustainability, but all of them have limitations. For example, Xu Tian conducted h-index, PageRank, and cluster analysis on literature related to the field of transportation carbon emissions between 1997 and 2016, including the contribution of countries, authors, institutions, and journals, as well as the performance of citations and keywords [11]. They provided a systematic approach to finding key areas for future research by analyzing keywords and trends, which provided an idea for later developers. However, since this approach has not been further integrated into software and has not been applied on a large scale, the validity of the method needs to be further tested. Subsequent researchers have used this idea to develop a variety of bibliometric software. Large-scale applications by researchers in various fields have led to continuous updates and upgrades of this software, and quantitative analysis has become increasingly effective. In 2022, Abdulaziz Almulhim used the VOSviewer for bibliometric analysis and knowledge mapping [12]. Vosviewer’s clustering ranges by color and does not extract key information. Moreover, it can only perform threshold adjustments and cannot perform data de-duplication and time slicing. CiteSpace is a good solution to these problems, so more and more scholars prefer to use CiteSpace. Given this situation, Liliana Barbu carried out an analysis of CiteSpace to offer an actual bibliometric analysis of optimal taxation in 2022 [13].
Over the years, there has been a growing research interest among scholars to explore the issue of carbon emissions. Despite all this research, to date, there is no study that identifies the knowledge structure and research trends in the field of aviation carbon emissions. The goal of this work is to conduct a rigorous bibliometric survey of the globally published literature on aircraft carbon emissions in order to track its evolution and trends. The rapid development of global scientific research on aviation carbon emissions necessitates the regular presentation of trends in the evolution of scientific results in this field. At the same time, with the spread of information technology and web applications, the visualization of scientific knowledge by mapping scientific knowledge on literature data information allows us to conduct research on theories and paradigms, the evolution of disciplinary fields, and the identification of disciplinary structures. Specifically, this study focuses on the following areas.
Question 1: What is the volume and distribution of research outputs on aircraft carbon emissions?
Question 2: What are the trends of collaboration in aviation carbon emissions research between renowned authors and countries?
Question 3: Which studies, authors, and journals have had the most effect in the field of aviation carbon emissions research, and what connections do they have?
Question 4: What are the most appealing study subjects in the field of aircraft carbon emissions, and how have these themes evolved?
To address these questions, this paper uses a scientometric analysis and knowledge mapping approach, using Scopus as the database. CiteSpace software was used to statistically and visually analyze the research literature related to the field of aviation carbon emissions, with the aim of understanding research progress, grasping hot topics, analyzing cutting-edge trends and predicting future development directions, and providing a reference for relevant research in the field of aviation carbon emissions. This work is not a comprehensive evaluation of the literature, but rather a knowledge map of aircraft carbon emissions to give direction and assistance to scholars interested in aviation carbon emissions. On the one hand, this Bibliometric and Visual Analysis of aviation carbon emissions research will assist new researchers in locating the most significant subjects, nations, journals, authors, and publications in the area. On the other hand, it helps governments and institutions with carbon reduction policy decisions and the development of carbon reduction measures.
The paper is organized as follows after this introduction: Section 2 describes the research methodology, data sources, and analytic procedure. Next, in Section 3, the results of the evidence-seeking research are presented and analyzed using graphs and tables, including descriptive analysis, co-authorship analysis, and co-citation analysis. The key conclusions, contributions, and future research directions are discussed in Section 4, along with the study’s limitations.
2. Methods and Data
2.1. Analysis Technology
Since the 1990s, the application of information visualization techniques in the analysis of citation networks has led to a new phase in the development of knowledge mapping. Professor Chen of Drexel University began researching the principles of applications and algorithms that could visualize information in the knowledge domain. He created the CiteSpace family of applications for generating knowledge maps, ushering in a new era of information visualization techniques ideally suited to the study of multivariate, time-sharing, dynamic, and complex citation networks. In 2003, he introduced the theory of scientific maps and simple and effective methods for their production [14]. In 2004, Professor Chen published Information Visualization: beyond the horizon, a book. He proposed that information visualization can be used not only to display complex and underlying information structures but also to analyze human cognitive, social, and cooperative activities, and so on [15].
In recent years, research on the generation of disciplinary knowledge maps using literary information as the object of study has progressed rapidly due to advances in citation analysis methods and techniques worldwide and the emergence of visual knowledge maps. The research field is also expanding to management, information system science, library science, security science, medicine, education, etc. In 2018, Liang used CiteSpace to visualize medical literacy, revealing the research strength, knowledge base, and hotspots of medical literacy [16]. In 2020, Jing used CiteSpace visual analysis software and statistical analysis methods for the 2019 clustering analysis related to aviation safety topics in China [17]. Using CiteSpace, Yang conducted a bibliometric analysis of research hotspots and evolutionary trends in general aviation development based on the Web of Science database and CNKI database [18]. On Cold Chain, Shao counted the number of published papers, literature collaboration networks, and literature co-occurrence networks [19]. In 2021, Sk Sofilk analyzed bibliographic co-occurrence terms, map themes, and co-citation analysis of journals, keywords, and institutions through ScientoPY and VOSviewer [20].
The research route and methodological design of this research follow the following flow. The first step was to identify the research questions on the topic of aviation carbon emissions, which was carried out in the introduction section of the paper. Then, we used descriptive analysis to investigate the number of publications, the most influential authors, and journals. Finally, we carried out a graphical network analysis from three different perspectives. First, using Co-Authorship Analysis, we mapped the network of co-authors in our field, both at the level of authors and their countries in order to reveal the social structure. Second, using Co-citation Analysis, we used literature and journals as the unit of analysis to reveal the knowledge framework in the field of aviation carbon emissions. Through co-citation analysis, the network can be clustered into recurring themes or conceptual hotspots. Third, co-occurrence analysis was also performed, as it allows identifying the conceptual structure and research themes of the research area. Nodes and links are included in the network generated by the software. The size of the nodes is related to the number of publications, while the links between the nodes reflect their relationships and are proportional to the strength of the connections. Combining the graphical network with bibliometric analysis allows visualization of the structure and correlations. Key information such as important journals and publications and the relationships between them are used to map key topic areas for future research by inference.
2.2. Data Sources
Google Scholar, Web of Science, ProQuest, Scopus, ScienceDirect, and numerous additional databases are well-recognized by researchers in a variety of scientific disciplines. Scopus is the largest abstract and citation database of peer-reviewed literature—scientific journals, books, and conference proceedings. It is a useful research tool for academics to track progress and planning in their disciplines. The world’s major university ranking bodies, including the Times Higher Education Supplement (THE) and Quacquarelli Symonds (QS), use Scopus database data for subject output and subject development assessments.
The data for this study was gathered from the Scopus database using an advanced search and searching inside article titles, abstracts, and key terms. The Boolean operator “AND” was used to retrieve data containing all keywords.” OR” retrieves data containing at least one keyword and is used to retrieve synonyms or different expressions of a word. The search method was (TITLE-ABS-KEY (“aerospace” OR “aviation”) AND TITLE-ABS-KEY (carbon) AND TITLE-ABS-KEY (“emission” OR “footprint”)); Date range = (PUBYEAR > 1991 AND PUBYEAR < 2022); A total of 2076 documents were retrieved, with an operation date of 1 June 2022. After screening, comparison, and de-duplication, 1621 bibliographies were finally obtained. It should be noted that this paper uses the built-in “Remove Duplicates” function of CiteSpace, which can filter and clean up the imported extracted literature records. Each bibliography included information such as abstract, keywords, author, institution, publication, volume number, and reference, and all the above information is in English.
2.3. Analysis Process
Compared with other visualization applications, CiteSpace integrates methods such as cluster analysis, social network analysis, and multi-dimensional scaling analysis to focus on detecting and analyzing the evolutionary trends of disciplinary research fronts, the relationship between research fronts and their knowledge bases, and the internal connections between different research fronts. This paper takes civil aviation security-related literature data as the research object, uses CiteSpace as the main tool to conduct bibliometric analysis, conducts corresponding data mining and quantitative analysis on cited and referenced literature, extracts the knowledge base in the field of civil aviation security, grasps the latest progress, frontier hotspots, evolutionary paths and future trends of civil aviation security research, and provides a basis for relevant research.
In this study, a new version of CiteSpace (version number: 6.1R2) based on the JAVA platform is used to map scientific knowledge. The use process includes three steps: parameter setting, map customization, and map analysis.
- (1)
- Parameter setting
- (a)
- Time split: The time span specifies the range of years in which the citations were published, and its value is determined by the distribution of citation years and the period of interest to the analyst. The length of the time partition is determined by dividing the entire time span into a number of years. It is recommended that equal time partitions are used, with independent filtering by threshold within the time partition.
- (b)
- Text processing: Terminology sources are derived from four subject domains: title, abstract, author keywords, and keyword+, where keyword+ is a keyword supplemented by Thomson Reuters based on the title of the reference and not listed by the author or publisher. Subject terms are classified as noun phrases and burst words. CiteSpace automatically extracts specific and explicit keywords as cluster tags to reflect research hotspots, and further extracts burst words from the cluster tags to reflect research frontier trends.
- (c)
- Node type: According to different analysis topics, corresponding node objects, such as authors and cited references, are selected for analysis. Please refer to other analysis topics in this paper for more information on node selection. The setting of the node type determines the type of object represented by the node in the diagram.
- (d)
- Selection criteria: CiteSpace controls the number of network nodes in a single time zone based on a threshold value, and citations that meet the threshold criteria are visualized. There are seven setting methods, such as g-index, Top N, Top N%, Threshold Interpolation, and Citation. Selection Citers first filter citations based on the TC field values in the citation records, and then set variable parameters as thresholds to filter references based on the selection method. For determining reasonable thresholds, iterations and comparisons can be made based on the number of citations, nodes, and connections selected in the Spatial Status and Process Reports data processing report in the lower left corner of the CiteSpace software interface.
- (e)
- Pruning: CiteSpace supports pathfinder and minimum spanning tree algorithms to control the number of connections in the network in order to reduce the density of connections and reduce crossover points. Note that increasing the clarity of the network does not change the number of nodes. The pathfinder algorithm keeps only the most important connections based on the triangle inequality. The principle of pruning the slicing network and pruning the merging network is to find and retain the earliest connections.
- (2)
- Knowledge graph customization
Knowledge graph customization includes parameters such as layout optimization, cluster generation, layout switching, and object visual properties. Layout optimization implements the reconstruction of the graph. When generating clusters, the clusters are first found and then cluster labels are added. There are three types of cluster-labeled topic word extraction algorithms: LSI, LLR, and mi. LSI effectively filters common words and retains important words, emphasizing the mainstream of the study; LLR determines the most likely words based on a probability density function, emphasizing the characteristics of the study; mi measures the correlation of two random events to find clear, appropriate words. Clustering results and word extraction results are measured and evaluated by the ModularityQ index and the Silhouette index. ModularityQ ranges between 0 and 1. The closer to 1, the more significant the clustering of the graph and the closer the nodes in the clusters. Mean Silhouette has a value page between 0 and 1. The closer to 1, the stronger the thematic relevance of the nodes in the clusters. The clustering view is used for the research knowledge base and critical literature analysis. In particular, Timeline emphasizes the temporal model between the research frontier and its knowledge base and is used to reveal the evolutionary process and branching connections of the research field; Timezone restricts the nodes to the vertical position of the time zone in which they are located, revealing the duality of the temporal variables between the research frontier and the knowledge base. Attributes such as the shape, size, and color of nodes and clusters can be set via the display menu, which can be adjusted to output a more concise map.
- (3)
- Knowledge mapping analysis
The main content of knowledge graph analysis is to clarify the meaning of the graph and the objects to be analyzed. The objects represented by the nodes in the diagram depend on the setting of the node type. The number of references in the relevant time zone determines the thickness of the node’s year ring. The year of the citation is indicated by the color of the year ring, which extends outwards from the center of the node in chronological order from far to near. While the size of the node label text is proportionate to the number of citations, the size of the node is connected to the number of citations. Larger nodes imply more citations throughout the time period. The co-citation link between two nodes is represented by a line connecting the two nodes, with the color of the line representing the moment when the two nodes were first co-cited. The strength of the link between the two nodes is related to the length and width of the connecting line, which is proportional to their corresponding co-citation time. Both the length and width of the connection line are proportional to the number of co-references.
3. Results
3.1. Descriptive Analysis
3.1.1. An Examination of the Annual Publication Distribution
Examining the distribution of publications across time is one of the first scientometric analytic techniques. A helpful indicator of the growth and evolution of a subject is the volume of publications each year on a certain research topic, which may indicate the level of conceptual development and interest in the area [21].
As shown in Figure 1, the annual distribution of publications indicates that there are three broad phases of global research on aviation carbon emissions. The period 1992–2003 belongs to the first phase when the civil aviation industry began to recognize the issue of carbon emissions and was part of a period of accumulating interest; the period 2004–2016 belongs to a slow development phase, during which there were some shocks in the number of publications as a result of the global economic crisis of 2008 and 2015 but still growing; and the period 2017–2021 belongs to a rapid development phase. After the ICAO conference in 2016, 2017 rapidly returns to the peak of the previous research phase, after which the research momentum shows rapid growth. The annual volume of literature on aviation carbon emissions research has increased from 2 publications in 1992 to 251 in 2021, with an overall wave-like upward trend. The increasing number of publications and citations indicates that aviation carbon emissions research remains a global research hotspot. It is noteworthy that the research momentum continues to increase at an accelerated pace, with output papers reaching new highs in 2021, despite the global epidemic that has hit the civil aviation industry in recent years.
3.1.2. Analysis of Authors
The number of articles published by a research scholar can be somewhat reflective of his or her scholarly contribution to the field. A total of 219 different scholars were identified in our search survey. Table 1 shows the top ten contributing authors, who together published 131 articles, accounting for 8% of all publications. The most influential author in the study of carbon emissions from aviation is Gössling S. from Lund University, who works on sustainable development in tourism and transport and has published 17 relevant papers with an h-index of 84. Lee, D.S. from Manchester Metropolitan University, who is Lee, D.S., from Manchester Metropolitan University, is an expert in the field of the climate impact of aviation and has published a total of 15 papers in this field. He and Lim, L.L. are also co-authors of several articles. Similarly, among the top ten contributing authors, Sausen, R. and Grewe, V. are also co-authors of several articles, and the study of co-authorship will be analyzed in the next sub-section. It is noteworthy that the number of publications is much higher than the number of authors who have published articles, with 94.3% of authors having published more than four articles. This indicates a high concentration of research in the field.
3.1.3. Analysis of Journals
Research frontiers in a variety of subfields are identified through the analysis of published journals, and researchers are given a guide to the best journals for publishing pertinent research findings. According to the statistics, publications on the issue of aviation carbon emissions were published in 159 different journals or conferences. Table 2 shows the top 10 most productive journals (excluding conferences and proceedings), which together published 286 articles, representing 18% of all publications. The top-ranked journal is Transportation Research Part D Transport and Environment, which dominates the ranking with 46 articles published. Among the top 10 journals, Critical Reviews in Environmental Science and Technology for ENERGY & FUELS Science, Applied Energy for ENERGY & FUELS Science, and Journal of Cleaner Production for GREEN & SUSTAINABLE SCIENCE & TECHNOLOGY have the highest impact factors. It is worth noting that Sustainability, an important journal in the field of sustainability, also contributes more literature on carbon emissions from aviation, coming in at number seven.
3.2. Co-Authorship Analysis
A network analysis technique called co-authorship analysis is used to examine and evaluate patterns of scientific collaboration. A common definition of scientific cooperation is the interaction of two or more scientists within a social context that encourages the exchange of research and the cooperative completion of a specific job [22]. In this section, we will use the CiteSpace knowledge graph visualization and analysis feature to find key collaborating scholars and their countries in the research field. It is important to note that this paper does not do an analysis of collaborating scholars’ research institutions, as there is little correlation between institutions, and a complete network is not formed.
3.2.1. Co-Authorship Network
The Author Collaboration Network identifies authors with outstanding scholarly output and reveals collaborative relationships between authors. Each node in the network represents an author, and the size of the typeface corresponds to the author’s number of publications. Each link between a pair of nodes symbolizes a scientific partnership created via a co-authorship connection. The degree of collaboration between the two writers is indicated by the thickness of the link line. The degree of collaboration increases with the thickness of the link. As the network diagram initially generated for this study was unable to highlight the primary structure, cropped slices were chosen to remove minor links.
The network’s density for collaborative ties was nearly negligible (0.0016), indicating that author group collaboration was minimal. Gössling, S. and Gutiérrez-Antonio, C. are the top two co-authors, with 11 papers each as co-authors. Sethi, V. and Barrett, S.R.H. followed with 10 co-authored papers each. The top ten most co-authored publications also included Liu Y. (8), Cui Q. (8), Sausen, R. (7), Wang J. (7), NG HK. (7), Lee, D.S. (7), GÓMEZCASTRO, FI (7), and BARRETT SRH (7). Eighty-eight scholars are co-authors of at least three papers and over 600 scholars have one or two co-authored research publications.
Within the collaborative network, a number of collaborative teams in this research area can be illustrated by a number of closed graphs, as shown in Figure 2. For example, the research team led by Gutiérrez-Antonio, C., and including GÓMEZCASTRO, FI., HERNÁNDEZ, S., and others, focuses on renewable aviation fuel production technologies. The duration of the research outbreak is 2016–2021 [23,24,25,26,27,28,29,30,31,32,33].
3.2.2. Network of Co-Authors’ Countries
The network of co-authors’ countries can reflect the influential countries in this field and show the level of communication between countries as the globalization process deepens. The distribution of national power in international aviation carbon emission research is mainly reflected in the contribution and cooperation of different countries in this field. Figure 3 shows the distribution of major national powers in aviation carbon emissions research. From the figure, we can see that the United States, the United Kingdom, China, Germany, Canada, and Australia are the more active countries. The research results of these countries jointly promote the development of aviation carbon emission theory and practice. The research in China, Germany, and Canada is relatively independent and has not yet formed a synergy with other countries. After the statistics of the proportion of collaborative papers, the United States (20%), the United Kingdom (12%), and China (10%), as the world’s major economies and aviation powers, are particularly concerned about aviation carbon emissions and have the most research results in recent years, far ahead of other countries. Meanwhile, scholars from Germany (6%), Canada (3%), Australia (2%), India (2%), Norway (2%), Japan (2%), and Italy (2%) also pay more attention to aviation carbon emission issues.
3.3. Co-Citation Analysis
Citation analysis examines the phenomena of citation and cited sources, including scientific journals, articles, and authors. Citation analysis gives scientific management a quantitative foundation, analyzes the nature of research, rates and chooses journals, looks at the scientific output and the impact of scientists on society, etc.
3.3.1. Analysis of Cited References
The citation literature study helps us to target important references in the research area by analyzing the most cited papers and to understand the evolution of scholars’ research in the field. We built a co-citation database and a co-citation network consisting of 1029 nodes and 959 connections with a density of 0.0018, which is near zero, based on the visual analysis findings obtained by pruning the Minimum Spanning Tree/Pruning sliced networks. Figure 4 shows this. The key articles on the subject of aircraft carbon emissions, according to co-citation analysis, are Lee D.S. (2010), Moore, RH. (2017), Peeters, P. (2016), and Stples, MD. (2018). These papers are the most influential in the field of aviation carbon emissions.
For the aforementioned studies, Lee, DS. (2010) categorized aviation emissions along with future emission trends and scenarios and examined the impact on atmospheric composition, including the troposphere and stratosphere, as well as changes in radiative forcing, mean surface temperature, UV flux, clouds, and climate. He also provided mitigation options. Finally, he prospectively suggested the carbon-neutral implications of hydrogen as an alternative energy source [41]. Moore, RH. (2017) collected traditional aviation fuel combustion and hybrid biofuel combustion exhaust. The results showed that blended biofuels resulted in a 50% to 70% reduction in the number and mass of particles emitted from the rear of the aircraft [42]. Peeters, P. (2016) traced and analyzed a series of solutions proposed by the industry to address the growth of aviation emissions during 1994–2013, and these technologies may play a role in sustainable aviation. However, considering the uncertainty of the technology, possible inaction by policy makers will slow the development of climate policy in aviation [43]. Alternative jet fuel’s (AJF) potential to lower aviation CO2 emissions was examined by Stples, MD. based on the following factors: the availability of AJF feedstock; the amount of AJF that could be produced from that feedstock; the life-cycle emissions of AJF compared to petroleum-derived jet fuel; and the number of biorefineries and capital investments necessary to achieve the calculated reductions [44]. If AJF use is to reduce life-cycle GHG emissions from aviation by 50% or more by 2050, prices or policies will need to provide significant incentives for bioenergy and waste feedstock production, and it will be necessary to give AJF production precedence over other possible applications.
When defining the research frontier on a certain scientific issue, the word “burst” is used to show the peak in citations to a publication over a period [51]. When there is a sudden increase in the number of references to the literature, the intensity value increases accordingly, which reflects the heat burst of the literature. Figure 5 lists the 15 most cited documents in different periods. It displays the time and date that each reference was made. The red line denotes the moment of the citation explosion for each work, whereas the blue line represents the full research period. It reflects the continued relevance of the paper in the field of aviation carbon emissions research.
In the last five years, in addition to the three articles mentioned above, two other articles have been topical in the field of aviation carbon emissions. Becken, S. (2017) discusses “carbon offset” scientific explanations and policies. Then, airline experiences with offset mechanisms and communication in the context of different aviation emission pathways. Finally, five best practice principles for carbon offsetting are proposed, on the basis of which airlines can develop reliable emission strategies [47]. Gutiérrez-Antonio, C. (2017) is the author of another work that has seen a spike in citations over the previous five years. The study contributes technically to the field of biojet fuels and identifies future development paths for a reliable supply of renewable aviation fuels [30].
3.3.2. Analysis of Cited Journals
A pruned slice network was used to create the graph of citation journal visualization for research on aviation carbon emissions. There are 5203 linkages and 1003 nodes (cited journals) in the network (Figure 6).
The top 10 cited journals that publish studies on aircraft carbon emissions are included in Table 3 along with their Frequency and Burst. The most common reference is Atmospheric Environment, which is closely followed by Energy Policy, Environmental Science & Technology, Energies, and Nature. These findings imply that journals with higher impact factors are likely to have higher citation frequencies. Notably, 81 of the cited journals have Citations Bursts, 10 of which can be found in Table 3. Of these, Atmospheric Environment is both the most cited and the most explosive journal in terms of cited articles. Cited journals with strong citation bursts indicate the potential for widespread academic interest within the period under study. In addition to the previously described journals, researchers in the field of aviation carbon emissions are also interested in journals such as Energies and Applied Energy.
3.4. Keywords Co-Occurrence Analysis
Keywords are representative terms that provide a high-level overview of the paper’s content. The high frequency and core co-occurrence of keywords might represent the study field’s major subjects. By examining closely related terms, we may determine the theoretical framework of the study of aircraft carbon emissions and pinpoint the major ideas and areas of research interest.
In order to discover the major research topics in any area of scientific study, keywords are typically regarded as one of the most crucial elements of every research paper [57]. Using co-word analysis, the conceptual framework of the study of aircraft carbon emissions was uncovered. The analysis in this study integrated the keywords used by the authors with keywords generated by computer technology and bibliometric analysis tools. The following setup parameters were configured in CiteSpace in order to perform a co-word analysis. Top 50 per year (1992–2021), LRF = 3, L/N = 10, LBY = 5, e = 1. Figure 7 depicts a co-occurrence network with 1206 nodes and 1931 links. The co-word analysis network was mapped using the keyword frequencies. Nodes that have frequency values greater than or equal to 190 are also displayed. Nodes stand in for keywords, whereas links reflect keyword associations. The font size of the keywords has a direct impact on the co-occurrence frequency of the keywords. In addition to “carbon dioxide”, “civil aviation”, “aircraft”, and “air transportation”, which are the main targets of the keywords, the academic community also has a strong interest in “emission”. Academics are also interested in the keywords “emission control”, “climate change”, “greenhouse gas” and “fuel”.
A research hotspot of considerable interest to the scientific community is typically indicated by an abruptly large increase in the frequency of a term. In order to identify research hotspots in the area of aircraft carbon emissions, we employed keyword burst detection. In terms of burst intensity (Figure 8), “carbon footprint” (19.61) is the strongest burst, followed by “jet fuel” (17.3), “fighter aircraft” (16.1), “Eurasia” (15.09), “biofuel” (13.07), and “European Union” (12.52). They are hubs of research in their respective eras. The keywords that have emerged and remained hot in the last five years are “biofuel” and “fossil fuel”, “China”, “carbon footprint”, “human”, “airport” and “international civil aviation organization (ICAO)” which have received more attention and had more influence on the concepts compared to other keywords, indicating the research trend that from traditional jet fuel to biofuel, from the EU and Eurasia to China.
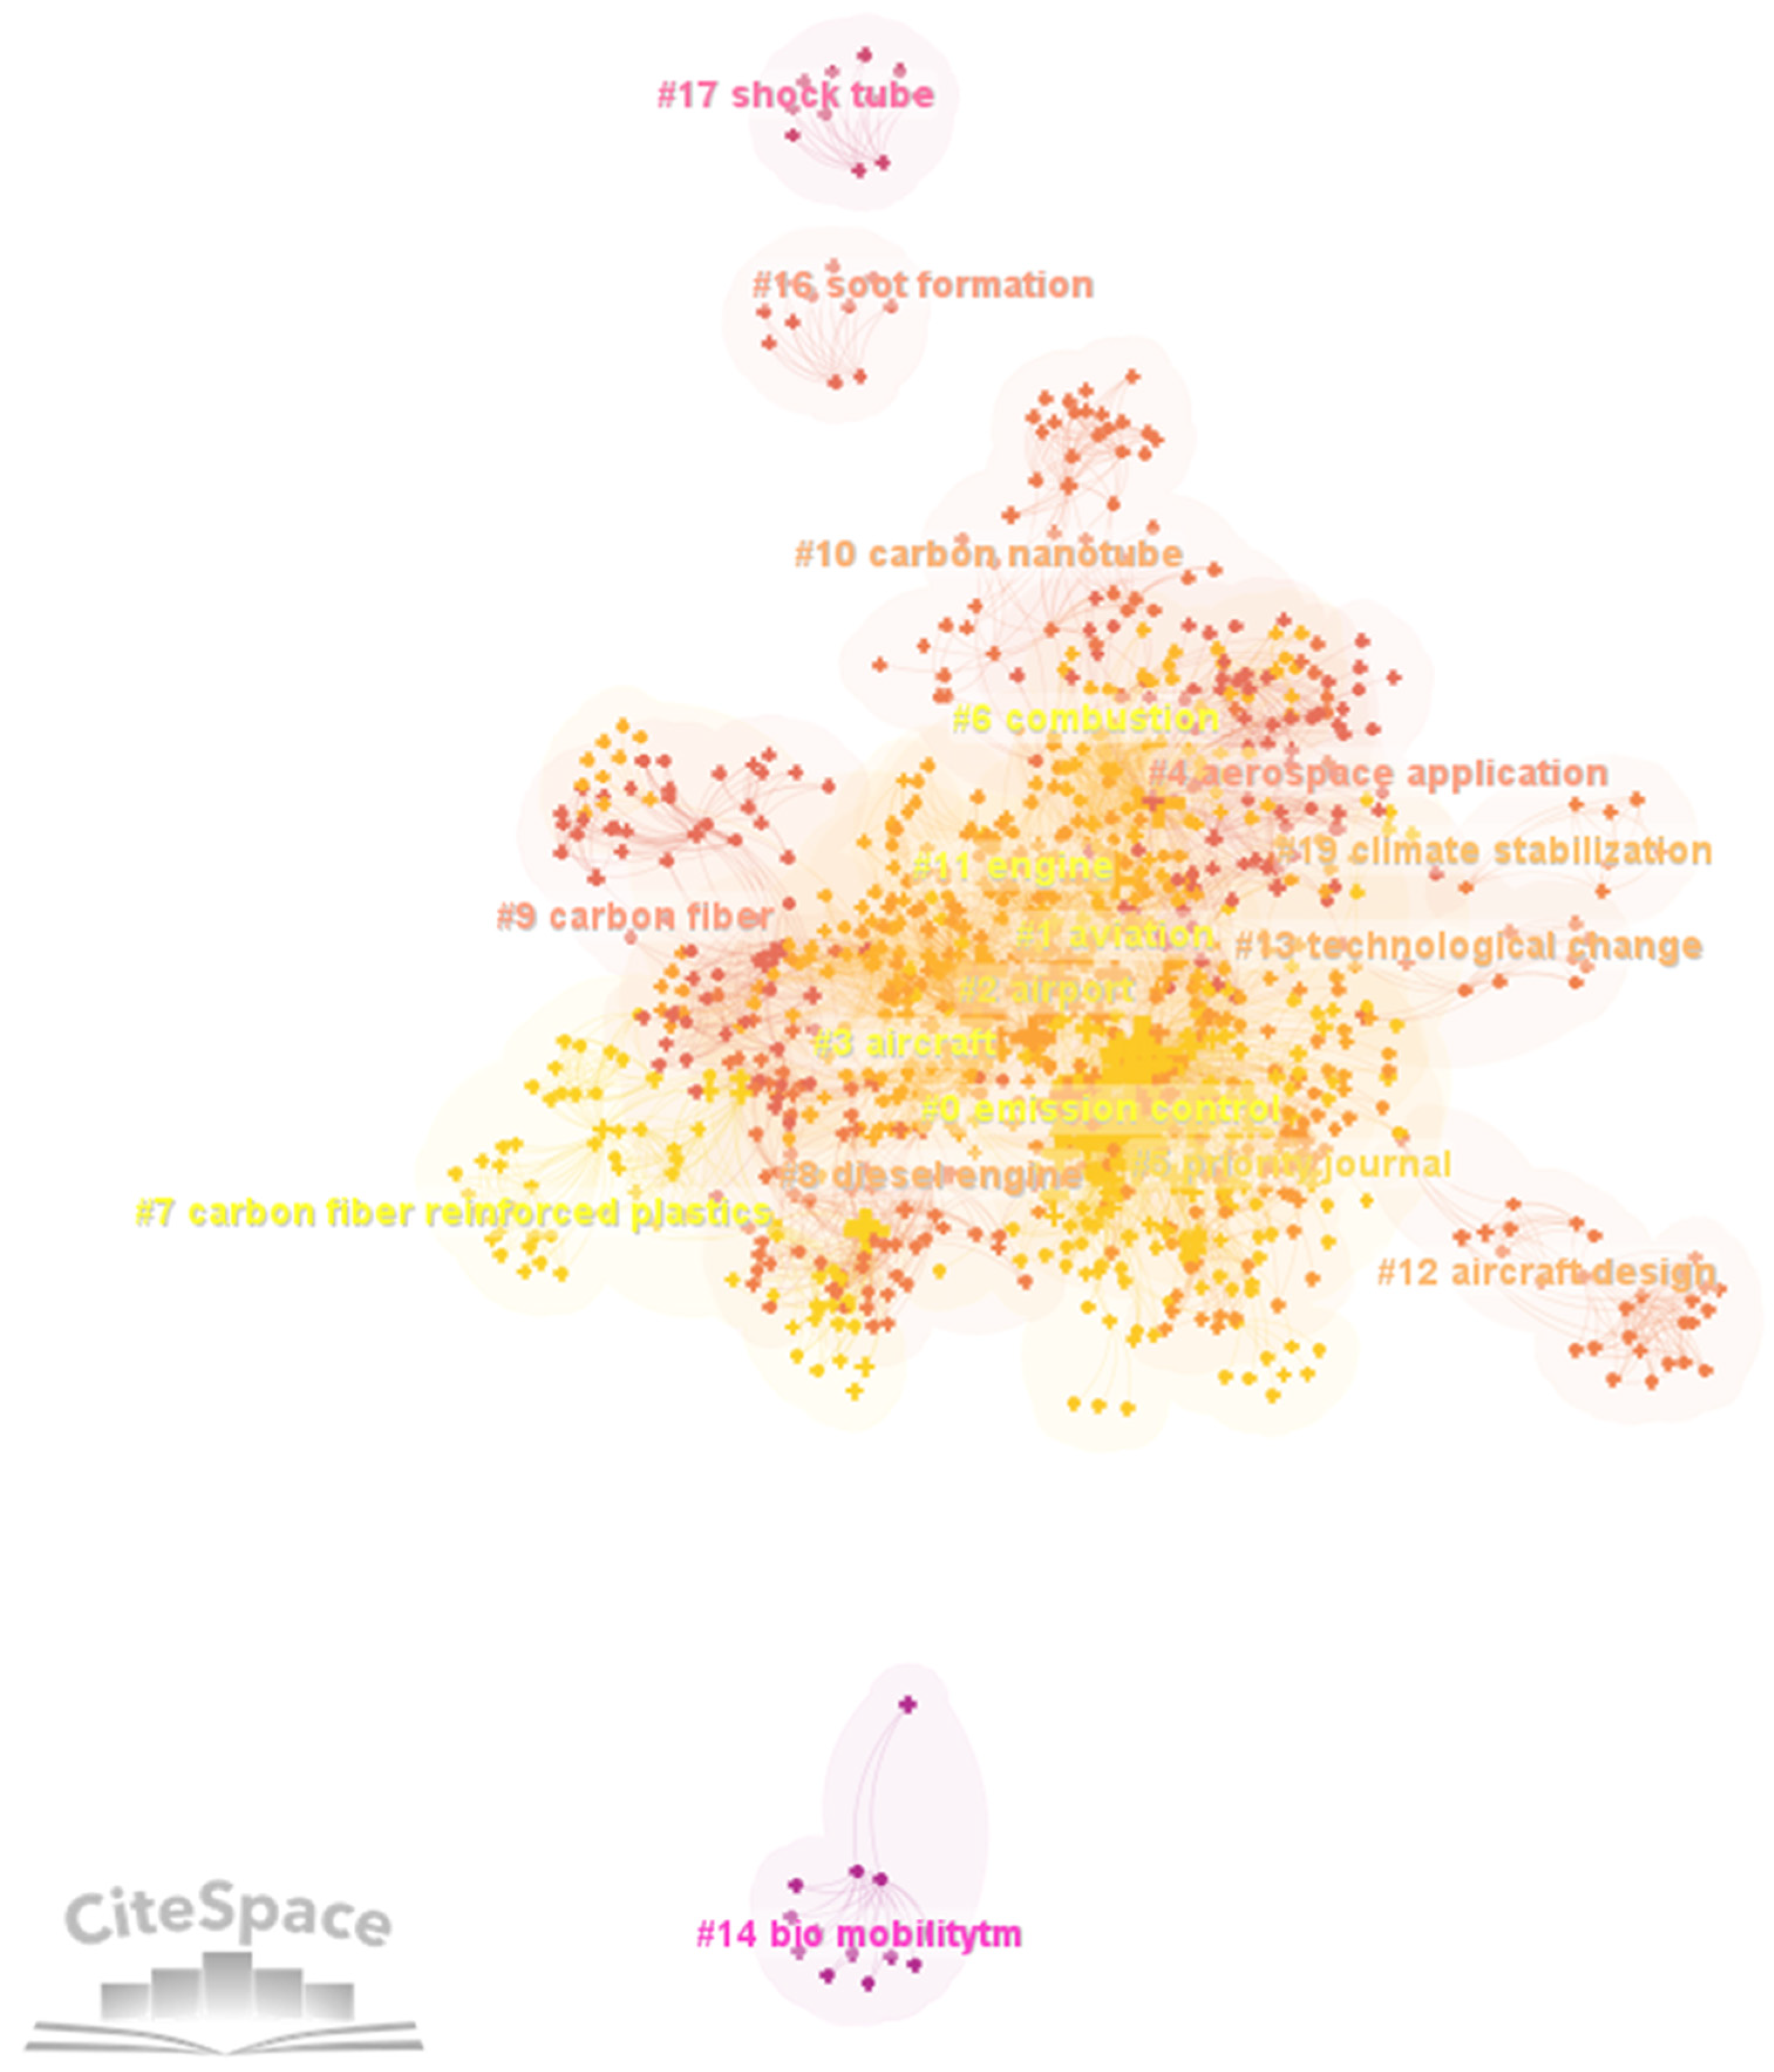
The literature was subjected to a keyword clustering analysis, and the resulting visualization map had a total of 18 term clusters (Figure 9). The clustering structure of the keywords is not particularly relevant because of its small modularity values. The Silhouette of the keyword clusters ranges from a minimum of 0.726 (cluster 0) to a maximum of 1 (cluster 17). Regarding the size of the keyword clusters, the largest cluster has 189 papers, while the smallest cluster has 7 papers. Taking the largest cluster as an example, the research topics of the most active scholars are summarized as follows.
The most populated cluster (#0) deals with five main keywords, namely, emission control; airport; air transportation; biofuel; carbon emission. The cluster is tagged with “emission control”. The citer who is most relevant to the cluster is Koroneos, C. (2005). The authors conducted a life-cycle assessment (LCA) on the environmental impact of two aviation fuels, kerosene, and hydrogen. The authors discovered that among the various RES, including wind, hydropower, biomass, and solar thermal, the creation of hydrogen as a result of using photovoltaics to absorb solar energy had the greatest environmental effect [58], compared to kerosene. The utilization of alternative fuels is crucial for attaining future emissions objectives while lowering reliance on fossil fuels as the movement toward carbon-neutral transportation continues. While COVID-19 offers an unexpected “respite” in terms of GHG emissions, Cabrera, E. (2022) predicts that carbon emissions data will soon return to pre-pandemic levels. Synthetic fuels will probably take the lead in decarbonization once the existing technological limitations are overcome. However, further biofuel research and developments are necessary to establish economies of scale and produce the first significant emissions reductions; therefore, these efforts should not be abandoned [59].
4. Discussion
This essay begins with a succinct introduction to aircraft carbon emissions and the academics that have studied the subject. A systematic overview of the main trends in the field of aviation carbon emissions research was provided by searching 2076 journal articles published between 1992 and 2021 on Scopus. Key authors, journals, countries, keywords, and references were identified as shown in the table and figure above. Research hotspots and academic clusters in the field of aviation carbon emissions were analyzed using CiteSpace. This study provides information on the state of the art and identifies trends, gaps, and research opportunities through a selection and content analysis of the most recent relevant publications in the field of aviation carbon emissions research, illustrating key subject areas, major contributors, and new themes of scientific inquiry and research trends.
In answering research question (1), we analyze the research output in the field of aviation carbon emissions from both quantitative and distributional perspectives. The general trend in writing shows a wave of publications, indicating that research in the field is developing. Based on the change in the number of published articles, the development of this research field can be divided into three phases: 1992–2003, 2004–2016, and 2017–2021. The research fervor on aviation carbon emissions reached a new high in 2021 globally. The most productive authors in aviation carbon emission research are Gössling, S., Lee, D.S, Weymark, J. Sausen, R., and Grewe, V. Meanwhile, the concentration of research is high. Regarding the source journals, the largest journals on the topic of aviation carbon emissions are Transportation Research Part D Transport and Environment, Critical Reviews in Environmental Science and Technology, Applied Energy, Journal of Cleaner Production, and Sustainability.
Research question (2) of this paper focuses on identifying patterns of collaboration between lead authors and countries on aviation carbon emissions research outputs. We discovered that the writers did not create significant collaboration connections. Gössling, S., Gutiérrez-Antonio, C. were the top two co-authors, followed by Sethi, V. and Barrett, S.R.H., followed by Wilson J.D., Saez E., Rabindra R, Jacobs B., and the main collaborative networks are not well connected and aviation carbon research is still in a “fragmented” stage. Since 2010, the number of writers interested in aircraft carbon emissions has progressively grown from 15 (before 1980) to more than 50. It should be noted that the number of writers outnumbers the number of publications, implying that some of them are co-authors. Regarding the distribution of national power in international aviation carbon emissions research, the United States, the United Kingdom, China, Germany, Canada, and Australia are the more active countries. The research results from these countries have collectively contributed to the development of aviation carbon emission theory and practice. The research in China, Germany, and Canada is relatively independent and has not yet formed a synergy with other countries.
In posing research question (3), we selected the top-referenced publications, authors, and journals on the subject of aircraft carbon emissions research. The co-citation analysis revealed that the important papers in the field of aviation carbon emissions are Lee (2010), Moore (2017), Peeters, P. (2016), Becken, S. (2017)/Gutiérrez-Antonio, C (2017). These are the articles that have had the largest impact in the field of study. Atmospheric Environment is the most prominent co-cited journal, followed by Energy Policy, Environmental Science & Technology, Energies, and Nature. Atmospheric Environment is both the most cited journal and the most cited explosive journal. Even if they are not the most cited journals, Energies and Applied Energy are other essential publications on aviation carbon emissions.
Finally, by addressing the fourth research question, we discovered the most intriguing study subjects concerning aircraft carbon emissions (4). The latest scientific investigations in this discipline are focused on the following issues: “carbon dioxide”, “civil aviation”, “aircraft”, “air transportation”, “emission control”, “climate change”, “greenhouse gas” and “fuel”.” biofuel” and “fossil fuel”, “China”, “carbon footprint”, “human”, “airport” and “international civil aviation organization (ICAO)” are the recent research topics in the past five years. It shows that the research trend has evolved from traditional jet fuel to biofuel, from the EU and Eurasia to China.
The innovation of this paper is mainly reflected in the following three aspects. Firstly, it systematically composes the thematic lineage, knowledge evolution, and emerging hotspots of aviation carbon emission research in the past 30 years. Secondly, this paper compares the principle of CiteSpace analysis and the analysis process from the principle to provide a reference for similar studies in the future. Similarly, it can be extended to be applied to the research of other disciplines. Finally, the visualization function of the knowledge graph is synthesized and a scientific interpretation is given. Compared with the previous study [12], there are three superiorities. The first is that although the retrieved fields are more segmented, the search is broader and the conclusions are closer to reality. The second is that thanks to the powerful knowledge graph visualization and customization function of CiteSpace software, it is able to provide clearer and easier-to-read results for summarization. Third, it can carry out quantitative analysis from different perspectives, such as different co-citations and other citations, more comprehensively, objectively, and rationally.
5. Conclusions
All the research results provide input to the research and development of aviation carbon emissions. We introduce paper-related information into the trend analysis. In the realm of aircraft carbon emissions, a complete image of authors, nations, keywords, publications, and research topics was displayed. In this study, bibliometric analysis is applied to quantitatively distill the research perspectives on aviation carbon emissions over the past 20 years. The results of our analysis can provide guidance to scholars who are interested in aviation carbon emissions and are looking for collaboration opportunities. This study may have implications for the direction of the authors’ research and the choice of journals to which they submit their findings. It should be added that the identification of the most productive countries and major contributors in the research area, identifies possible collaborators for further aviation carbon emissions research. The uncovering of leading topical areas and developing themes provides direction for scholars and looks for gaps in existing research.
Although the above bibliometric analysis and visualization of papers related to aviation carbon emissions provided some meaningful results, there are several limitations to this work. The first is that the use of keyword search leads to an incomplete dataset, as some papers may be excluded because indexed keywords do not appear in the title, abstract, or keywords. Secondly, the limitation of using a single database led to incomplete data. Because we used English search phrases, papers written by non-English-speaking authors were likewise excluded. Finally, there is a limitation of the application software. CiteSpace software is still being optimized for bibliometric analysis, and there is still a need to combine a quantitative analysis of the literature with a manual qualitative analysis for systematic evaluation.
Although every attempt is made to do bibliometric analysis as accurately as possible, quantitative research is certainly not a substitute for qualitative research. However, computational, quantitative literature analysis lowers the influence of subjective judgments associated with manual, qualitative literature research. As a result, we feel that combining these two strategies will boost accomplishment. More research is needed to fully comprehend the numerous topic clusters and research hotspots identified in this study. Manual analysis is required, which may be accomplished through the use of a systematic review technique. In conclusion, our study did not capture all the important publications on aviation carbon emissions, but we can consider these findings as a reliable view of the relevant knowledge areas over a period of two decades. Scientific research is an ongoing process, and the evolution of topics changes over time. The research conducted in this paper can be iterated in the future by adjusting the time frame or bibliometric analysis settings. Therefore, our future research will continue to follow the evolving topic of aviation carbon emissions, focusing on the concept of carbon emissions and the related theoretical framework. In addition, content analysis or any other qualitative data interpretation can be combined with this study to the best effect. By providing novel and reliable information related to aviation carbon emissions. Researchers, practitioners, and policy makers may benefit from the results of this study.
Author Contributions
Conceptualization, X.L.; Methodology, Q.S.; Software, J.T.; Data curation, L.N.; Writing—original draft, X.L.; Writing—review & editing, W.L. and X.G. All authors have read and agreed to the published version of the manuscript.
Funding
This research received no external funding.
Data Availability Statement
No new data were created or analyzed in this study. Data sharing is not applicable to this article.
Conflicts of Interest
The authors declare no conflict of interest.
References
- Liu, J.; Tian, J.; Lyu, W.; Yu, Y. The impact of COVID-19 on reducing carbon emissions: From the angle of international student mobility. Appl. Energy 2022, 317, 119136. [Google Scholar] [CrossRef]
- ICAO. Climate Change Mitigation: CORSIA. In Introduction to CORSIA; ICAO: Montreal, QC, Canada, 2019; p. 208. [Google Scholar]
- Domingos, N.D.P. Fighting climate change in the air: Lessons from the EU directive on global aviation. Rev. Bras. De Política Int. 2012, 55, 70–87. [Google Scholar] [CrossRef] [Green Version]
- Scheelhaase, J.; Schaefer, M.; Grimme, W.; Maertens, S. Cost impacts of the inclusion of air transport into the European emissions trading scheme in the time period 2012–2020. Eur. J. Transp. Infrastruct. Res. 2012, 12, 2973. [Google Scholar]
- Gonçalves, V.K. The inclusion of aviation in the european union carbon emissions trading scheme. Ambiente Soc. 2013, 16, 83–98. [Google Scholar] [CrossRef] [Green Version]
- Abeyratne, R. Global market-based measures for aviation emissions. Environ. Policy Law 2015, 45, 102. [Google Scholar]
- Abeyratne, R. Progress Made on the Development of a Global Market-based Measure for Aircraft Emissions. Environ. Policy Law 2016, 46, 238. [Google Scholar]
- Petsonk, A.; Piris-Cabezas, P. Bridging the Allocation Gap in the ICAO MBM: A New Proposal. Carbon Clim. Law Rev. 2016, 10, 127–133. [Google Scholar]
- Lu, Y.; de Vries, W.T. A bibliometric and visual analysis of rural development research. Sustainability 2021, 13, 6136. [Google Scholar] [CrossRef]
- Zupic, I.; Čater, T. Bibliometric methods in management and organization. Organ. Res. Methods 2015, 18, 429–472. [Google Scholar] [CrossRef]
- Tian, X.; Geng, Y.; Zhong, S.; Wilson, J.; Gao, C.; Chen, W.; Hao, H. A bibliometric analysis on trends and characters of carbon emissions from transport sector. Transp. Res. Part D Transp. Environ. 2018, 59, 1–10. [Google Scholar] [CrossRef]
- Almulhim, A.I.; Bibri, S.E.; Sharifi, A.; Ahmad, S.; Almatar, K.M. Emerging trends and knowledge structures of urbanization and environmental sustainability: A regional perspective. Sustainability 2022, 14, 13195. [Google Scholar] [CrossRef]
- Barbu, L.; Mihaiu, D.M.; Șerban, R.A.; Opreana, A. Knowledge mapping of optimal taxation studies: A bibliometric analysis and network visualization. Sustainability 2022, 14, 1043. [Google Scholar] [CrossRef]
- Chen, C. Mapping Scientific Frontiers: The Quest for Knowledge Visualization; Springer Science & Business Media: Berlin, Germany, 2013. [Google Scholar]
- Chen, C. Information Visualization: Beyond the Horizon; Springer Science & Business Media: Berlin, Germany, 2004. [Google Scholar]
- Liang, C.; Luo, A.; Zhong, Z. Knowledge mapping of medication literacy study: A visualized analysis using CiteSpace. SAGE Open Med. 2018, 6, 2050312118800199. [Google Scholar] [CrossRef] [PubMed] [Green Version]
- Jing, G.; Wang, Y.; Guo, X.; Guo, S.; Jia, L. Analysis on the research status of the domestic aviation transformation and traffic safety in 2019. J. Saf. Environ. 2020, 20, 2024–2028. [Google Scholar]
- Yang, F.; Li, Z.; Ma, J.; Huang, T. Research hotspots and evolution of general aviation development: A visualization study based on knowledge mapping. J. Beijing Univ. Aeronaut. Astronaut. (Soc. Sci. Ed.) 2020, 33, 92–100. [Google Scholar]
- Shao, T.; Ye, Y. Research on cold-chain visualization based on knowledge mapping. Sci. Technol. Libr. 2020, 39, 307–323. [Google Scholar] [CrossRef]
- Sofik, S.; Rahman, Z. Global Visualization and Knowledge Mapping in the Field of Information Retrieval (IR): A Bibliometrics Analysis. Qual. Quant. Methods Libr. 2021, 10, 623–647. [Google Scholar]
- Mongeon, P.; Paul-Hus, A. The journal coverage of Web of Science and Scopus: A comparative analysis. Scientometrics 2016, 106, 213–228. [Google Scholar] [CrossRef]
- Sonnenwald, D.H. Scientific collaboration. Annu. Rev. Inf. Sci. Technol. 2007, 41, 643–681. [Google Scholar] [CrossRef]
- Romero-Izquierdo, A.G.; Gómez-Castro, F.I.; Gutiérrez-Antonio, C.; Hernández, S.; Errico, M. Intensification of the alcohol-to-jet process to produce renewable aviation fuel. Chem. Eng. Process. Process Intensif. 2021, 160, 108270. [Google Scholar] [CrossRef]
- Soria-Ornelas, M.L.; Gutiérrez-Antonio, C.; Gómez-Castro, F.I.; Hernández, S. Feasibility study of using reactive distillation for the production of renewable aviation fuel. Comput. Aided Chem. Eng. 2018, 43, 639–644. [Google Scholar]
- Domínguez-García, S.; Gutiérrez-Antonio, C.; De Lira-Flores, J.A.; Ponce-Ortega, J.M.; El-Halwagi, M.M. Strategic planning for the supply chain of aviation biofuel with consideration of hydrogen production. Ind. Eng. Chem. Res. 2017, 56, 13812–13830. [Google Scholar] [CrossRef]
- Moreno-Gómez, A.L.; Gutiérrez-Antonio, C.; Gómez-Castro, F.I.; Hernández, S. Modelling, simulation and intensification of the hydroprocessing of chicken fat to produce renewable aviation fuel. Chem. Eng. Process. Process Intensif. 2021, 159, 108250. [Google Scholar] [CrossRef]
- Gutiérrez-Antonio, C.; Romero-Izquierdo, A.G.; Gómez-Castro, F.I.; Hernández, S.; Briones-Ramírez, A. Simultaneous energy integration and intensification of the hydrotreating process to produce biojet fuel from Jatropha curcas. Chem. Eng. Process. Process Intensif. 2016, 110, 134–145. [Google Scholar] [CrossRef]
- Domínguez-García, S.; Gutiérrez-Antonio, C.; Lira-Flores, D.; Armando, J.; Ponce-Ortega, J.M. Optimal planning for the supply chain of biofuels for aviation in Mexico. Clean Technol. Environ. Policy 2017, 19, 1387–1402. [Google Scholar] [CrossRef]
- Gutiérrez-Antonio, C.; Gómez-Castro, F.I.; Romero-Izquierdo, A.G.; Hernández, S. Energy integration of a hydrotreating process for the production of biojet fuel. Comput. Aided Chem. Eng. 2016, 38, 127–132. [Google Scholar]
- Gutiérrez-Antonio, C.; Gómez-Castro, F.I.; de Lira-Flores, J.A.; Hernández, S. A review on the production processes of renewable jet fuel. Renew. Sustain. Energy Rev. 2017, 79, 709–729. [Google Scholar] [CrossRef]
- Gutiérrez-Antonio, C.; Romero-Izquierdo, A.G.; Israel Gómez-Castro, F.; Hernández, S. Energy integration of a hydrotreatment process for sustainable biojet fuel production. Ind. Eng. Chem. Res. 2016, 55, 8165–8175. [Google Scholar] [CrossRef]
- Gutiérrez-Antonioa, C.; Gómez-Castrob, F.I.; Hernándezb, S. Sustainable production of renewable aviation fuel through intensification strategies. Chem. Eng. 2018, 69, 319–324. [Google Scholar] [CrossRef]
- Gutiérrez-Antonio, C.; Romero-Izquierdo, A.G.; Gómez-Castro, F.I.; Hernández, S. Modeling, simulation and intensification of hydroprocessing of micro-algae oil to produce renewable aviation fuel. Clean Technol. Environ. Policy 2018, 20, 1589–1598. [Google Scholar] [CrossRef]
- Chen, N.; Sridhar, B.; Li, J.; Ng, H. Evaluation of Contrail Reduction Strategies Based on Aircraft Flight Distances. In Proceedings of the AIAA Guidance, Navigation, and Control Conference, Minneapolis, MN, USA, 13–16 August 2012. [Google Scholar]
- Sridhar, B.; Ng, H.; Chen, N. Integration of linear dynamic emission and climate models with air traffic simulations. In Proceedings of the AIAA Guidance, Navigation, and Control Conference, Minneapolis, MN, USA, 13–16 August 2012. [Google Scholar]
- Sridhar, B.; Chen, N.Y.; Ng, H. Aircraft Trajectory Design Based on Reducing the Combined Effects of Carbon-Di-Oxide, Oxides of Nitrogen and Contrails. In Proceedings of the AIAA Modeling and Simulation Technologies Conference, Atlanta, GA, USA, 16–20 June 2014. [Google Scholar]
- Sridhar, B.; Chen, N.; Ng, H.; Morando, A. Modeling and simulation of the impact of air traffic operations on the environment. In Proceedings of the AIAA Modeling and Simulation Technologies Conference, Portland, OR, USA, 8–11 August 2011. [Google Scholar]
- Ng, H.K.; Sridhar, B.; Grabbe, S.; Chen, N. Cross-polar aircraft trajectory optimization and the potential climate impact. In Proceedings of the 2011 IEEE/AIAA 30th Digital Avionics Systems Conference, Seattle, WA, USA, 16–20 October 2011. [Google Scholar]
- Chen, N.Y.; Kirschen, P.; Sridhar, B.; Ng, H.K. Identification of flights for cost-efficient climate impact reduction. In Proceedings of the AIAA/3AF Aircraft Noise and Emissions Reduction Symposium, Atlanta, GA, USA, 16–20 June 2014. [Google Scholar]
- Chen, N.Y.; Sridhar, B.; Ng, H.; Li, J. Evaluating tradeoff between environmental impact and operational costs for enroute air traffic. In Proceedings of the AIAA Guidance, Navigation, and Control Conference, National Harbor, MD, USA, 13–17 January 2014. [Google Scholar]
- Lee, D.; Pitari, G.; Grewe, V.; Gierens, K.; Penner, J.; Petzold, A.; Prather, M.; Schumann, U.; Bais, A.; Berntsen, T. Transport impacts on atmosphere and climate: Aviation. Atmos. Environ. 2010, 44, 4678–4734. [Google Scholar] [CrossRef] [PubMed] [Green Version]
- Moore, R.H.; Thornhill, K.L.; Weinzierl, B.; Sauer, D.; D’Ascoli, E.; Kim, J.; Lichtenstern, M.; Scheibe, M.; Beaton, B.; Beyersdorf, A.J.; et al. Biofuel blending reduces particle emissions from aircraft engines at cruise conditions. Nature 2017, 543, 411–415. [Google Scholar] [CrossRef] [Green Version]
- Peeters, P.; Higham, J.; Kutzner, D.; Cohen, S.; Gössling, S. Are technology myths stalling aviation climate policy? Transp. Res. Part D Transp. Environ. 2016, 44, 30–42. [Google Scholar] [CrossRef] [Green Version]
- Staples, M.D.; Malina, R.; Suresh, P.; Hileman, J.I.; Barrett, S.R. Aviation CO2 emissions reductions from the use of alternative jet fuels. Energy Policy. 2018, 114, 342–354. [Google Scholar] [CrossRef]
- Kousoulidou, M.; Lonza, L. Biofuels in aviation: Fuel demand and CO2 emissions evolution in Europe toward 2030. Transp. Res. Part D Transp. Environ. 2016, 46, 166–181. [Google Scholar] [CrossRef]
- Lee, D.S.; Fahey, D.W.; Forster, P.M.; Newton, P.J.; Wit, R.C.; Lim, L.L.; Owen, B.; Sausen, R. Aviation and global climate change in the 21st century. Atmos. Environ. 2009, 43, 3520–3537. [Google Scholar] [CrossRef] [PubMed] [Green Version]
- Becken, S.; Mackey, B. What role for offsetting aviation greenhouse gas emissions in a deep-cut carbon world? J. Air Transp. Manag. 2017, 63, 71–83. [Google Scholar] [CrossRef]
- Sgouridis, S.; Bonnefoy, P.A.; Hansman, R.J. Air transportation in a carbon constrained world: Long-term dynamics of policies and strategies for mitigating the carbon footprint of commercial aviation. Transp. Res. Part A Policy Pract. 2011, 45, 1077–1091. [Google Scholar] [CrossRef]
- Owen, B.; Lee, D.S.; Lim, L. Flying into the future: Aviation emissions scenarios to 2050. Environ. Sci. Technol. 2010, 44, 2255–2260. [Google Scholar] [CrossRef]
- Fuglestvedt, J.S.; Shine, K.P.; Berntsen, T.; Cook, J.; Lee, D.S.; Stenke, A.; Skeie, R.B.; Velders, G.J.M.; Waitz, I.A. Transport impacts on atmosphere and climate: Metrics. Atmos. Environ. 2010, 44, 4648–4677. [Google Scholar] [CrossRef] [Green Version]
- Chen, C. CiteSpace II: Detecting and visualizing emerging trends and transient patterns in scientific literature. J. Am. Soc. Inf. Sci. Technol. 2006, 57, 359–377. [Google Scholar] [CrossRef] [Green Version]
- Bows, A.; Anderson, K.L. Policy clash: Can projected aviation growth be reconciled with the UK Government’s 60% carbon-reduction target? Transp. Policy 2007, 14, 103–110. [Google Scholar] [CrossRef]
- Cairns, S.; Newson, C.; Boardman, B.; Anable, J. Predict and Decide: Aviation, Climate Change and UK Policy; Environmental Change Institute, University of Oxford: Oxford, UK, 2006. [Google Scholar]
- Grewe, V.; Stenke, A. AirClim: An efficient tool for climate evaluation of aircraft technology. Atmos. Chem. Phys. 2008, 8, 4621–4639. [Google Scholar] [CrossRef] [Green Version]
- Wilkerson, J.T.; Jacobson, M.Z.; Malwitz, A.; Balasubramanian, S.; Wayson, R.; Fleming, G.; Naiman, A.D.; Lele, S.K. Analysis of emission data from global commercial aviation: 2004 and 2006. Atmos. Chem. Phys. 2010, 10, 6391–6408. [Google Scholar] [CrossRef] [Green Version]
- Chiaramonti, D.; Prussi, M.; Buffi, M.; Tacconi, D. Sustainable bio kerosene: Process routes and industrial demonstration activities in aviation biofuels. Appl. Energy 2014, 136, 767–774. [Google Scholar] [CrossRef]
- Gao, F.; Jia, X.; Zhao, Z.; Chen, C.C.; Xu, F.; Geng, Z.; Song, X. Bibliometric analysis on tendency and topics of artificial intelligence over last decade. Microsyst. Technol. 2021, 27, 1545–1557. [Google Scholar] [CrossRef]
- Koroneos, C.; Dompros, A.; Roumbas, G.; Moussiopoulos, N. Advantages of the use of hydrogen fuel as compared to kerosene. Resour. Conserv. Recycl. 2005, 44, 99–113. [Google Scholar] [CrossRef]
- Cabrera, E.; de Sousa, J.M.M. Use of Sustainable Fuels in Aviation—A Review. Energies 2022, 15, 2440. [Google Scholar] [CrossRef]
Figure 1.
Annual variations of literature outputs (publications and citations by cleaning up) related to aviation carbon emission from 1992 to 2021. Source: created by Excel.
Figure 1.
Annual variations of literature outputs (publications and citations by cleaning up) related to aviation carbon emission from 1992 to 2021. Source: created by Excel.

Figure 2.
Co-Authorship network of authors for the research. Source: derived from CiteSpace.
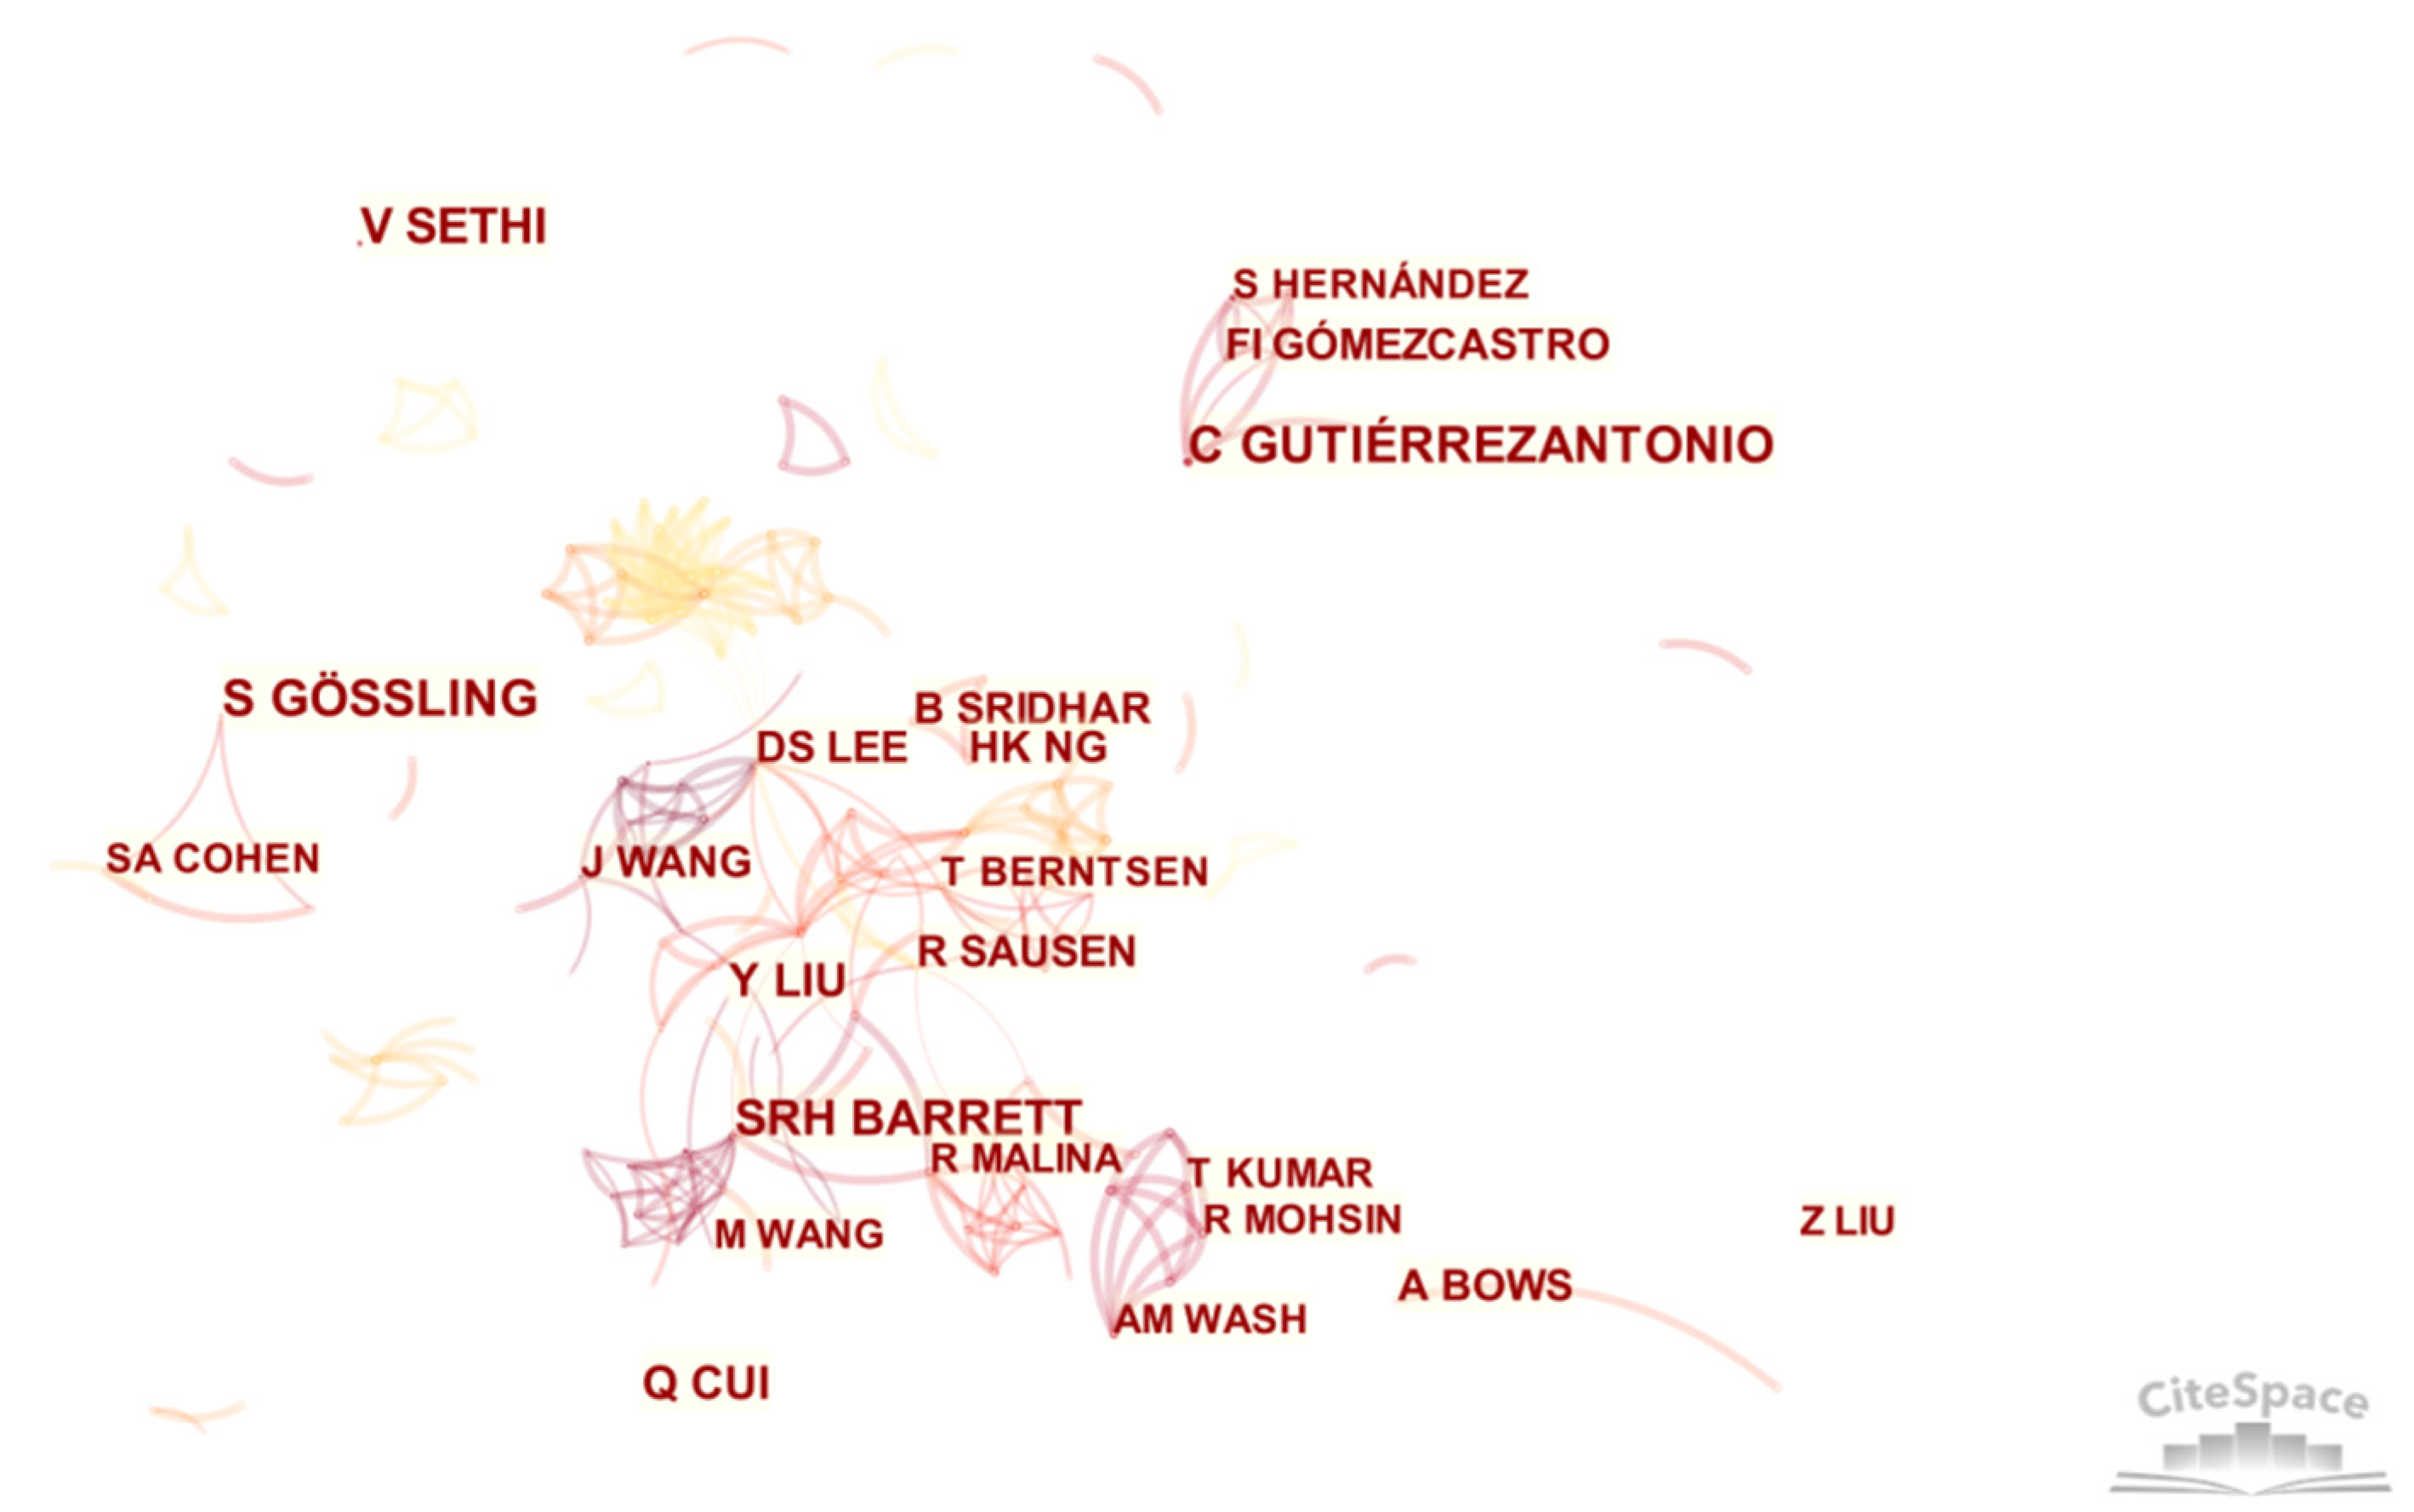
Figure 3.
Network of co-authors’ countries for the research. Source: derived from CiteSpace.

Figure 4.
Visualization of reference co-citation networks for the research [41,42,43,44,45,46,47,48,49,50]. Source: derived from CiteSpace.
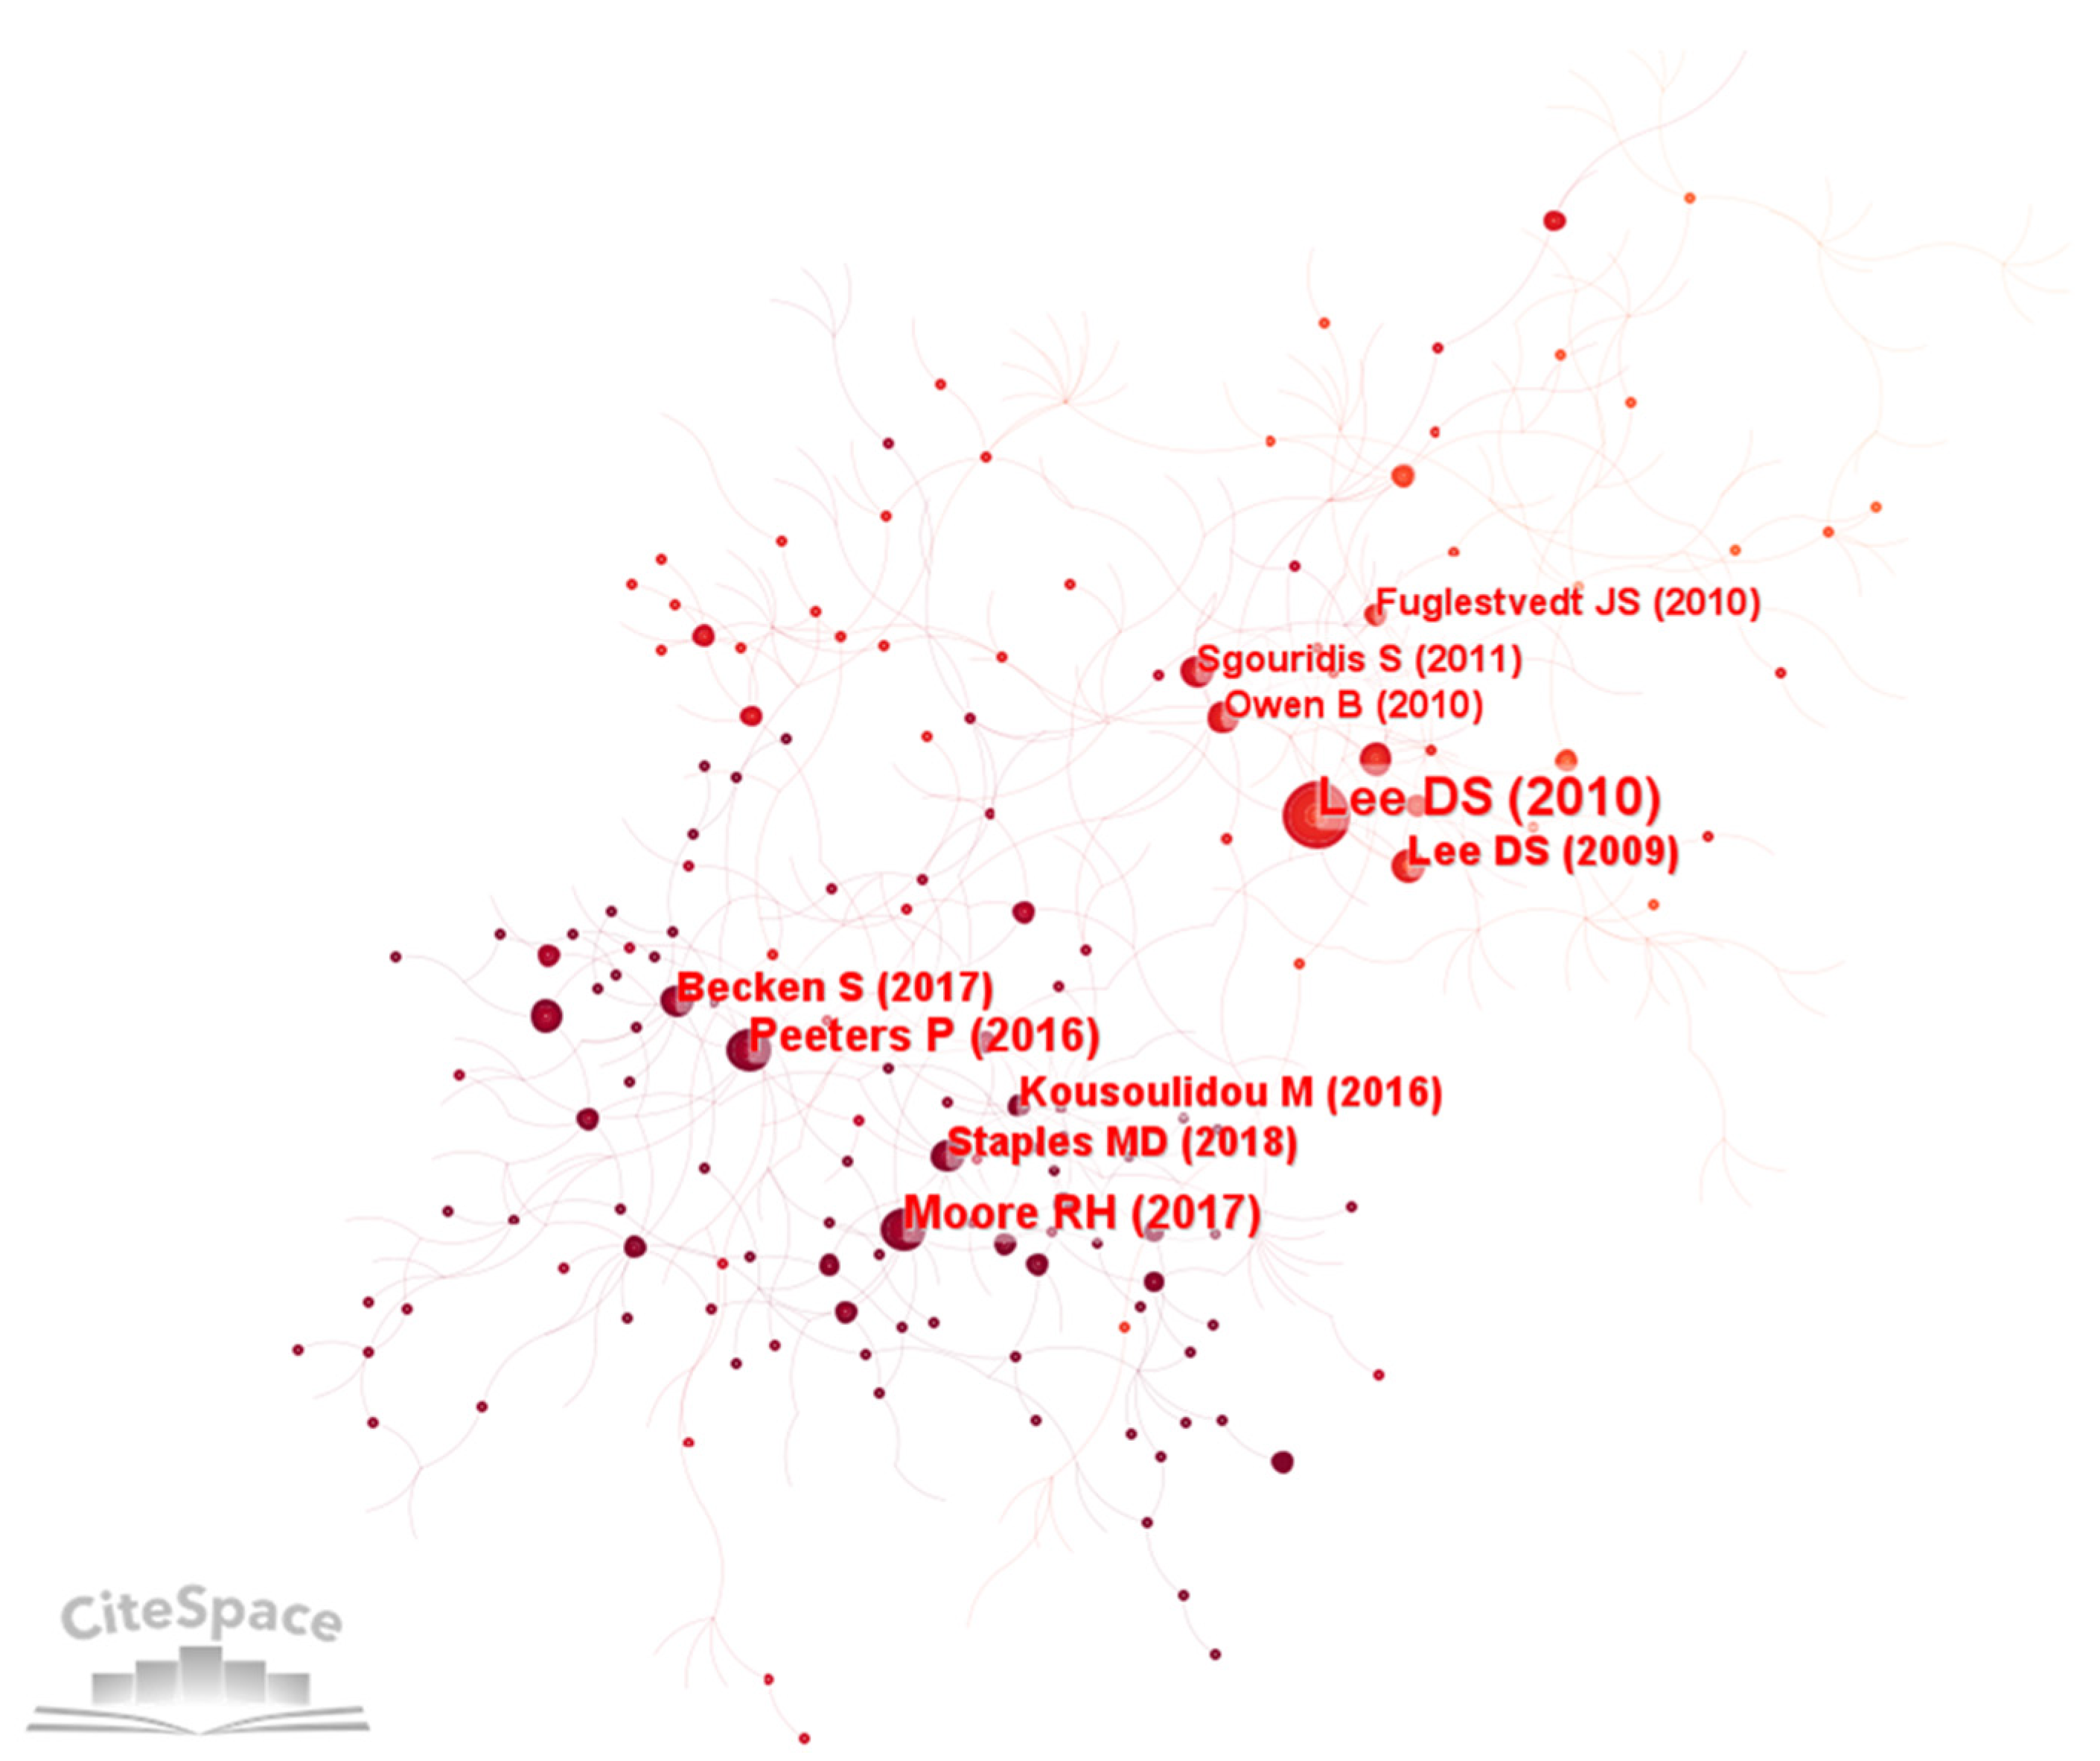
Figure 5.
Top 15 cited authors with the strongest citation bursts [30,41,42,43,44,46,47,48,49,50,52,53,54,55,56]. Source: derived from CiteSpace.
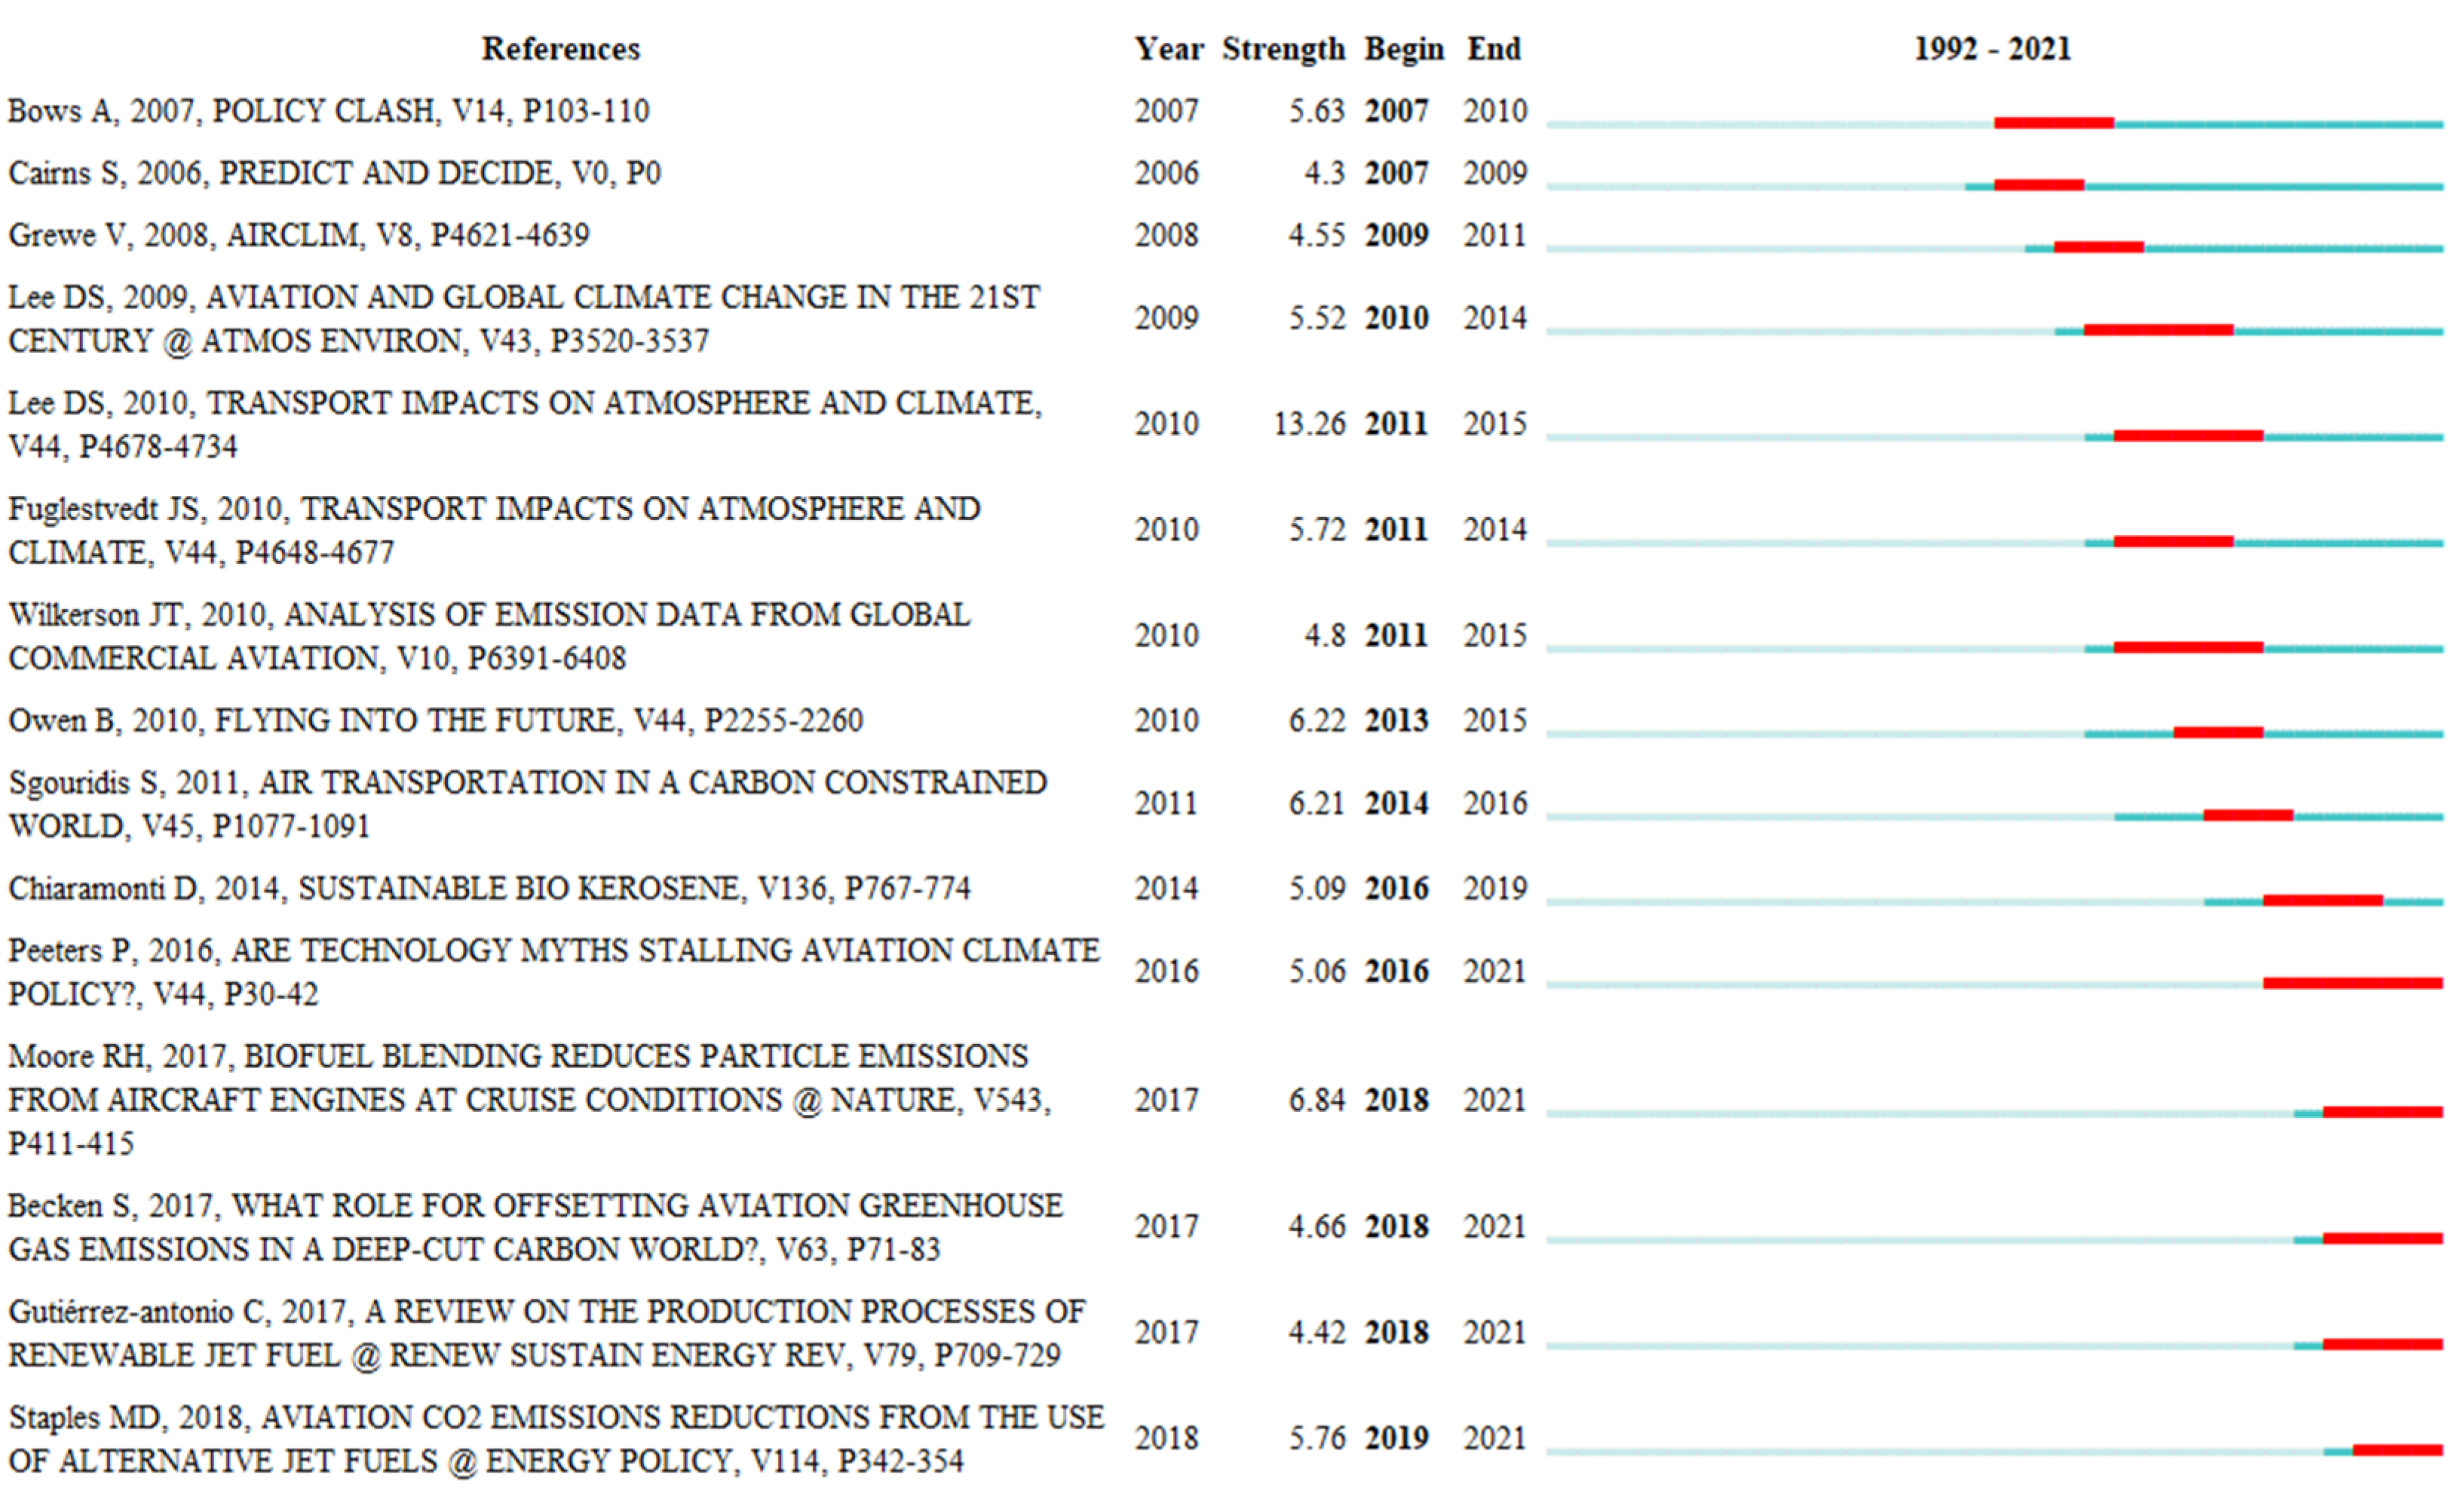
Figure 6.
Visualization of journal co-citation networks for the research. Source: derived by authors from CiteSpace.
Figure 6.
Visualization of journal co-citation networks for the research. Source: derived by authors from CiteSpace.
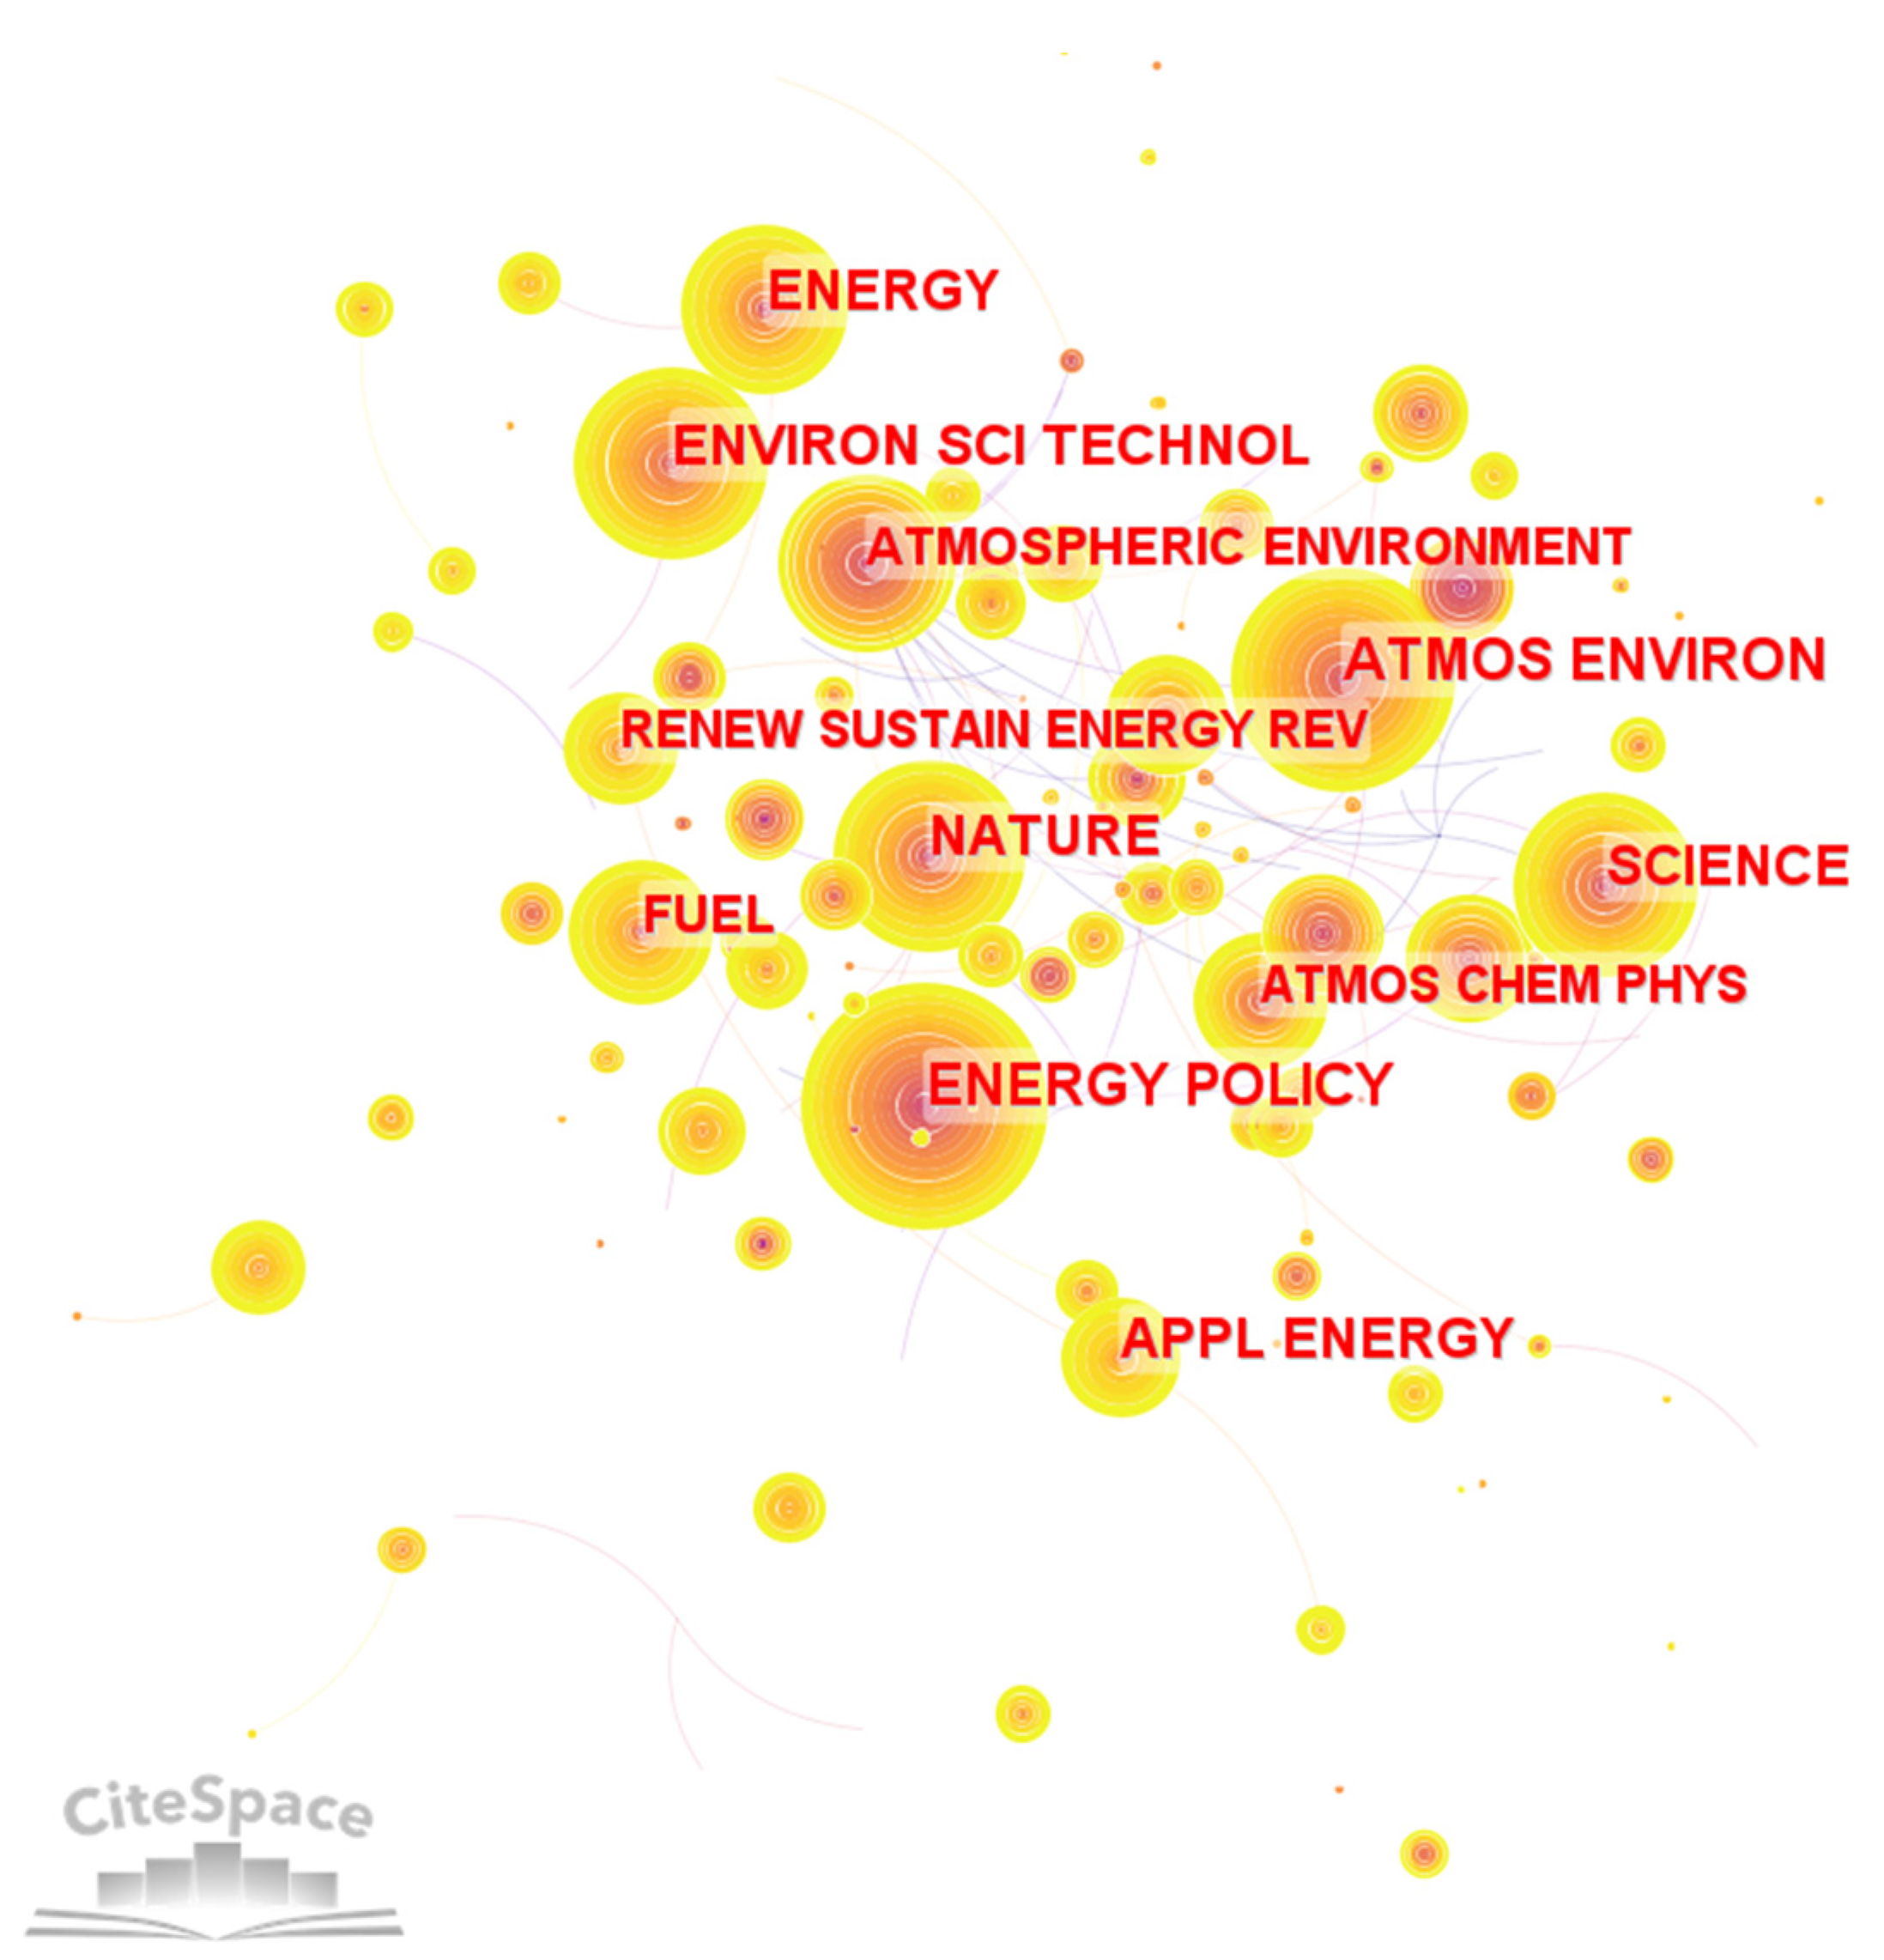
Figure 7.
Keywords co-occurrence network for the research. Source: derived by authors from CiteSpace.
Figure 7.
Keywords co-occurrence network for the research. Source: derived by authors from CiteSpace.
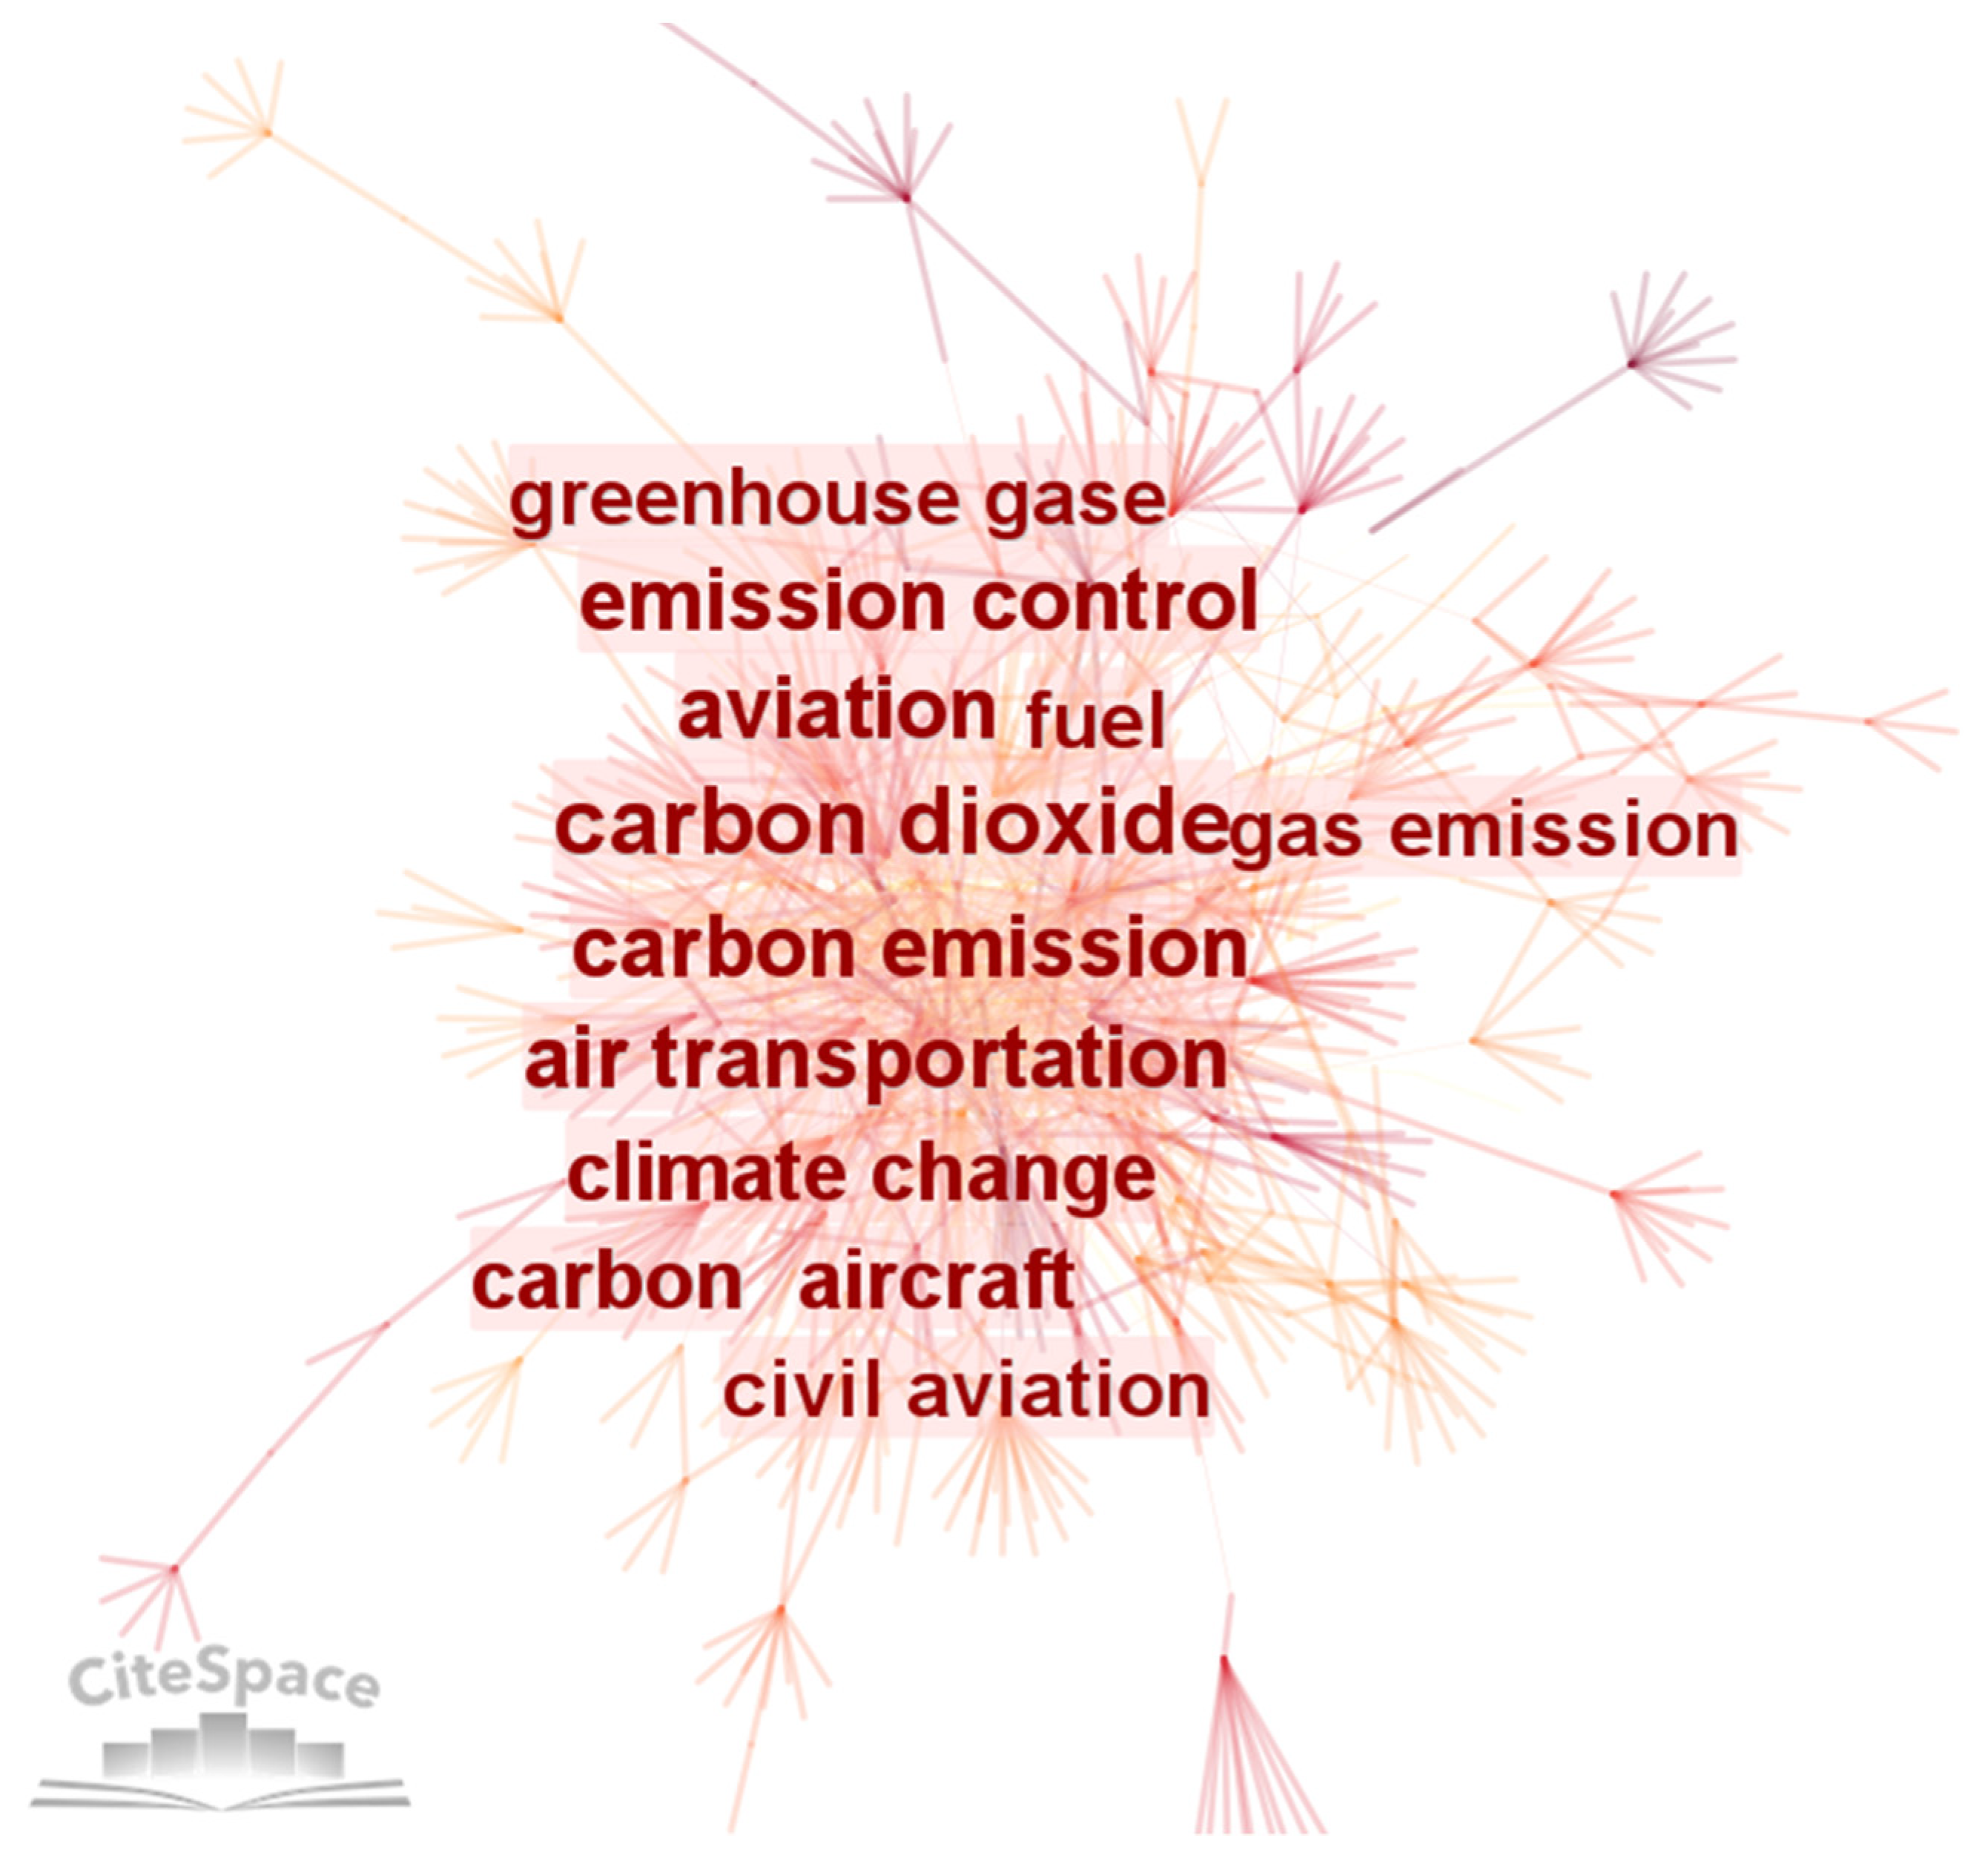
Figure 8.
Top 25 keywords with the strongest citation bursts. Source: derived from CiteSpace.

Figure 9.
Clusters of the keywords co-occurrence network for the research. Source: derived by authors from CiteSpace.
Figure 9.
Clusters of the keywords co-occurrence network for the research. Source: derived by authors from CiteSpace.

Table 1.
Top 10 most productive authors in research.
| Rank | Authors | Institution | Pubs | H-Index | Cites | Main Focuses |
|---|---|---|---|---|---|---|
| 1 | Gössling, S. | Lund University | 17 | 84 | 29,008 | Transport, Tourism, Sustainability |
| 2 | Lee, D.S. | Manchester Metropolitan University | 15 | 31 | 6674 | Climate impact of aviation |
| 3 | Barrett, S.R.H. | Massachusetts Institute of Technology | 14 | 45 | 6341 | Sustainable aviation |
| 4 | Sausen, R. | Deutsches Zentrum für Luft-und Raumfahrt | 14 | 47 | 7635 | Climate impact of aviation |
| 5 | Grewe, V. | Deutsches Zentrum für Luft-und Raumfahrt | 13 | 45 | 7783 | Climate impact of aviation |
| 6 | Sethi, V. | Cranfield University | 13 | 13 | 725 | Aviation Design |
| 7 | GutiérrezAntonio, C. | Universidad Autónoma de Querétaro | 12 | 17 | 1262 | Biojet fuel |
| 8 | Lim, L.L. | Manchester Metropolitan University | 11 | 10 | 1268 | Climate impact of aviation |
| 9 | Miake-Lye, R.C. | Aerodyne Research Inc. | 11 | 34 | 2189 | Aviation Design |
| 10 | Ng, H.K. | University of California | 11 | 14 | 410 | Aviation Systems |
Note: Pubs = number of publications; h-index is based on the Web of Science Core Collection citations of the publications calculated for each author. Source: http://scholar.google.com (accessed on 25 September 2022)
Table 2.
Top 10 most productive journals in research.
| Rank | Journals | Pubs | Category | IF | Quartile |
|---|---|---|---|---|---|
| 1 | Transportation Research Part D Transport and Environment | 46 | SCIE, SSCI | 7.041 | Q1 |
| 2 | Critical Reviews in Environmental Science and Technology | 35 | SCIE | 11.750 | Q1 |
| 3 | Atmospheric Environment | 33 | SCIE | 5.755 | Q1 |
| 4 | Energy Policy | 32 | SCIE, SSCI | 7.576 | Q1 |
| 5 | Journal Of Air Transport Management | 30 | SSCI | 5.428 | Q2 |
| 6 | Journal of Cleaner Production | 28 | SCIE | 11.072 | Q1 |
| 7 | Sustainability | 23 | SCIE, SSCI | 3.889 | Q2 |
| 8 | Atmospheric Chemistry and Physics | 21 | SCIE | 7.197 | Q1 |
| 9 | Energies | 20 | SCIE | 3.252 | Q3 |
| 10 | Applied Energy | 18 | SCIE | 11.446 | Q1 |
Note: Pubs = publications; SCIE = Science Citation Index Expanded, SSCI = Social Science Citation Index; IF = The Impact Factor measures the average number of citations received in a particular year by papers published in the journal during the two preceding years. 2021 Journal Citation Reports (Clarivate Analytics, 2022). Quartile = category ranking by JCR. Source: https://www.sciencedirect.com (accessed on 25 September 2022).
Table 3.
Distribution of top 10 cited journals for the research.
| Rank | Journals | Frequency | Burst |
|---|---|---|---|
| 1 | Atmospheric Environment | 325 | 14.8422 |
| 2 | Energy Policy | 206 | 9.1187 |
| 3 | Environmental Science & Technology | 181 | - |
| 4 | Energies | 172 | 5.9381 |
| 5 | Nature | 164 | - |
| 6 | Science | 143 | - |
| 7 | Applied Energy | 136 | 5.7581 |
| 8 | Fuel | 133 | - |
| 9 | Atmospheric Chemistry and physics | 107 | - |
| 10 | Renewable and Sustainable Energy Reviews | 97 | - |
Source: derived by authors from CiteSpace.
Disclaimer/Publisher’s Note: The statements, opinions and data contained in all publications are solely those of the individual author(s) and contributor(s) and not of MDPI and/or the editor(s). MDPI and/or the editor(s) disclaim responsibility for any injury to people or property resulting from any ideas, methods, instructions or products referred to in the content. |
© 2023 by the authors. Licensee MDPI, Basel, Switzerland. This article is an open access article distributed under the terms and conditions of the Creative Commons Attribution (CC BY) license (https://creativecommons.org/licenses/by/4.0/).
Share and Cite
MDPI and ACS Style
Li, X.; Tang, J.; Li, W.; Si, Q.; Guo, X.; Niu, L. A Bibliometric Analysis and Visualization of Aviation Carbon Emissions Studies. Sustainability 2023, 15, 4644. https://doi.org/10.3390/su15054644
AMA Style
Li X, Tang J, Li W, Si Q, Guo X, Niu L. A Bibliometric Analysis and Visualization of Aviation Carbon Emissions Studies. Sustainability. 2023; 15(5):4644. https://doi.org/10.3390/su15054644
Chicago/Turabian StyleLi, Xirui, Junqi Tang, Weidong Li, Qingmin Si, Xinyao Guo, and Linqing Niu. 2023. "A Bibliometric Analysis and Visualization of Aviation Carbon Emissions Studies" Sustainability 15, no. 5: 4644. https://doi.org/10.3390/su15054644
Note that from the first issue of 2016, this journal uses article numbers instead of page numbers. See further details here.