
How the Distribution of Photon Delivery Impacts Crops in Indoor Plant Environments: A Review

Department of Bioresource Engineering, McGill University, Sainte-Anne-de-Bellevue, QC H9X 3V9, Canada
*
Author to whom correspondence should be addressed.
Sustainability 2023, 15(5), 4645; https://doi.org/10.3390/su15054645
Submission received: 31 December 2022
/
Revised: 18 February 2023
/
Accepted: 21 February 2023
/
Published: 6 March 2023
(This article belongs to the Special Issue Sustainable Crop Production and Management: The Perspective of Controlled Environment Agriculture)
Abstract
:Indoor plant production allows for increased controllability over plant growth, particularly with the employment of specific lighting regimes. This article reviews research investigating the influence of various light regimes that provide crops with the same light spectrum and daily light integral (DLI), yet with different lighting schedules and intensities. The structure of these light regimes includes changing photoperiod duration and light intensity, cyclic lighting schedules (increased number of light/dark cycles over 24 h, same total illuminated time and intensity), and intermittent and fluctuating lighting (with intervals ranging from 60 s to 60 min). The most common crops investigated were leafy greens, although some fruiting, ornamental, and model crop Arabidopsis are included. Under constant DLI, extending photoperiod and reducing light intensity generally increased the total amount of biomass accumulation and increased light interception. Increases in the number of shortened light/dark cycles contributed to decreased yield, leaf area, and photosynthetic rate, compared to the more standard single light/dark cycle. Intermittent and fluctuating lighting regimes generally reduced biomass accumulation and light interception. These results indicate that the total amount of light delivered to crops is important, but how that light is delivered can influence crop growth. This review will be useful for growers and researchers when designing lighting systems and regimes to produce horticultural crops in indoor plant environment systems.
1. Introduction
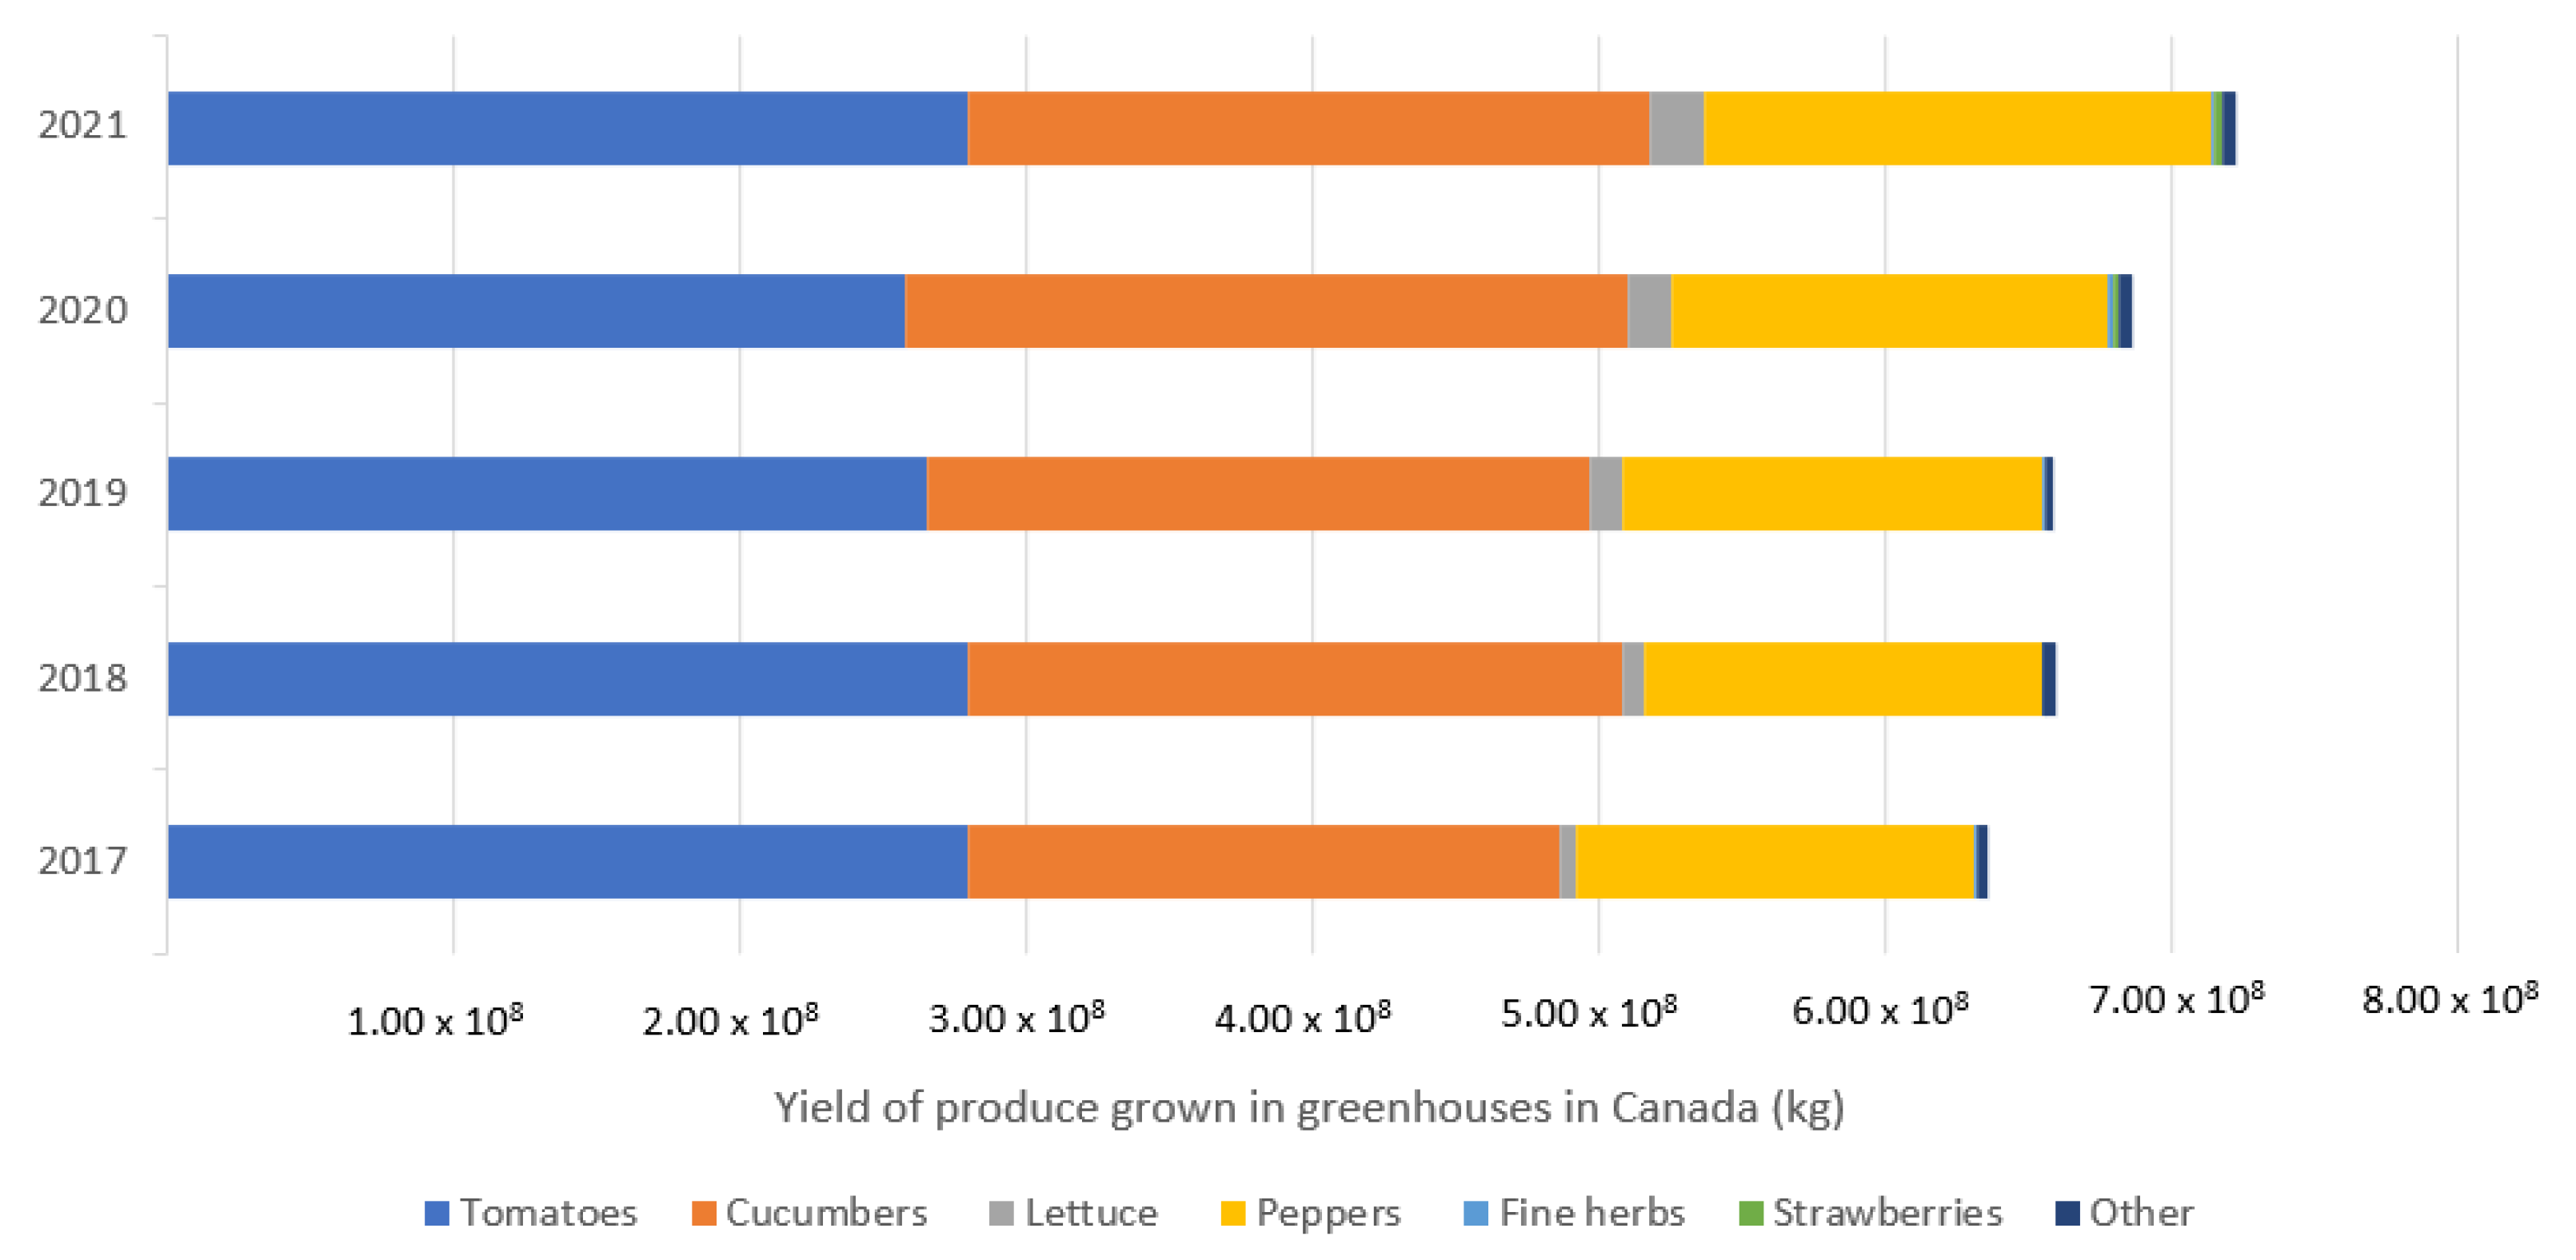
The controlled environment agriculture industry is growing, as it is a solution to increasing food supply chain resiliency and providing ultra-local food production opportunities. With the world population surpassing 8 billion in 2022 and increased instability in field agriculture production, it is evident alternative food production systems will be key moving forward [1]. Greenhouses are currently the most abundant form of CEA in Canada: over 650,000 metric tonnes of fresh produce worth over CAD 1.8 billion were produced in 2020 [2,3]. The top three crops produced in greenhouses are tomatoes (Lycopersicon esculentum), cucumbers (Cucumis sativus), and peppers (Capsicum annuum), which accounted for 96.1% of the market share by yield in 2020 (Figure 1) [2]. Indoor plant environments (IPEs), which includes vertical farms, are more recently growing into a commercially viable industry. In 2021, the global vertical farming industry had an estimated value of nearly USD 3.5 billion, with projections it will grow to over USD 20 billion by 2029 [4]. There is immense opportunity for the industry, although it must focus on resource use efficiency to prosper [5,6].
Indoor plant production is not a new concept, but it has progressed rapidly into large-scale production facilities in recent years. Because of the industry’s novelty, there is no current consensus on terminology. Vertical farms (VF), indoor plant environments (IPE), plant factories, plant factories with artificial lighting (PFAL), controlled or closed environment plant production (CEPP), controlled environments with artificial lighting (CEAL), or controlled environments with electrical lighting (CEEL) are all synonymous [7]. Regardless of terminology, these systems are closed from the exterior with controlled input and output, relying solely on electrical lighting, mainly light-emitting diodes (LEDs). Grow systems are exclusively hydroponic and employ the vertical dimension by stacking racks or vertical walls. This utilization of vertical space drastically increases the yield per area [8]. This high density is key to the feasibility and profitability of vertical farms, as electrical inputs are higher compared to greenhouse production, due to complete reliance on electrical lighting greenhouses [6]. Initial lighting setups and operational costs remain important barriers to driving profitable controlled environment agriculture forward. Yet, lighting systems in controlled environments are evolving, and improvements to LED technology are making production in indoor plant environments more feasible. Traditional lighting in greenhouses includes high-intensity discharge (HID) (high-pressure sodium (HPS) or metal halide (MH)) lamps and fluorescent fixtures [9]. Compared to HPS, LEDs require a higher investment cost at purchase but require less energy input and costs, in addition to a much longer lifespan [9,10]. The narrow wavelength spectrum of LEDs allows for high j and increases overall efficiency. Ample research into the impact of LED spectra on photosynthesis and growth is ongoing, and with it will come further ability to control growth rate, morphology, and any beneficial secondary metabolites [11]. Beyond the light spectrum, photoperiod (length of light) and intensity (amount of light) are both influential in plant growth. LED lighting requires the largest portion of electricity in plant factories, leading to a large proportion of cost [6]. As such, it is imperative that all aspects of lighting are optimized. To provide growers with more information that might lead to reduced light costs and higher quality produce, this comprehensive review compiles recent findings on the impact of lighting schedule/regime on growth (yield and leaf morphology), produce quality (leaf coloration and secondary metabolites), and development.
The literature search was performed using Scopus, Web of Science, and Google Scholar. Literature from the past 10 years, from January 2012–December 2022, inclusively, was examined for this review. Crops included are horticultural, ornamental, or the model plant Arabidopsis (Arabidopsis thaliana), grown from seed (not grafted crops). For Section 3.1, selection was based on a consistent research methodology providing the same total daily light integral (DLI) and light spectrum with photons distributed differently with varying intensity and duration (photoperiod). For Section 3.2, selection was based on methodology and experiment design, including lighting trials that provided the same total amount of light, at the same intensity, total photoperiod and spectrum delivered with multiple light/dark cycles over 24 h (cyclic lighting regimes). In Section 3.3 the literature selected was based in experimental design, including intermittent and fluctuating lighting with light intervals from 1 min to 60 min, and at least one extended dark period each 24 h (intermittent and fluctuating lighting regimes).
2. Overview of Lighting and Photobiology in Indoor Plant Environments
Light drives photosynthesis, and adequate levels are vital for producing high yields and good quality crops. Photosynthetically active radiation (PAR) is the region of the electromagnetic spectrum contributing to plant growth, ranging from 400–700 nm [12]. A growing body of evidence investigating the impact of the LED light spectrum on plant growth has led some researchers to call for a new definition of ePAR (400–750 nm), which includes far-red photons [13]. Daily light integral (DLI) is the total amount of PAR delivered to an area over a day, expressed as mol·m−2·d−1. Light intensity, known as photosynthetic photon light intensity (PPFD), expressed as µmol·m−2·s−1, and the length of the light period (photoperiod) contribute to the total DLI. In indoor plant environments, photoperiods are generally between 12 and 18 h, and PPFD ranges from 200–600 µmol·m−2·s−1 [14]. The ideal DLI for leafy greens is 8–14 mol·m−2·d−1, delivered at a PPFD of 150–250 µmol·m−2·s−1 across a 16 h photoperiod [15,16].
The photosynthetic light response curve demonstrates the relationship between light intensity and net photosynthetic rate. When light levels are zero or very low, the net carbon assimilation rate is zero or negative, as dark respiration is occurring. The light compensation point (LCP) is the light intensity where respiration and photosynthesis rates are equal. The minimum PPFD that produces the maximum photosynthetic rate is the light saturation point (LSP) [17,18]. This is influenced by the total amount of photosynthetic material in the plant tissue, and so will shift as a plant grows. At this intensity, light is no longer limiting the rate of photosynthesis, but the rate of the carbon cycle is limiting [19]. At intensities much greater than the LSP, photoinhibition occurs, causing damage to the photosynthetic apparatus and a reduction in plant growth. Under excessive light, the rate of energy transfer to PSII is faster than the utilization rate, so excess energy must be dissipated through heat via non-photochemical quenching (NPQ) [17]. Without dissipating excess energy, photo-oxidative stress accumulates in the thylakoid membrane leading to photoinhibition of PSII and ultimately inhibiting photosynthesis [20,21]. Plants adapt to adverse light conditions [22]. The light compensation point was of romaine lettuce (Lactuca sativa) which was lowest when grown at 100 µmol·m−2·s−1 when compared to those grown at 600 µmol·m−2·s−1, although the highest was from growth at 350 µmol·m−2·s−1 and 500 µmol·m−2·s−1 [18].
As DLI increases, yield increases as well, regardless of the photoperiod and PPFD [14,23,24]. Increasing photoperiod while maintaining a PPFD of 400 µmol·m−2·s−1 affected a linear increase for lettuce yield, leaf number, and area between 12 and 18 h, while a 24 h photoperiod had unchanged dry yield but reduced leaf number and area [25]. Low light induces various plant morphological adaptations to optimize the use of available light, similar to a shade response [21]. This happens under a decrease in the red:far-red (R:Fr) ratio, inducing a shade avoidance response [26,27]. At the photosynthetic level, the number of PSI increases relative to PSII [26]. Inversely, there is an increase in LHCII and a decrease in LHCI. It is hypothesized that the decrease in PSII is to conserve resources while an increase in PSI supports the production of ATP and NADPH through cyclic electron flow [26,28]. These low light or shaded environments produce thinner leaves with high specific leaf area (SLA), the ratio of area to dry mass of leaves [29]. Low light produces larger leaves to increase the photosynthetic area in lettuce [30].
3. Light Tuning in Closed Environment Plant Production
3.1. Photoperiodic and Intensity Effects under Constant Daily Light Integral
Total DLI is prioritized for production in indoor plant environments, but both the variable photoperiod and PPFD determine this production. Ample research into optimizing all aspects of lighting in indoor plant environments, including investigating whether, under constant DLI, higher intensity and shorter photoperiods are advantageous over lower intensity longer photoperiods. Research shows that constant DLI comprised of various photoperiod and PPFD lead to changes in yield, leaf, and plant morphology, and photosynthetic efficiency [31,32,33]. Using lower intensity could reduce the number of light fixtures required in a vertical farm establishment, potentially reducing capital costs.
When testing the impact of extended photoperiod with lower light intensity, yields are generally greater. Under constant DLI, longer photoperiods/lower intensity increased fresh and dry shoot mass in lettuce, mizuna (Brassica rapa ‘japonica’), cucumber (Cucumis sativus) seedlings, nasturtium (Tropaeolum majus), rudbeckia seedlings (Rudbeckia fulgida ‘Goldstrum’), strawberry (Fragaria x ananassa) and stevia (Stevia rebaudiana) [32,34,35,36,37,38,39,40]. In contrast, watercress (Nasturtium officinale), leaf mustard (Brassica juncea), red mustard (Brassica juncea) and kale (Brassica oleracea) showed no difference in fresh mass grown under varying photoperiods and intensity with constant DLI [41,42]. Overall, the vast majority of crops responded to longer photoperiods and lower intensity with higher yields.
Plants’ sessile nature causes them to react to environmental light by maximizing light capture and efficiency with changes in growth, morphology, and photosynthetic capabilities. Rudbeckia seedlings’ leaf area increased with a 15 and 18 h photoperiod but decreased under 12 h and 21 h photoperiods with a DLI of 12 mol·m−2·d−1 [32]. Cucumber seedlings’ leaf area and stem diameter were maximized with a 16 h photoperiod (200 µmol·m−2·s−1 PPFD) compared to photoperiods ranging from 7 to 22 h with a DLI of 11.5 mol·m−2·d−1 [39]. Lettuce and rudbeckia leaf area increased under an extended photoperiod and lower intensity with a DLI of 17 and 12 mol·m−2·d−1, respectively [32,33]. However, no difference in total or individual leaf area was found in lettuce ‘Little Gem’ or mizuna when increasing the photoperiod under a DLI of 17 mol·m−2·d−1 [35]. Typically, leaf area will increase under lower light conditions to increase light interceptions. Cho et al. reported a greater leaf area under 150 µmol·m−2·s−1 PPFD compared to 200 µmol·m−2·s−1 for photoperiods ranging from 12–24 h [43]. Although, under longerphotoperiods, the change in leaf area between the intensity treatments increased, indicating that the total light or photoperiod has an interaction effect with leaf area and intensity.
Lower intensity and longer photoperiods under constant DLI lead to an overall improvement in photosynthetic efficiency. Light interception increased in lettuce ‘little gem’ and mizuna under a DLI of 16 mol·m−2·d−1, as photoperiod increased from 10 to 20 h [35]. SPAD and chlorophyll content index reportedly increase in lettuce (cvs. ‘Little Gem,’ ‘Rouxai,’ ‘Coastal Star), mizuna, and rudbeckia with longer photoperiod and lower intensity under constant DLI light conditions [35,40,44]. No change in SPAD for watercress was reported under a DLI of 11.52 mol·m−2·d−1 [41]. Chlorophyll production is light-regulated, so the extended photoperiod allows for more chlorophyll production, even as PPFD decreases [35].
Constant photoperiod with increasing PPFD increases SLA [45]. In contrast, under constant DLI, a decrease in PPFD and longer photoperiod typically decreases SLA. There was a decrease in SLA in rudbeckia and cucumber seedlings as photoperiod increased and PPFD decreased [32,39]. However, increased light intensity typically leads to a higher SLA, indicating a thicker leaf [29]. Lettuce grown at 400 µmol·m−2·s−1 for photoperiods varying from 12–24 h had lower SLA as the photoperiods increased [25]. Gao et al. reported that spinach grown under a 16 h photoperiod and increasing intensity showed a decrease in SLA as intensity and DLI increased [24]. These results indicate that total DLI has a more substantial influence on SLA than how it is delivered. Kelly et al. reported the impact of increasing DLI from 6.9 to 8.6 mol·m−2·d−1 by increasing the PPFD or lengthening the photoperiod; lettuce dry mass was significantly higher under the extended photoperiod but not higher light intensity, indicating the overall length of light is more impactful than higher intensities on leaf thickness [44]. SLA measures the leaf area available for light capture per unit of dry mass [39]. A decrease in SLA under high light intensity and increasing DLI is partially attributed to an increase in number and/or size of palisade cells, while under constant DLI, the decrease in SLA with longer photoperiods/lower intensity may increase in chlorophyll content [29,39]. A summary of the results is presented in Table 1.

Table 1.
Overview of grow trials with the same daily light integral (DLI) and variable photosynthetic photon flux density (PPFD) and photoperiod (↑: increase, Δ: same as control, ↓: decrease, cv: cultivar, ns: not specified).
Table 1.
Overview of grow trials with the same daily light integral (DLI) and variable photosynthetic photon flux density (PPFD) and photoperiod (↑: increase, Δ: same as control, ↓: decrease, cv: cultivar, ns: not specified).
| Photoperiod (h) and PPFD (µmol·m−2·s−1), Respectively | DLI (mol·m−2·d−1) | Crop and Cultivar | Light Source and Spectrum | Crop Response to Longer Photoperiod—Lower Intensity | Reference |
|---|---|---|---|---|---|
| 10, 12, 14, 16, 18, 20 h 444, 370, 318, 278, 247, 222 µmol·m−2·s−1 | 16 | Lettuce (Lactuca sativa ‘Little gem’) Mizuna (Brassica rapa ‘japonica’) | Full-spectrum white LED | Light interception ↑ Chlorophyll content index ↑ Quantum yield of PSII ↑ Aerial biomass (dry) ↑ Instantaneous CO2 assimilation ↓ Total leaf area Δ Area per leaf Δ | [35] |
| 12, 15, 18, 21 h 278, 222, 185, 159 µmol·m−2·s−1 | 12 | Rudbeckia (Rudbeckia fulgida ‘Goldsrum’) seedlings | Sunlight and supplemental cool white LED | Shoot dry mass ↑ Root dry mass ↑ Leaf area ↑ Chlorophyll content index ↑ Specific leaf area ↓ | [32] |
| 8, 12, 16, 24 h 350, 230, 175, 115 µmol·m−2·s−1 | 10 | Strawberry (fragaria x ananassa ‘Elan’ and ‘Yotsuboshi’) | Sunlight or LED | Dry mass ↑ Leaf area ↑ Time to flower bud initiation (‘Elan’ only) ↓ | [38] |
| 12, 16 h 200, 150 µmol·m−2·s−1 | 8.64 | Lettuce (Lactuca sativa ‘Ziwei’) | Fluorescent and LED (R:B 1.2, 1.8, 2.2) | Root fresh mass ↑ Root dry mass ↑ Soluble sugar content Δ | [36] |
| 7, 10, 13, 16, 19, 21 h 457, 320, 246, 200, 168, 145 µmol·m−2·s−1 | 11.5 | Cucumber (Cucumis sativus ‘Tianjiao No 5′) seedlings | Full-spectrum white LED | Pigment content ↑ Fresh and dry mass ↑ Cellulose content ↑ Plant height ↓ Hypocotyl length ↓ Specific leaf area ↓ Sucrose content ↑, peaked at 16 h | [39] |
| 16, 20, 24 h 144, 180, 120 µmol·m−2·s−1 | 10.4 | Lettuce (Lactuca sativa ‘Rex’ and ‘Rouxai’) | Warm white and red LEDs | Leaf length (‘Rex’ only) ↓ SPAD (‘Rouxai’ only) ↑ | [44] |
| 7, 10, 13, 16, 19, 21 h 595, 416, 230, 260, 219, 189 µmol·m−2·s−1 (DLI 15 mol·m−2·d−1) 794, 555, 427, 347, 292, 252 µmol·m−2·s−1 (DLI 20 mol·m−2·d−1) | 15 20 | Lettuce (Lactuca sativa ‘Green towers’) | Cool white LED | Quantum yield of PSII ↑ Daily photochemical integral ↑ | [46] |
| 12, 16 h 200, 150 µmol·m−2·s−1 | 8.64 | Lettuce (Lactuca sativa ‘Coastal Star’) | LED (R:B 2:1) | Fresh and dry mass ↑ SPAD ↑ PN max ↑ | [40] |
| 10, 12, 14, 16 h 176, 146, 125, 111 µmol·m−2·s−1 | 6.35 | Cucumber (Cucumis sativus ‘Yuexiu No. 3′) seedlings | LED (R:B 1:1) | Shoot fresh mass Δ Shoot dry mass ↑ Root fresh and dry mass ↑ Leaf area ratio ↓ Soluble sugar content ↑ Soluble protein content ↓ | [47] |
| 8, 12, 16 h 249, 165, 125 µmol·m−2·s−1 | 7.2 | Stevia (Stevia rebaudiana cv ns) | LED (R:B:G 4:1:1) | Leaf and stem fresh mass ↑, lowest at 12 h Photon conversion efficiency ↑ Metabolite yield ↑ | [34] |
| 12, 16, 20, 24 h 266, 200, 160, 133 µmol·m−2·s−1 | 11.52 | Watercress (Nasturtium officinale cv ns) | LED (R:B 7:3) | Shoot fresh and dry mass, reduced only in 24 h Stem length Δ SPAD Δ Net photosynthetic rate ↓ Stomatal conductance ↓ | [41] |
| 10, 14, 18, 22 h 280, 200, 155, 127 µmol·m−2·s−1 | 10 | leaf mustard (Brassica juncea ‘Czern’) red mustard (Brassica juncea cv ns) kale (Brassica oleracea ‘Red Russian’) | White fluorescent | Shoot fresh weight Δ (all) Leaf number ↓ (peaked at 14, red mustard and kale) Leaf area Δ (all) | [42] |
3.2. Cyclic Lighting Regimes
A novel factor of closed plant production is the unlinking from the solar circadian cycle, allowing growers to utilize various lighting regimes. Cyclic lighting regimes use more than one light-dark cycle over 24 h, with light and dark period lengths on the hours’ time scale. A light-dark cycle refers to one alternation of light and dark, which is naturally 24 h. Generally, experiments examining different light/dark (L/D) cycle trials have the same amount of light delivered over 24 h, usually with the same total hours of light spread differently throughout the day. These light treatments provide the potential to utilize off-peak electricity rates while maintaining high-quality crops.
Overall, the highest yields and quality are reached by maintaining one long cycle. Lettuce yield was highest for 1 cycle (16/8) compared to 2 (9/3) and 3 (6/2) cycles [48], for 1 cycle of 8/16 compared to 4/8 and 2.67/5.33, and a light/dark cycle of 12/12 compared to 6/6 and 3/3 [48,49]. Increasing the number of cycles and decreasing the light and dark period length from 2 cycles (6/6) to 4 cycles (3/3) and 3 cycles (4/4) reduced biomass accumulation, leaf area, and maximum photosynthetic rate in lettuce [50,51]. SPAD was higher in 12/12 compared to 6/6 and 3/3; however, no change in SPAD was reported by Hang et al. (6/6/ vs. 4/4) and Kang et al. (18/6, 9/3, 6/2) [48,50,51]. The total chlorophyll content was higher in 8/4, 3/1.5, and 2/1 light-dark cycles compared to one cycle of 16/8, which is inconsistent with other lettuce studies [52]. Stevia presented similar results as lettuce as fresh yield was reduced when grown under cycles of 5.3/2.7, although dry yield was unchanged when compared to a standard 18/6 cycle [34]. In contrast, lettuce yield increased under 4/2, 3/1.5, and 2/1 light-dark cycles [52]. Chi et al. reported the impact of 12/12 and 6/6 on tomato (Lycopersicon esculentum ‘Momotarou’) and hot pepper (Capsicum annuum ‘Nockkwang’), observing a decrease in dry yield, plant height, and leaf area in tomato under the reduced photoperiod, but no impact on peppers [53]. Both tomato and pepper experienced a reduction in chlorophyll content under the 6 h cycle. García-Caparrós et al. reported no impact on tomato seedling growth, while cucumber yield decreased as the number of cycles increased from 18/6 to 9/3 and 6/2 [54]. Both tomato and cucumber seedlings experienced a decrease in chlorophyll concentration.
Once illuminated, the rate of photosynthesis of dark-adapted leaves has a lag period, referred to as photosynthetic induction, which is rate limited due to the initiation of enzyme activity in the carbon cycle and stomatal opening [50,55]. Approximately 10 min is needed to reach 80% of the maximum photosynthetic rate [50]. Stomatal opening limits the increase in rate from 80–100% [55,56]. The stomatal aperture further limits stomatal conductance; when examining the photosynthetic induction rate of wild-type and flacca mutant (stomata always open) tomatoes, wild-type stomatal conductance and thus photosynthetic induction was significantly decreased when compared to the mutant [57]. Stomatal conductance in lettuce was lower in a 4/4 light-dark cycle compared to 6/6, indicating a slowing of photosynthetic induction upon illumination for shorter light cycles [50]. Increasing the number of light cycles increases the total photosynthetic lag time across the total light period over 24 h, reducing total net photosynthesis over a grow cycle. The light response curve of three light-dark cycles (12/12, 6/6, and 3/3) were the same net photosynthetic rate from 0–200 µmol·m−2·s−1, above which the net photosynthetic rate of 3/3 became significantly reduced compared to 6/6 and 12/12 [51]. Rengasamy et al. reported a decrease in photon use efficiency, along with biomass and metabolite electrical use efficiency with multiple cycles compared to one in stevia [34]. The net photosynthetic rate, LSP and LCP, were reduced in 3/3 and 6/6 compared to 12/12. This indicates that shorter light cycles have lower photosynthetic capacity overall. Zhou et al. hypothesize that this may be because of the increased time with a reduced photosynthesis rate due to photosynthetic induction [51].
Plants have a circadian clock that synchronizes physiological processes with natural fluctuations in daily light and influences gene expression, stomatal opening, and other physiological processes [58]. When grown in synch with the innate 24 h circadian rhythm, Arabidopsis had enhanced chlorophyll levels and growth [58]. Lettuce grown under photoperiods of 22–24 h had enhanced biomass accumulation under a 22-h and 23-h photoperiod compared to 23 and 24 h [59]. Under continuous lighting (24-h photoperiod), lettuce with bioluminescent markers indicated gene expression under circadian control was significantly reduced within 72 h [60]. This research suggests that it is possible to entrain lettuce’s circadian rhythm to maintain high quality if grown under different circadian rhythms. Although in regards to increasing light-dark cycles, some hypothesize that intermittent treatments closest to the natural cycle will provide the best growth [51]. A hypothesis that Chen et al. report states that under the right balance of light and dark periods, dark-induced metabolic regulations improve growth [61]. These results are summarized in Table 2.
Table 2.
Overview of plant response to cyclic lighting schedule compared to control (↑: increase, Δ: same as control, ↓: decrease, cv: cultivar, ns: not specified).
Table 2.
Overview of plant response to cyclic lighting schedule compared to control (↑: increase, Δ: same as control, ↓: decrease, cv: cultivar, ns: not specified).
| Light/Dark Cycles (h/h) | Light Intensity and Spectrum | Crop and Cultivar | Crop Response to Longer Light Cycles/Fewer L/D Cycles | Reference |
|---|---|---|---|---|
| 12/12, 6/6, 3/3 | 250 µmol·m−2·s−1 R:B (83:17) | Romaine lettuce (Lactuca sativa cv ns) | Response to a longer light cycle Electron transfer potential ↑ Chlorophyll content ↑ Leaf area ↑ Biomass ↑ Root/shoot ratio ↓ Specific leaf area ↓ Light saturated net photosynthetic rate ↑ Light saturation point ↑ Light compensation point↑ | [51] |
| 18/6, 9/3, 6/2 | 732 µmol·m−2·s−1 LED (R:B 5:2) | Tomato (Solanum lycopersicum ‘Caniles’) Cucumber (Cucumis sativys ‘Litoral’) | To longer light cycle: Tomato: Chlorophyll content ↓ Cucumber: Dry yield ↓ Chlorophyll content ↓ | [54] |
| 12/12, 6/6, 3/3 | 200 µmol·m−2·s−1 LED R:B (83:17) | Lettuce (Lactuca sativa ‘Adriana’ and ‘Coastal Star’) | Longer light-dark cycle: Biomass ↑ Leaf area ↑ Leaf L:W ratio ↑ Photosynthetic rate ↑ Stomatal conductance ↑ | [50] |
| 18/6, 9/3, 6/2 | 200–290 µmol·m−2·s−1 LED R:B:W (8:1:1) | Lettuce (Lactuca sativa ‘Hongyeom Jeockchukmyeon’) | Low intensity, response to longer photoperiod: Dry yield ↑ Anthocyanin content ↑ Leaf length ↓ Photosynthetic rate ↑ High intensity, response to longer photoperiod: Anthocyanin content ↓ Photosynthetic rate ↑ | [48] |
| 8/4, 16/8 | 200 µmol·m−2·s−1 LED (R:B 4:1) | Lettuce (Lactuca sativa ‘Yidali’) | Response to longer photoperiod, fewer L/D cycles Fresh shoot and root mass ↓ Dry root and shoot mass ↓ Leaf area ↓ Specific leaf mass Δ Chlorophyll content ↓ Soluble sugars ↓ Soluble proteins Δ | [62] |
| 5.3/2.7, 16/8 | 125 µmol·m−2·s−1 LED (R:B:G 4:1:1) | Stevia (Stevia rebaudiana cv ns) | Response to longer photoperiod, fewer L/D cycles Leaf and stem fresh mass ↑ Leaf dry mass Δ Photon conversion efficiency ↑ Biomass EUE ↑ Metabolite EUE ↑ Metabolite yield ↑ | [34] |
3.3. Intermittent and Fluctuating Lighting Regimes
Intermittent lighting and fluctuating lighting include short changes in light intensity on the scale of milliseconds to about one hour. Fluctuating light has large shifts in intensity while intermittent light turns on and off. Intervals at rates <1 s are known as pulsed lighting and are an application used to reduce the required energy for LED; however, this concept will not be further discussed in this paper. This review instead focuses on intervals from 60 s to 60 min. Much of the research exploring intermittent and fluctuating lighting has focused on the impact of sun specs (short bursts of high intensity solar light due to foliage movement or reduced shading) and natural variation in light intensity on plant growth. The potential application of these lighting regimes in closed plant production are being scrutinized. Overall, intermittent and fluctuating lighting has found a decrease in the overall growth of the crops exposed when they are grown in indoor plant environments.
It appears that intermittent lighting can both increase or decrease yield [52,63,64]. These trends are likely impacted by light interval duration and potentially dark interval. For lettuce grown under intermittent lighting with the same DLI, the 15 min/15 min intervals over 16 h resulted in a decrease in yield, while 60 min/30 min intervals over 24 h increased in yield [52,63]. During the 15 min light period, the net photosynthetic rate was slow to increase and did not reach a steady state, indicating that a 15 min light period is too short to support quality growth. Avgoustaki et al. grew basil in a growth chamber with 4 h of continuous light followed by 4 h of intermittent lighting (10 min light/50 min dark), repeating this cycle 3 times daily (no continuous dark period provided) [64]. Compared to the standard 16/8 lighting regime, there was no significant impact on growth. The net assimilation rate during the 10 min light interval was lower than control but similar during the 4 h light period, while the overall average was lower for the intermittent treatment. Although the total illuminated time for intermittent lighting was 14 h, compared to 16 h, total dry biomass was higher for intermittent. These results suggest that intermittent lighting mixed with longer cycles does not decrease the photosynthetic ability of plants.
Fluctuating light research originally aimed to reproduce natural variations in outdoor lighting environments and to compare data from in natural light (greenhouse) to constant light (growth chambers) environments. Sizeable light intensity fluctuations of at least 60 s on horticultural crops reduced dry yield in basil (Ocimum basilicum ‘Aroma 2′) and lettuce ‘Galiano’ [65]. Similar results are reported for Arabidopsis in fluctuating light with decreased yield and leaf area [66,67]. In Arabidopsis, ETRII and light absorption were significantly reduced; however, the net photosynthetic rate/leaf area was not significantly changed [66,67]. In a review and meta-analysis of six studies investigating photosynthetic acclimation to fluctuating light, Morales and Kaiser reported that many trends observed were similar to shade acclimated plants including increased SLA and chlorophyll a/b ratio [68]. Bhuiyan and van Iersel examined the impact of fluctuating high light intensity every 15 min over a 16 h period on lettuce growth [63]. Each trial received the same DLI over the same photoperiod but shifts in intensity ranged from the control (no change in intensity), 200 µmol·m−2·s−1, minimal change (240/160, 280/120, 320/80 µmol·m−2·s−1), and extreme fluctuation between 360 and 40 µmol·m−2·s−1 and 400 and 0 µmol·m−2·s−1 every 15 min for 16 h. There was a significant impact on growth, morphology, and photosynthetic capacity on the most extreme fluctuations (400/0, 360/40), although slightly lesser so on 360/40 than 400/0, indicating intermittent light impact growth differently than fluctuating. Results are summarized in Table 3.
Table 3.
Overview of impact intermittent and fluctuating lighting with light intervals of 1 min to 60 min and at least one dark period on horticultural crops and model plant Arabidopsis (↑: increase, Δ: same as control, ↓: decrease, cv: cultivar, ns: not specified).
Table 3.
Overview of impact intermittent and fluctuating lighting with light intervals of 1 min to 60 min and at least one dark period on horticultural crops and model plant Arabidopsis (↑: increase, Δ: same as control, ↓: decrease, cv: cultivar, ns: not specified).
| Light Treatment | DLI (mol·m−2·d−1), Quality, and Duration | Crop | Impact of Fluctuating Treatment Compared to Control | Reference | |
|---|---|---|---|---|---|
| Intermittent | 15 min light/dark intervals over 16 h: 200/200 (control), 240/160, 280/120, 320/80, 360/40, 400/0 µmol·m−2·s−1 | 11.5 mol·m−2·d−1 LED full spectrum 6 weeks | Lettuce (Lactuca sativa ‘Little Gem’ and ‘Green Salad’) | Chlorophyll content index ↓ Leaf area ↓ Dry mass ↓ Specific leaf area Net assimilation rate ↓ | [63] |
| [4 h light × 1, 10 min light/50 min dark × 4] × 3 16/8 control | 25 (intermittent), 29 (control) mol·m−2·d−1 LED (R:B 2:1) 24 days | Genovese basil (Ocimum basilicum cv ns) | Net photosynthetic rate ↓ Dry mass ↑ Chlorophyll content index Δ | [64] | |
| 60 min light 200 µmol·m−2·s−1/30 min dark over 24 h ·16/8 @ 200 µmol·m−2·s−1 control | 11.5 mol·m−2·d−1 LED (R:B 9:1) 60 days | Lettuce (Lactuca sativa ‘Green Oak Leaf’) | Fresh mass ↑ Dry mass↑ Plant height ↑ Leaf number Δ Chlorophyll content Δ Soluble sugar Δ | [52] | |
| Fluctuating | Low and high intensity dynamic fluctuations (mimic daylight) low: 100–750 (mean 230) µmol·m−2·s−1, over 12 h high: 100–1500, (mean 460) µmol·m−2·s−1, over 12 h control: 460 µmol·m−2·s−1 constant 12 h 230 µmol·m−2·s−1 constant 12 h | 10 (low), 20 (high) mol·m−2·d−1 Full spectrum white LED 27 days | Arabidopsis Arabidopsis thaliana) | Specific leaf area ↑ Light absorption ↓ Leaf area ↓ Dry mass ↓ Photosynthetic rate/leaf area Δ | [66] |
| [1 min 900, 4 min 90 (mean 252 µmol·m−2·s−1)] over 12 h 250 µmol·m−2·s−1 over 12 h | 10 mol·m−2·d−1 Full-spectrum white LED 14 days | Arabidopsis Arabidopsis thaliana) | Projected leaf area ↓ Operating efficiency of PSII ↓ | [67] | |
| Random 3–6 min ranging from 90–420 (avg 180) µmol·m−2·s−1 over 12 h · 180 µmol·m−2·s−1 over 12 h | 10.4 mol·m−2·d−1 LED spectrum not specified 28 days | Basil (Ocimum basilicum ‘Aroma 2′) Lettuce (Lactuca sativa ‘Galiano’) | Lettuce Fresh and dry mass ↓ Leaf number ↓ Basil Dry mass ↓ | [65] | |
| [15 h 150 µmol·m−2·s−1, 60 min 500 µmol·m−2·s−1] × 1, 8 h dark [5 h 150 µmol·m−2·s−1, 20 min 500 µmol·m−2·s−1] × 3, 8 h dark [2.5 h 150 µmol·m−2·s−1, 10 min 500 µmol·m−2·s−1] × 6, 8 h dark [1.25 h 150 µmol·m−2·s−1, 5 min 500 µmol·m−2·s−1] × 12, 8 h dark Control 170 µmol·m−2·s−1 16 h, 8 h dark | 9.79 mol·m−2·d−1 LED (R:B 4:1) 20 days | Lettuce (Lactuca sativa ‘Zishan’) | Fresh root and shoot mass Δ Dry root and shoot mass Δ Soluble sugars ↓ Soluble protein Δ | [69] |
4. Impact on Capital and Operational Expenditure
4.1. Impact on Capital Expenditure (CAPEX)
The investment in LED lighting is one of the largest capital expenditures incurred while establishing a vertical farm. Economic analysis indicates lighting equipment constitutes approximately 30% of all startup costs [70,71]. If a farm requires lower light intensity for production, the number of lights required is lower leading to lower capital costs [32]. With sufficient planning, the lighting system can be designed to use lower intensity, longer photoperiod, and a farm can reduce the number of lights required.
4.2. Impact on Operational Expenditure
Lighting constitutes up to 30% of operating costs in greenhouses [71]. Electricity costs constitute from 40–60% of operational expenses in IPEs [70,72], with lighting accounting for approximately 25% of production costs [64,73,74]. Optimizing lighting allows for the minimum input necessary to have a profitable yield. Generally, higher voltage input allows for high PPF output from lights [75]. Another consideration is the cost of cooling LEDs, which ensures adequate light intensity and a long fixture life [76]. LED electrical cooling loads are not insignificant, and can equate to nearly half that of powering the lights themselves [6].
Variable electricity costs are offered in many regions as a response to shifts in momentary supply or total electricity used by a consumer. For example, Denmark has a system which switches hourly based on the previous day’s usage [72]. The cost of lighting for basil production in a vertical farm in Denmark was reduced by an average of 20% across the year by using electricity cost adaptive lighting [72]. A similar study performed in Russia examined how to reduce operating costs based on available billing options. The operations costs of a 16/8 L/D schedule at different times of the day were examined and compared to 4/2 and 8/4 cyclic lighting regimes [77]. They determined that a cyclic regime with 8/4 could reduce costs by over 13%. These are examples of how intermittent lighting can be used to reduce the cost of electricity while using the same total light, although it is location dependent.
Results discussed in Section 3.1 indicate that lower light intensity over longer photoperiods produce improved crop growth compared to higher intensity and shorter photoperiod, indicating lighting costs can be used with this technique in some areas. Remgasamy et al. investigated the impact of varying photoperiod and intensity under constant DLI on stevia growth and found the longest photoperiod tested (16 h) had the highest photon conversion efficiency [34]. This led to an increase in overall biomass and metabolite electrical use efficiency.
5. Conclusions and Future Outlook
Ongoing research investigating the impact of varying light delivery to crops in controlled environments contributes to our understanding of plant metabolism and can further improve crop production optimization. Findings indicate that total DLI is not the only factor influencing crop growth and morphology; how light is delivered is also an important factor influencing crop development. More specifically, (1) constant DLI with extended photoperiod results in higher dry mass and a larger leaf area; (2) growth of popularly consumed crops (including cucumber and tomato) is reduced under a low-frequency cyclic lighting regime (<4 cycles per day), as opposed to lettuce crops grown under a cyclic lighting regime higher than 4 cycles; and (3) fluctuating lighting regimes consistently reduce yield in different model plants, whereas conflicting results for intermittent lighting regimes are reported, most likely linked to light interval. This provides an opportunity for more control over crop growth, possibly allowing growers to optimize available lighting and minimize cost by potentially utilizing off-peak hours, reducing the light intensity overall, and implementing dynamic lighting regimes. Future research should focus on the impact of the discussed light regimes on commonly produced crops in IPEs, and how other controllable factors (temperature, VPD, CO2) interact with different light treatments. A focus could be placed on identifying the optimal length of light and dark intervals in intermittent lighting to improve growth and help elucidate how these intervals impact metabolic processes.
Although beyond the scope for this review, it is worthwhile to mention the potential of machine learning on plant lighting research. As monitoring plant growth and its environment with different sensors and technologies has become a norm, these data not only allow growers and scientists to optimize operations but can identify growth patterns and predict plant growth. For instance, reinforcement learning can be implanted, where the system learns to control lighting conditions such as DLI and light/dark cycle while maximizing plant growth rate and quality at different growth stages. Furthermore, with sensor and plant growth data, a digital twin can be created to simulate and analyze plant growth and development in a virtual environment. This will greatly reduce time needed for research and development. In all, plant lighting research will provide more comprehensive and insightful information that reduces the cost of electrical lighting and leads to better profitability for the controlled environment farming industry.
Author Contributions
R.W. led the writing of this paper. B.-S.W., S.M. and M.L. were the major editors. B.-S.W. and M.L. contributed over 40% of the writing for the paper. M.L. is the correspondence point person. All authors contributed to the article and approved the submitted version. All authors have read and agreed to the published version of the manuscript.
Funding
This work was financially supported by Mitacs (grant number IT16220) and Gardyn Inc.
Data Availability Statement
Not applicable.
Conflicts of Interest
The authors declare that this study was funded in part by Gardyn Inc. The funder was not involved in study design, collection, data analysis, the drafting of this manuscript, or the decision to submit it for refereed publication.
References
- United Nations. World Population to Reach 8 Billion on 15 November 2022. Available online: https://www.un.org/en/desa/world-population-reach-8-billion-15-november-2022 (accessed on 27 December 2022).
- Statistics Canada. Table 32-10-0456-01 Production and Value of Greenhouse Fruits and Vegetables. Available online: https://www150.statcan.gc.ca/t1/tbl1/en/tv.action?pid=3210045601 (accessed on 17 June 2022).
- Milanes, C.; Kadir, T.; Lock, B.; Miller, G.; Monserrat, L.; Randles, K. Indicators of Climate Change in California; California Environmental Protection Agency: Sacramento, CA, USA, 2022.
- Fortune Business Insights. Vertical Farming Market Size, Share & COVID-19 Impact Analysis, by Type (Hydroponics, Aeroponic(Building-Based Vertical Farm and Shipping-Container Vertical Farm), by Component (Lighting SysteClimate Control, Sensors, and Others), and Regional Forecast, 2022–2029. 2021. Available online: https://www.fortunebusinessinsights.com/industry-reports/vertical-farming-market-101958 (accessed on 27 December 2022).
- Kikuchi, Y. Life Cycle Assessment. In Plant Factory; Kozai, T., Niu, G., Takagaki, M., Eds.; Academic Press: San Diego, CA, USA, 2016; pp. 321–329. [Google Scholar] [CrossRef]
- Graamans, L.; Baeza, E.; van den Dobbelsteen, A.; Tsafaras, I.; Stanghellini, C. Plant factories versus greenhouses: Comparison of resource use efficiency. Agric. Syst. 2018, 160, 31–43. [Google Scholar] [CrossRef]
- Kozai, T. Terms related to PFALs. In Plant Factory Basics, Applications and Advances; Kozai, T., Niu, G., Masabni, J., Eds.; Academic Press: San Diego, CA, USA, 2022; pp. 11–23. [Google Scholar] [CrossRef]
- Eaves, J.; Eaves, S. Comparing the Profitability of a Greenhouse to a Vertical Farm in Quebec. Can. J. Agric. Econ./Rev. Can. D’agroeconomie 2018, 66, 43–54. [Google Scholar] [CrossRef]
- Wu, B.-S.; Hitti, Y.; MacPherson, S.; Orsat, V.; Lefsrud, M.G. Comparison and perspective of conventional and LED lighting for photobiology and industry applications. Environ. Exp. Bot. 2020, 171, 103953. [Google Scholar] [CrossRef]
- Kusuma, P.; Pattison, P.M.; Bugbee, B. From physics to fixtures to food: Current and potential LED efficacy. Hortic. Res. 2020, 7, 56. [Google Scholar] [CrossRef] [Green Version]
- Zhen, S.; Kusuma, P.; Bugbee, B. Toward an optimal spectrum for photosynthesis and plant morphology in LED-based crop cultivation. In Plant Factory Basics, Applications and Advances; Kozai, T., Niu, G., Masabni, J., Eds.; Academic Press: San Diego, CA, USA, 2022; pp. 309–327. [Google Scholar] [CrossRef]
- Wu, B.-S.; Rufyikiri, A.-S.; Orsat, V.; Lefsrud, M.G. Re-interpreting the photosynthetically action radiation (PAR) curve in plants. Plant Sci. 2019, 289, 110272. [Google Scholar] [CrossRef]
- Zhen, S.; van Iersel, M.; Bugbee, B. Why Far-Red Photons Should Be Included in the Definition of Photosynthetic Photons and the Measurement of Horticultural Fixture Efficacy. Front. Plant Sci. 2021, 12, 693445. [Google Scholar] [CrossRef]
- Ahmed, H.A.; Yu-Xin, T.; Qi-Chang, Y. Optimal control of environmental conditions affecting lettuce plant growth in a controlled environment with artificial lighting: A review. S. Afr. J. Bot. 2020, 130, 75–89. [Google Scholar] [CrossRef]
- Dou, H.; Niu, G. Plant responses to light. In Plant Factory: An Indoor Vertical Farming System for Efficient Quality Food Production, 2nd ed.; Kozai, T., Niu, G., Takagaki, M., Eds.; Elsevier: Amsterdam, The Netherlands, 2020; pp. 153–166. [Google Scholar] [CrossRef]
- Albright, L.; Both, A.J.; Chiu, A.J. Controlling greenhouse light to a consistent daily integral. Trans. ASAE 2000, 43, 421–431. [Google Scholar] [CrossRef]
- Taiz, L.; Zeiger, E.; Moller, I.M.; Murphy, A. Fundamentals of Plant Physiology; Oxford University Press: Oxford, UK, 2018. [Google Scholar]
- Zhou, J.; Li, P.; Wang, J. Effects of light intensity and temperature on the photosynthesis characteristics and yield of lettuce. Horticulturae 2022, 8, 178. [Google Scholar] [CrossRef]
- Wareing, P.F.; Khalifa, M.M.; Treharne, K.J. Rate-limiting processes in photosynthesis at saturating light intensities. Nature 1968, 220, 453–457. [Google Scholar] [CrossRef]
- Ruban, A.V.; Johnson, M.P.; Duffy, C.D.P. The photoprotective molecular switch in the photosystem II antenna. Biochim. Biophys. Acta (BBA)—Bioenerg. 2012, 1817, 167–181. [Google Scholar] [CrossRef] [PubMed] [Green Version]
- Shafiq, I.; Hussain, S.; Raza, M.A.; Iqbal, N.; Asghar, M.A.; Raza, A.; Fan, Y.-F.; Mumtaz, M.; Shoaib, M.; Ansar, M.; et al. Crop photosynthetic response to light quality and light intensity. J. Integr. Agric. 2021, 20, 4–23. [Google Scholar] [CrossRef]
- Kami, C.; Lorrain, S.; Hornitschek, P.; Fankhauser, C. Light-regulated plant growth and development. Curr. Top. Dev. Biol. 2010, 91, 29–66. [Google Scholar] [CrossRef] [PubMed] [Green Version]
- Lefsrud, M.G.; Kopsell, D.A.; Kopsell, D.E.; Curran-Celentano, J. Irradiance levels affect growth parameters and carotenoid pigments in kale and spinach grown in a controlled environment. Physiol. Plant. 2006, 127, 624–631. [Google Scholar] [CrossRef]
- Gao, W.; He, D.; Ji, F.; Zhang, S.; Zheng, J. Effects of daily light integral and LED spectrum on growth and nutritional quality of hydroponic spinach. Agronomy 2020, 10, 1082. [Google Scholar] [CrossRef]
- Silva, L.M.; Cruz, L.P.; Pacheco, V.S.; Machado, E.C.; Purquerio, L.F.V.; Ribeiro, R.V. Energetic efficiency of biomass production is affected by photoperiod in indoor lettuce cultivation. Theor. Exp. Plant Physiol. 2022, 34, 265–276. [Google Scholar] [CrossRef]
- Bailey, S.; Walters, R.G.; Jansson, S.; Horton, P. Acclimation of Arabidopsis thaliana to the light environment: The existence of separate low light and high light responses. Planta 2001, 213, 794–801. [Google Scholar] [CrossRef]
- Cheng, M.-C.; Kathare, P.K.; Paik, I.; Huq, E. Phytochrome Signaling Networks. Annu. Rev. Plant Biol. 2021, 72, 217–244. [Google Scholar] [CrossRef]
- Walters, R.G. Towards an understanding of photosynthetic acclimation. J. Exp. Bot. 2004, 56, 435–447. [Google Scholar] [CrossRef]
- Evans, J.R.; Poorter, H. Photosynthetic acclimation of plants to growth irradiance: The relative importance of specific leaf area and nitrogen partitioning in maximizing carbon gain. Plant Cell Environ. 2001, 24, 755–767. [Google Scholar] [CrossRef]
- Galieni, A.; Stagnari, F.; Speca, S.; Pisante, M. Leaf traits as indicators of limiting growing conditions for lettuce (Lactuca sativa). Ann. Appl. Biol. 2016, 169, 342–356. [Google Scholar] [CrossRef]
- Milford, G.F.J.; Lenton, J.R. Effect of photoperiod on growth of sugar beet. Ann. Bot. 1976, 40, 1309–1315. [Google Scholar] [CrossRef]
- Elkins, C.; van Iersel, M.W. Longer photoperiods with the same daily light integral improve growth of rudbeckia seedlings in a greenhouse. HortScience 2020, 55, 1676–1682. [Google Scholar] [CrossRef]
- Weaver, G.; van Iersel, M.W. Longer Photoperiods with Adaptive Lighting Control Can Improve Growth of Greenhouse-grown ‘Little Gem’ Lettuce (Lactuca sativa). HortScience 2020, 55, 573–580. [Google Scholar] [CrossRef] [Green Version]
- Rengasamy, N.; Othman, R.Y.; Che, H.S.; Harikrishna, J.A. Artificial Lighting Photoperiod Manipulation Approach to Improve Productivity and Energy Use Efficacies of Plant Factory Cultivated Stevia rebaudiana. Agronomy 2022, 12, 1787. [Google Scholar] [CrossRef]
- Palmer, S.; van Iersel, M.W. Increasing growth of lettuce and mizuna under sole-source LED lighting using longer photoperiods with the same daily light integral. Agronomy 2020, 10, 1659. [Google Scholar] [CrossRef]
- Zhang, X.; He, D.; Niu, G.; Yan, Z.; Song, J. Effects of environment lighting on the growth, photosynthesis, and quality of hydroponic lettuce in a plant factory. Int. J. Agric. Biol. Eng. 2018, 11, 33–40. [Google Scholar] [CrossRef]
- Xu, W.; Lu, N.; Kikuchi, M.; Takagaki, M. Continuous lighting and high daily light integral enhance yield and quality of mass-produced nasturtium (tropaeolum majus L.) in plant factories. Plants 2021, 10, 1203. [Google Scholar] [CrossRef]
- Tsuruyama, J.; Shibuya, T. Growth and flowering responses of seed-propagated strawberry seedlings to different photoperiods in controlled environment chambers. HortTechnology 2018, 28, 453–458. [Google Scholar] [CrossRef]
- Yan, Z.; Wang, L.; Dai, J.; Liu, Y.; Lin, D.; Yang, Y. Morphological and physiological responses of cucumber seedlings to different combinations of light intensity and photoperiod with the same daily light integral. HortScience 2021, 56, 1430–1438. [Google Scholar] [CrossRef]
- Mao, H.; Hang, T.; Zhang, X.; Lu, N. Both multi-segment light intensity and extended photoperiod lighting strategies, with the same daily light integral, promoted lactuca sativa L. growth and photosynthesis. Agronomy 2019, 9, 857. [Google Scholar] [CrossRef] [Green Version]
- Lam, V.P.; Choi, J.Y.; Park, J. Enhancing Growth and Glucosinolate Accumulation in Watercress (Nasturtium officinale L.) by Regulating Light Intensity and Photoperiod in Plant Factories. Agriculture 2021, 11, 723. [Google Scholar] [CrossRef]
- Kim, S.; Bok, G.J.; Shin, J.; Park, J.W. Effects of Photoperiod and Light Intensity on the Growth and Glucosinolates Content of Three Brassicaceae Species in a Plant Factory. J. Bio-Environ. Control 2022, 31, 416–422. [Google Scholar] [CrossRef]
- Cho, J.Y.; Yoo, K.S.; Kim, J.; Choi, B.J.; Oh, W. Growth and bioactive compounds of lettuce as affected by light intensity and photoperiod in a plant factory using external electrode fluorescent lamps. Hortic. Sci. Technol. 2020, 31, 645–649. [Google Scholar] [CrossRef]
- Kelly, N.; Choe, D.; Meng, Q.; Runkle, E.S. Promotion of lettuce growth under an increasing daily light integral depends on the combination of the photosynthetic photon flux density and photoperiod. Sci. Hortic. 2020, 272, 109565. [Google Scholar] [CrossRef]
- Fan, X.-X.; Xu, Z.-G.; Liu, X.-Y.; Tang, C.-M.; Wang, L.-W.; Han, X.-L. Effects of light intensity on the growth and leaf development of young tomato plants grown under a combination of red and blue light. Sci. Hortic. 2013, 153, 50–55. [Google Scholar] [CrossRef]
- Elkins, C.; van Iersel, M.W. Longer photoperiods with the same daily light integral increase daily electron transport through photosystem ii in lettuce. Plants 2020, 9, 1172. [Google Scholar] [CrossRef]
- Cui, J.; Song, S.; Yu, J.; Liu, H. Effect of Daily Light Integral on Cucumber Plug Seedlings in Artificial Light Plant Factory. Horticulturae 2021, 7, 139. [Google Scholar] [CrossRef]
- Kang, J.H.; KrishnaKumar, S.; Atulba, S.L.S.; Jeong, B.R.; Hwang, S.J. Light intensity and photoperiod influence the growth and development of hydroponically grown leaf lettuce in a closed-type plant factory system. Hortic. Environ. Biotechnol. 2013, 54, 501–509. [Google Scholar] [CrossRef]
- Ishii, M.; Ito, T.; Maruo, T.; Suzuki, K.; Matsuo, K. Plant growth and physiological characters of lettuce plants grown under artificial light of different irradiating cycles. Environ. Control Biol. 1995, 33, 143–149. (In Japanese) [Google Scholar] [CrossRef]
- Hang, T.; Lu, N.; Takagaki, M.; Mao, H. Leaf area model based on thermal effectiveness and photosynthetically active radiation in lettuce grown in mini-plant factories under different light cycles. Sci. Hortic. 2019, 252, 113–120. [Google Scholar] [CrossRef]
- Zhou, J.; Wang, J.Z.; Hang, T.; Li, P.P. Photosynthetic characteristics and growth performance of lettuce (Lactuca sativa L.) under different light/dark cycles in mini plant factories. Photosynthetica 2020, 58, 740–747. [Google Scholar] [CrossRef] [Green Version]
- Chen, X.-L.; Yang, Q.-C. Effects of intermittent light exposure with red and blue light emitting diodes on growth and carbohydrate accumulation of lettuce. Sci. Hortic. 2018, 234, 220–226. [Google Scholar] [CrossRef]
- Chi, S.-H. Effect of photoperiod shortening on the nutrient uptake and carbon metabolism of tomato and hot pepper seedlings grown hydroponically. J. Bio-Environ. Control 2003, 12, 121–126. [Google Scholar]
- García-Caparrós, P.; Sabio, F.; Barbero, F.J.; Chica, R.M.; Lao, M.T. Physiological responses of tomato and cucumber seedlings under different light–dark cycles. Agronomy 2020, 10, 945. [Google Scholar] [CrossRef]
- Kimura, H.; Hashimoto-Sugimoto, M.; Iba, K.; Terashima, I.; Yamori, W. Improved stomatal opening enhances photosynthetic rate and biomass production in fluctuating light. J. Exp. Bot. 2020, 71, 2339–2350. [Google Scholar] [CrossRef]
- Pearcy, R.W. Sunflecks and photosynthesis in plant canopies. Annu. Rev. Plant Biol. 1990, 41, 421–453. [Google Scholar] [CrossRef]
- Kaiser, E.; Morales, A.; Harbinson, J.; Heuvelink, E.; Marcelis, L.F.M. High stomatal conductance in the tomato flacca mutant allows for faster photosynthetic induction. Front. Plant Sci. 2020, 11, 1317. [Google Scholar] [CrossRef]
- Dodd, A.N.; Salathia, N.; Hall, A.; Kevei, E.; Toth, R.; Nagy, F.; Hibberd, J.M.; Millar, A.J.; Webb, A.A. Plant circadian clocks increase photosynthesis, growth, survival, and competitive advantage. Science 2005, 309, 630–633. [Google Scholar] [CrossRef] [Green Version]
- Urairi, C.; Shimizu, H.; Nakashima, H.; Miyasaka, J.; Ohdoi, K. Optimization of light-dark cycles of Lactuca sativa L. in plant factory. Environ. Control Biol. 2017, 55, 85–91. [Google Scholar] [CrossRef] [Green Version]
- Higashi, T.; Kamitamari, A.; Okamura, N.; Ukai, K.; Okamura, K.; Tezuka, T.; Fukuda, H. Characterization of Circadian Rhythms Through a Bioluminescence Reporter Assay in Lactuca sativa L. Environ. Control Biol. 2014, 52, 21–27. [Google Scholar] [CrossRef] [Green Version]
- Chen, X.-L.; Li, Y.-L.; Wang, L.-C.; Yang, Q.-C.; Guo, W.-Z. Responses of butter leaf lettuce to mixed red and blue light with extended light/dark cycle period. Sci. Rep. 2022, 12, 6924. [Google Scholar] [CrossRef] [PubMed]
- Shao, M.; Liu, W.; Zha, L.; Zhou, C.; Zhang, Y.; Li, B. Altering light–dark cycle at pre-harvest stage regulated growth, nutritional quality, and photosynthetic pigment content of hydroponic lettuce. Acta Physiol. Plant. 2021, 43, 9. [Google Scholar] [CrossRef]
- Bhuiyan, R.; van Iersel, M.W. Only extreme fluctuations in light levels reduce lettuce growth under sole source lighting. Front. Plant Sci. 2021, 12, 619973. [Google Scholar] [CrossRef] [PubMed]
- Avgoustaki, D.D.; Li, J.; Xydis, G. Basil plants grown under intermittent light stress in a small-scale indoor environment: Introducing energy demand reduction intelligent technologies. Food Control 2020, 118, 107389. [Google Scholar] [CrossRef]
- Bochenek, G.M.; Fällström, I. The effect of diurnal light intensity distribution on plant productivity in a controlled environment. Acta Hortic. 2016, 155–162. [Google Scholar] [CrossRef]
- Vialet-Chabrand, S.; Matthews, J.S.A.; Simkin, A.J.; Raines, C.A.; Lawson, T. Importance of fluctuations in light on plant photosynthetic acclimation. Plant Physiol. 2017, 173, 2163–2179. [Google Scholar] [CrossRef] [PubMed] [Green Version]
- Kaiser, E.; Walther, D.; Armbruster, U. Growth under fluctuating light reveals large trait variation in a tanel of Arabidopsis accessions. Plants 2020, 9, 316. [Google Scholar] [CrossRef] [Green Version]
- Morales, A.; Kaiser, E. Photosynthetic Accliation to Fluctuating Irradiance in Plants. Front. Plant Sci. 2020, 11, 268. [Google Scholar] [CrossRef] [Green Version]
- Shao, M.; Liu, W.; Zha, L.; Zhou, C.; Zhang, Y.; Li, B. Effects of constant versus fluctuating red–blue LED radiation on yield and quality of hydroponic purple-leaf lettuce. Hortic. Environ. Biotechnol. 2020, 61, 989–997. [Google Scholar] [CrossRef]
- Zeidler, C.; Schubert, D. From Bioregenerative Life Support Systems for Space to Vertical Farming on Earth—The 100% Spin-off. In Proceedings of the Life in Space for Life on Earth Symposium, Waterloo, ON, Canada, 15–20 June 2014. [Google Scholar]
- Van Iersel, M.W.; Gianino, D. An Adaptive Control Approach for Light-emitting Diode Lights Can Reduce the Energy Costs of Supplemental Lighting in Greenhouses. HortScience 2017, 52, 72–77. [Google Scholar] [CrossRef]
- Avgoustaki, D.D.; Xydis, G. Energy cost reduction by shifting electricity demand in indoor vertical farms with artificial lighting. Biosyst. Eng. 2021, 211, 219–229. [Google Scholar] [CrossRef]
- Avgoustaki, D.D.; Xydis, G. Plant factories in the water-food-energy Nexus era: A systematic bibliographical review. Food Secur. 2020, 12, 253–268. [Google Scholar] [CrossRef]
- Shamshiri, R.; Kalantari, F.; Ting, K.C.; Thorp, K.R.; Hameed, I.A.; Weltzien, C.; Ahmad, D.; Shad, Z.M. Advances in greenhouse automation and controlled environment agriculture: A transition to plant factories and urban agriculture. Int. J. Agric. Biol. Eng. 2018, 11, 11. [Google Scholar] [CrossRef]
- Paucek, I.; Appolloni, E.; Pennisi, G.; Quaini, S.; Gianquinto, G.; Orsini, F. LED Lighting Systems for Horticulture: Business Growth and Global Distribution. Sustainability 2020, 12, 7516. [Google Scholar] [CrossRef]
- Nelson, J.A.; Bugbee, B. Economic Analysis of Greenhouse Lighting: Light Emitting Diodes vs. High Intensity Discharge Fixtures. PLoS ONE 2014, 9, e99010. [Google Scholar] [CrossRef] [PubMed] [Green Version]
- Kondrateva, N.; Filatov, D.; Bolshin, R.; Krasnolutskaya, M.; Shishov, A.; Ovchukova, S.; Mikheev, G. Determination of the effective operating hours of the intermittent lighting system for growing vegetables. IOP Conf. Ser. Earth Environ. Sci. 2021, 935, 012004. [Google Scholar] [CrossRef]
Figure 1.
Produce grown in Canadian greenhouses from 2018 to 2021. Other crops include eggplant, Chinese vegetables, and wax and green beans. Compiled from Statistics Canada [2].
Figure 1.
Produce grown in Canadian greenhouses from 2018 to 2021. Other crops include eggplant, Chinese vegetables, and wax and green beans. Compiled from Statistics Canada [2].
Disclaimer/Publisher’s Note: The statements, opinions and data contained in all publications are solely those of the individual author(s) and contributor(s) and not of MDPI and/or the editor(s). MDPI and/or the editor(s) disclaim responsibility for any injury to people or property resulting from any ideas, methods, instructions or products referred to in the content. |
© 2023 by the authors. Licensee MDPI, Basel, Switzerland. This article is an open access article distributed under the terms and conditions of the Creative Commons Attribution (CC BY) license (https://creativecommons.org/licenses/by/4.0/).
Share and Cite
MDPI and ACS Style
Warner, R.; Wu, B.-S.; MacPherson, S.; Lefsrud, M. How the Distribution of Photon Delivery Impacts Crops in Indoor Plant Environments: A Review. Sustainability 2023, 15, 4645. https://doi.org/10.3390/su15054645
AMA Style
Warner R, Wu B-S, MacPherson S, Lefsrud M. How the Distribution of Photon Delivery Impacts Crops in Indoor Plant Environments: A Review. Sustainability. 2023; 15(5):4645. https://doi.org/10.3390/su15054645
Chicago/Turabian StyleWarner, Rachael, Bo-Sen Wu, Sarah MacPherson, and Mark Lefsrud. 2023. "How the Distribution of Photon Delivery Impacts Crops in Indoor Plant Environments: A Review" Sustainability 15, no. 5: 4645. https://doi.org/10.3390/su15054645
Note that from the first issue of 2016, this journal uses article numbers instead of page numbers. See further details here.