

Impact of Photovoltaic Penetration on Medium Voltage Distribution Network


1
UNITEN R&D Sdn. Bhd, Universiti Tenaga Nasional, Jalan Ikram-Uniten, Kajang 43000, Selangor, Malaysia
2
Institute of Sustainable Energy, Universiti Tenaga Nasional, Jalan Ikram-Uniten, Kajang 43000, Selangor, Malaysia
*
Authors to whom correspondence should be addressed.
Sustainability 2023, 15(7), 5613; https://doi.org/10.3390/su15075613
Submission received: 13 February 2023
/
Revised: 3 March 2023
/
Accepted: 8 March 2023
/
Published: 23 March 2023
(This article belongs to the Special Issue Research Advances and Future Trends in Renewable Energy and Enabling Technologies)
Abstract
:Nowadays, large-scale solar penetration into the grid and the intermittent nature of PV systems are affecting the operation of distribution networks. This paper aims to investigate the effect of PV penetration on a typical medium-voltage distribution network in Malaysia. The main objectives of this study are to investigate voltage stability, power loss, and short circuit under two conditions: peak load and no load. The network is evaluated using two methods: static and dynamic analysis, utilizing the Digsilent Power Factory software. The network comprises two 33/11 kV parallel transformers connected to the 11 kV busbar and consists of 13 feeders and 38 loads. PV penetration of 500 kW per node is added, and the maximum potential PV penetration that is acceptable to connect to the grid is evaluated. The findings indicate that during peak load conditions, some nodes experience violations, but by increasing the PV penetration, the lower violations move up to the acceptable range. The highest power loss is 191 kW, occurring during peak load conditions at 0% PV penetration level. On the other hand, dynamic simulations were carried out with specific load time characteristics, and the results were compared under different PV penetration levels. The dynamic simulation results show that during contingency conditions, there are violations in peak load, and the maximum PV penetration for this study was determined to be 2MW. It is observed that the nodes 27, 28, and 29 violate lower voltage limits even at 100% PV penetrations.
1. Introduction
Solar photovoltaic (PV) power generation has significantly increased globally in recent years [1]. Solar PV distributed generation is a popular form of renewable energy. By growing the solar cell efficiency in the market, the global installed capacity of solar PV is projected to reach 8519 GW by 2050 [2,3]. In Malaysia, plans are in place to install 200 MW of solar power in Peninsula Malaysia and 50 MW in Sabah [4]. As PV systems can operate at various capacities, from kW to MW, they have been widely promoted and developed due to their adaptability and flexibility [5]. However, with the rise in distributed power generation, the distribution network is evolving from a passive radial network (traditional) to an active network with small- and medium-sized power sources that generate power, increasing the system’s efficiency. High PV penetration of distributed power supplies can result in significant power flow in the opposite direction, creating challenges for managing voltage and protecting equipment in the distribution network. Extensive research is required to predict possible problems with PV grid integration [6,7,8].
According to Wang et al. [9], large-scale PV systems can cause voltage changes, network losses, and short circuit currents in the distribution network under various operational conditions, including steady-state and dynamic states. Sreekumar et al. [10] focus on the voltage drop and network losses caused by grid-connected distributed PV systems and discuss their impacts on the distribution network. Coelho et al. [11] explore how the location of distributed generation affects the voltage profile and power loss in a radial distribution grid. In another study, Ding [12] examines several factors that can influence voltage fluctuation levels when solar PV systems are connected to the grid. Prusty et al. [13] propose considering the uncertainties in a distribution network and using probabilistic load flow analysis to measure the voltage levels of buses inside a distribution network.
Solar units have a stochastic nature, making their output uncontrollable due to the unpredictable system [14]. This unpredictability can cause overvoltage issues in MV distribution networks due to variations in PV power output and load demands [15]. Additionally, when there is low demand and high PV generation, surplus power flows back to the substation, creating reverse power flows that can disrupt network performance and cause a rise in voltage levels. The intensity of these consequences depends on factors such as the network’s topology, location, system size, and weather conditions. Figure 1, shows the solar PV penetration model and voltage calculation based on Kirchhoff’s theory. Furthermore, the high penetration of solar PVs in the system, in conjunction with increasing active power losses in the distribution network, might also affect operational efficiency [16]. Recent research explored potential technical challenges associated with high PV penetration in distribution networks, with some findings published in recent years [17]. In the past, deterministic and probabilistic methods were mainly used to study and measure the effects of solar PV [18].
Digsilent Power Factory currently provides quasi-dynamic simulation for medium- to long-term electrical research [19]. This software uses consumer time-step sizes to perform multiple load-flow computations, which makes the simulation technique faster, since it doesn’t involve solving all the calculations. Numerous research studies [20] have shown that the quasi-dynamic approach is more accurate than other approaches, such as the quasi-static approach [21]. Because of this, quasi-dynamic simulations are utilized in a wide range of fields, including physics, geoscience, and electronics. Gomes et al. [22], used a quasi-dynamic approach to examine the behavior of two transmission grids serving industrial clients following an Economic Dispatch Optimization. This study examined a distribution system with different kinds of consumers to assess behavior and changes when DG systems are present at certain nodes [23]. With the rise of grid-connected solar PV, new distribution network challenges have emerged. To achieve high PV penetration into the grid, it is important to identify and understand these problems before they occur. Although all of these techniques have been applied to single-point PV systems, they have not been applied to large-scale systems with multiple PV units dispersed throughout a large area. Several studies have been conducted regarding the integration of high penetration PV systems into distribution networks, but few of them have been focused on how to plan for distribution networks when PV systems are widely deployed. Several references deal with PVs and loads as PQ nodes without considering the time-varying nature of these variables. However, it is important to note that actual power consumption by a load largely depends on the voltage level of the bus bar it is connected to, so the calculation results do not fully represent actual consumption.
Our primary objective in this research is to examine the impacts of solar PV penetration in the MV distribution system and identify technical barriers associated with high-penetration PV scenarios to assist utilities in better managing PV integration. The Digsilent Power Factory was used to simulate the MV model, and the reference network for 33/11 kV voltage transmission is shown in Figure 2. The impact of PV penetration on the network was examined using load flow analysis and dynamic simulation based on two scenarios: no-load and peak load conditions. The following objectives were determined for this study:
- To analyze power flow under different scenarios;
- To investigate short-circuit current and power loss of the network among different scenarios;
- To analyze dynamic simulations under different scenarios;
- To identify sensitive nodes and determine the maximum PV capacity.
2. Methodology
This section presents, in detail, the methodology employed to achieve the proposed research objectives. Furthermore, it illustrates all the tools and systems that were used to conduct the study, including the mathematical model, simulations, and strategies used for analysis. The methodology for this research is divided into two main parts: network data description and network evaluation strategies. The network data include transformer ratings, line information, bus information, solar irradiations, etc. Power flow analysis strategies include static analysis and dynamic analysis. Digsilent Power Factory version 2021 was used to investigate the effect of PV penetration in the typical network. The steps are described in detail below:
- Collecting grid and solar data, including the single-line schematic, load demand information, and PV generation data;
- Using a time-series framework to calculate power flow: a power flow calculation was made every minute, and the results displayed using Digsilent Power Factory to produce accurate results;
- Assessing overvoltage limits: in cases where the overvoltage limit is exceeded, this indicates that the maximum penetration of PV has already been achieved;
- Identifying the node with the highest voltage: nodes and buses with the highest voltage are reported when an overvoltage violation is detected;
- Running dynamic simulation under different scenarios.
2.1. PV Penetration Modeling
In general, based on Kirchhoff’s theory, the voltage equation at the beginning and end points of the two-bus system depicted in Figure 1 is demonstrated in Equations (1)–(3). VPCC represents the voltage at the point of connection, VG represents the voltage at the transformer, RL + jXL denotes the line impedance, I represents the line current, S represents the apparent power from the grid to the bus, SPV denotes the apparent power from the PV system, and SLD represents the load consumption. When the PV power generation is greater than the consumption load at the PCC point, the excess power will be supplied to the grid. Conversely, when the PV power generation is less than the consumption load at the PCC point, the grid will supply power to the load.
PCC is point of common coupling. By comparing the active and reactive power, it is possible to represent this power flow as Equation (5).
2.2. Network Topology Description
A typical Malaysian MV distribution network integrated with solar PV topology in the single-line diagram can be seen in Figure 2. The network is connected to 11 kV bus bar through two 33/11 kV, with 30 MVA transformers connected in parallel. The 11 kV bus serves 38 nodes using 13 feeders. In addition, the network was divided into left and right zones using a bus section circuit-breaker. For ease of analysis, seven feeders on the left-hand side are called ‘Left-hand side feeders’, while the other six on the right are called ‘Right-hand side feeders’. The total loads for all the 13 feeders were tabulated as shown in Table 1. The total load connected to the 11 kV bus bar equals 31.227 MVA with 20.818 MW of active load and 10.409 MVAR of reactive load. During the simulation, two scenarios were set up to determine how PV penetration would affect a typical network. Testing a network in bad conditions is important because it allows us to identify potential weaknesses or limitations in the network’s performance. In real-world scenarios, network conditions can be unpredictable and can degrade due to various factors such as high traffic, network congestion, signal interference, or hardware failures. Here, we decided to evaluate the PV grid connection in two bad conditions as follows:
- The first scenario is a no-load condition, which is the state of the network when all the loads have been disconnected to see how much the PV penetration would affect the voltage profile in the grid;
- The second scenario is a peak load condition, which is the state of the network when all the loads have been connected to see how much the PV penetration would affect the voltage profile in the grid.
2.3. PV Penetration Level
PV penetration refers to the total connected PV capacity as a ratio of the maximum permitted PV capacity. PV penetration levels are usually measured in percentage terms relative to the highest possible individual output of PV generations. In this study, the entire network model of the MV distribution network shown in Figure 1 was built using Digsilent Power Factory simulation software, starting from the substation down to individual nodes. The distribution network was tested at various solar PV penetration levels, ranging from 0 kW (0%) to 500 kW (100%), under both no-load and peak load conditions to identify voltage violations resulting from high solar PV penetration in the distribution network. According to the Malaysian electric utility, Tenaga Nasional Berhad (TNB) standards and planning criteria for MV distribution networks, the statutory tolerance limits for voltage variation should be between +5% and −5%. PV penetration levels were evaluated based on sustainable grid voltage limits. Additionally, the maximum PV penetration level was investigated to analyze the potential PV generation.
2.4. Network Evaluation Strategies
Three main case studies are evaluated for the network considered at both no-load and peak load conditions. Case 1 is when the bus section circuit-breaker is closed, where two 33/11 kV transformers are working in parallel. Case 2 is when the bus section circuit breaker is opened, where two 33/11 kV transformers are working in isolation. Case 3 is when the bus section circuit-breaker is closed, and one of the 33/11 kV transformers is on outage known as contingency condition. For contingency simulation, transformer B was considered out of service, and all the loads were supplied through transformer A. Figure 3 shows the network evaluation strategies, divided into two main parts: static and dynamic power flow analysis. This study’s main contribution is investigating the effect of PV penetration for different scenarios and case studies. Typical electrical power system data such as network topology, information regarding transformers, bus bars, lines, and generation and load profiles were collected from the local distribution company for modeling the network.
2.5. Static Power Flow Analysis
The static power flow analysis is performed to identify the magnitude and phase values of the voltage at each node of the distribution network. Multiple simulations are conducted for various scenarios and case studies. In a radial distribution network, the voltage decreases along the line at the nodes away from the main bus bar. The voltage constraints are Vmin < Vi < Vmax, where Vmin and Vmax are 0.95 p.u and 1.05 p.u, respectively, as per the Malaysian distribution code.
The power loss is dependent on the current flow through the line and the line’s resistance. Increasing solar PV penetration initially reduces the current in the line, resulting in a decrease in network losses and the conventional generation’s current. However, beyond a certain penetration level, high solar PV penetration can cause real power losses to increase as the solar PV current starts to flow in the opposite direction into the system. Short-circuit analysis is another term investigated in all case studies to analyze the system’s behavior under short-circuit conditions. Power Factory, a powerful short-circuit calculation tool, combines several methods, such as IEC 60909, VDE 0102/0103, IEEE 141/ANSI C37, G74, and IEC 61363. This study considers the short circuit current limits prescribed in the Malaysian distribution code, which are 25 kA at the 33 kV bus and 20 kA at the 11 kV bus. The network is evaluated for different case studies to determine the short-circuit current limits.
2.6. Dynamic Power Flow Analysis
The dynamic power flow analysis considers real-time variations in PV generation and load profiles. Solar PV penetration impact has been investigated under no-load and peak load scenarios for all three case studies. The voltage profiles at individual nodes of the network are examined at different solar PV penetration levels to ensure compliance with the grid code voltage statutory limits of ±5%. Low voltage conditions could result in equipment malfunctions such as motor stalling or generating units tripping, while high voltage conditions may damage major equipment, cause insulation failure, or trip major transmission equipment. In this study, the distribution network was tested on different solar PV penetration levels (0 kW—0%, 100 kW—20%, 200 kW—40%, 300 kW—60%, 400 kW—80%, and 500 kW—100%) at no-load and peak load conditions to assess the findings of voltage violations upon integrating high solar PV penetration into the distribution network.
3. Results and Discussion
This section presents the results for all scenarios and case studies based on both static and dynamic simulations, using both graphical and tabular formats. Graphs depict voltage fluctuations at every solar PV penetration level. By examining voltage profile graphs for each of the three case studies under no-load and peak load conditions, we could observe the network’s voltage violations and tabulate the resulting feeders’ violations. These tabulated results help identify the feeder that is most affected by all solar PV penetration levels and scenarios.
3.1. Static Analysis
Figure 4 displays the voltage profile for case studies 1, 2, and 3 under no-load conditions. It shows that no voltage violations exist up to a 100% (500 kW) solar penetration level for all 38 nodes in all case studies, and that they are within the grid code voltage statutory limits of ±5%. When the solar PV penetration level is increased beyond 100%, the maximum PV penetration limit is determined to be 400% (2 MW) without any grid code voltage violations.
Figure 5 illustrates the voltage profile for case studies 1, 2, and 3 under peak load conditions. The results show that no upper voltage violations exist up to a 100% (500 kW) solar penetration level for all 38 nodes in all case studies and that they are within the grid code voltage statutory limits of ±5%. However, for case 3 (contingency condition), the voltage profile at nodes 28 and 29 hits the lower voltage limit in the network at 0% solar PV penetration level. When the solar PV penetration level is increased beyond 100%, the maximum PV penetration limit without any grid code voltage violations is observed to be 400% (2 MW). In summary, the results indicate that the distribution network can support up to 400% solar PV penetration without exceeding the voltage limits set by the grid code, except for nodes 28 and 29 under contingency conditions.
3.2. Power Losses
Power losses were calculated for each case study under peak load conditions with different solar PV penetration levels, and the results are tabulated in Table 2. The table is divided into two parts separated by a line and gray color. The first part of the table shows the power losses among different case studies from 0% to 100% (500 kW) solar PV penetration levels. It is observed that the power losses decrease with an increase in solar PV penetration. The second part of the table shows the power losses of the network at 400% (2 MW), the maximum allowable solar PV penetration level without grid code voltage limit violations. However, it is clear that increasing the solar PV penetration above 100% significantly increases the losses. Hence, it is not recommended to increase solar PV penetration beyond 100%.
3.3. Evaluation of Network under Short-Circuit Conditions
A network designer typically performs a short-circuit test to ensure the network operates reliably under emergency conditions. In this section, the short-circuit analysis was carried out on two buses, 33 kV and 11.3 kV, using three case studies under peak and no-load conditions. Table 3 displays the short-circuit currents at the 33 kV and 11 kV busbars for different case studies. The results reveal that the highest short-circuit current at the 33 kV busbar occurs at 100% penetration with 22,628 A, 22,628 A, and 22,640 A in cases 1, 2, and 3, respectively, under no-load conditions. However, in Table 4, under peak load conditions, the highest current occurs in case 3 with 22,632 A at 100% PV penetration.
3.4. Dynamic Simulation under Peak Load Scenario
The network parameters, including line impedances and lengths, used in this study were obtained from typical Malaysian MV distribution networks. Figure 6 displays the normalized PV generation and load consumption profiles utilized in this analysis. The solar PV characteristics are represented in blue, while the load profiles are indicated in red. Based on these load characteristics, it can be observed that there is a high load demand during the daytime.
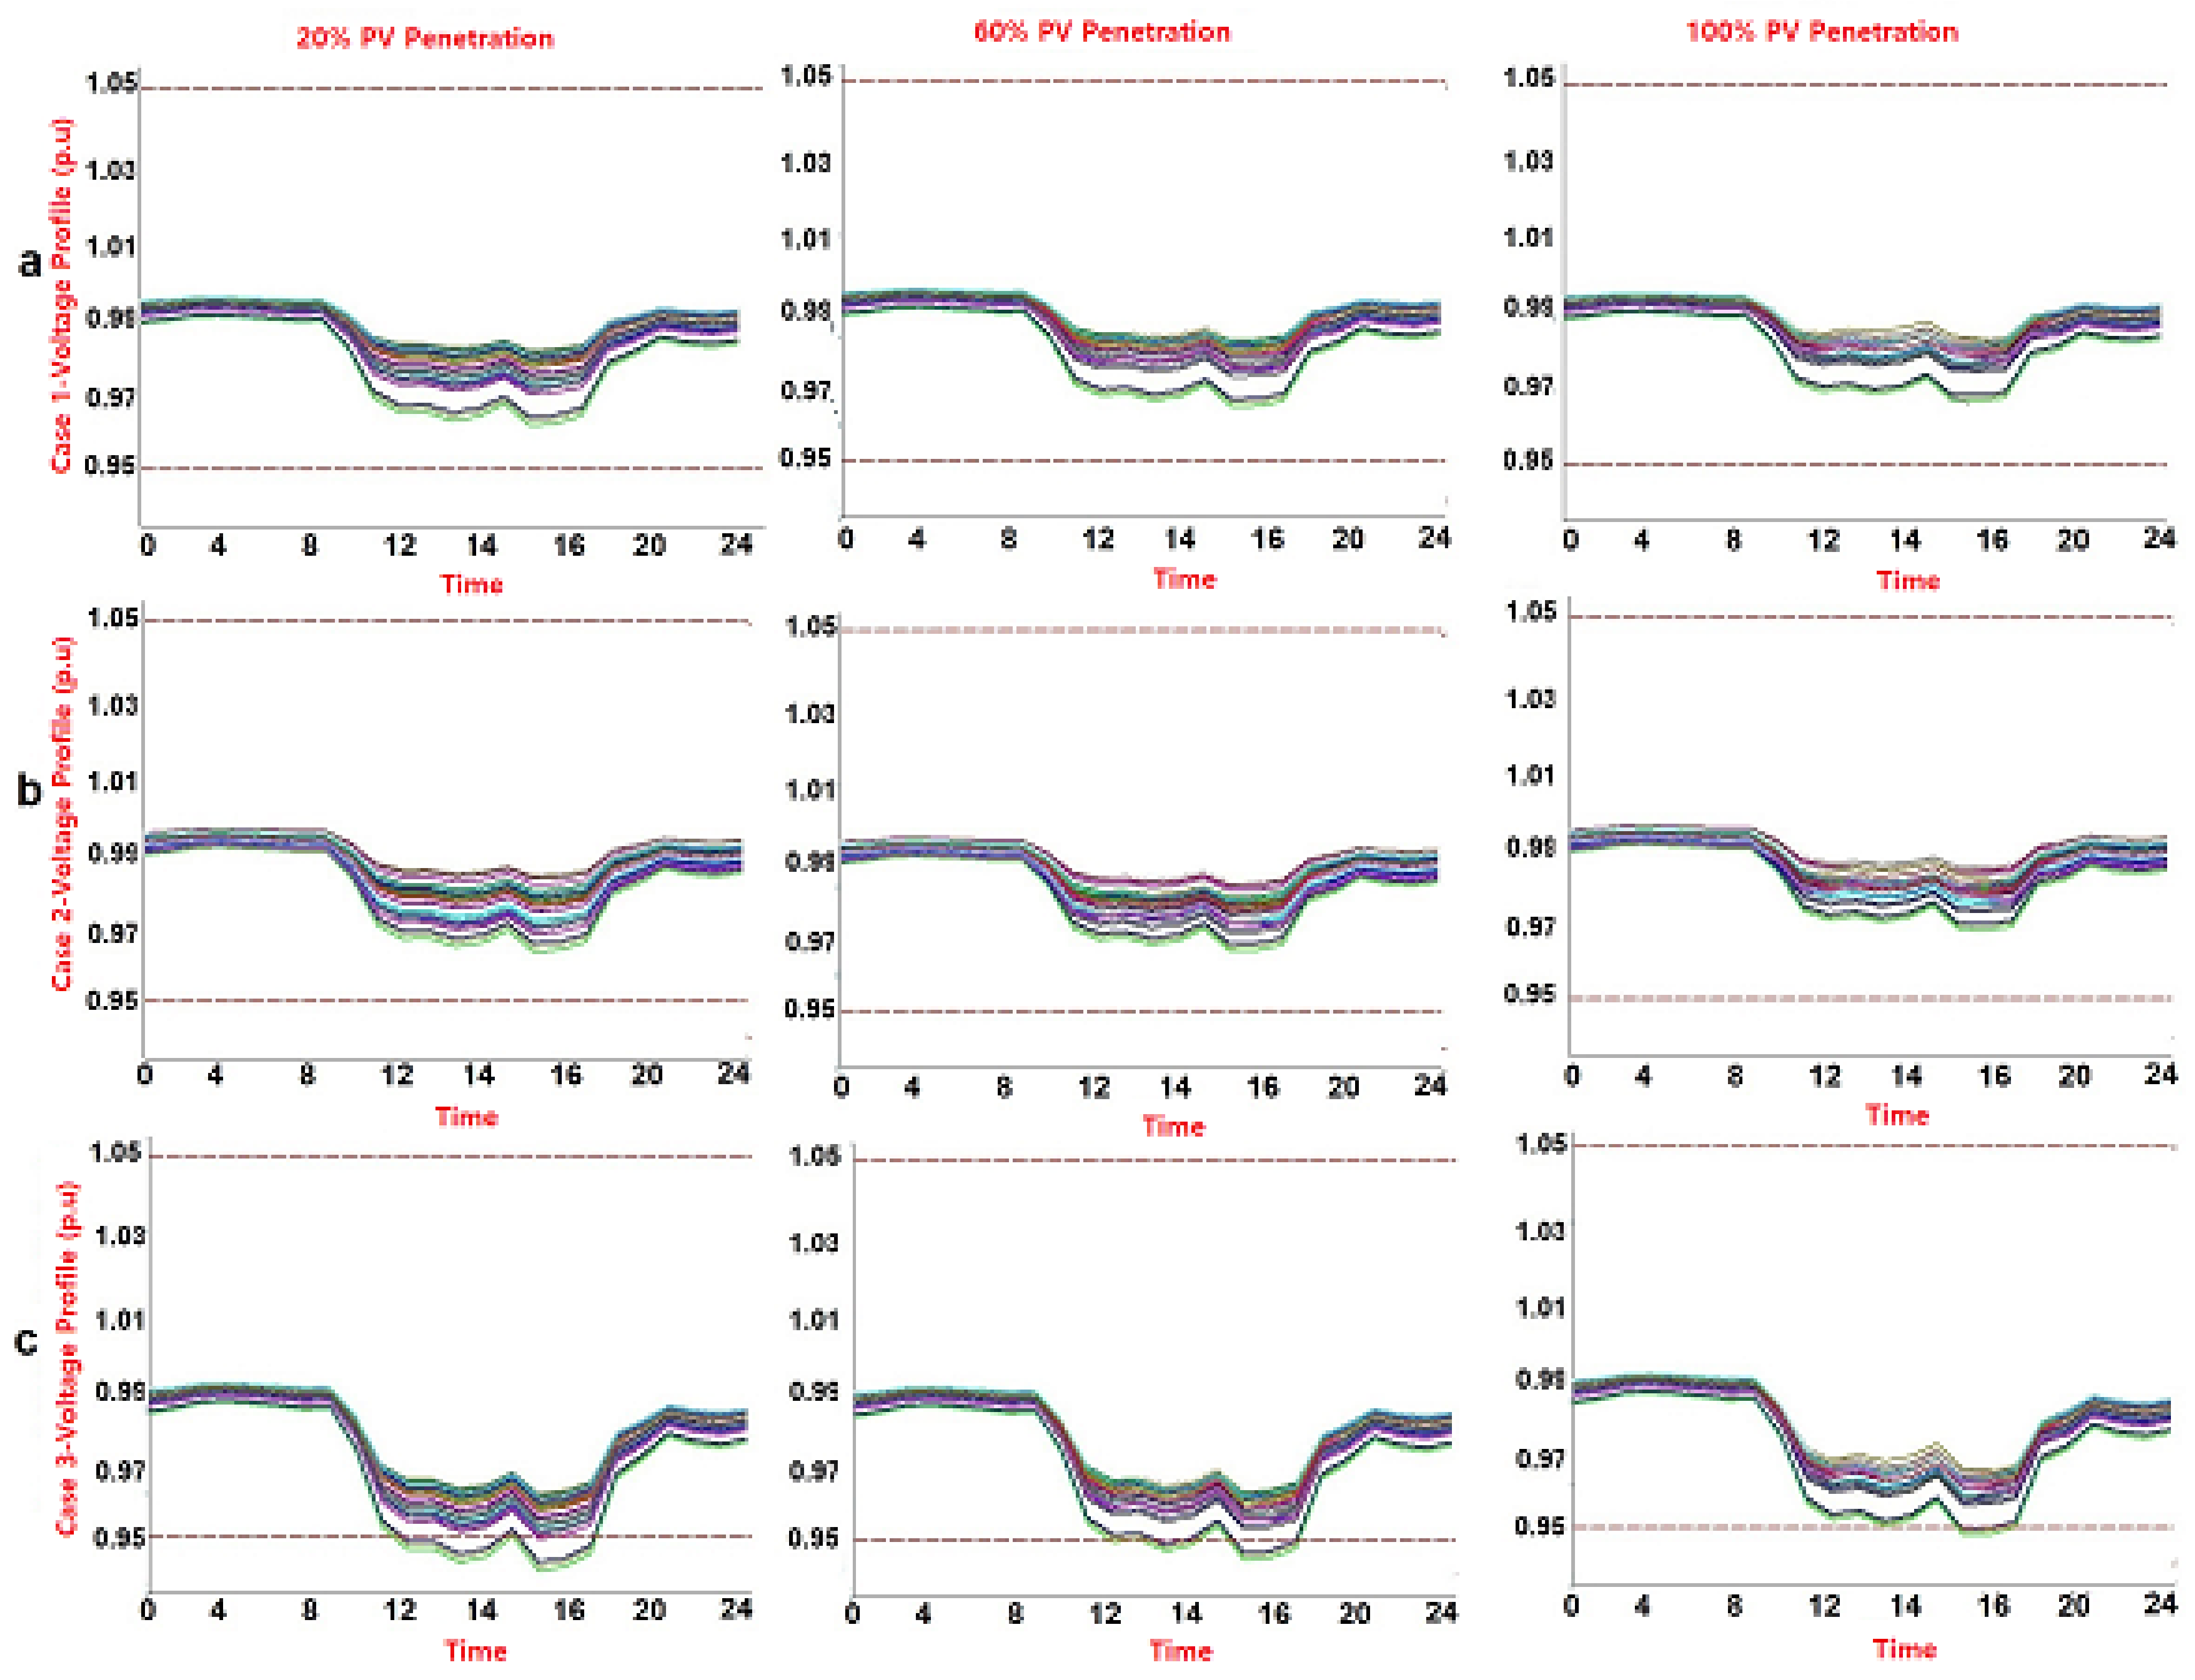
The study analyzed the dynamic simulations of solar PV at low, medium, and high penetrations of 20%, 60%, and 100%, respectively, at each node under peak load conditions. Figure 7 represents the results of dynamic simulations under peak load conditions for the three case studies for all nodes. Comparing the three case studies, it is evident that the voltage profile decreases as the PV penetration increases, and the voltage profiles are within acceptable voltage limits for case 1 and case 2. However, for case 3, the voltage profiles at 0% PV penetration have lower limit violations for nodes 5, 26, 27, 28, and 29. By increasing the PV penetration level up to 60%, the lower limit violations at nodes 5 and 26 are overcome, but for nodes 27, 28, and 29, the lower limit violations still exist. Furthermore, from Figure 6, it is observed that the lower voltage limit is violated, even after 100% PV penetration, for nodes 27, 28, and 29, but only for a short period between 3 pm to 5 pm. As case 3 is a contingency case, it may occur rarely for a short period, and it is not a major concern.
A similar study conducted by Kerdoum et al. [24] found that high levels of PV penetration can cause an increase in network voltage levels, with a maximum voltage rise of up to 7% for 30% PV penetration. This can lead to overvoltage issues and potential damage to electrical equipment. However, their study only evaluated the impact of PV penetration at different locations in the network and did not consider the evaluation during bad conditions. Furthermore, they did not discuss power losses or short-circuit current. Another study by Behat et al. [25] investigated the integration of solar PV into the IEEE 39-BUS system and identified the maximum capacity at which the network can remain stable. Although these techniques have been applied to single-point PV systems, they have not been applied to large-scale systems with multiple dispersed PV units. It is important to note that actual power consumption by loads is largely dependent on the voltage level of the bus bar to which they are connected. Therefore, the calculation results do not fully represent actual consumption.
4. Conclusions
This research article aims to investigate the effect of 500 kW of PV penetration on Malaysia’s typical MV distribution network. To consider the effect of PV penetration on different situations, three case studies were defined to investigate the system’s performance. PV penetration levels at different levels (0%—no solar PV, 20%—100 kW, 40%—200 kW, 60%—300 kW, 80%—400 kW, and 100%—500 kW) were investigated, but in this article, only PV penetration at low (20%), medium (60%), and high (100%) penetration was reported. It is observed that no voltage violations exists up to 100% (500 kW) solar penetration level for all 38 nodes in all case studies and are within grid code voltage statutory limits of ±5%. However, at peak load, the findings show that at nodes 28 and 29 at 0% solar PV penetration level, the voltage profile hit the lower voltage limit in the network. The solar PV penetration level is increased beyond 100% to determine the maximum penetration limit and it is observed that the maximum PV penetration that could be achieved without any grid code voltage violations is limited to 400% (2 MW).
Power loss is another term considered in load flow analysis. The finding from the power loss shows that the highest amount of power loss during peak load conditions happens at 0% PV penetration and they are equal to 178, 180, and 191 kW for cases 1, 2, and 3, respectively. It is observed that the power losses decrease with an increase in solar PV penetration. According to the results, the highest short-circuit currents occur at 100% penetration with 22,640 and 22,632 A under no-load and peak load conditions, respectively.
In addition, the dynamic simulation was carried out for all case studies in a peak load scenario. Solar irradiation characteristics and load characteristics were collected from a local distribution company and inserted into the Digsilent power factory to examine the network performance with different PV penetration levels every minute for the whole day. It is clear that the voltage profile improved as PV penetration increased and the voltage profiles are within the acceptable voltage limits for case 1 and case 2. However, for case 3, the voltage profiles at nodes 27, 28, and 29 violate lower voltage limits even at 100% PV penetrations. As case 3 is a contingency case, it may occur very rarely for a short period of time, and it is not a major concern. Future work will focus on the mitigation methods such as energy storage and demand response programs to mitigate voltage violations in the distribution network and enhance solar PV penetration levels into the network.
Author Contributions
Conceptualization, M.R.M. and J.P.; methodology, M.R.M., C.M.L. and J.P.; software, M.R.M.; validation, M.R.M. and J.P.; formal analysis, M.R.M.; investigation, MRM.; resources, J.P.; data curation, J.P.; writing—original draft preparation, M.R.M.; writing—review and editing, M.R.M.; visualization, M.R.M. and C.M.L.; supervision, J.P.; project administration, J.P.; funding acquisition, J.P. All authors have read and agreed to the published version of the manuscript.
Funding
This research publication is funded by J510050002–IC-6 BOLDREFRESH2025-CENTRE OF EXCELLENCE from the iRMC of Universiti Tenaga Nasional (UNITEN). from the iRMC of Universiti Tenaga Nasional.
Institutional Review Board Statement
Not applicable.
Informed Consent Statement
Not applicable.
Data Availability Statement
Not applicable.
Acknowledgments
The authors would like to thank the Tenaga Nasional Berhad (TNB), Malaysia, for supporting this research under a TNB R&D Seeding Fund (U-TD-RD-21-14) and UNITEN R&D Sdn. Bhd. The APC is funded by J510050002–IC-6 BOLDREFRESH2025-CENTRE OF EXCELLENCE from iRMC of Universiti Tenaga Nasional.
Conflicts of Interest
The authors declare no conflict of interest.
References
- Wu, S.; Liu, L.; Zhang, B.; Gao, Y.; Shang, L.; He, S.; Li, S.; Zhang, P.; Chen, S.; Wang, Y. Multifunctional two-dimensional benzodifuran-based polymer for eco-friendly perovskite solar cells featuring high stability. ACS Appl. Mater. Interfaces 2022, 14, 41389–41399. [Google Scholar] [CrossRef]
- Gervais, E.; Shammugam, S.; Friedrich, L.; Schlegl, T. Raw material needs for the large-scale deployment of photovoltaics–Effects of innovation-driven roadmaps on material constraints until 2050. Renew. Sustain. Energy Rev. 2021, 137, 110589. [Google Scholar] [CrossRef]
- Huang, J.; He, S.; Zhang, W.; Saparbaev, A.; Wang, Y.; Gao, Y.; Shang, L.; Dong, G.; Nurumbetova, L.; Yue, G. Efficient and Stable All-Inorganic CsPbIBr2 Perovskite Solar Cells Enabled by Dynamic Vacuum-Assisted Low-Temperature Engineering. Sol. RRL 2022, 6, 2100839. [Google Scholar] [CrossRef]
- Chua, S.C.; Oh, T.H. Solar energy outlook in Malaysia. Renew. Sustain. Energy Rev. 2012, 16, 564–574. [Google Scholar] [CrossRef]
- Maghami, M.R.; Gomes, C.; Hizam, H.; bin Othman, M.L. Design of 24 Hour Energy Generation from Renewable Energy. In Proceedings of the 2015 IEEE European Modelling Symposium, Madrid, Spain, 6–8 October 2015; pp. 284–287. [Google Scholar]
- Chaudhary, P.; Rizwan, M. Voltage regulation mitigation techniques in distribution system with high PV penetration: A review. Renew. Sustain. Energy Rev. 2018, 82, 3279–3287. [Google Scholar] [CrossRef]
- Bandara, W.G.C.; Almeida, D.; Godaliyadda, R.I.; Ekanayake, M.P.; Ekanayake, J. A complete state estimation algorithm for a three-phase four-wire low voltage distribution system with high penetration of solar PV. Int. J. Electr. Power Energy Syst. 2021, 124, 106332. [Google Scholar] [CrossRef]
- Imam, A.A.; Al-Turki, Y.A. Techno-economic feasibility assessment of grid-connected PV systems for residential buildings in Saudi Arabia—A Case Study. Sustainability 2019, 12, 262. [Google Scholar] [CrossRef] [Green Version]
- Wang, Q.; Yao, W.; Fang, J.; Ai, X.; Wen, J.; Yang, X.; Xie, H.; Huang, X. Dynamic modeling and small signal stability analysis of distributed photovoltaic grid-connected system with large scale of panel level DC optimizers. Appl. Energy 2020, 259, 114132. [Google Scholar] [CrossRef]
- Sreekumar, S.; Savier, J.S. Investigative scheme to assess ultimate penetration level of grid connected solar photovoltaic systems in distribution network. Int. Trans. Electr. Energy Syst. 2021, 31, e12647. [Google Scholar] [CrossRef]
- Coelho, F.C.R.; da Silva Junior, I.C.; Dias, B.H.; Peres, W.; Ferreira, V.H.; Marcato, A.L.M. Optimal distributed generation allocation in unbalanced radial distribution networks via empirical discrete metaheuristic and steepest descent method. Electr. Eng. 2021, 103, 633–646. [Google Scholar] [CrossRef]
- Ding, M.; Xu, Z.; Wang, W.; Wang, X.; Song, Y.; Chen, D. A review on China’s large-scale PV integration: Progress, challenges and recommendations. Renew. Sustain. Energy Rev. 2016, 53, 639–652. [Google Scholar] [CrossRef]
- Prusty, B.R.; Jena, D. A critical review on probabilistic load flow studies in uncertainty constrained power systems with photovoltaic generation and a new approach. Renew. Sustain. Energy Rev. 2017, 69, 1286–1302. [Google Scholar] [CrossRef]
- Allahvirdizadeh, Y.; Galvani, S.; Shayanfar, H. Data clustering based probabilistic optimal scheduling of an energy hub considering risk-averse. Int. J. Electr. Power Energy Syst. 2021, 128, 106774. [Google Scholar] [CrossRef]
- Almeida, D.; Pasupuleti, J.; Raveendran, S.K.; Khan, M.R.B. Monte Carlo analysis for solar PV impact assessment in MV distribution networks. Indones. J. Electr. Eng. Comput. Sci. 2021, 23, 23–31. [Google Scholar] [CrossRef]
- Atmaja, W.Y.; Putranto, L.M. A Voltage Rise Mitigation Control Scheme of Utility-Scale Battery in High PV Penetration. In Proceedings of the 2021 3rd International Conference on High Voltage Engineering and Power Systems (ICHVEPS), Bandung, Indonesia, 5–6 October 2021; pp. 634–639. [Google Scholar]
- Aleem, S.A.; Hussain, S.S.; Ustun, T.S. A review of strategies to increase PV penetration level in smart grids. Energies 2020, 13, 636. [Google Scholar] [CrossRef] [Green Version]
- Alsafasfeh, Q.; Saraereh, O.A.; Khan, I.; Kim, S. Solar PV grid power flow analysis. Sustainability 2019, 11, 1744. [Google Scholar] [CrossRef] [Green Version]
- Gaitán, L.F.; Gómez, J.D.; Rivas-Trujillo, E. Quasi-Dynamic Analysis of a Local Distribution System with Distributed Generation. Study Case: The IEEE 13 Nodes System. TecnoLógicas 2019, 22, 140–157. [Google Scholar] [CrossRef] [Green Version]
- DIgSilent, P.P. DIgSilent, Digsilent Powerfactory 15 User Manual. 2017, 1. Available online: https://www.digsilent.de/ (accessed on 12 February 2023).
- Raoofsheibani, D.; Henschel, D.; Hinkel, P.; Ostermann, M.; Wellssow, W.H.; Spanel, U. Quasi-dynamic model of VSC-HVDC transmission systems for an operator training simulator application. Electr. Power Syst. Res. 2018, 163, 733–743. [Google Scholar] [CrossRef]
- Gaitan, L.F.; Gómez, J.D.; Trujillo, E.R. Simulation of a 14 Node IEEE System with Distributed Generation Using Quasi-dynamic Analysis. Appl. Comput. Sci. Eng. 2018, 915, 497–508. [Google Scholar]
- Schneider, K.P.; Mather, B.; Pal, B.; Ten, C.-W.; Shirek, G.J.; Zhu, H.; Fuller, J.C.; Pereira, J.L.R.; Ochoa, L.F.; de Araujo, L.R. Analytic considerations and design basis for the IEEE distribution test feeders. IEEE Trans. Power Syst. 2017, 33, 3181–3188. [Google Scholar] [CrossRef]
- Kerdoum, P.; Premrudeepreechacharn, S. Analysis of PV penetration level on low voltage system in Chiang Mai Thailand. Energy Rep. 2020, 6, 754–760. [Google Scholar] [CrossRef]
- Bhatt, G.; Affljulla, S. Analysis of large scale PV penetration impact on IEEE 39-Bus power system. In Proceedings of the 2017 IEEE 58th International Scientific Conference on Power and Electrical Engineering of Riga Technical University (RTUCON), Riga, Latvia, 12–13 October 2017; pp. 1–6. [Google Scholar]
Figure 1.
Two-bus system, and voltage calculation model.
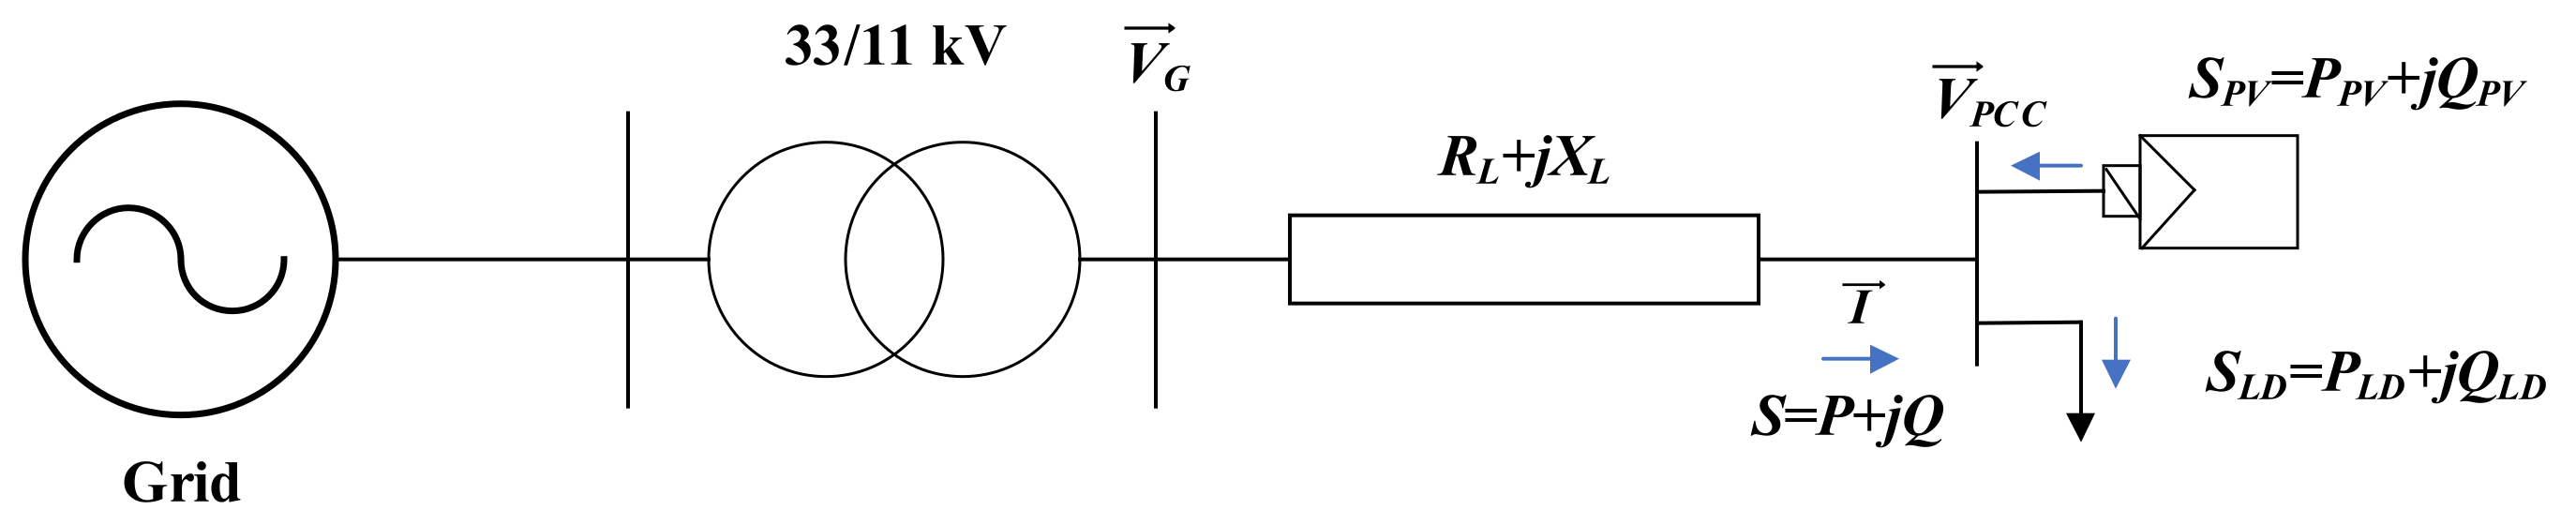
Figure 2.
Network topology for current study. There are 38 nodes across 13 feeders (F1 to F13) connected to 11 kV bus bar through two 33/11 kV, with 30 MVA transformers connected in parallel.
Figure 2.
Network topology for current study. There are 38 nodes across 13 feeders (F1 to F13) connected to 11 kV bus bar through two 33/11 kV, with 30 MVA transformers connected in parallel.

Figure 3.
Network evaluation strategies including static and dynamic power flow analysis for three case studies in both no-load and peak load conditions.
Figure 3.
Network evaluation strategies including static and dynamic power flow analysis for three case studies in both no-load and peak load conditions.

Figure 4.
Voltage profile under no-load conditions for three case studies. (a) Case 1, (b) case 2, and (c) case 3.
Figure 4.
Voltage profile under no-load conditions for three case studies. (a) Case 1, (b) case 2, and (c) case 3.

Figure 5.
Voltage profile under peak load conditions for three case studies. (a) Case 1, (b) case 2, and (c) case 3.
Figure 5.
Voltage profile under peak load conditions for three case studies. (a) Case 1, (b) case 2, and (c) case 3.
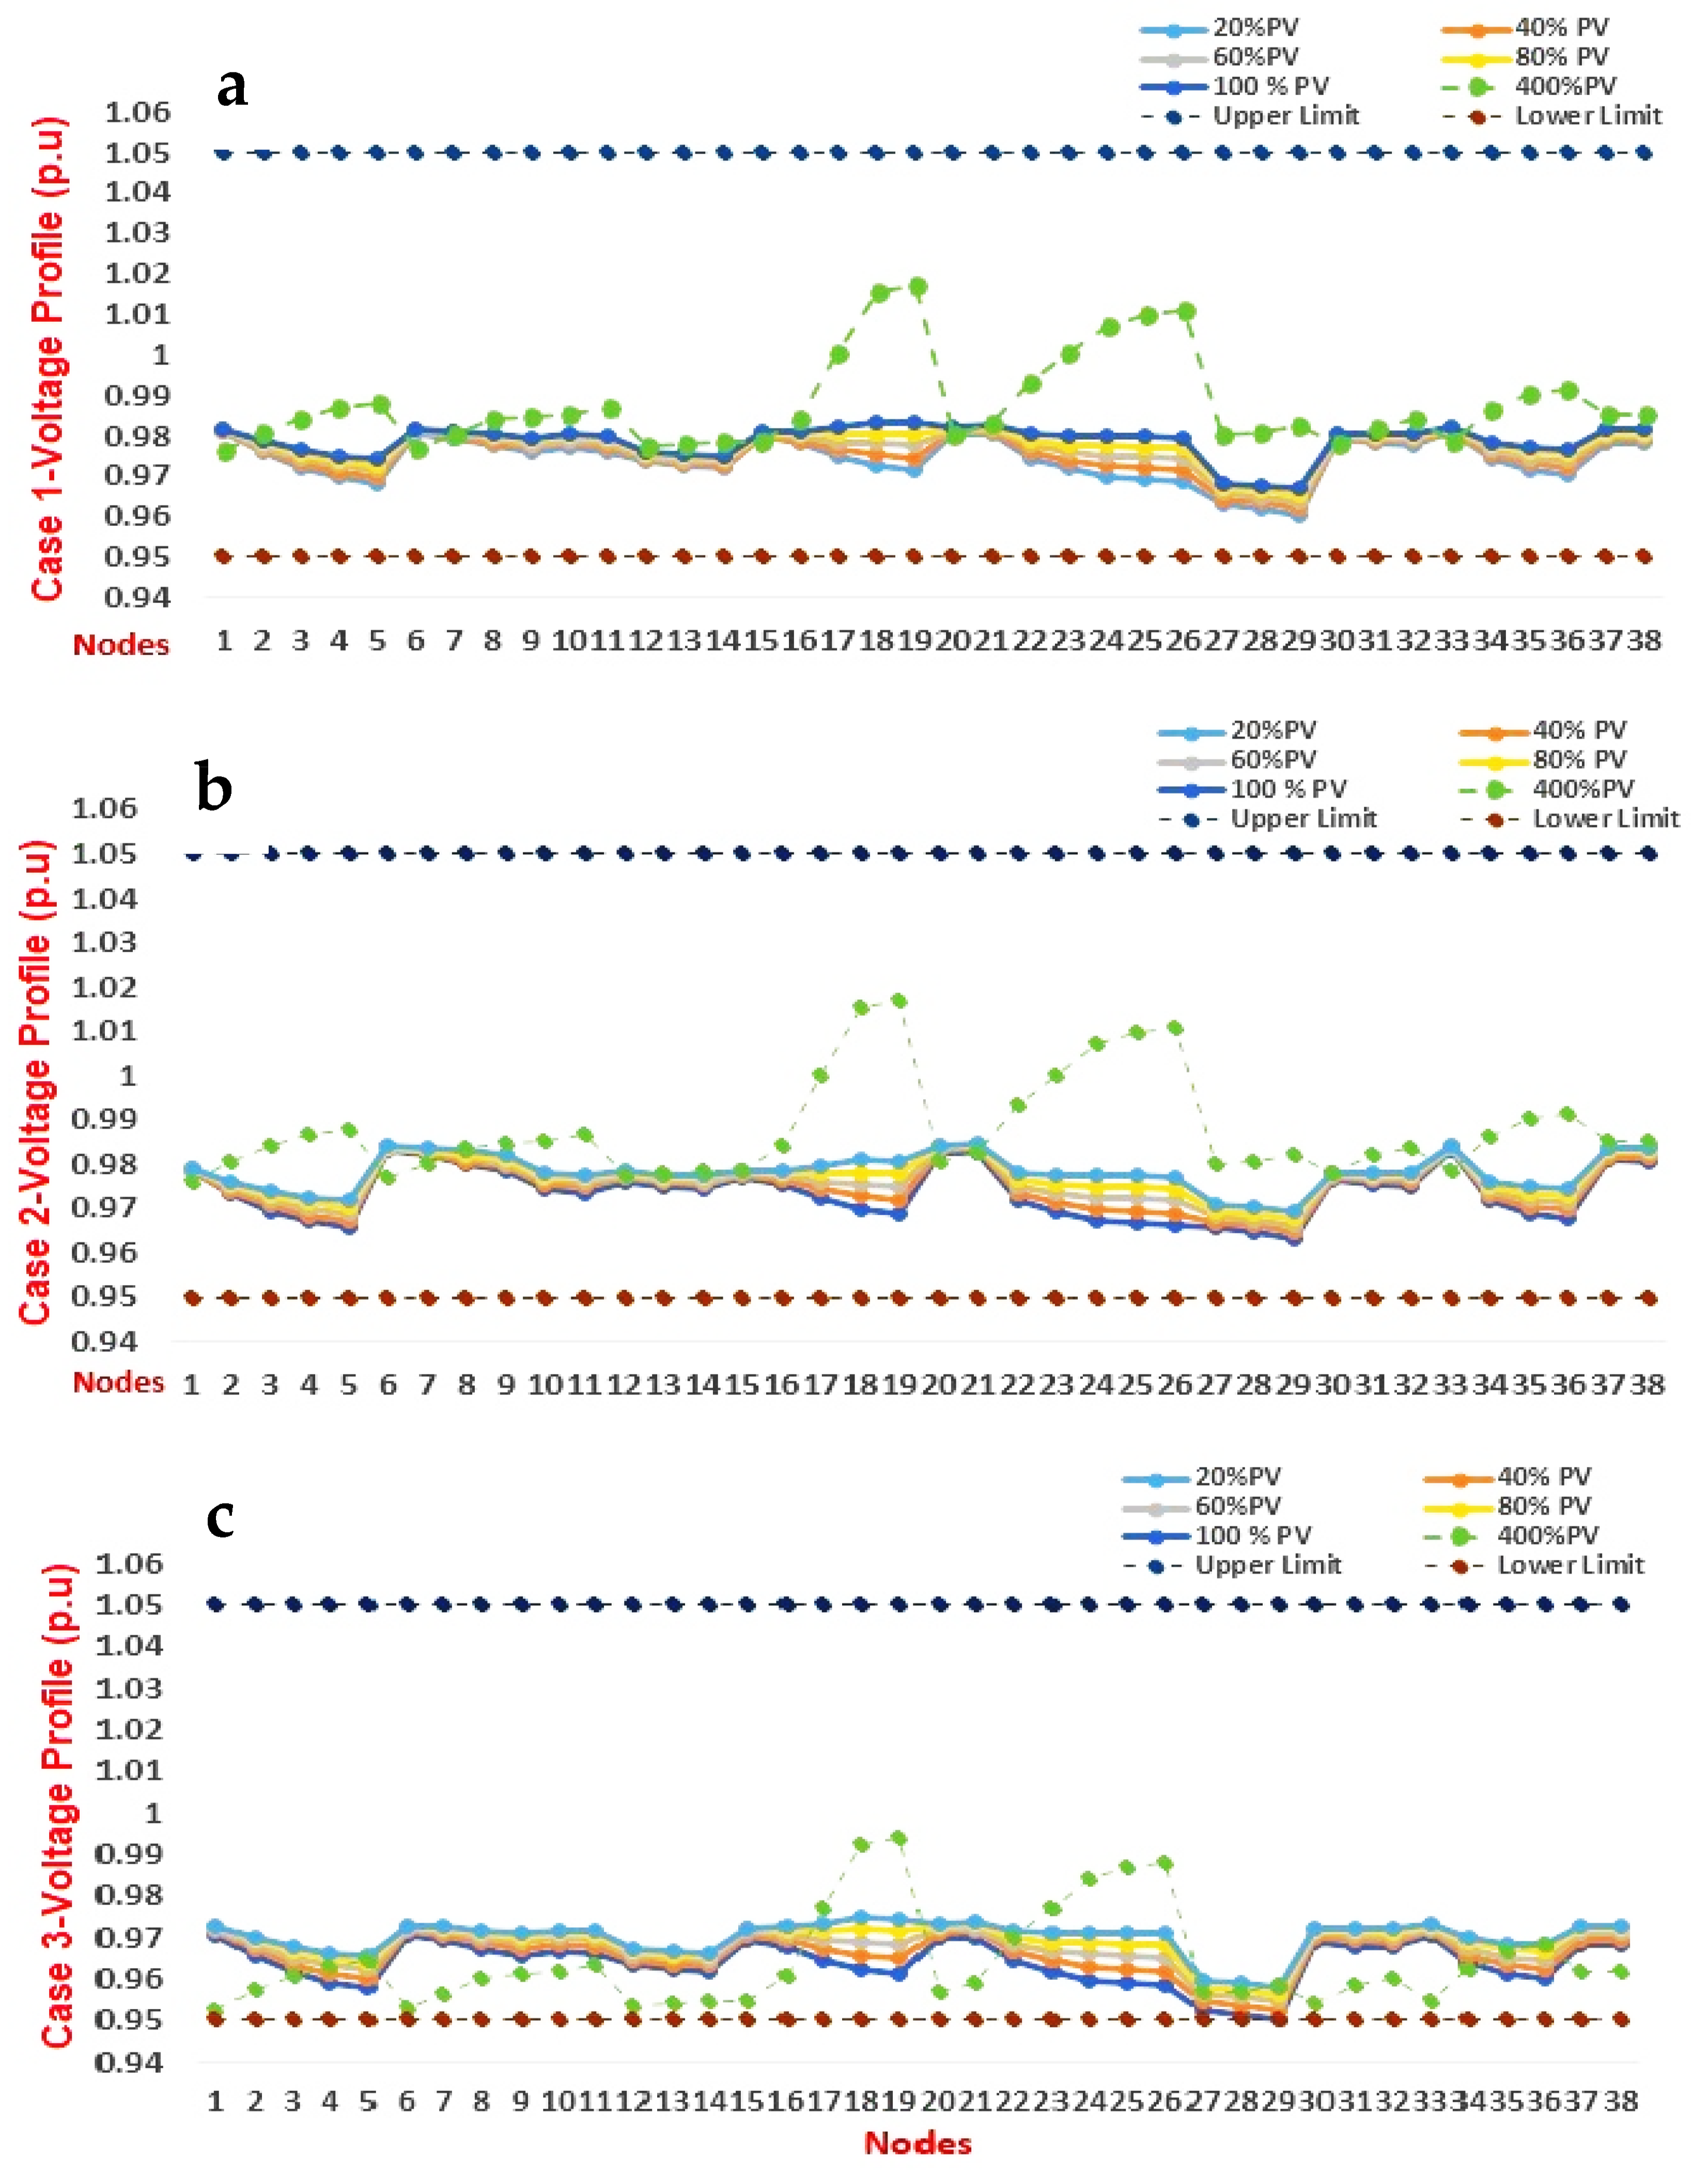
Figure 6.
Normalized solar PV generation and load consumption profile.

Figure 7.
Voltage profiles of nodes under no-load Conditions. (a) Case 1, (b) case 2, and (c) case 3.
Figure 7.
Voltage profiles of nodes under no-load Conditions. (a) Case 1, (b) case 2, and (c) case 3.

Table 1.
Load specification among feeders.
| Feeder | P (MW) | Q (MVAR) | Nodes |
|---|---|---|---|
| 1 | 0.085 | 0.043 | 1 |
| 2 | 2.929 | 1.465 | 2, 3, 4, 5 |
| 3 | 1.158 | 0.579 | 6, 7, 8,9 |
| 4 | 0.902 | 0.451 | 10, 11 |
| 5 | 3.249 | 1.624 | 12, 13, 14 |
| 6 | 2.169 | 1.085 | 15, 16, 17, 18, 19 |
| 7 | 0.485 | 0.243 | 20, 21 |
| 8 | 2.026 | 1.013 | 22, 23, 24, 25, 26, |
| 9 | 2.502 | 1.251 | 27, 28, 29 |
| 10 | 1.939 | 0.969 | 30, 31, 32 |
| 11 | 0.148 | 0.074 | 33 |
| 12 | 1.740 | 0.870 | 34, 35, 36 |
| 13 | 0.716 | 0.358 | 37, 38 |
| Total | 20.818 | 10.409 |
Table 2.
Power losses among different case studies under peak load conditions.
| Solar PV Penetration | Power Losses (kW) | |||
|---|---|---|---|---|
| Solar PV (kW) | Solar PV Percentage | Case Study 1 | Case Study 2 | Case Study 3 |
| 0 | 0% | 178 | 180 | 191 |
| 100 | 20% | 152 | 152 | 165 |
| 200 | 40% | 136 | 137 | 145 |
| 300 | 60% | 121 | 122 | 129 |
| 400 | 80% | 108 | 109 | 110 |
| 500 | 100% | 96 | 97 | 104 |
| 2000 | 400% | 826 | 827 | 866 |
Table 3.
Short-circuit condition under no-load condition.
| Solar PV Penetration | Short-Circuit Current (A) | ||||||
|---|---|---|---|---|---|---|---|
| Solar PV (kW) | Solar PV Percentage | Case Study 1 | Case Study 2 | Case Study 3 | |||
| 33 kV Bus | 11 kV Bus | 33 kV Bus | 11 kV Bus | 33 kV Bus | 11 kV Bus | ||
| 0 | 0% | 22,500 | 10,494 | 22,500 | 12,461 | 22,500 | 12,461 |
| 100 | 20% | 22,524 | 10,509 | 22,524 | 12,475 | 22,525 | 12,486 |
| 200 | 40% | 22,550 | 10,527 | 22,550 | 12,490 | 22,553 | 12,519 |
| 300 | 60% | 22,578 | 10,547 | 22,578 | 12,508 | 22,583 | 12,558 |
| 400 | 80% | 22,604 | 10,567 | 22,604 | 12,523 | 22,612 | 12,598 |
| 500 | 100% | 22,628 | 10,586 | 22,628 | 12,540 | 22,640 | 12,638 |
Table 4.
Short circuit under the peak load condition.
| Solar PV Penetration | Short-Circuit Current (A) | ||||||
|---|---|---|---|---|---|---|---|
| Solar PV (kW) | Solar PV Percentage | Case Study 1 | Case Study 2 | Case Study 3 | |||
| 33 kV Bus | 11 kV Bus | 33 kV Bus | 11 kV Bus | 33 kV Bus | 11 kV Bus | ||
| 0 | 0% | 22,479 | 12,461 | 22,479 | 12,461 | 22,479 | 12,413 |
| 100 | 20% | 22,505 | 12,478 | 22,505 | 12,478 | 22,507 | 12,437 |
| 200 | 40% | 22,533 | 12,499 | 22,533 | 12,499 | 22,538 | 12,468 |
| 300 | 60% | 22,562 | 12,522 | 22,562 | 12,522 | 22,571 | 12,505 |
| 400 | 80% | 22,589 | 12,547 | 22,590 | 12,547 | 22,603 | 12,544 |
| 500 | 100% | 22,614 | 12,569 | 22,615 | 12,569 | 22,632 | 12,582 |
Disclaimer/Publisher’s Note: The statements, opinions and data contained in all publications are solely those of the individual author(s) and contributor(s) and not of MDPI and/or the editor(s). MDPI and/or the editor(s) disclaim responsibility for any injury to people or property resulting from any ideas, methods, instructions or products referred to in the content. |
© 2023 by the authors. Licensee MDPI, Basel, Switzerland. This article is an open access article distributed under the terms and conditions of the Creative Commons Attribution (CC BY) license (https://creativecommons.org/licenses/by/4.0/).
Share and Cite
MDPI and ACS Style
Maghami, M.R.; Pasupuleti, J.; Ling, C.M. Impact of Photovoltaic Penetration on Medium Voltage Distribution Network. Sustainability 2023, 15, 5613. https://doi.org/10.3390/su15075613
AMA Style
Maghami MR, Pasupuleti J, Ling CM. Impact of Photovoltaic Penetration on Medium Voltage Distribution Network. Sustainability. 2023; 15(7):5613. https://doi.org/10.3390/su15075613
Chicago/Turabian StyleMaghami, Mohammad Reza, Jagadeesh Pasupuleti, and Chee Mei Ling. 2023. "Impact of Photovoltaic Penetration on Medium Voltage Distribution Network" Sustainability 15, no. 7: 5613. https://doi.org/10.3390/su15075613
Note that from the first issue of 2016, this journal uses article numbers instead of page numbers. See further details here.