Abstract
The application of selenium (Se) can promote the growth of potatoes and increase the Se content of potato tubers. Nitrogen (N) can promote nutrient absorption and potato yield. However, the effects of Se and N on the yield and Se content of potato tubers have not been reported. Field experiments were conducted in 2019–2020 and 2020–2021. Three N levels, i.e., 0 kg N ha−1 (N0), 150 kg N ha−1 (N1) and 200 kg N ha−1 (N2), and three Se levels, i.e., 0 g Se ha−1 (Se0), 500 g Se ha−1 (Se1) and 1000 g Se ha−1 (Se2), were set up. Potato yield, root dry weight, root activity, leaf area index (LAI), net photosynthetic rate (Pn), malondialdehyde (MDA) content, antioxidant enzyme activity and Se content were investigated. N application increased root dry weight and activity, LAI, antioxidant enzymes activities, Se content and decreased MDA content. Pn, total potato yield and commercial potato yield first increased and then decreased with the increase in N application level. Se application increased root activity, Pn, antioxidant enzyme activities, total yield, commercial potato yield, commercial potato rate, Se content and decreased MDA content. In general, compared with the single application, the combination of N and Se fertilizers further promoted the growth of potatoes, increased the yield of potatoes and the Se content of potato pieces.
1. Introduction
Potatoes, as both vegetable and grain crops, are rich in various nutrients, such as starch, protein, carbohydrates and vitamins, and also have certain medicinal value [1]. Selenium (Se) is one of the essential trace elements for humans and animals, and Se deficiency or excess can cause various diseases [2]. Se has many functions in humans, such as improving immunity, preventing cancer, preventing cardiovascular and cerebrovascular diseases, anti-oxidation and delaying aging [3]. Since the Se element required by the human body can only be obtained through the food chain, agricultural production often supplements the Se element in crops by adding selenium fertilizer [2]. The planting area of potatoes is second only to wheat, rice and corn [4]. Eating selenium-rich foods with potato as a raw material is a safe and effective way to supplement Se in humans [5].
Se is also one of the beneficial elements for crops, which plays an important role in promoting crop growth, and for developing and improving nutritional quality [6,7]. The absorption and enrichment of Se by crops with Se fertilizer have been reported in crops, such as broccoli [8], wheat [9], rice [10] and lettuce [11]. Similarly, Zhang et al. [12] reported that the content of organic selenium in potato tubers was increased by foliar spraying of sodium selenite during the expansion stage of potato tubers. However, the concentration range of Se to promote crop growth is narrow, and insufficient Se application has no significant beneficial effect on crop growth, but excessive Se application will cause Se toxicity in plants [13]. Furthermore, excessive application of Se that is not absorbed by plants will pollute the environment [14]. The effect of Se on potato growth and Se enrichment is affected by the Se application method, potato variety and growth environment [12,15], so more research is needed on selenium-enriched potato production.
Nitrogen (N) is an important factor in determining potato yield and quality [16]. A reasonable supply of N fertilizer not only meets the growth needs of crops, but also avoids environmental pollution and resource waste caused by N loss [17,18]. N promotes crop root development, increases nutrient uptake by plants and also increases Se uptake [19,20]. N can promote potato root development, increase nutrient absorption [21,22], improve net photosynthetic rate and promote yield formation [23]. However, its effect on Se absorption has not yet been reported.
The purpose of this study is: 1. Explore the potential of Se and N fertilizer combined application to promote potato growth and yield. 2. Explore the effect of N application levels on Se absorption by potatoes. This study provides a reference for improving potato yield and nutritional quality.
2. Materials and Methods
2.1. Experimental Site
The study was conducted in Jingzhou County, Hubei Province, China (112°04′ N–112°05′ N, 30°32′ E–30°33′ E), during the periods 2019–2020 and 2020–2021. This area belongs to the northern subtropical agricultural climate zone. Figure 1 shows the meteorological data during the test. The soil texture of the experimental field is sandy loam, the agrochemical index of soil (0–20 cm) is pH 6.34, organic matter is 26.88 g kg−1, available N is 205.46 mg kg−1, 12.02 mg kg−1 available P, 131.49 mg kg−1 available K. “Zaodabai”, a potato variety with high yield and a growth period of 60 days (from emergence to maturity), was planted as the planting material [24].
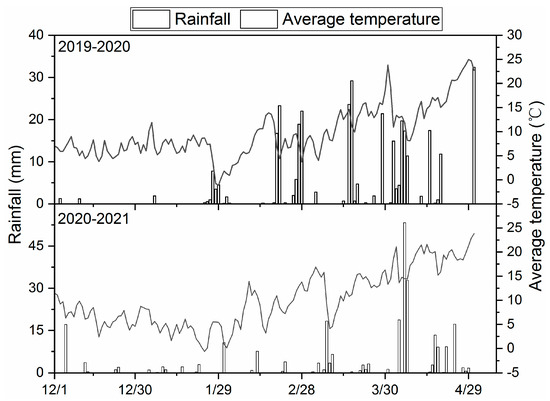
Figure 1.
The meteorological data during the test.
2.2. Experimental Treatments and Design
The split plot design was adopted in the experiment, with N application level as the main plot and Se application level as the subplot (Table 1). In this study, three levels of selenium and three levels of nitrogen were applied, and three replicates were designed for each treatment. A total of 27 sample plots (4.0 m × 6.0 m) were established in the field. The three N application levels were 0 kg N ha−1 (N0), 150 kg N ha−1 (N1) and 200 kg N ha−1 (N2), which were applied before sowing (70%) and 20 days after emergence (30%) in the form of urea, respectively. The three Se application levels were 0 g Se ha−1 (Se0), 500 g Se ha−1 (Se1) and 1000 g Se ha−1 (Se2), which were applied mixed with urea before sowing in the form of sodium selenite. All the treatments received P2O5 (120 kg ha−1) and K2O (270 kg ha−1) in the form of calcium super phosphate and potassium chloride, respectively. All calcium super phosphate were applied as basal fertilizer, 70% of potassium chloride were applied as basal fertilizer, and 30% were applied 20 days after emergence. Seed tubers were planted on 1 December and were harvested around 1 May the following year. The seed tubers were planted in 2 rows on both sides of the ridge (width: 60 cm, height: 15 cm, ditch width: 40 cm). The distance between seed tubers was 25 cm in the same row. After planting the seed tubers, plastic film was spread on the ridge for heat preservation and water retention. Other management was conducted according to the local farmers’ habits, timely control of diseases and insect pests to ensure a high yield of potatoes.

Table 1.
Test Design.
2.3. Measurement Items and Methods
2.3.1. Potato Yield
All plots were harvested to estimate tuber yield and the percentages of commodity potatoes (weight ≥ 100 g per potato). Commodity potato rate = commodity potato yield/total yield.
2.3.2. Root Function
Root dry weight and root activity indicate root function. During the expansion period of the potato pieces, the roots from 10 potato plants were collected and stored at −80 °C after freezing in liquid N for 3 min to measure root activity. Root activity was measured using the triphenyl tetrazolium chloride (TTC) method, as previously reported [25]. Briefly, 0.5 g of the sample was placed in a 10 mL beaker with 0.4% TTC and 66 mM sodium phosphate buffer at different ClO2 concentrations. Then, the sample was placed into a graduated tube containing 10 mL methanol. After that, the tube was placed in the incubator at 37 °C for 4 to 7 h until the top part was completely white. The 485 nm colorimetry was performed using a spectrophotometer. Root activity = TTC reduction (μg)/fresh root weight (g) × time (h). At the same time, 10 potato roots were taken from each plot, dried to a constant weight and weighed.
2.3.3. Leaf Area Index and Net Photosynthetic Rate
T leaf area index (LAI) was determined during the expansion period of the potato pieces by a non-destructive method using a portable plant canopy analyzer (LAI-2000, LI-COR Inc., Lincoln, NE, USA) in the field [26]. Randomly selected rows from each parcel were chosen, avoiding the first row on each side of the parcel to avoid boundary effects. At each sampling time, 16 measurements were made at two different canopy heights: in the middle of the canopy (estimated LAI of the upper layer), and in the low canopy area at the soil level (estimated LAI of the total canopy). Therefore, a total of 32 measurements were made for each figure. Finally, LAI (m2 m−2) of each canopy developed along the crop was calculated in each repetition of each treatment. The LAI of the lower canopy was calculated as the difference between the LAI of the total canopy and that of the upper canopy. Net photosynthetic rate (Pn) was measured at the same time by a gas exchange analyzer (Li-6400, Li-COR Inc., Lincoln, NE, USA) between 9:30 and 11:00 a.m., when the photosynthetic effective radiation above the canopy was 1200 mmol m − 2 s−1.
2.3.4. Oxidative Stress
During the expansion period of the potato pieces, the leaves from 10 potato plants were collected and stored at −80 °C after being frozen in liquid nitrogen for 3 min to measure the antioxidant enzyme activity and malondialdehyde (MDA) content. The fresh leaf sample was ground with liquid nitrogen to form a homogenate, 9 mL of 50 mM sodium phosphate buffer (pH 7.8) was added to the homogenate and centrifuged at 8000 rpm at 4 °C for 15 min. The supernatant was gathered for determination of superoxide dismutase (SOD), peroxidase (POD), catalase (CAT) enzyme activities, as well as MDA contents, as referred to by Jiang et al. [27]. One unit of SOD activity was the amount of enzyme induced by 50% inhibition at 560 nm at the initial reduction rate of nitroblue tetrazole. Amounts of 0.95 mL 0.2% guaiacol, 1 mL 0.3% H2O2, 1 mL sodium phosphate buffer (pH 7.8) and 0.05 mL enzyme extract constituted a mixture for POD determination. The absorbance at 470 nm was read 3 times at 30 s intervals. The amount of enzyme that caused the breakdown of 1 mg of substrate at 470 nm was defined as one unit of POD activity. Amounts of 1 mL of 0.3% H2O2, 1.95 mL distilled water and 0.05 mL enzyme extract made up the mixture for determining CAT, 1 mL was taken and the absorbance at 470 nm was read 3 times at 30 s intervals. One CAT activity unit was defined as the amount of decomposition of 1 M H2O2 in 1 min from 1 g of fresh leaf sample at A240. The 1.5 mL enzyme extract was mixed with 0.5 mL thiobarbituric acid solution and 5% trichloroacetic acid to measure MDA content. The reaction mixture was heated at 100 °C for 15 min in a water bath and then quickly cooled in an ice bath and centrifuged at 3000 rpm for 15 min. The absorbance of the colored supernatant was measured at 450 nm, 532 nm and 600 nm, respectively. The MDA content was calculated by using the formula: MDA content = 6.45(OD532 − OD600) − 0.599OD450.
2.3.5. Determination of Se Concentrations
During the potato harvesting period, 10 plant potato nuggets were collected from each plot for the determination of Se content. Contents of total Se and organic Se in the seedlings and polished rice were determined according to the method by Deng et al. [28].
2.4. Statistical Analyses
All experimental data were obtained from 2019 to 2021, and the data were statistically analyzed using SPSS 21.0 and expressed as the mean ± standard error (SE) of three replicates. The data were tested for normal distribution and homogeneity of variance using the Shapiro-Wilk test and Levene test, respectively. One-way ANOVA was used to compare the differences of the same index between two years. The effects of N administration level, Se administration level and their interaction were compared using multivariate analysis of variance. For data analysis, 2 significance levels were set at p < 0.05 and p < 0.01.
3. Results
3.1. Root Dry Weight and Root Activity
Root activity increased with the increase in N and Se application (Figure 2). Compared with N0, N application increased root activity by 48.21~56.85%, and, compared with Se0, Se application increased root activity by 17.08~34.21%. There was no significant difference in root dry weight between N1 and N2. Compared with N0, N application increased root dry weight by 15.08~15.94%. The interaction of N and Se treatments had significant effects on root activity. In N0, N1 and N2, root activity was increased by 14.17~23.49%, 14.40~29.34% and 21.81~46.61% by applying Se, respectively. In general, N application increased root dry weight and activity, and Se application increased root activity, and, with the increase in N application level, the effect of Se application on root activity was more obvious.
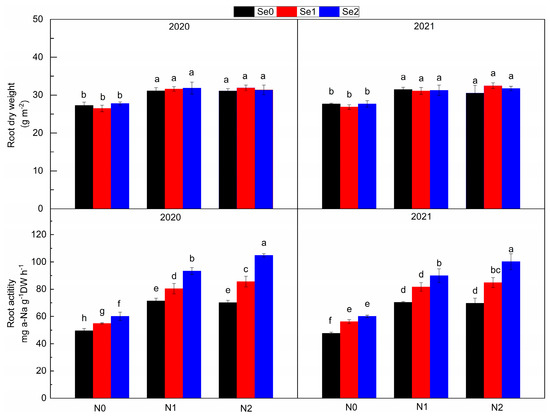
Figure 2.
Root dry weight and root activity under three nitrogen application levels and three selenium application levels in the periods 2019–2020 and 2020–2021. N0, N1 and N2 mean 0 kg N ha−1, 150 kg N ha−1 and 200 kg N ha−1 and Se1, Se2 and Se3 mean 0 g Se ha−1, 500 g Se ha−1 and 1000 g Se ha−1, respectively. Different lowercase letters indicate statistical differences among treatments at p < 0.05.
3.2. Leaf Area Index and Net Photosynthetic Rate
The levels of N application had a significant impact on LAI and Pn (Figure 3). Compared with N0, LAI increased by 15.39% in N1 and by 34.15% in N2, and Pn increased by 26.57% in N1 and by 9.52% in N2, respectively. The levels of Se applied had a significant effect on Pn. Compared with Se0, Pn increased by 9.81% and 17.19% in Se1 and Se2, respectively. In general, with the increase in N application, LAI continued to increase, and Pn first increased and then decreased, while, with the increase in Se application, only Pn continued to increase.
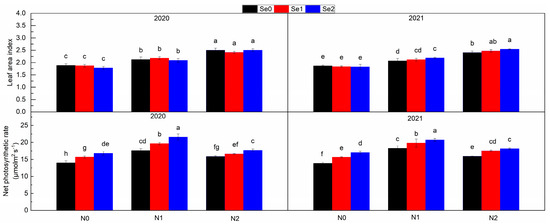
Figure 3.
Leaf area index and net photosynthetic rate under three nitrogen application levels and three selenium application levels in the periods 2019–2020 and 2020–2021. N0, N1 and N2 mean 0 kg N ha−1, 150 kg N ha−1 and 200 kg N ha−1 and Se1, Se2 and Se3 mean 0 g Se ha−1, 500 g Se ha−1 and 1000 g Se ha−1, respectively. Different lowercase letters indicate statistical differences among treatments at p < 0.05.
3.3. Malondialdehyde Content and Superoxide Dismutase, Peroxidase and Catalase Enzyme Activities
N application increased the activity of three antioxidant enzymes and decreased the content of MDA, but the effect was not significantly different between N1 and N2 treatments (Figure 4). Compared with N0, N application reduced MDA content by 13.05~17.55%, and increased the activities of SOD, POD and CAT by 9.13~10.08%, 6.94~7.40% and 11.51~12.40%, respectively. With the increase in Se application level, the activities of three antioxidant enzymes increased and the content of MDA decreased. Compared with Se0, Se application reduced MDA content by 13.05~17.55%, and increased SOD, POD and CAT activities by 8.19~15.65%, 8.03~15.34% and 14.34~28.41%, respectively. The interaction of N and Se treatments had a significant impact on MDA content and CAT activity. In general, with the increase in N application, the effect of Se in reducing MDA content and increasing CAT activity decreased.
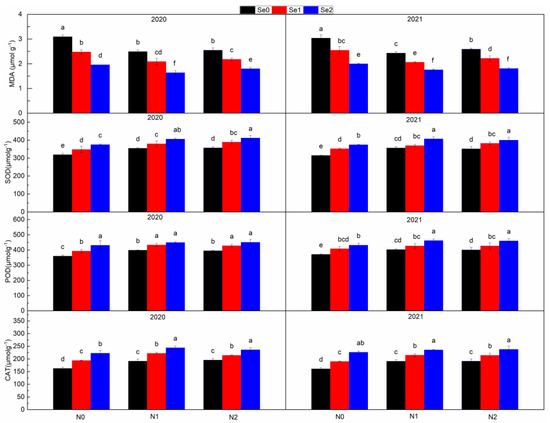
Figure 4.
Malondialdehyde content and antioxidase activities under three nitrogen application levels and three selenium application levels in the periods 2019–2020 and 2020–2021. N0, N1 and N2 mean 0 kg N ha−1, 150 kg N ha−1 and 200 kg N ha−1 and Se1, Se2 and Se3 mean 0 g Se ha−1, 500 g Se ha−1 and 1000 g Se ha−1, respectively. Different lowercase letters indicate statistical differences among treatments at p < 0.05.
3.4. Potato Yield
Total potato yield and commercial potato yield first increased and then decreased with the increase in N application level (Figure 5). Compared with N0, the total yield increased by 0.57 t ha−1 in N1 and by 0.33 t ha−1 in N2, and the yield of commercial potato increased by 0.54 t ha−1 in N1 and 0.35 t ha−1 in N2, respectively. With the increase in Se application level, the total yield, commercial potato yield and commercial potato rate significantly increased. Compared with Se0, the total yield increased by 0.08~0.19 t ha−1, the commercial potato yield increased by 0.16~0.35 t ha−1 and the commercial potato rate increased by 3.57~7.35% in Se application treatments. The interaction of N and Se treatments has a significant impact on the total yield of potatoes. In general, with the increase in N application, the effect of Se application on the total yield of potato increases.
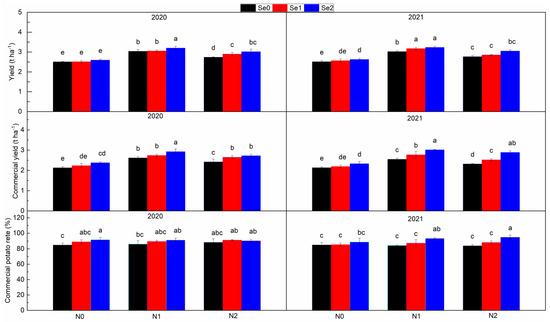
Figure 5.
Total potato yield, commercial potato yield and commercial potato rate under three nitrogen application levels and three selenium application levels in the periods 2019–2020 and 2020–2021. N0, N1 and N2 mean 0 kg N ha−1, 150 kg N ha−1 and 200 kg N ha−1 and Se1, Se2 and Se3 mean 0 g Se ha−1, 500 g Se ha−1 and 1000 g Se ha−1, respectively. Different lowercase letters indicate statistical differences among treatments at p < 0.05.
3.5. Selenium Content in Potato
With the increase in N and Se application levels, the total Se content and organic Se content in tubers significantly increased (Figure 6). Compared with N0, N application increased the total Se content by 9.24~14.01% and the organic Se content by 10.53~17.37%. Compared with Se0, Se application increased the total Se content by 3.56~5.07 times and the organic Se content by 3.13~3.53 times. The interaction of N and Se treatment had a significant effect on the contents of total Se and organic Se. With the increase in N application, the effect of Se application on total Se content and organic Se content increased.
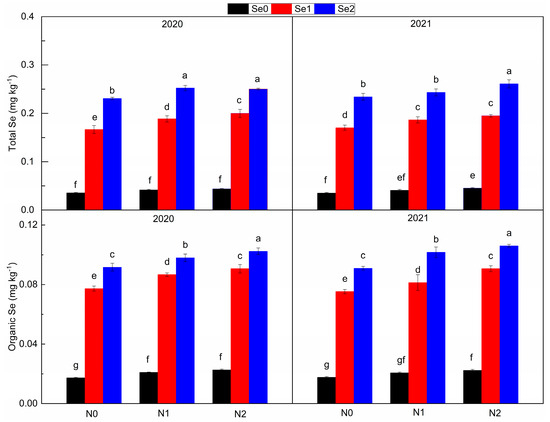
Figure 6.
Total selenium content and organic selenium content under three nitrogen application levels and three selenium application levels in the periods 2019–2020 and 2020–2021. N0, N1 and N2 mean 0 kg N ha−1, 150 kg N ha−1 and 200 kg N ha−1 and Se1, Se2 and Se3 mean 0 g Se ha−1, 500 g Se ha−1 and 1000 g Se ha−1, respectively. Different lowercase letters indicate statistical differences among treatments at p < 0.05.
4. Discussion
Root systems are important for plant fixation, nutrient and water uptake, storage and as the primary intermediary between plants and their soil environment [29,30]. We found that N application significantly increased root dry weight and root activity. Nitrogen fertilization increased available nitrogen concentrations in soil and promoted plant growth [31]. However, from N1 to N2, the root dry weight and root activity did not significantly increase. Similarly, Joshi et al. [32] reported that high nitrate reduced the number and length of lateral roots and the length of adventitious roots. Li et al. [33] reported that high N application inhibited storage root differentiation and sharply decreased root biomass under drought conditions; in addition, high N affected the pH and EC in the soil, which was not conducive to root development. In this study, root activity increased with Se application. Previously, Se has been repeatedly reported to enhance root activity on wheat [34], cucumbers [35] and potatoes [36]. It is worth noting that, under N2 treatment, Se increased potato root activity more efficiently, indicating that Se may alleviate the stress of high N on potato root development.
Leaf photosynthetic rate is determined by the available light energy and by the efficiency of light capture, and LAI determines the ability to intercept light, and Pn reflects the utilization efficiency of intercepted light [37,38]. In this study, with the increase in N application rate, LAI continued to increase, but Pn first increased and then decreased. Excessive N input will cause the ineffective growth of plant vegetative organs, such as ineffective tillering of rice, or late maturity and oversized LAI of crops, which may be not conducive to the formation of crop yields [39,40]. It has been reported that although N supply promotes crop photosynthesis, high N input can limit plant photosynthesis capacity [31,41]. In addition, having too large LAI to shade the leaves from each other will also reduce Pn [42]. Pn increased with the increase in Se application rate, which was consistent with previous conclusions [43]. The ability of Se to promote crop photosynthesis has been proven in a variety of crops [10,44].
In plant cells, SOD, POD and CAT are important antioxidant enzymes, and MDA reflects the degree of plant stress [27]. In the present study, antioxidant enzyme activity increased and MDA content decreased under N supply, but they were not significantly different between N1 and N2. Nutrient deficiency promotes the formation of reactive oxygen species (ROS) in plants, thereby inducing oxidative stress [45]. N supply increases antioxidant enzyme activity and reduces MDA content [46]. It has been reported that excessive N application also promotes the formation of ROS [47]. In this study, N uptake by plants may not reach the threshold for promoting ROS formation after excessive N application. We found that antioxidant enzyme activity increased and MDA content decreased as Se application increased. The effect of Se on improving the antioxidant capacity of crops has been reported many times [48,49], and it was affected by the Se application level [50,51], indicating that the Se application level used in this study was within the range for promoting potato growth. The effect of Se on reducing MDA content and increasing CAT activity decreased with increasing N application, which may be because the effect of N supply in improving crop antioxidant capacity partially replaced the similar effect of Se.
Increasing potato yield is the key to fulfilling the goal of potato staple food in China, and the yield of commercial potato determines the income of farmers from potato planting. We observed that potato yield, commercial potato yield and commercial potato rate all increased with increasing N application rates, but they were not significantly different between N1 and N2. Woli et al. [52] reported that, with increasing nitrogen application, potato yield always increased, but profit first increased and then decreased, while nitrate exudation always increased. Liu et al. [53] reported that both potato yield and soil residual nitrogen content increased with increasing nitrogen application rates. Nitrogen is an essential nutrient element for potato growth, which can improve potato root function and photosynthesis ability, delay leaf senescence and promote potato germination [54,55]. However, in this paper, excessive nitrogen input did not improve potato yield and commercial potato yield. Therefore, nitrogen application should be optimized considering cost, benefits and the environment. Through meta-analysis, Wang et al. [23] found that the optimal nitrogen application rate for potato planting in South China to maximize nitrogen use efficiency without sacrificing yield is 126 kg N ha−1, which is similar to our research results. Se fertilization always improved potato yield, commercial potato yield and commercial potato rate, which is consistent with previous conclusions [56]. The reason may be that selenium fertilization increased root function, photosynthesis ability and antioxidant capacity (Figure 1, Figure 2 and Figure 3), and promoted the formation of potato yield. In addition, the effect of increasing Se application on potato yield increased with nitrogen fertilization.
Increasing organic Se content in potato tubers by applying Se fertilizer is essential for human health [12]. We found that N application increased the total Se and organic Se content of potato tubers, which was consistent with previous conclusions [57,58]. N application improved potato root function, increased the absorption of Se by the root system and then increased the Se content in potato pieces [59]. Additionally, N application activates sulfur (S) metabolism and increases S assimilation by increasing O-acetyl serine, a key regulator of S metabolism in cysteine synthesis in higher plants, and then increases the synthesis of cysteine and protein [60], so N may also facilitate plant uptake and conversion of Se because of the similar structure of S and Se [61,62]. In this study, the content of total Se and organic Se in potato pieces increased with the increase in Se application rate. There is no doubt that Se fertilization increases Se content in plants [63]. In addition, with the increase in N application, the effect of Se application in increasing the total and organic Se content of potato pieces increased.
5. Conclusions
Potato root function, photosynthetic capacity, antioxidant capacity, yield and Se content increased under both Se and N applications, but further increasing N application did not improve root function, Pn, antioxidant capacity and yield. A combination of N and Se fertilization results in higher potato yield and higher Se content in tubers. Applying 150 kg N ha−1 and 1000 g Se ha−1 was the combination with the highest yield and selenium content of potato.
Author Contributions
S.L. and H.C. designed the experiments; S.L. and S.J. analyzed the data and wrote the article; S.L., D.X. and F.H. performed the trait investigation; and S.L., D.X. and B.D. revised and edited the manuscript. All the authors read and approved the final manuscript. S.L. and H.C. have contributed equally to this work. All authors have read and agreed to the published version of the manuscript.
Funding
Selection of new potato varieties with high quality and characteristics and integrated promotion of efficient technologies (HBHZD-ZB-2020-005-08).
Data Availability Statement
The datasets used and/or analyzed during the current study are available from the corresponding author on reasonable request.
Conflicts of Interest
The authors declare no conflict of interest.
References
- Zaheer, K.; Akhtar, M.H. Potato production, usage, and nutrition—A review. Crit. Rev. Food. Sci. 2016, 56, 711–721. [Google Scholar] [CrossRef] [PubMed]
- Rayman, M.P. Selenium and human health. Lancet 2012, 379, 1256–1268. [Google Scholar] [CrossRef] [PubMed]
- Burk, R.F.; Hill, K.E. Regulation of Selenium Metabolism and Transport. Annu. Rev. Nutr. 2015, 35, 109–134. [Google Scholar] [CrossRef] [PubMed]
- Zhang, H.; Xu, F.; Wu, Y.; Hu, H.-H.; Dai, X.-F. Progress of potato staple food research and industry development in China. J. Integr. Agric. 2017, 16, 2924–2932. [Google Scholar] [CrossRef]
- Haug, A.; Graham, R.D.; Christophersen, O.A.; Lyons, G.H. How to use the world’s scarce selenium resources efficiently to increase the selenium concentration in food. Microb. Ecol. Health Dis. 2007, 19, 209–228. [Google Scholar] [CrossRef]
- Hasanuzzaman, M.; Bhuyan, M.B.; Raza, A.; Hawrylak-Nowak, B.; Matraszek-Gawron, R.; Al Mahmud, J.; Nahar, K.; Fujita, M. Selenium in plants: Boon or bane? Environ. Exp. Bot. 2020, 178, 104170. [Google Scholar] [CrossRef]
- El-Ramady, H.; Abdalla, N.; Taha, H.S.; Alshaal, T.; El-Henawy, A.; Faizy, S.E.; Shams, M.S.; Youssef, S.M.; Shalaby, T.; Bayoumi, Y.; et al. Selenium and nano-selenium in plant nutrition. Environ. Chem. Lett. 2016, 14, 123–147. [Google Scholar] [CrossRef]
- Bañuelos, G.S.; Arroyo, I.; Pickering, I.J.; Yang, S.I.; Freeman, J.L. Selenium biofortification of broccoli and carrots grown in soil amended with Se-enriched hyperaccumulator Stanleya pinnata. Food Chem. 2015, 166, 603–608. [Google Scholar] [CrossRef]
- Ramkissoon, C.; Degryse, F.; Da Silva, R.C.; Baird, R.; Young, S.D.; Bailey, E.H.; McLaughlin, M.J. Improving the efficacy of selenium fertilizers for wheat biofortification. Sci. Rep. 2019, 9, 19520. [Google Scholar] [CrossRef]
- Yin, H.; Qi, Z.; Li, M.; Ahammed, G.J.; Chu, X.; Zhou, J. Selenium forms and methods of application differentially modulate plant growth, photosynthesis, stress tolerance, selenium content and speciation in Oryza sativa L. Ecotoxicol. Environ. Saf. 2019, 169, 911–917. [Google Scholar] [CrossRef]
- Shalaby, T.; Bayoumi, Y.; Alshaal, T.; Elhawat, N.; Sztrik, A.; El-Ramady, H. Selenium fortification induces growth, antioxidant activity, yield and nutritional quality of lettuce in salt-affected soil using foliar and soil applications. Plant Soil 2017, 421, 245–258. [Google Scholar] [CrossRef]
- Zhang, H.; Zhao, Z.; Zhang, X.; Zhang, W.; Huang, L.; Zhang, Z.; Yuan, L.; Liu, X. Effects of foliar application of selenate and selenite at different growth stages on Selenium accumulation and speciation in potato (Solanum tuberosum L.). Food Chem. 2019, 286, 550–556. [Google Scholar] [CrossRef] [PubMed]
- De Oliveira, V.C.; Faquin, V.; Andrade, F.R.; Carneiro, J.P.; Júnior, E.C.D.S.; de Souza, K.R.D.; Pereira, J.; Guilherme, L.R.G. Physiological and Physicochemical Responses of Potato to Selenium Biofortification in Tropical Soil. Potato Res. 2019, 62, 315–331. [Google Scholar] [CrossRef]
- Schiavon, M.; Pilon-Smits, E.A.H. Selenium Biofortification and Phytoremediation Phytotechnologies: A Review. J. Environ. Qual. 2017, 46, 10–19. [Google Scholar] [CrossRef]
- Bideshki, A.; Arvin, M.J.; Aien, A.; Hasandokht, M.R.; Khalighi, A.; Yildiz, F. Interactive effects of Foliar 24-Epibrassinolide and selenium applications on yield, reduce nitrate accumulation and selenium enrichment in potato tuber in field. Cogent Food Agric. 2019, 5, 1690315. [Google Scholar] [CrossRef]
- Gao, X.; Li, C.; Zhang, M.; Wang, R.; Chen, B. Controlled release urea improved the nitrogen use efficiency, yield and quality of potato (Solanum tuberosum L.) on silt loamy soil. Field Crop. Res. 2015, 181, 60–68. [Google Scholar] [CrossRef]
- Xia, H.; Riaz, M.; Zhang, M.; Liu, B.; Li, Y.; El-Desouki, Z.; Jiang, C. Biochar-N fertilizer interaction increases N utilization efficiency by modifying soil C/N component under N fertilizer deep placement modes. Chemosphere 2021, 286, 131594. [Google Scholar] [CrossRef]
- Hidalgo, D.; Corona, F.; Martín-Marroquín, J.M. Nutrient recycling: From waste to crop. Biomass-Convers. Biorefinery 2020, 11, 207–217. [Google Scholar] [CrossRef]
- Qiao, Y.; Yin, L.; Wang, B.; Ke, Q.; Deng, X.; Wang, S. Melatonin promotes plant growth by increasing nitrogen uptake and assimilation under nitrogen deficient condition in winter wheat. Plant Physiol. Biochem. 2019, 139, 342–349. [Google Scholar] [CrossRef]
- Balliu, A.; Sallaku, G.; Rewald, B. AMF Inoculation Enhances Growth and Improves the Nutrient Uptake Rates of Transplanted, Salt-Stressed Tomato Seedlings. Sustainability 2015, 7, 15967–15981. [Google Scholar] [CrossRef]
- Liu, C.; Rubæk, G.H.; Liu, F.; Andersen, M.N. Effect of partial root zone drying and deficit irrigation on nitrogen and phosphorus uptake in potato. Agric. Water Manag. 2015, 159, 66–76. [Google Scholar] [CrossRef]
- Nurmanov, Y.T.; Chernenok, V.G.; Kuzdanova, R.S. Potato in response to nitrogen nutrition regime and nitrogen fertilization. Field Crop. Res. 2018, 231, 115–121. [Google Scholar] [CrossRef]
- Wang, C.; Zang, H.; Liu, J.; Shi, X.; Li, S.; Chen, F.; Chu, Q. Optimum nitrogen rate to maintain sustainable potato production and improve nitrogen use efficiency at a regional scale in China. A meta-analysis. Agron. Sustain. Dev. 2020, 40, 37. [Google Scholar] [CrossRef]
- Hybrid Potato Variety Zaodabai. Hubei Agric. Sci. 2012, 51, 4676.
- Zhang, J.; Wang, Y.; Zhao, Y.; Zhang, Y.; Zhang, J.; Ma, H.; Han, Y. Transcriptome analysis reveals Nitrogen deficiency induced alterations in leaf and root of three cultivars of potato (Solanum tuberosum L.). PLoS ONE 2020, 15, e0240662. [Google Scholar] [CrossRef] [PubMed]
- Villa, P.M.; Sarmiento, L.; Rada, F.J.; Machado, D.; Rodrigues, A.C. Leaf area index of potato (Solanum tuberosum L.) crop under three nitrogen fertilization treatments. Agron. Colomb. 2017, 35, 171–175. [Google Scholar] [CrossRef]
- Jiang, S.; Du, B.; Wu, Q.; Zhang, H.; Deng, Y.; Tang, X.; Zhu, J. Selenium Decreases the Cadmium Content in Brown Rice: Foliar Se Application to Plants Grown in Cd-contaminated Soil. J. Soil Sci. Plant Nutr. 2022, 22, 1033–1043. [Google Scholar] [CrossRef]
- Deng, X.; Liu, K.; Li, M.; Zhang, W.; Zhao, X.; Zhao, Z.; Liu, X. Difference of selenium uptake and distribution in the plant and selenium form in the grains of rice with foliar spray of selenite or selenate at different stages. Field Crop. Res. 2017, 211, 165–171. [Google Scholar] [CrossRef]
- Den Herder, G.; Van Isterdael, G.; Beeckman, T.; De Smet, I. The roots of a new green revolution. Trends Plant Sci. 2010, 15, 600–607. [Google Scholar] [CrossRef]
- Xiong, R.; Liu, S.; Considine, M.J.; Siddique, K.H.; Lam, H.M.; Chen, Y. Root system architecture, physiological and transcriptional traits of soybean (Glycine max L.) in response to water deficit: A review. Physiol. Plant. 2021, 172, 405–418. [Google Scholar] [CrossRef]
- Omondi, J.O.; Lazarovitch, N.; Rachmilevitch, S.; Yermiyahu, U.; Sperling, O. High Nitrogen Availability Limits Photosynthesis and Compromises Carbohydrate Allocation to Storage in Roots of Manihot esculenta Crantz. Front. Plant Sci. 2019, 10, 1041. [Google Scholar] [CrossRef] [PubMed]
- Joshi, M.; Fogelman, E.; Belausov, E.; Ginzberg, I. Potato root system development and factors that determine its architecture. J. Plant Physiol. 2016, 205, 113–123. [Google Scholar] [CrossRef] [PubMed]
- Li, S.; Zhao, L.; Zhang, S.; Liu, Q.; Li, H. Effects of Nitrogen Level and Soil Moisture on Sweet Potato Root Distribution and Soil Chemical Properties. J. Soil Sci. Plant Nutr. 2020, 21, 536–546. [Google Scholar] [CrossRef]
- Xiaoqin, Y.; Jianzhou, C.; Guangyin, W. Effects of drought stress and selenium supply on growth and physiological characteristics of wheat seedlings. Acta Physiol. Plant. 2009, 31, 1031–1036. [Google Scholar] [CrossRef]
- Hawrylak-Nowak, B.; Matraszek, R.; Pogorzelec, M. The dual effects of two inorganic selenium forms on the growth, selected physiological parameters and macronutrients accumulation in cucumber plants. Acta Physiol. Plant. 2015, 37, 1–13. [Google Scholar] [CrossRef]
- Huang, C.; Yu, M.; Sun, L.; Qin, N.; Wei, L. Physiological responses of sweet potato seedlings under drought-stress conditions with selenium applications. J. Agric. Crop Res. 2020, 8, 98–112. [Google Scholar] [CrossRef]
- Zhang, W.; Chen, X.-X.; Liu, Y.-M.; Liu, D.-Y.; Du, Y.-F.; Chen, X.-P.; Zou, C.-Q. The role of phosphorus supply in maximizing the leaf area, photosynthetic rate, coordinated to grain yield of summer maize. Field Crop. Res. 2018, 219, 113–119. [Google Scholar] [CrossRef]
- Yang, X.; Shao, X.; Mao, X.; Li, M.; Zhao, T.; Wang, F.; Chang, T.; Guang, J. Influences of Drought and Microbial Water-Retention Fertilizer on Leaf Area Index and Photosynthetic Characteristics of Flue-Cured Tobacco. Irrig. Drain. 2019, 68, 729–739. [Google Scholar] [CrossRef]
- Zhou, C.; Jia, B.; Wang, S.; Huang, Y.; Wang, Y.; Han, K.; Wang, W. Effects of Nitrogen Fertilizer Applications on Photosynthetic Production and Yield of Japonica Rice. Int. J. Plant Prod. 2021, 15, 599–613. [Google Scholar] [CrossRef]
- Luo, Z.; Song, H.; Huang, M.; Zhang, Z.; Peng, Z.; Yang, Z.; Shen, T.; Luo, G. Dense Planting with Reducing Nitrogen Rate Increased Nitrogen Use Efficiency and Translocated Nitrogen in Grains in Double-Cropped Rice. Agronomy 2022, 12, 1090. [Google Scholar] [CrossRef]
- Bote, A.D.; Zana, Z.; Ocho, F.L.; Vos, J. Analysis of coffee (Coffea arabica L.) performance in relation to radiation level and rate of nitrogen supply II. Uptake and distribution of nitrogen, leaf photosynthesis and first bean yields. Eur. J. Agron. 2018, 92, 107–114. [Google Scholar] [CrossRef]
- Tian, G.; Gao, L.; Kong, Y.; Hu, X.; Xie, K.; Zhang, R.; Ling, N.; Shen, Q.; Guo, S. Improving rice population productivity by reducing nitrogen rate and increasing plant density. PLoS ONE 2017, 12, e0182310. [Google Scholar] [CrossRef] [PubMed]
- Shahid, M.A.; Balal, R.M.; Khan, N.; Zotarelli, L.; Liu, G.D.; Sarkhosh, A.; Fernández-Zapata, J.C.; Martínez Nicolás, J.J.; Garcia-Sanchez, F. Selenium impedes cadmium and arsenic toxicity in potato by modulating carbohydrate and nitrogen metabolism. Ecotoxicol. Environ. Saf. 2019, 180, 588–599. [Google Scholar] [CrossRef] [PubMed]
- Jiang, C.; Zu, C.; Lu, D.; Zheng, Q.; Shen, J.; Wang, H.; Li, D. Effect of exogenous selenium supply on photosynthesis, Na+ accumulation and antioxidative capacity of maize (Zea mays L.) under salinity stress. Sci. Rep. 2017, 7, srep42039. [Google Scholar] [CrossRef] [PubMed]
- Polesskaya, O.G.; Kashirina, E.I.; Alekhina, N.D. Changes in the Activity of Antioxidant Enzymes in Wheat Leaves and Roots as a Function of Nitrogen Source and Supply. Russ. J. Plant Physiol. 2004, 51, 615–620. [Google Scholar] [CrossRef]
- Huang, Z.A.; Jiang, D.A.; Yang, Y.; Sun, J.W.; Jin, S.H. Effects of Nitrogen Deficiency on Gas Exchange, Chlorophyll Fluorescence, and Antioxidant Enzymes in Leaves of Rice Plants. Photosynthetica 2004, 42, 357–364. [Google Scholar] [CrossRef]
- Rehman, M.; Yang, M.; Fahad, S.; Saleem, M.H.; Liu, L.; Liu, F.; Deng, G. Morpho-physiological traits, antioxidant capacity, and nitrogen metabolism in ramie under nitrogen fertilizer. Agron. J. 2020, 112, 2988–2997. [Google Scholar] [CrossRef]
- Zhang, M.; Tang, S.; Huang, X.; Zhang, F.; Pang, Y.; Huang, Q.; Yi, Q. Selenium uptake, dynamic changes in selenium content and its influence on photosynthesis and chlorophyll fluorescence in rice (Oryza sativa L.). Environ. Exp. Bot. 2014, 107, 39–45. [Google Scholar] [CrossRef]
- Sharma, S.; Goyal, R.; Sadana, U.S. Selenium Accumulation and Antioxidant Status of Rice Plants Grown on Seleniferous Soil from Northwestern India. Rice Sci. 2014, 21, 327–334. [Google Scholar] [CrossRef]
- Khaliq, A.; Aslam, F.; Matloob, A.; Hussain, S.; Geng, M.; Wahid, A.; Rehman, H.U. Seed Priming with Selenium: Consequences for Emergence, Seedling Growth, and Biochemical Attributes of Rice. Biol. Trace Element Res. 2015, 166, 236–244. [Google Scholar] [CrossRef]
- Wang, Y.-D.; Wang, X.; Wong, Y.-S. Proteomics analysis reveals multiple regulatory mechanisms in response to selenium in rice. J. Proteom. 2012, 75, 1849–1866. [Google Scholar] [CrossRef] [PubMed]
- Woli, P.; Hoogenboom, G.; Alva, A. Simulation of potato yield, nitrate leaching, and profit margins as influenced by irrigation and nitrogen management in different soils and production regions. Agric. Water Manag. 2016, 171, 120–130. [Google Scholar] [CrossRef]
- Liu, K.; Du, J.; Zhong, Y.; Shen, Z.; Yu, X. The response of potato tuber yield, nitrogen uptake, soil nitrate nitrogen to different nitrogen rates in red soil. Sci. Rep. 2021, 11, 22506. [Google Scholar] [CrossRef] [PubMed]
- Zhang, H.; Liu, X.; Nie, B.; Song, B.; Du, P.; Liu, S.; Li, L.; Zhao, Z. Nitrogen management can inhibit or induce the sprouting of potato tubers: Consequences of regulation tuberization. Postharvest Biol. Technol. 2022, 183, 111722. [Google Scholar] [CrossRef]
- Zhang, H.; Liu, X.; Song, B.; Nie, B.; Zhang, W.; Zhao, Z. Effect of excessive nitrogen on levels of amino acids and sugars, and differential response to post-harvest cold storage in potato (Solanum tuberosum L.) tubers. Plant Physiol. Biochem. 2020, 157, 38–46. [Google Scholar] [CrossRef] [PubMed]
- Aly, R.A.M.; Abdel-Halim, K.Y. Effect of Bio-Fertilizer and Foliar Spray of Selenium of Growth, Yield and Quality of Potato Plants. Acad. J. Life Sci. 2020, 6, 1–7. [Google Scholar] [CrossRef]
- Ros, G.H.; van Rotterdam, A.M.D.; Bussink, D.W.; Bindraban, P.S. Selenium fertilization strategies for bio-fortification of food: An agro-ecosystem approach. Plant Soil 2016, 404, 99–112. [Google Scholar] [CrossRef]
- Grujcic, D.; Yazici, A.; Tutus, Y.; Cakmak, I.; Singh, B. Biofortification of Silage Maize with Zinc, Iron and Selenium as Affected by Nitrogen Fertilization. Plants 2021, 10, 391. [Google Scholar] [CrossRef] [PubMed]
- Li, R.; Liu, P.; Dong, S.; Zhang, J.; Zhao, B. Increased Maize Plant Population Induced Leaf Senescence, Suppressed Root Growth, Nitrogen Uptake, and Grain Yield. Agron. J. 2019, 111, 1581–1591. [Google Scholar] [CrossRef]
- Zhou, X.; Yang, J.; Kronzucker, H.J.; Shi, W. Selenium Biofortification and Interaction With Other Elements in Plants: A Review. Front. Plant Sci. 2020, 11, 586421. [Google Scholar] [CrossRef]
- Schiavon, M.; Pilon Smits, E.A. The fascinating facets of plant selenium accumulation–biochemistry, physiology, evolution and ecology. New Phytol. 2017, 213, 1582–1596. [Google Scholar] [CrossRef] [PubMed]
- Saha, U.; Fayiga, A.; Sonon, L. Selenium in the soil-plant environment: A review. Int. J. Appl. Agric. Sci. 2017, 3, 1–18. [Google Scholar] [CrossRef]
- Reis, H.P.G.; Barcelos, J.P.D.Q.; Furlani, E., Jr.; Santos, E.F.; Silva, V.M.; Moraes, M.F.; Putti, F.F.; Reis, A.R. Agronomic biofortification of upland rice with selenium and nitrogen and its relation to grain quality. J. Cereal Sci. 2018, 79, 508–515. [Google Scholar] [CrossRef]
Disclaimer/Publisher’s Note: The statements, opinions and data contained in all publications are solely those of the individual author(s) and contributor(s) and not of MDPI and/or the editor(s). MDPI and/or the editor(s) disclaim responsibility for any injury to people or property resulting from any ideas, methods, instructions or products referred to in the content. |
© 2023 by the authors. Licensee MDPI, Basel, Switzerland. This article is an open access article distributed under the terms and conditions of the Creative Commons Attribution (CC BY) license (https://creativecommons.org/licenses/by/4.0/).