Article

Challenge of Supplying Power with Renewable Energy Due to the Impact of COVID-19 on Power Demands in the Lao PDR: Analysis Using Metaheuristic Optimization

by
Thongsavanh Keokhoungning
1,
Wullapa Wongsinlatam
1,
Tawun Remsungnen
1,
Ariya Namvong
1,
Sirote Khunkitti
2,
Bounmy Inthakesone
3,
Apirat Siritaratiwat
4,
Suttichai Premrudeepreechacharn
2,* and
Chayada Surawanitkun
1,*
1
Center of Multidisciplinary Innovation Network Talent (MINT Center), Faculty of Interdisciplinary Studies, Khon Kaen University, Nong Khai Campus, Nong Khai 43000, Thailand
2
Department of Electrical Engineering, Faculty of Engineering, Chiang Mai University, Chiang Mai 50200, Thailand
3
Head of Research Division, Faculty of Economics and Business Management, National University of Laos, Dongdok Campus, Vientiane 7332, Laos
4
Department of Electrical Engineering, Faculty of Engineering, Khon Kaen University, Khon Kaen 40002, Thailand
*
Authors to whom correspondence should be addressed.
Sustainability 2023, 15(8), 6814; https://doi.org/10.3390/su15086814
Submission received: 8 March 2023 / Revised: 7 April 2023 / Accepted: 10 April 2023 / Published: 18 April 2023

Abstract

:
Human activities have been limited by coronavirus disease 2019 (COVID-19), and the normal conditions of our lifestyles have changed, particularly in terms of electricity usage. The aim of this study was to investigate the impact of COVID-19 on the power sector in the Lao PDR in 2020, as well as the challenge of using solar energy to supply power to the network using an optimal approach. The returns on investment of network extension and the purchase of solar energy were also evaluated. Furthermore, load conditions caused by the country’s lockdown policy were analyzed. We analyzed the optimal sizing and location of solar energy using a particle swarm optimization method based on the main objective functions, with the system’s power loss decreasing and its reliability improved. The results demonstrated that the suddenly reduced load from industry and commercial business did not have a large impact on its operations; however, revenue was reduced. The optimal method for connecting solar energy to a network can reduce power loss and improve system reliability. In addition, we discovered that the location and capacity of solar generation can reduce the investment costs of extensions for new lines, with the surplus power being exported.

Graphical Abstract

1. Introduction

Coronavirus disease 2019 (COVID-19) widely impacted many sectors around the world [1]. Limitations on human activities were employed worldwide, also known as lockdowns [2]. The power sector had to endure new environmental conditions in terms of operations and planning [3]. Demand progressively decreased because the main loads were suddenly stopped as people were prohibited from leaving their houses [4], with schools and universities operating online [5]. The COVID-19 pandemic slowed the global economic system because the main consumer industries, such as commerce and tourism, were not allowed to operate, with the overall demand for electricity also decreasing [6].
For the power sector in the Lao PDR, power demand and generation were impacted by COVID-19 from early 2020 to 2021 because of the country’s lockdown policies. The main activities of people were limited, and industry and commerce grinded to a halt [5,6]. The remaining electricity demand comprised households, which had a small capacity [7]. In this situation, the government requested the power sector to change its power generation schedules because demand had changed and was suddenly reduced [8]. However, when the border reopened, and a high-speed train project was completed and became operational at the end of 2021, power demands rapidly increased by up to 9% within 6 months [9], with commerce and industry having more power. Moreover, the government approved new digital mining businesses which required a lot of power [9]. Therefore, the power sector needed to prepare new energy generation methods to meet increasing demand. In this situation, as the sudden downturn after the COVID-19 pandemic ended, demand rapidly increased [5,6,7,8,9]. Therefore, policy makers are carrying out negotiations with the power sector to set up a new schedule to meet the increased demand on the power supply [10]. This is a new challenge for system operators [11]. To meet the rapid demand increase, new resources are needed that enable the fastest implementation and have reasonable prices [12]. Due to the location of the Lao PDR, it has no borders close to the sea, sources of wind are limited, and few locations can develop wind farms. Therefore, power system planning and implementing the addition of solar energy are prioritized because the quality of sunlight and the price of this energy are going down, and solar energy is able to respond to the demand. Solar energy is the first choice for implementation because this energy type can fit into any size or location [13]. The construction of a solar farm is extremely fast, and the price has decreased slightly [14]. Additionally, the Lao PDR has the potential to facilitate solar energy in terms of the quality of its sunlight [15]. However, the existing power generators are mainly hydropower ones. Approximately 85% can be hybridized, and the power supply is controllable [7,16].
There are previous related studies in the field regarding the COVID-19 pandemic’s impact on the power sector. The COVID-19 pandemic affected the power system and the power network, and this highlights the main challenge of this situation which introduced a new pattern of power supply and demand [17]. A consequence of human activity restrictions during the COVID-19 pandemic was the impact on residential electricity users. During the COVID-19 pandemic, the electricity usage of apartment residents was studied based on their day-long experiences. However, power consumption increased a clear period of peak demand at that time [18]. To encourage renewable energy in the future, the impact of the COVID-19 pandemic on the global energy system was examined for potential problems and policy implications [19]. This was the impetus of this research and is related to recommendations about the power sector in the Lao PCR due to the COVID-19 pandemic. An international power system, in terms of the socioeconomic development of state owners and global power companies, was investigated. In the case of that study, the power utilities of India were selected to study power demands and the smooth operation of the power network [20].
Therefore, (i) we determined that COVID-19 impacted power supply, challenged renewable generation, and altered load conditions; (ii) we evaluated its economic impacts based on power demand conditions; and (iii) we verified the reliability of the power supply and demand in a pandemic context. This research focused on Lao PDR’s network.
Section 2 describes the impact of the COVID-19 pandemic on the Lao PDR’s electricity supply. Section 3 describes the power supply demands post COVID-19 as well as the renewable energy challenges using the optimal Lao PDR network approach. Section 4 offers our results and a discussion of COVID-19’s influence on the Lao PDR’s power supply after economic recovery. Finally, Section 5 concludes with our recommendations.

2. Effect of COVID-19 Pandemic on Power Supply System

Due to the COVID-19 pandemic, the government announced limitations of activities, and commerce and industries locked down in early 2020 [5,21]. The utility supplying power to the whole county modified its consumer supply plans because of the changed level of demand [6,22]. Most consumers were households, which accounted for about 25% of the total demand [23]. The Lao PDR was impacted in terms of power purchases for domestic supply and for export to neighboring countries. The need for power generation continued; however, these needs were not met by utility companies. This was because demand suddenly decreased [5,6,24]. At the time of the COVID-19 pandemic, people spent most of their time in their homes, with many returning to remote areas of the country as work in the cities was impacted. The government announced a policy of social distancing, which considerably decreased the power loads of big cities. In this situation, some of the traditional load was redirected commerce, industries, and others to residential use. According to the Lao PDR’s load data from 2015 to 2019, demand increased by approximately 8.5%; however, the demand due to the COVID-19 effect in 2020 was similar to the demand in 2019 [5,6]. After the economic recovery from COVID-19, the demand increased by up to 10% in 2021 when compared with 2020 [7]. The demand of the Lao PDR from 2015 to 2021 is given in Figure 1.

3. Power Supply System Planning after COVID-19 Recovery

Currently, the Lao PDR allows its residents to conduct activities with people who are able to visit each other. In early 2020, commerce, industry, and internal tourism resumed. In addition, the power sectors applied and requested forecasts from the main industries, which are major energy consumers in the country [7,8].

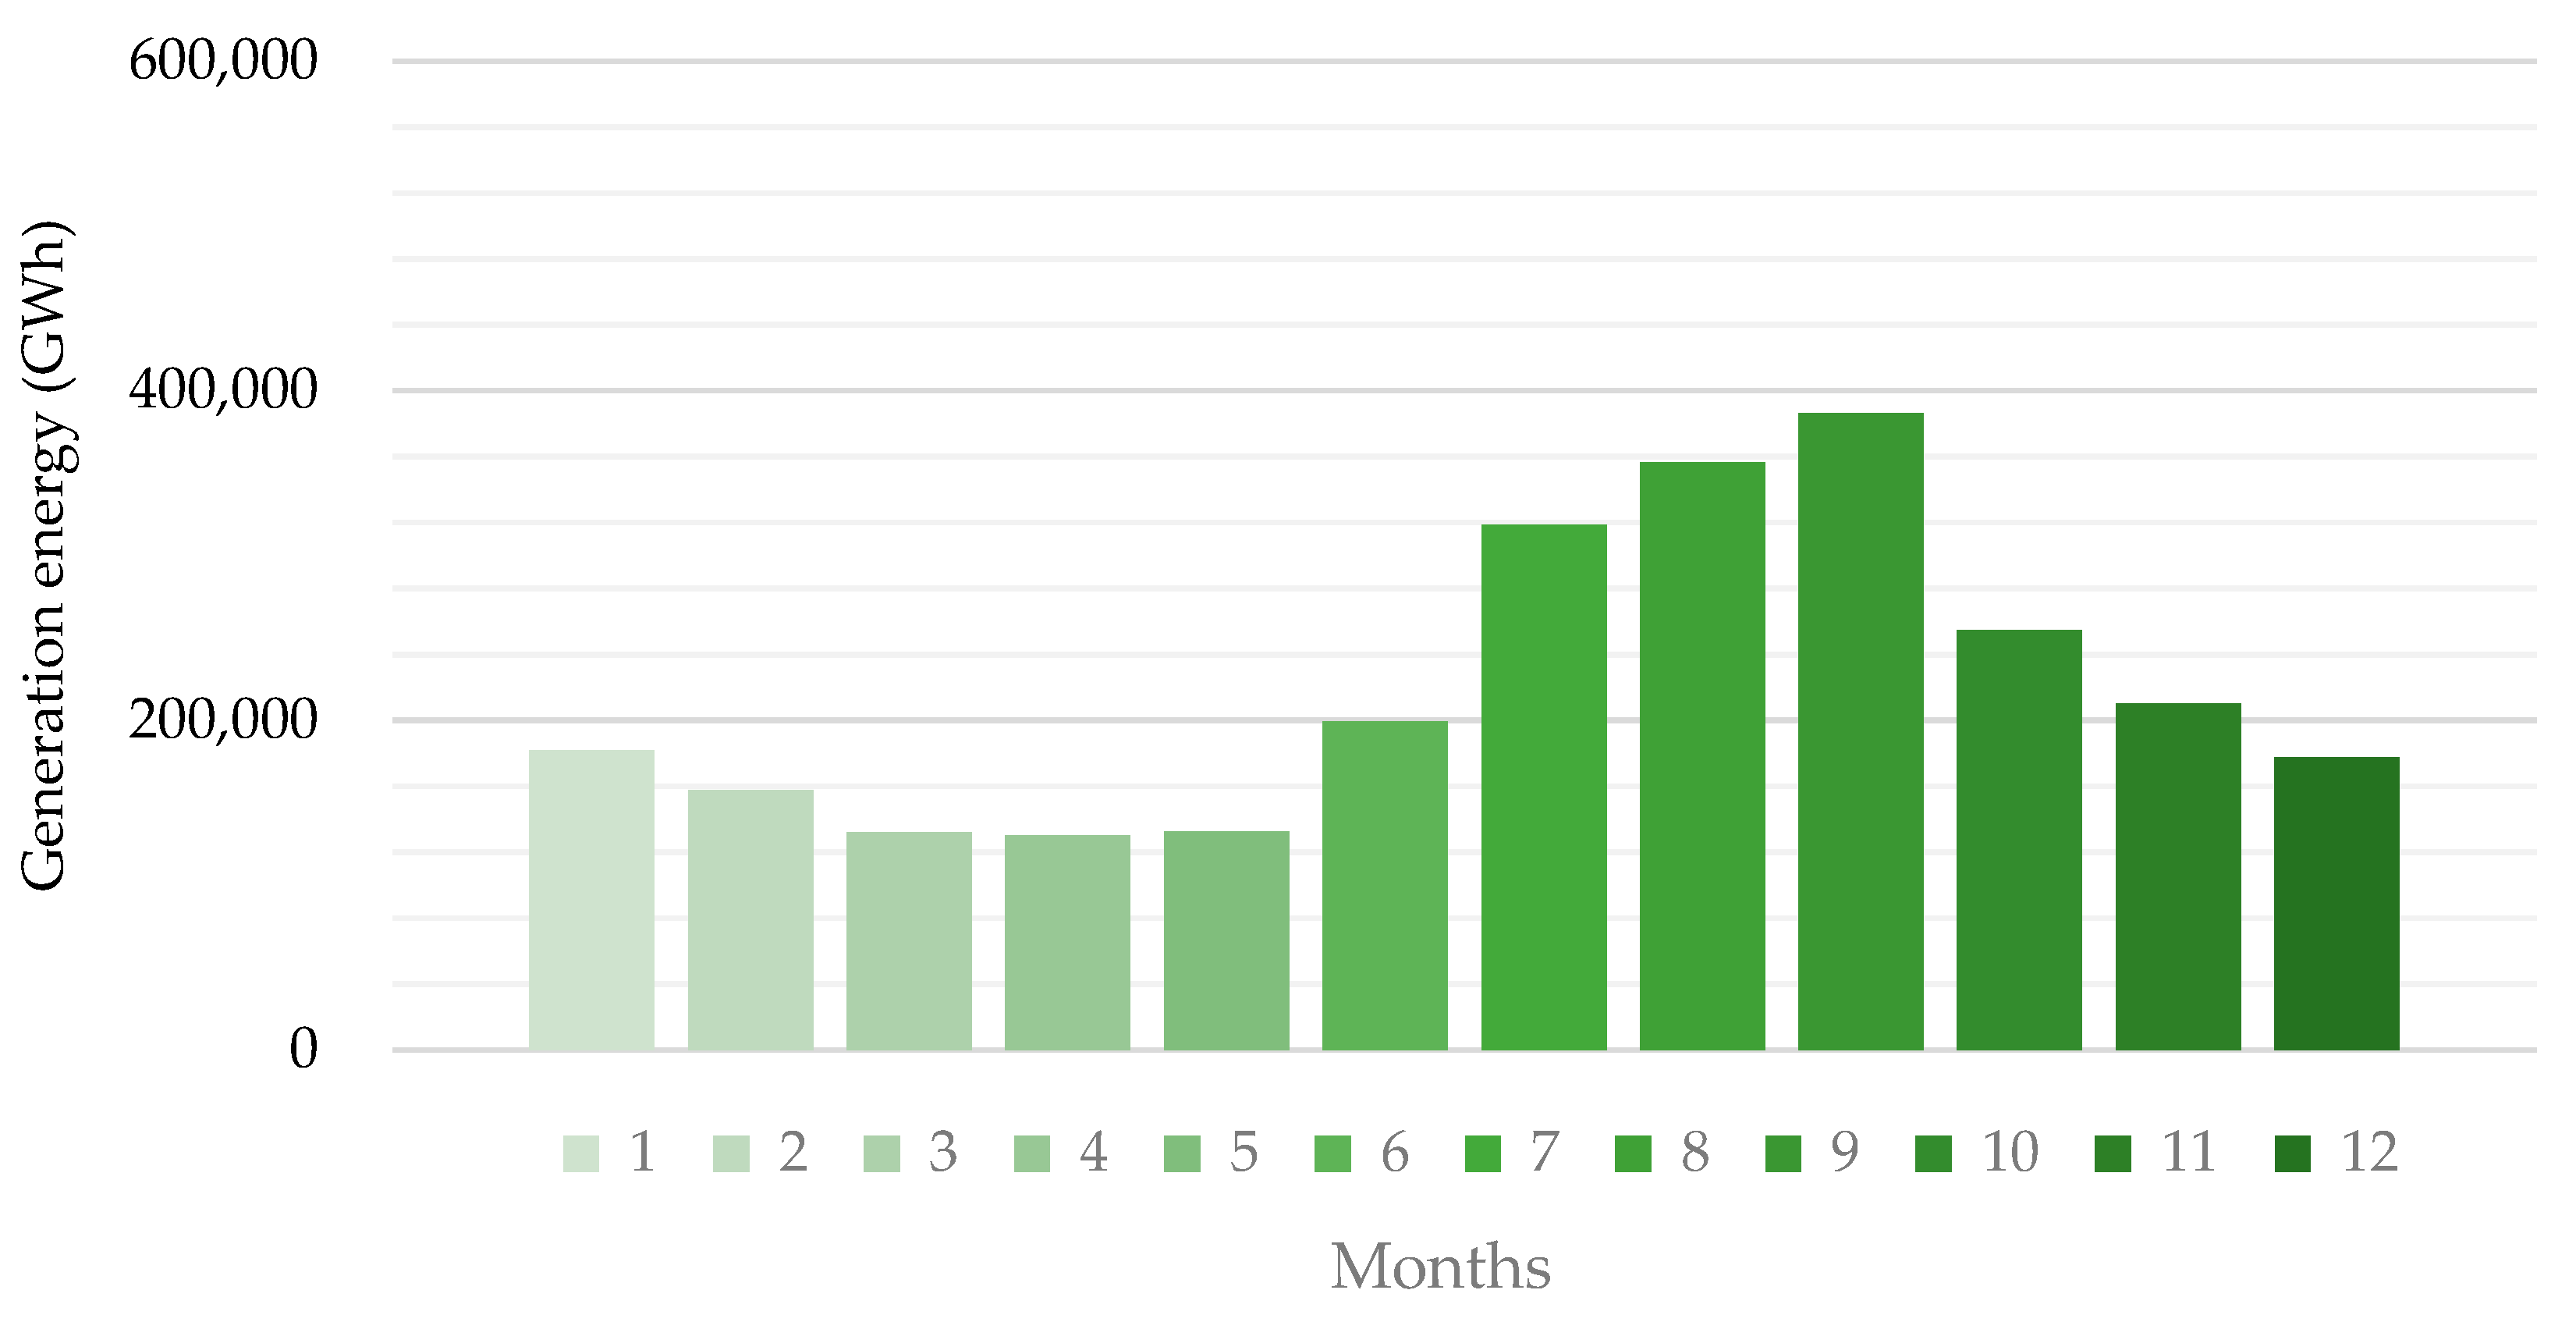
3.1. Power Generation

The generation resources of the Lao PDR are mainly hydropower in the northern and southern parts. However, the center part contains the industrial and commercial zones and also has a few power sources. The power supply transmits power from the northern and southern parts to supply the central part. There are two types of hydropower. One is run-of-river hydropower, which can only generate power during the rainy season, and the second is the reservoir, which is the type of hydropower that is able to control and generate power. In addition, renewable energy resources provide a small percentage of the power supply in the country. On the other hand, the prices of these power sources are rapidly decreasing because they are promoted by the government. This is because it is faster to implement and the location of the renewable energy can be set near the central load [7,8]. Moreover, due to its landlocked location, the Lao PDR has no coastal borders and limited access to wind sources, which restricts the number of potential wind farm locations. Therefore, prioritizing incorporating solar energy into the power system planning is necessary as the quality of the sunlight and the price of this energy are going down and can respond to the demand. Thus, solar energy is an attractive option to meet the growing demand.
A model applies the power generation and uncertain power sources based on the hydropower plant designs and the geographic locations. In this study, multiple types of generation sources are modeled. The first is hydroelectric facilities with reservoirs that can be dispatched, and the second is run-of-river hydropower plants that cannot. Therefore, electricity can only be generated during the rainy season. Both hydropower plants are situated in remote places. Therefore, the transmission lines used to transfer energy from these power sources must be both dependable and cost-effective. The uncertainty model incorporates generation planning according to the National Power Development Plans (NPDPs). The generated energy is based on traditional hydroelectric facilities, and seasonal planning is addressed. Figure 2 illustrates the Electricite Du Laos (EDL) generation profile [7,8,9].

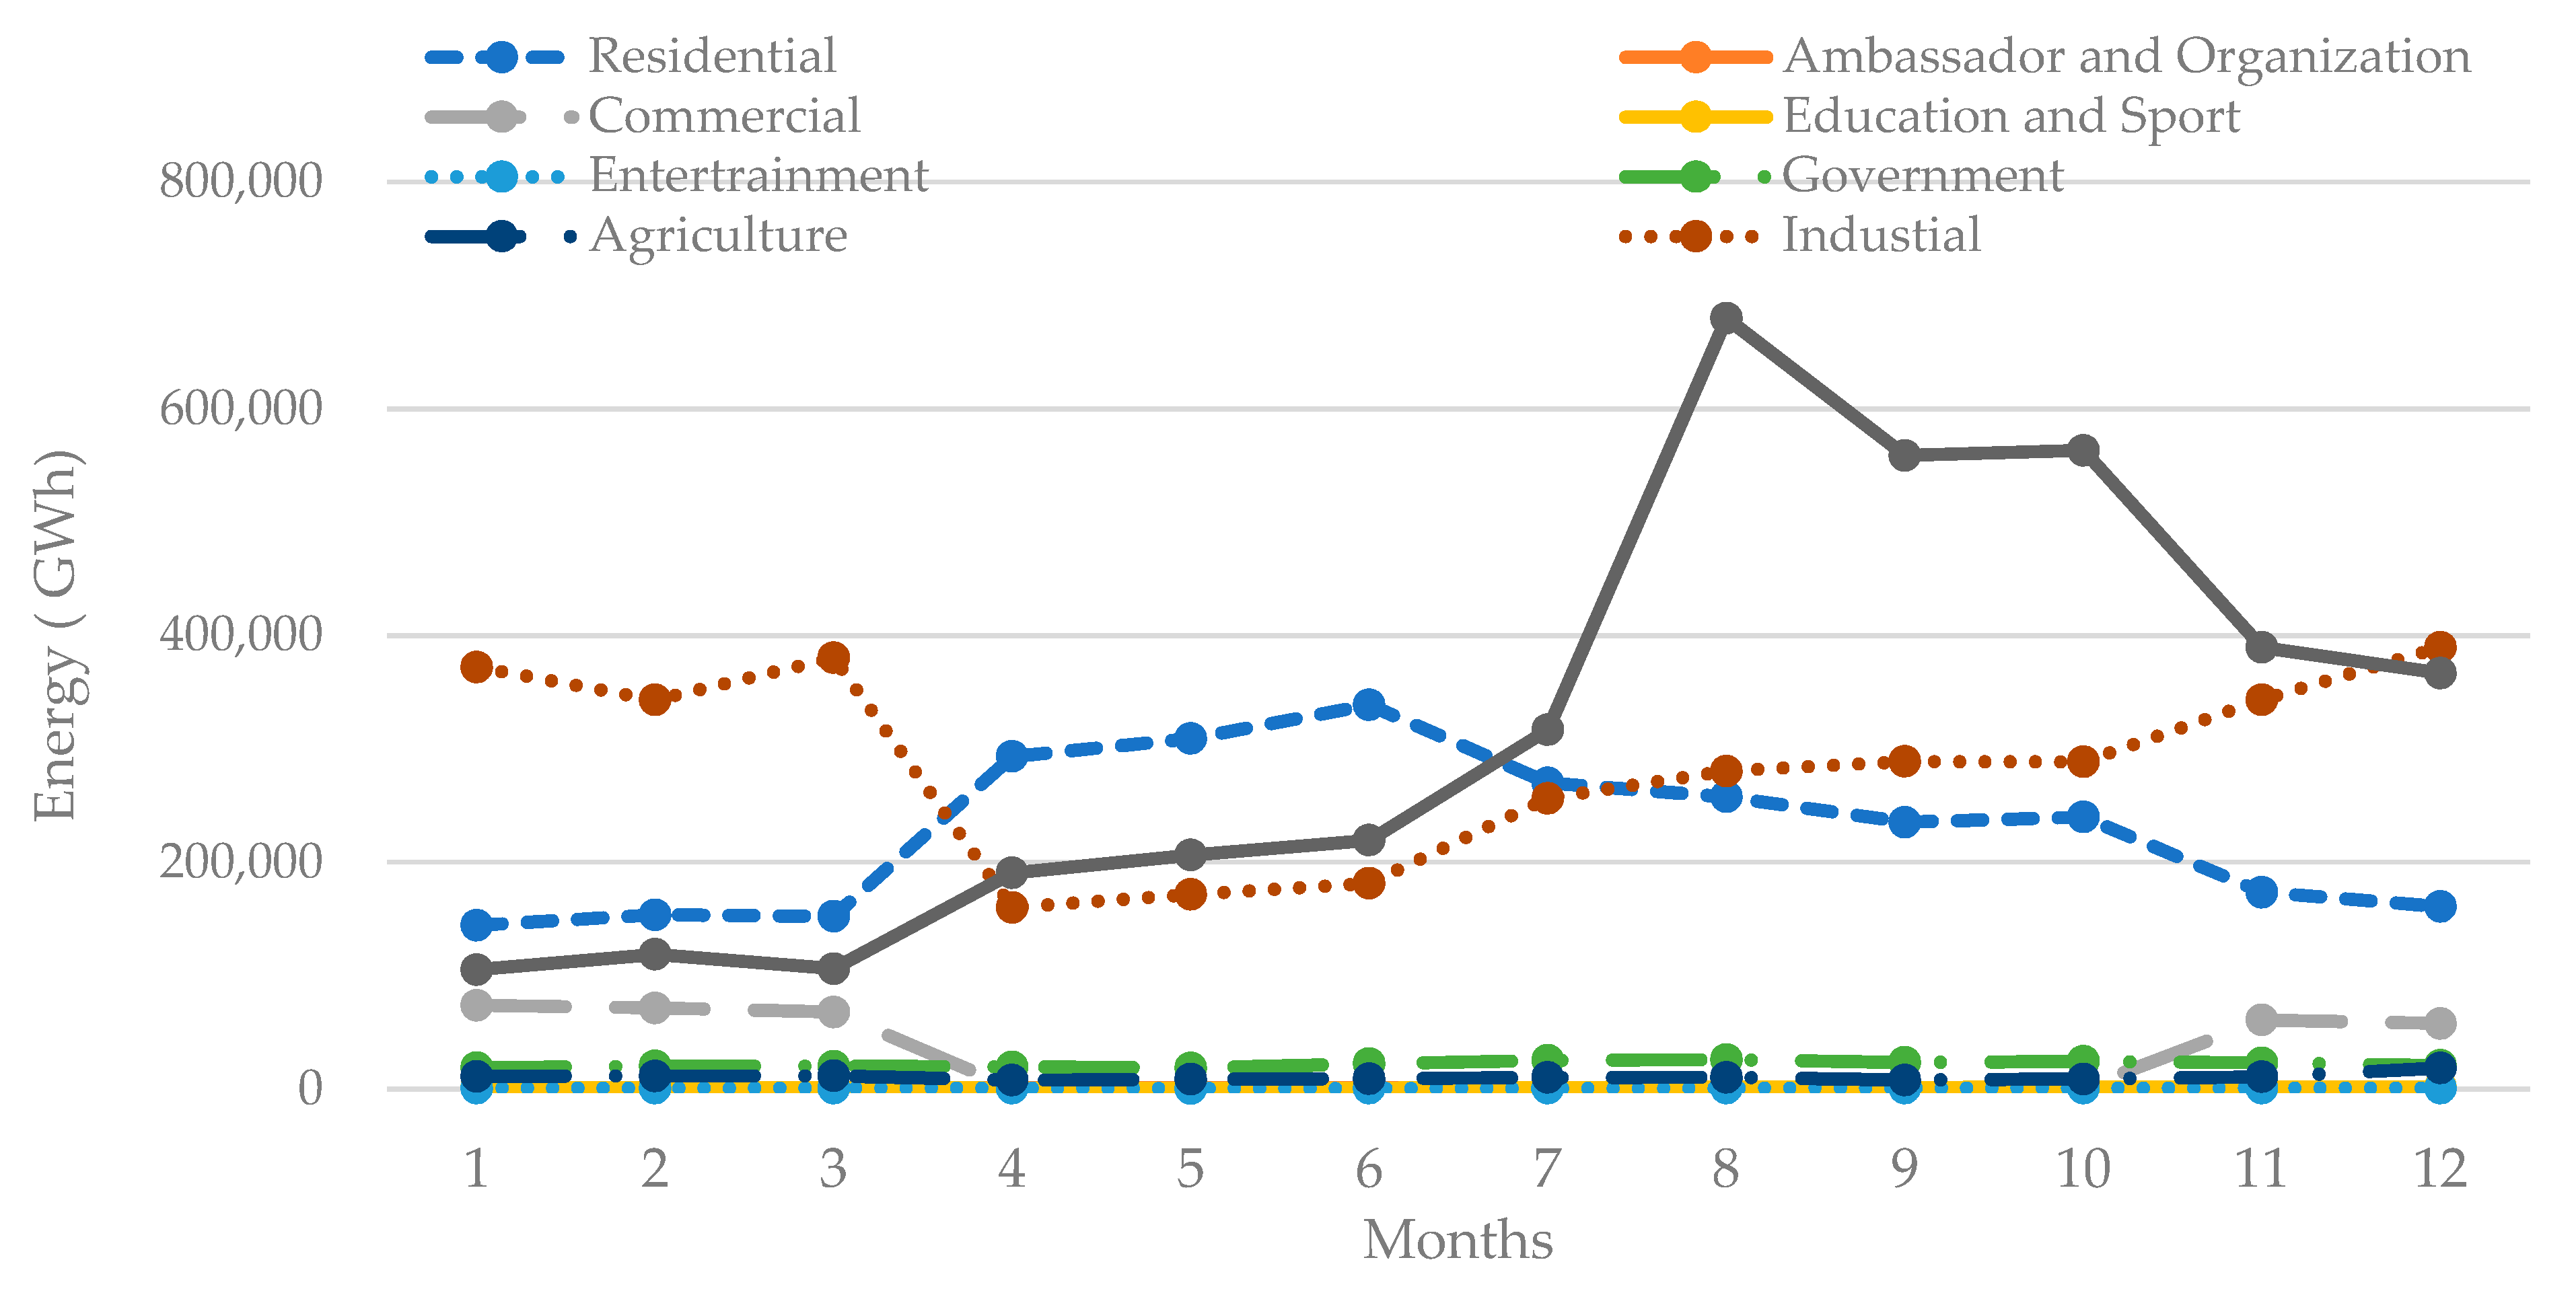
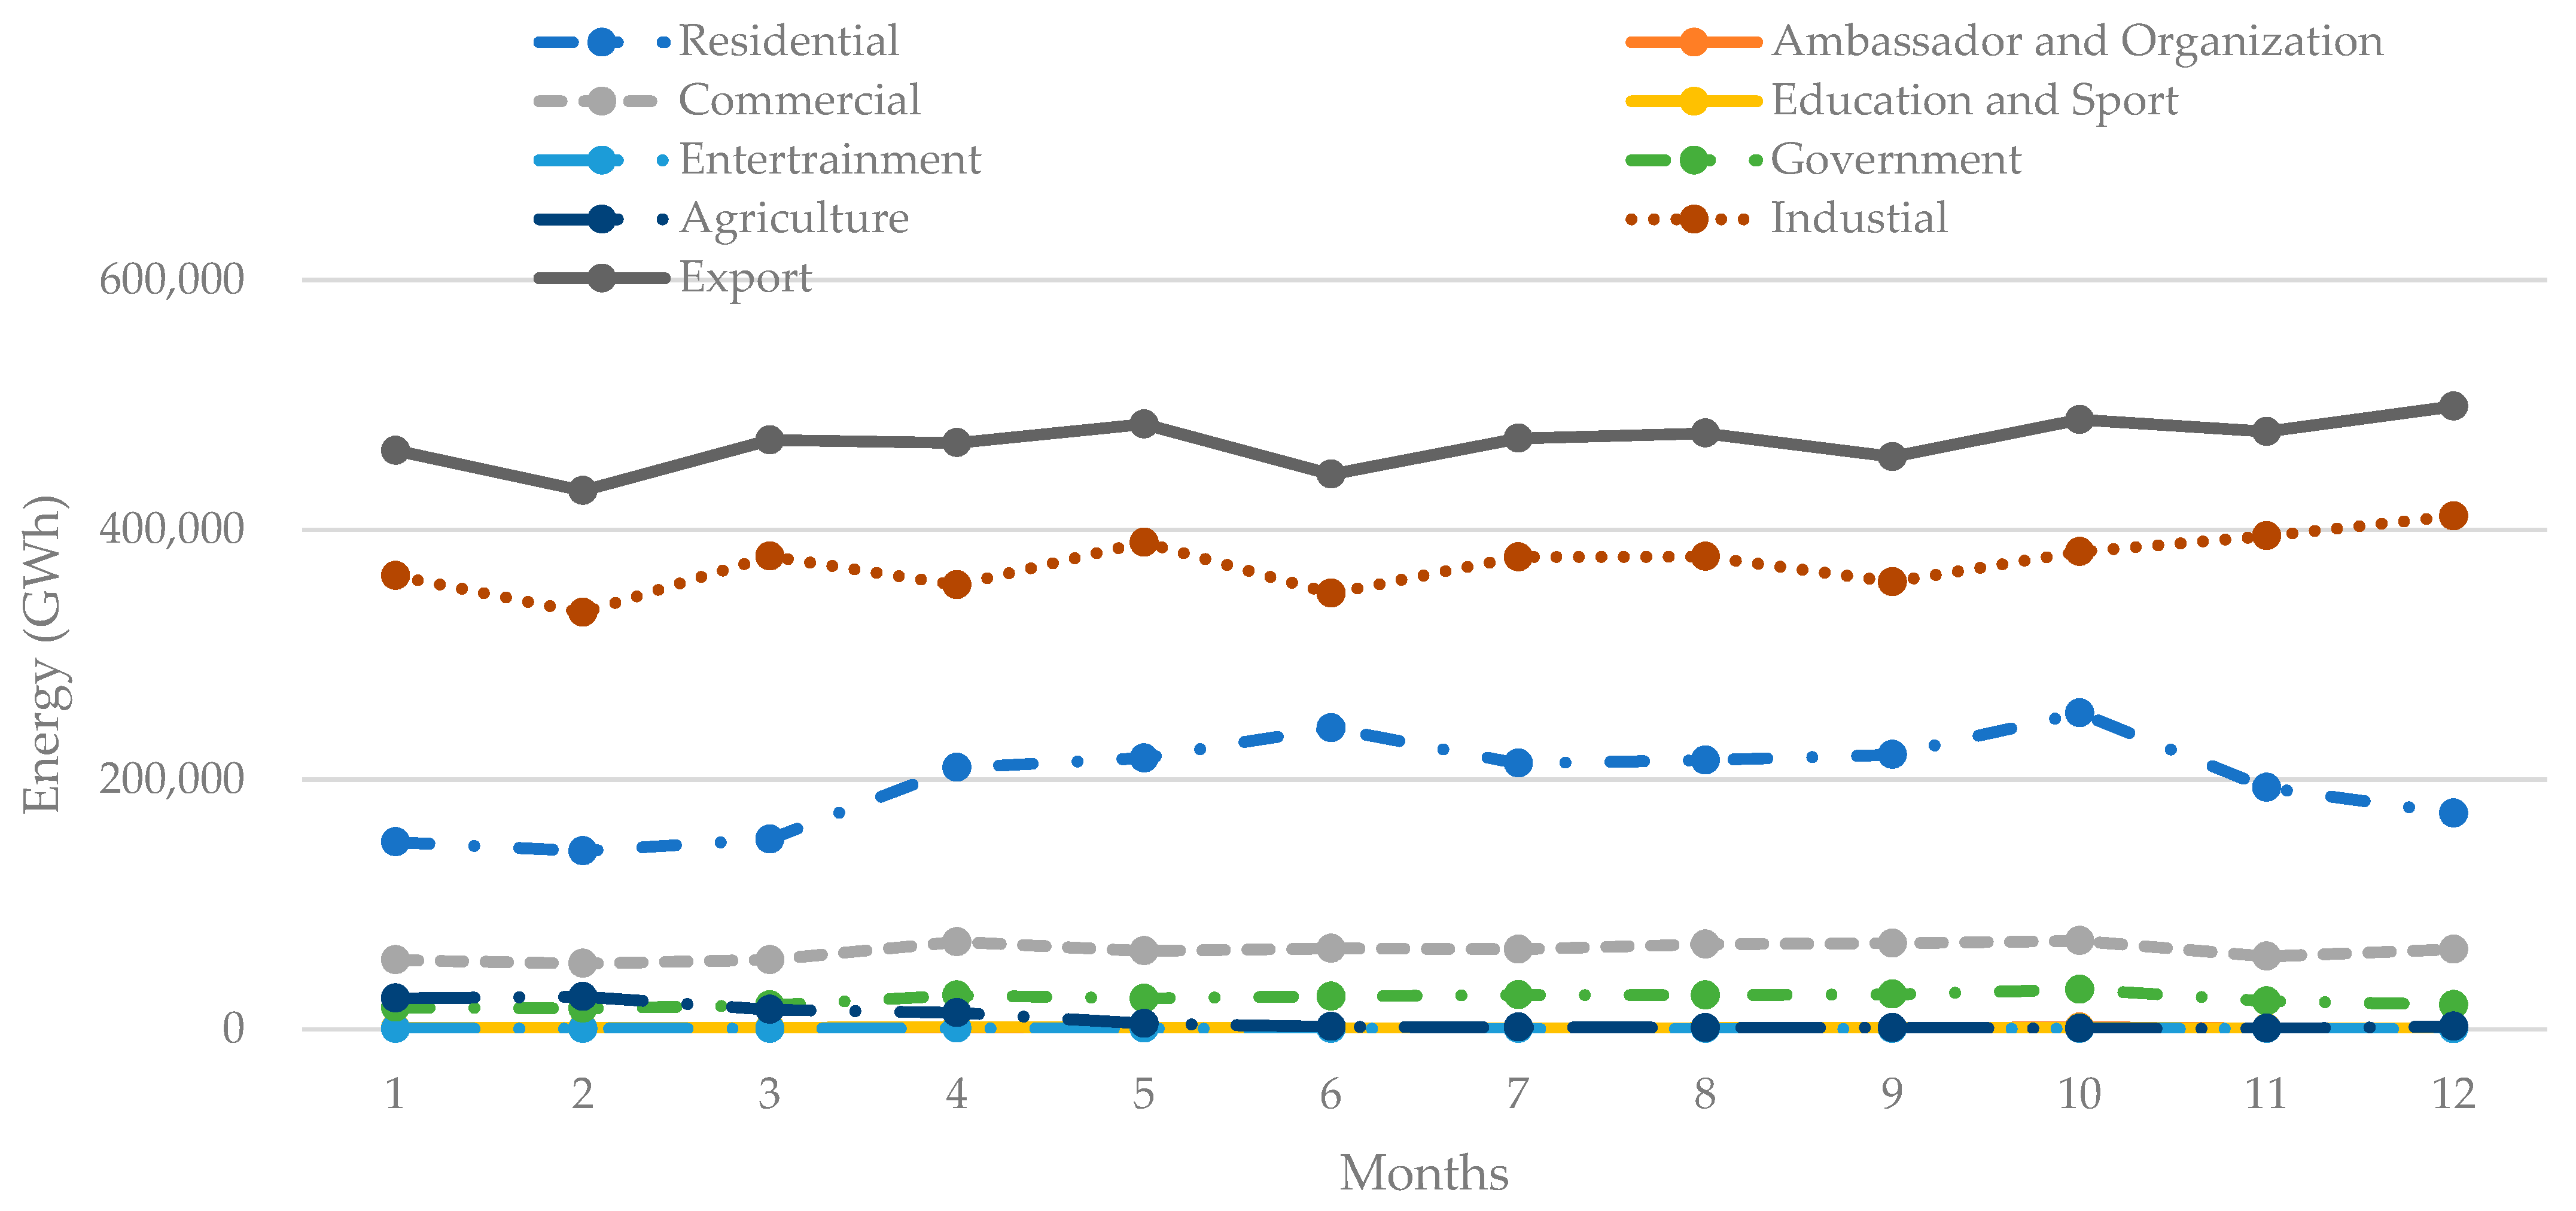
3.2. Modeling of Load and Demand

The power demand depends on the nation’s economic growth rate, which is the main criterion for power system planning. Thus, the load model was applied according to the conditions of demand due to the COVID-19 outbreak and the condition of COVID-19 recovery. The presented modeling is based on the load conditions that were impacted by COVID-19 and the recovery after the country was reopened [7]. The country’s first lockdown was on 2 April 2020; people were not allowed to cross the borders of each province. However, this lockdown only affected the capital of Vientiane, which fully limited people’s activities, and schools and universities had to facilitate studying at home. While industries were still operating at half-capacity, commerce totally stopped [8,9]. This led to demand decreasing by approximately 10% of the total demand. Figure 3 presents the load profiles in the years from 2019 to 2022. The red line presents the load that was impacted by COVID-19. The lockdown started in early April 2020; however, the green dot line is the demand after economic recovery in 2022. The blue line dot is normal demand in 2019.

4. Power System Supply and Renewable Energy Challenge after COVID-19 Recovery

The suggested technique examines the objective function (OF) to minimize the entire system’s overall investment cost. An extension necessitates the transfer of power from generation sources to consumers via a transmission network carrying more than 80% of the line capacity. As a result, line investment costs are rising. The objective of the proposed technique is to find the appropriate size and capacity for the new PV generation. This can lower the line extension and power loss in the whole system and increase the system’s dependability. The generated PV is chosen to connect to the network based on the system’s most important criteria, reducing system losses and enhancing network dependability. There are two primary purposes of the objectives. One objective is to reduce the new lines’ investment costs. The second criterion is that a PV linked to the network should optimize the energy supply to users. This is standard for power loss and system dependability. Equation (1) is the fundamental goal function of our study [25].
Objective function = Max VPVtot + Min Cinvt
where
Max VPVtot is the maximum amount of PV connected to the network (USD);
Min Cinvt is the minimum investment cost of new lines (USD).

4.1. The Value of PV Connection

The value of the total generated PV criterion in the objective function is analyzed in the model. The key function of the total value of PV connected to the network is divided into three parts. The total value of the power loss in the system is calculated before and after the PV is connected to the network. The energy of the generated PV is the surplus in the system, including exportation to neighboring countries. Moreover, the reliability is improved before and after the PV is connected to the network [25]. This is presented in Equation (2):
VPVtot = VΔPloss + VP.sale + VP.Rel
where
VPVtot is the total value of PV connected to the network (USD);
VΔPloss is the value in terms of power loss before and after the PV connected (USD);
VP.sale is the value in relation to selling power produced from the PV connection (USD);
VP.Rel is the value obtained from the system reliability improvement due to the PV connection (USD).

4.2. Power Loss in System

To evaluate the PV power sources connected to the network, the system computes the power loss before and after the connection. The total value of the power loss in the power system is calculated without the connected PV. It can be shown that there is a difference in power loss in the system using Equation (3) [25].
PΔPloss = Ploss_oldPloss_new
where
PΔPloss is the power loss difference in the system before and after PV generators are connected (MW);
Ploss_old is the power loss before the PV generators are connected (MW);
Ploss_new is the power loss after the PV generators are connected (MW).

4.3. Value of Power Surplus with PV Connection

The power flow in the system is analyzed with a power surplus when the PV generation is connected. The total value of the selling power increase can be calculated using the capacity of the PV generators multiplied by the hours in a year for PV generation. The total value of the power surplus with PV generation connected is given in Equation (4).
V P . s a l e = p = 1 n p P V p N ( 365 )   ( PF ) + V Δ P l o s s ( 365 )   ( PF )
where
VP.sale is the power surplus with the PV connection;
PVp is the PV that is generated (USD);
N is the number of PV generators;
PF is a power factor (4.2 h per day).
The power from PV generators that is allowed to flow through the network and export to neighboring countries is not over 70 MW. When the injected power is over 70 MW, there is a penalty function. This is given in Equation (5) [25].
Ppen = PexNetPexNetold
Ppen  70 MW
where
Ppen indicates that the amount of power injected into the network by PV generators for exportation to neighboring counties cannot exceed 70 MW;
PexNet is the power exported after the PV is connected to the network (MW);
PexNetold is the power exported before the PV is connected to the network (MW).

4.4. The Reliability Value

The proposed model analyzes and compares the reliability values in 2020 and 2021. The reliability values are calculated as the overall network reliability before PV generators are connected to the system in order to compare it to the total network reliability after PV generators are connected. The formula for calculating the reliability value is Equation (6) [25].
VRel = Vrel.oldVrel.new
where
VRel is the reliability value (USD);
Vrel.old is the total reliability value before PV generators are connected (USD);
Vrel.new is the total reliability value after PV generators are connected (USD).

5. The Line Investment Cost (Cinvt)

New investment in lines and equipment increases the power flow in the lines by over 80% of the line’s capacity. The proposed method is based on the power in the lines being over capacity. If the power in a line is over, it is automatically selected to be extended. However, the investment cost of new lines can be minimized by the optimal size and location of the PV generation connected to the bus. The investment cost of a new line can be calculated using Equation (7) [25].
Min C i n v t = e q = 1 n e q p = 1 n p n p C e p . p
where
Cinvt is the investment cost of new lines (USD);
np is the number of lines to be extended;
Cep.p is the cost of new lines and equipment to be extended (USD).

Power Supply after COVID-19 Recovery

A flowchart of the approach for solving the power supply after the COVID-19 recovery is shown in Figure 4. The proposed method minimizes the total investment cost of lines and equipment. The PV connected to the system is based on the optimal sizing and capacity obtained by the particle swarm optimization algorithm. The size and capacity of the PV are selected by the main criteria, which are verified. The whole system is improved and the power loss is reduced [25].
The methodology begins with a load flow analysis in which the power sources and load conditions are appropriately accounted for. For the lines that transport more than 80% of the total power capacity, each is chosen to determine the investment cost of the entire system. The optimal technique begins with the specification of an objective function, the specification of the connected PV, and the specification of the number of buses to connect to the PV generator [26,27]. A bus index is created, and an input system constraint is added. The account settings include the system setup data, the PV size, the location, the number of buses, and the velocity of particles. The PV is connected to the bus and the first particle is determined [28,29,30]. The load flow and system dependability are evaluated. In addition, the costs of investment and unreliability, which include the cost of power imported to the system, are determined in this work. The algorithm determines whether the maximum number of particles has been detected before proceeding. Nevertheless, if the particle count is less than the maximum, the program returns to the PV connection [31]. The fitness computation and the recorded personal best for each particle are validated, after which the personal best values are compared. As the worldwide best, the optimal cost and dependability are recorded. The algorithm concludes after the maximum number of runs is identified, and the results are displayed (Gbest) [32]. This confirms the usefulness of the optimization technique for transmission network expansion planning (TNEP). If the maximum distance is not discovered, the algorithm updates the weight and velocity vector for each particle and identifies a new first particle [33].

6. Engineering Economy

The requirement for engineering economy is basically inspired by the tasks that engineers perform when analyzing, synthesizing, and coming to an assumption as they work on projects at all sites. In particular, engineering economy is at the heart of making recommendations.
Generally, engineering economy assumes formulating, estimating, and evaluating economic conclusions when the choices to achieve a determined purpose are obtainable. Another approach to engineering economy uses a group of mathematical techniques that create manageable economic balancing [34]. The reason for transmission network expansion planning is the minimization of investment costs, such as for equipment, transportation, construction, operation, and maintenance [34]. The new lines that are selected are considered the capital costs that maximize the return on investment. The economic evaluation is shown below.

6.1. Investment Cost

The investment cost is the capital cost for the new lines of transmission network expansion that will be added to the system [35,36]. The investment cost is given in Equation (8).
Investment   cos t = i j C i j N i j
where
Cij is the cost for the new transmission line per kilometer;
Nij is the number of new lines that will be constructed.

6.2. Present Worth Calculations with Inflation

When USD amounts in different time periods are indicated with constant USD values, the equivalent present and future amounts are defined using real interest (i). An alternative and less complicated method of accounting for inflation in a present analysis adjusts the interest formulas themselves to account for inflation. To consider the P/F formula, i is the real interest rate. The present worth calculation with inflation is given in Equation (9) [34].
P = F 1 1 + n
where
P is the present value;
F is the future value;
i is the real interest;
n is the number of years.

6.3. Net Present Value

Capital budgeting uses techniques such as net present values to assess the costs and benefits of possible investments in fixed assets for a business. Purchases of massive manufacturing line sets or the construction of a new building are examples of capital investment projects in this category. As it considers both risk and temporal flexibility, the net present value is the most accurate capital budgeting technique because it uses discounted cash flows in the evaluation.
A net present value study involves many variables and assumptions. It examines the cash flows anticipated to be transferred by a project by returning them to the present using information such as the project’s duration (t) and the firm’s weighted average capital cost. If the outcome is favorable, the company should invest in the project. The company should only invest in the project if the outcome is favorable. Equations (10) and (11) are applied to calculate the net present value [34].
NPV ( P ) = CP ( 0 ) + C P ( 1 ) ( 1 + i ) 1 + C P ( 2 ) ( 1 + i ) 2 + + C P ( n ) ( 1 + i ) n = t = 0 n C P ( n ) ( 1 + i )
NPV ( P ) = t = 0 n C P ( n ) ( 1 + i )
where
NPV(P) is the net present value;
CP(0) is the capital cost of the first year;
CP(n) is the capital cost of year n;
i is the interest.

7. National Network Data

EDL’s network, the national system network of the Lao PDR, is divided into three main parts: northern, central, and southern. The generation sources are mainly in the northern and southern parts, which are mostly mountainous areas; however, the central part is a flat area comprising industries and commercial areas. The transmission network connects power sources to consumers in the northern, central, and southern parts with high-voltage transmission lines (115 kV and 230 kV). In addition, for interconnection with neighboring countries, the 230 kV transmission line is connected with the Cambodian network in the southern part. There are six interconnections with the Thai network via the 115 kV transmission line, and the northern parts are connected to Myanmar and China by the 115 kV transmission lines. Moreover, the distribution network will be connected to Vietnam and will be upgraded to a high-voltage transmission line in the future. The national network will be implemented with extra-high-voltage transmission, which will connect to all generation sources nationwide. It will connect to neighboring networks to facilitate power trading with the Indochina network and increase electric power exports. Table 1 contains network statistics and planning parameters. Figure 5 depicts the Lao PDR’s energy growth strategy and Table 1 provides the network’s existing data [7,25].

8. Results and Discussion

The power supply simulation results for 2020 are given in Figure 6. The power supply was scheduled and declared to supply consumers in the whole country and export to neighboring countries. In early April 2020, the demand suddenly changed because of the COVID-19 pandemic and the country’s lockdown. The total consumption changed from industries and commerce to residential consumers only. The demand decreased by approximately 11% of the total demand; however, industries could still operate during the COVID-19 outbreak, and this consumption decreased by approximately 50%. Commerce and tourism were reduced by up to 60%. Demand from residents increased by approximately 60% to 70% because most demand came from residents from April 2020 to September 2020. In addition, the power exported to neighboring countries individually increased because the internal lockdowns were not simultaneous. Another advantage of prioritizing solar energy in the power system planning of the Lao PDR is the potential to increase the country’s electricity exports to neighboring countries. Due to the variation in the timing of internal lockdowns in different countries, there often needs to be a better match between energy demand and supply. This creates an opportunity for the Lao PDR to export excess electricity during periods of low demand in neighboring countries, as can see by comparing the results in Figure 6 and Figure 7. Thus, hydropower, that is, green and cheap energy, was needed for the system. The types of consumers and the power exported to neighboring countries due to the COVID-19 pandemic are given in Figure 6.
The power supply results after the COVID-19 outbreak in 2021 are given in Figure 7. After the lockdown policy had ended, many activities resumed. The demand increased in the first quarter by approximately 10% of the normal demand; however, in the second quarter of 2021, the demand increased by up to 20% because of business related to the high-speed train. The majority of the demand came from industries, including mining. Moreover, the power that was needed from neighboring countries was the highest. Domestic residential demand was not different from that of 2020. The other consumers were similar to those of 2020.
In summary, by prioritizing solar energy in its power system planning, the Lao PDR can meet its energy demands and increase its electricity exports to neighboring countries. This allows the country to generate additional revenue, promote sustainable development, and strengthen regional cooperation.
For the challenge of renewable energy, solar energy to supply the network was simulated using the optimal method. The capacity and size of the PV connected to the network were evaluated randomly from 5% up to 30% of the total capacity. A capacity of connected PV around 10% to 15% was optimal based on the criteria, and the system loss and reliability were improved. The number of optimal methods was determined with 250 generations and 10 particles. However, the simulation did not require 100 generations and found the best result. The optimal number of PV generators connected to the network was 21 buses, and the total capacity was 175 MW. The results show that two lines were extended, which were lines that were over 80% of their capacity. The total cost for the extension was approximately USD 16.6 million. The value of the PV connected to the network was approximately USD 3.7 million. The optimal power supply results for the Lao PDR network are given in Table 2. The optimal power supply of the Lao PDR network using 10 particles and 250 iterations is given in Figure 8.
For the economic evaluation of 2020, which was impacted by the COVID-19 pandemic, the total energy at the time of the country’s lockdown from April 2020 to September 2020 for the domestic supply was estimated at 10.78% of the total demand. The annual income decreased by approximately 58.7 million. On the other hand, the power exported to neighboring countries was mostly similar amounts.
For the economic analysis of 2021, there was a 115 kV single-circuit Thanaleng-to-Nongkhai transmission line with a length of approximately 11.5 km. The total cost of the line extension and two bay substation extensions was USD 2.17 million. Power flowed through the new extended line. The capacity of the PV generation was 175 MW. The selling power to the consumers using the optimization approach was USD 3.7 million. The total for the line, equipment, operation, and maintenance was USD 6.15 million, and the lifecycle of the project was 20 years. The investment cost for the line was USD 2.1 million. The operation and maintenance were approximately 10% of the line and equipment investment. The average power flow through the line was 36.5 MW, including imports and exports. The discount rate of the project was 10%. The project was feasible, as the internal rate of return (IRR) was 30%. The net present value was USD 9.56 million. The economic evaluation is given in Table 3.

9. Conclusions

COVID-19 strongly impacted many sectors globally, changing human living conditions. It not only impacted the country’s economic downturn but also affected the power sector. The limited activities of humans and the lockdown policy to restrain the virus outbreak were the main reasons that the power demand was reduced. The power supply schedules from generators were revised, and a new plan was created. After the economic recovery, many sectors were operating in the commercial and tourist industries, etc., and power demand quickly increased. When power demand decreased, it was positive for developing renewable energy resources because the implementation is short, and the locations can be near the power demand. This energy is also environmentally friendly and cheaper. As a result of the recovery from the COVID-19 outbreak, the power demand increased again because the government allowed businesses to restart. New loads related to the high-speed train also increased demand by up to 9% in the latter 6 months of 2021. However, the data show that the power demand in 2020 decreased by 10%. Therefore, this study analyzed the optimal location and capacity of solar generation, which can respond quickly to demand. Renewable solar energy was selected to solve the problem. The optimal location and the sui capacity are able to address a sudden increase in demand because the implementation is short, and the location can be close to the load. Solar energy resources can reduce the power loss in the system and improve reliability, especially when the total capacity of solar generation is between 15% and 20% of the total capacity. Furthermore, the investment cost of an extension line can also be reduced or the benefit schedule for the line extension may be postponed. The solar generation selected by the optimal method is feasible in terms of selling the power, which is based on power loss and reliability. However, solar generation is not feasible when the capacity is higher than 40% of the total capacity in terms of operation and power loss due to the uncertainty of solar power. This is because it affects process and reliability, and solar PV can generate power averaging only 4.2 h per day or a plant factor of 18% of capacity. Therefore, although PV installations can reduce power loss and respond to energy demand increment in the system, it is limited to 40% because of uncertainty sources that affect the stability system.

Author Contributions

T.K.: conceptualization, software, methodology, data analysis, data curation, writing—original draft, validation, and writing—review and editing. C.S. and S.P.: conceptualization, visualization, and supervision. S.K., W.W., A.N., T.R., B.I. and A.S.: writing—review and editing. All authors have read and agreed to the published version of the manuscript.

Funding

This research received no external funding.

Institutional Review Board Statement

Not applicable.

Informed Consent Statement

Not applicable.

Data Availability Statement

Data are available on request.

Acknowledgments

The authors wholeheartedly thank the Center of Multidisciplinary Innovation Network Talent (MINT Center), Faculty of Interdisciplinary Studies, Khon Kaen University, Nong Khai Campus, Thailand, for providing equipment, tools, and computer software. We thank the Ministry of Energy and Mines and Electricite Du Loas, who supported us and provided technical data. We acknowledge our advisors and co-advisor, who provided guidance. We also thank our institutions for their support.

Conflicts of Interest

The authors declare no conflict of interest.

References

  1. Ibn-Mohammed, T.; Mustapha, K.B.; Godsell, J.; Adamu, Z.; Babatunde, K.A.; Akintade, D.D.; Acquaye, A.; Fujii, H.; Ndiaye, M.M.; Yamoah, F.A.; et al. A critical analysis of the impacts of COVID-19 on the global economy and ecosystems and opportunities for circular economy strategies. Resour. Conserv. Recycl. 2020, 164, 105169. [Google Scholar] [CrossRef] [PubMed]
  2. Elavarasan, R.M.; Shafiullah, G.M.; Raju, K.; Mudgal, V.; Arif, M.T.; Jamal, T.; Subramanian, S.; Balaguru, V.S.; Reddy, K.S.; Subramaniam, U. COVID-19: Impact analysis and recommendations for power sector operation. Appl. Energy 2020, 279, 115739. [Google Scholar] [CrossRef] [PubMed]
  3. Gollakota, A.R.; Shu, C.M. COVID-19 and energy sector: Unique opportunity for switching to clean energy. In International Association for Gondwana Research; Elsevier B.V.: Amsterdam, The Netherlands, 2022; Volume 114, pp. 751–7311. [Google Scholar]
  4. Abulibdeh, A. Modeling electricity consumption patterns during the COVID-19 pandemic across six socioeconomic sectors in the State of Qatar. Energy Strategy Rev. 2021, 38, 100733. [Google Scholar] [CrossRef]
  5. United Nations Lao PDR. Toward a COVID-19 Recovery Plan; Final Report; Financing for Sustainable Development and Effective Development Cooperation (Macro-Fiscal Framework); Ministry of Finance and United Nations Lao PDR: Vientiane, Laos, 2020; pp. 3–15. [Google Scholar]
  6. Chanthaboury, K. Socio-Economic Impact Assessment of COVID-19 on Lao PDR; Final Report; Ministry of Finance and United Nations Lao PDR: Vientiane, Laos, 2020. [Google Scholar]
  7. Japan International Cooperation Agency (JICA). Ministry of Energy and Mines Power Network System Master Plan in Lao PDR, 2020; Final Report; Japan International Cooperation Agency (JICA): Tokyo, Japan, 2020. [Google Scholar]
  8. Hoang, A.T.; Nižetić, S.; Olcer, A.I.; Ong, H.C.; Chen, W.H.; Chong, C.T.; Thomas, S.; Bandh, S.A.; Nguyen, X.P. Impacts of COVID-19 pandemic on the global energy system and the shift progress to renewable energy: Opportunities, challenges, and policy implications. Energy Policy 2021, 154, 112322. [Google Scholar] [CrossRef]
  9. Pilloni, M.; Kádár, J.; Abu Hamed, T. The Impact of COVID-19 on Energy Start-Up Companies: The Use of Global Financial Crisis (GFC) as a Lesson for Future Recovery. Energies 2022, 15, 3530. [Google Scholar] [CrossRef]
  10. Çelїk, D.; Meral, M.E.; Waseem, M. The progress, impact analysis, challenges and new perceptions for electric power and energy sectors in the light of the COVID-19 pandemic. Sustain. Energy Grids Netw. 2022, 31, 100728. [Google Scholar] [CrossRef]
  11. Amir, M.; Khan, S.Z. Assessment of renewable energy: Status, challenges, COVID-19 impacts, opportunities, and sustainable energy solutions in Africa. Energy Built Environ. 2022, 3, 348–362. [Google Scholar] [CrossRef]
  12. Navon, A.; Machlev, R.; Carmon, D.; Onile, A.E.; Belikov, J.; Levron, Y. Effects of the COVID-19 pandemic on energy systems and electric power grids—A review of the challenges ahead. Energies 2021, 14, 1056. [Google Scholar] [CrossRef]
  13. Arora, K.; Kumar, A.; Kamboj, V.K.; Prashar, D.; Shrestha, B.; Joshi, G.P. Impact of renewable energy sources into multi area multi-source load frequency control of interrelated power system. Mathematic 2021, 9, 186. [Google Scholar] [CrossRef]
  14. Zhuo, Z.; Zhang, N.; Yang, J.; Kang, C.; Smith, C.; O’Malley, M.J.; Kroposki, B. Transmission expansion planning test system for AC/DC hybrid grid with high variable renewable energy penetration. IEEE Trans. Power Syst. 2019, 35, 2597–2608. [Google Scholar] [CrossRef]
  15. Collaborative project between Lao People’s Democratic Republic and Thailand. Assessment of Solar Energy Potentials for Lao People’s Democratic Republic; Final Report; Digital Research Information Center: Bangkok, Thailand, 2007. [Google Scholar]
  16. Bertram, C.; Luderer, G.; Creutzig, F.; Bauer, N.; Ueckerdt, F.; Malik, A.; Edenhofer, O. COVID-19-induced low power demand and market forces starkly reduce CO2 emissions. Nat. Clim. Chang. 2021, 11, 193–196. [Google Scholar] [CrossRef]
  17. Lazo, J.; Aguirre, G.; Watts, D. An impact study of COVID-19 on the electricity sector: A comprehensive literature review and Ibero-American survey. Renew. Sustain. Energy Rev. 2022, 158, 112135. [Google Scholar] [CrossRef] [PubMed]
  18. Bielecki, S.; Skoczkowski, T.; Sobczak, L.; Buchoski, J.; Maciąg, Ł.; Dukat, P. Impact of the lockdown during the COVID-19 pandemic on electricity use by residential users. Energies 2021, 14, 980. [Google Scholar] [CrossRef]
  19. Ansari, M.R.; Pirouzi, S.; Kazemi, M.; Naderipour, A.; Benbouzid, M. Renewable generation and transmission expansion planning coordination with energy storage system: A flexibility point of view. Appl. Sci. 2021, 11, 3303. [Google Scholar] [CrossRef]
  20. Dev, S.M.; Sengupta, R. Impact of COVID-19 on the Indian Economy: An Interim Assessment; Indira Gandhi Institute of Development Research: Mumbai, India, 2020. [Google Scholar]
  21. Zhong, H.; Tan, Z.; He, Y.; Xie, L.; Kang, C. Implications of COVID-19 for the electricity industry: A comprehensive review. CSEE J. Power Energy Syst. 2020, 6, 489–495. [Google Scholar]
  22. Nayak, J.; Mishra, M.; Naik, B.; Swapnarekha, H.; Cengiz, K.; Shanmuganathan, V. An impact study of COVID-19 on six different industries: Automobile, energy and power, agriculture, education, travel and tourism and consumer electronics. Expert Syst. 2020, 39, e12677. [Google Scholar] [CrossRef]
  23. Zhang, D.; Li, H.; Zhu, H.; Zhang, H.; Goh, H.H.; Wong, M.C.; Wu, T. Impact of COVID-19 on urban energy consumption of commercial tourism city. Sustain. Cities Soc. 2021, 73, 103133. [Google Scholar] [CrossRef]
  24. Cui, Z.; Wu, J.; Lian, W.; Wang, Y.G. A novel deep learning framework with a COVID-19 adjustment for electricity demand forecasting. Energy Rep. 2023, 9, 1889–1895. [Google Scholar] [CrossRef]
  25. Keokhoungning, T.; Premrudeepeechacharn, S.; Wongsinlatam, W.; Namvong, A.; Remsungnen, T.; Mueanrit, N.; Sorn-in, K.; Kravenkit, S.; Siritaratiwat, A.; Srichan, C.; et al. Transmission network expansion planning with high penetration solar energy using particle swarm optimization in Lao PDR toward 2030. Energies 2022, 15, 8359. [Google Scholar] [CrossRef]
  26. Wang, P.; Du, E.; Zhang, N.; Xu, X.; Gao, Y. Power system planning with high renewable energy penetration considering demand response. Glob. Energy Interconnect. 2021, 4, 69–80. [Google Scholar] [CrossRef]
  27. Stativă, A.; Gonzalez-Longatt, F. Peer to peer (P2P) MATLAB-POWER FACTORY communication: Optimal placement and setting of power system stabilizer. In Advanced Smart Grid Functionalities Based on PowerFactory; Springer: Berlin/Heidelberg, Germany, 2018; pp. 301–318. [Google Scholar]
  28. Morquechoa, E.G.; Torres, S.P.; Castro, C.A. An efficient hybrid metaheuristics optimization technique applied to the AC electric transmission network expansion planning. Swarm Evol. Comput. 2021, 61, 100830. [Google Scholar] [CrossRef]
  29. Wanga, F.; Zhanga, H.; Zhoub, A.A. Particle swarm optimization algorithm for mixed-variable optimization problems. Swarm Evol. Comput. 2021, 60, 100808. [Google Scholar] [CrossRef]
  30. Sameer, H.A.; Gharghan, S.K.; Mutlag, A.H. Hybridization of particle swarm optimization algorithm with neural network for COVID-19 using computerized tomography scan and clinical parameters. J. Eng. 2023, 2023, e12226. [Google Scholar] [CrossRef]
  31. Ahmadian, A.; Elkamel, A.; Mazouz, A. An improved hybrid particle swarm optimization and tabu search algorithm for expansion planning of large dimension electric distribution network. Energies 2020, 13, 5631. [Google Scholar] [CrossRef]
  32. Sedighizadeha, D.; Masehianb, E.; Sedighizadehc, M.; Akbaripourd, H. GEPSO: A new generalized particle swarm optimization algorithm. Math. Comput. Simul. 2020, 179, 194–212. [Google Scholar] [CrossRef]
  33. Shami, T.M.; El-Saleh, A.A.; Alsaitti, M.; Al-Tasem, Q.; Summakiek, M.A.; Mirjalili, S. Particle Swarm Optimization: A Comprehensive Survey. IEEE Access. 2022, 10, 10031–10061. [Google Scholar] [CrossRef]
  34. Blank, L.T.; Tarquin, A.J.; Iverson, S. Engineering Economy; Mc Graw–Hill: New York, NY, USA, 2005. [Google Scholar]
  35. Abbasi, S.; Aldi, H. Return on investment in transmission network expansion planning considering wind generation uncertainties applying non-dominated sorting genetic algorithm. J. Oper. Autom. Power Eng. 2018, 6, 89–100. [Google Scholar]
  36. Gomesa, P.V.; Saraivaa, J.T.; Carvalhob, L.; Diasc, B.; Oliveirac, L. Impact of decision-making models in Transmission Expansion Planning considering large shares of renewable energy sources. Electr. Power Syst. Res. 2019, 174, 105852. [Google Scholar] [CrossRef]
Figure 1. The power demand of the Lao PDR from 2015 to 2021; data reprinted with permission from [7].
Sustainability 15 06814 g001
Figure 2. EDL generation profile in 2020; data reprinted with permission from [7].
Sustainability 15 06814 g002
Figure 3. The load profiles of the national network from 2019 to 2022; data reprinted with permission from [7].
Sustainability 15 06814 g003
Figure 4. Flowchart of the implemented power supply optimization.
Sustainability 15 06814 g004
Figure 5. Single-line diagram of the existing network of the Lao PDR; data reprinted with permission from [7,25].
Sustainability 15 06814 g005
Figure 6. The types of consumers and the power exported to neighboring countries due to the COVID-19 outbreak in 2020.
Sustainability 15 06814 g006
Figure 7. The types of consumers and the power exported to neighboring countries due to the COVID-19 outbreak in 2021.
Sustainability 15 06814 g007
Figure 8. The optimal power supply of the Lao PDR network using 10 particles and 250 iterations.
Sustainability 15 06814 g008
Table 1. Network parameters for the EDL network; data reprinted with permission from [7,25].
ParameterValue
Transmission lines 874 lines with 149 buses
Generation 1754 MW with an increase according to the National Power Development Plan (NPDP)
Demand 1554 MW in 2020 and 1653 in 2021
Transmission line cost430,000 USD/km/circuit (500 kV), 230,000 USD/km/circuit (230 kV), and 120,000 USD/km/circuit (115 kV)
PV power
purchasing cost
0.053 USD/kWh
PV power selling cost 0.072 USD/kWh
Table 2. Optimal power supply results for the Lao PDR network.
Description 20202021
Added lines/
equipment
None 115 kV single-circuit line from Thanaleng, Lao PCR,
to Nong Khai, Thailand,
with a length of approximately 11.5 km
No. of buses addedNone 21 buses
PV capacity (MW)175 MW
Total active power generation (MW)15541753
Total reactive power45.4665.2
Total load in the system (MW)1414.971642.70
Total value from adding PV
(USD 1 million)
None3.7
Table 3. The economic evaluation for 2021.
Description Economic Evaluation for 2021
Investment cost of line/
equipment
USD 2.17 million115 kV single-circuit Thanaleng-to-Nongkhai line with a length of approximately 11.5 km
Power purchasing and sellingUSD 0.064/0.072Average
The average power flow in the new line36.5 MWIncluding exports and imports
O&M per yearUSD 0.217 millionLine and equipment lifecycle of 20 years
Value adding PVUSD 3.46 millionTotal bus added PV is 21 buses/175 MW of PV’s Capacities
Power losses/reliablility comparisionWith PV Without PV
Power losses 35.16 MW36.47 MW
Reliability94.72 T/year101.54 T/year
IRR30%
NPVUSD 9.5 millionWith a discount rate of 6%
Disclaimer/Publisher’s Note: The statements, opinions and data contained in all publications are solely those of the individual author(s) and contributor(s) and not of MDPI and/or the editor(s). MDPI and/or the editor(s) disclaim responsibility for any injury to people or property resulting from any ideas, methods, instructions or products referred to in the content.

