
Numerical Simulation of the Ca(OH)2/CaO Thermochemical Heat Storage Process in an Internal Heating Fixed-Bed Reactor
Institute of Engineering Thermophysics, School of Mechanical Engineering, Shanghai Jiao Tong University, Shanghai 200240, China
*
Author to whom correspondence should be addressed.
Sustainability 2023, 15(9), 7141; https://doi.org/10.3390/su15097141
Submission received: 17 March 2023
/
Revised: 12 April 2023
/
Accepted: 21 April 2023
/
Published: 25 April 2023
(This article belongs to the Special Issue Renewable Energy Integration and Application in Buildings for Carbon Neutrality)
Abstract
:Using a Ca(OH)2/CaO thermochemical heat storage system is an effective way to promote the utilization of renewable energy. However, poor thermal conductivity restricts the application of a widely used fixed-bed reactor. To improve the heat storage rate, the internal heating mode, which heats the reactant via the internal heating tube instead of the external wall, was adopted, and the heat storage process in the fixed-bed reactor was investigated numerically. The results show that the number and location of tubes have a significant impact on heat storage performance. Compared with the external wall heating mode, the optimized scheme of six internal heating tubes can shorten the reaction time by 21.78%. The temperature and reaction extent distribution reveal that as the reaction proceeds, the optimized scheme has a higher temperature and reaction extent. Additionally, the effects of different conditions, such as solid particle porosity, wall temperature, outlet pressure, and solid particle size, were also analyzed. The study demonstrates that increases in solid particle porosity, wall temperature, and solid particle size as well as a decrease in outlet pressure can improve the heat storage rate.
1. Introduction
Alleviating environmental problems caused by fossil fuel energy and meeting the growing energy demand are important for achieving sustainable development. Renewable energy technology can deal with energy and environmental issues, and thus it holds great promise for achieving the goals of sustainable development. However, renewable energy sources, such as wind and solar energy, suffer from intermittency and imbalance between supply and demand [1,2]. Thermal energy storage can realize energy storage and conversion. By integrating heat storage units into the renewable energy system, the utilization efficiency of renewable energy can be improved. Thus, renewable energy can effectively replace conventional fossil fuels and achieve sustainable development. According to the principle of heat storage, the thermal energy storage technology can be divided into sensible heat, latent heat, and thermochemical heat storage [3,4,5,6]. Compared with the first two methods, with the advantage of higher energy density and low heat loss during storage, thermochemical heat storage has attracted wide attention [7,8,9].
The Ca(OH)2/CaO thermochemical heat storage system has great potential for development due to the advantages of nontoxicity, low cost, and high energy density. The dehydration of Ca(OH)2 can realize heat storage, and the hydration of CaO can realize heat release. The reversible reaction of Ca(OH)2/CaO is as follows:
The fixed-bed reactor is widely used due to its relatively simple structure. The heat storage material stands in a fixed bed and transmits heat through a wall or heat exchanger. Schmidt et al. [10] designed an indirectly operated reactor for 20 kg Ca(OH)2 and studied the heat storage and release characteristics of the reactor, confirming the possibility for heat storage by adjusting the temperature. Ranjha et al. [11] studied a three-dimensional fixed bed using the numerical method and found that the thermal conductivity and porosity have a huge impact on the size design of the bed. Through 20 heat storage and release cycles in a fixed bed, Dai et al. [12] found that the system has some problems such as poor thermal conductivity, agglomeration, and sintering, which restrict its application. To enhance the performance of the fixed bed, some efforts have been made. For example, setting metal fins or foams can enhance the heat transfer inside the reactor [13,14,15,16], and the setting of porous channels is conducive to water vapor discharge, thus improving the dehydration rate [17,18]. Nanoparticle additives such as SiO2 can prevent agglomeration and reduce channeling effects [19]. In addition, for poor thermal conductivity, a direct-type reactor concept was proposed. The heat transfer fluid is in direct contact with the reactants rather than through the wall. Schaube et al. [20,21] studied the thermal behavior of a direct-type reactor experimentally and numerically. The influence of the heat transfer fluid mass flow rate, temperature, and water vapor partial pressure was analyzed. Compared with an indirect-type reactor, a direct-type reactor can enhance the heat transfer inside the reactor, but the pressure drop is inevitable when the heat transfer fluid flows through the reaction bed. Shi et al. [22] studied the hydration process in a tubular direct-type reactor numerically, as well as the influence of different types of fins. They reported that the pressure drop cannot be ignored when arranging fins.
Moreover, the reactor also has a fluidized bed and a moving bed, which can enhance the heat and mass transfer performance. However, the inherent properties of materials cause some problems, such as cohesiveness of the powder. Flowability can be enhanced by means of particle size stabilization. To stabilize the particle size, Afflerbach et al. [23,24] developed a novel encapsulation method for pregranulated Ca(OH)2 with a ceramic shell, and the mechanical stability was increased. Xia et al. [25] developed granular composites through Ca(OH)2, carboxymethyl cellulose sodium, and vermiculite. After several cycles, the composites still had great structural integrity. Guo et al. [26] prepared non-shelled and shelled composite pellets of CaO and reported that the shelled composite pellets had an advanced performance. Since the fluidized bed and moving bed systems are relatively complex, the research is still in the initial stages.
In this study, the Ca(OH)2/CaO thermochemical heat storage process is investigated. As mentioned above, an indirect heating fixed bed is relatively simple. However, the heat transfer inside the reactor is unsatisfactory due to the poor internal thermal conductivity, and the dehydration time of Ca(OH)2 is longer. There are many ways to accelerate the dehydration of Ca(OH)2 mentioned in the literature, but these rarely involve the heating mode. Therefore, compared with the common external wall heating mode, the internal heating mode is adopted in this study, which can quickly heat the reactants. An optimized arrangement scheme can be obtained, which can provide guidance for the application of a fixed bed.
2. Reactor Description and Numerical Model
2.1. Reactor Description
In this study, a cylindrical indirect heating reactor concept was selected as the research object. As shown in Figure 1a, to simplify the calculation, a two-dimensional model with a radius r1 of 50 mm and an internal gas outlet channel radius r0 of 2.5 mm was adopted. During the heat storage process, Ca(OH)2 was heated by the outer wall, and the generated water vapor was discharged from the internal channel. As shown in Figure 1b–d, an internal heating concept is proposed in this paper. The temperature required for Ca(OH)2 decomposition is provided by the internal heat exchange tube, which may quickly heat Ca(OH)2.
As shown in Figure 1, the internal heating tubes with the number Ntube = 0, 2, 4, and 6 are studied in this paper. To avoid excessive loss of energy storage density when the tube was embedded, when Ntube = 2, 4, and 6, respectively, the total heating area of the tube was 0.4 times that of Ntube = 0, and thus the corresponding radii were 10 mm, 5 mm, and 3.33 mm. When Ntube = 4 and 6, the angles between tubes were 90° and 60°, respectively. The detailed scheme settings are listed in Table 1.
2.2. Numerical Model
The heat storage of Ca(OH)2/CaO involves the coupling of chemical, heat transfer, and flow processes, and thus it is essential to reasonably simplify the model. In this paper, the main model assumptions were summarized as follows: (a) the reactor was treated as a continuous porous area; (b) the solid particle porosity, size, and thermal conductivity were considered constant during the reaction process; (c) according to [21], due to the large heat transfer surface between fine particles and gas, the particles and water vapor could be assumed to be in thermal equilibrium; (d) the heat radiation was ignored; (e) the water vapor was treated as an ideal gas.
2.2.1. Chemical Reaction
The relationship between the equilibrium pressure and temperature can be described as follows [7]:
where Peq represents the equilibrium pressure, Pa, and Teq represents the equipment temperature, K.
The mole amount conservation equation for reactant Ca(OH)2 is calculated as follows:
The reaction rate of the dehydration of Ca(OH)2 can be expressed as follows [11]:
where CA and CA0 are the molar concentrations of Ca(OH)2 and its initial value, respectively, mol/m3; X is the reaction extent; A represents the pre-exponential factor, 7.15 × 10⁹ 1/s; E is the activation energy, 1.87 × 10⁵ J/mol; and R means the gas constant, J/(mol·K).
2.2.2. Governing Equations for Water Vapor
The mass conservation equation for water vapor is calculated as follows:
where ρw means the density of water vapor, kg/m3; v means the velocity of water vapor, m/s; Sm is the source term caused by the dehydration of Ca(OH)2, kg/(m3·s); and Mw is the molar mass of water vapor, kg/mol.
The flow of water vapor in a porous bed can be described by Darcy’s law [27], which is defined as follows:
where K denotes permeability; μw is the dynamic viscosity of water vapor, Pa·s; Dps is the particle size, 5 μm; and ε is the porosity, 0.8.
Due to the thermal equilibrium between particles and water vapor, the energy conservation equation for water vapor and solid material can be obtained as follows:
The specific heat cpA and cpB can be expressed as a function of temperature [11]:
where λeff, λw, and λs are the effective thermal conductivity and the thermal conductivity of the water vapor and the solid material, respectively, W/(m·K) (in this study, λs = 2); Sq is the source term caused by the endothermic reaction, W/m3; cps, cpA, and cpB are the specific heat of the solid material mixture, Ca(OH)2, and CaO, respectively, J/(kg·K); and ρs, ρA, and ρB are the density of the solid material mixture, Ca(OH)2, and CaO, respectively, kg/m3 (ρA = 2200, ρB =1665).
Figure 2 shows the main boundary conditions. The initial value of the solid material temperature was 723 K, and the initial pressure inside the reactor and the water vapor outlet was set to 28,415 Pa, which is about the equilibrium pressure for the initial temperature. When Ntube = 0, the outer wall with a constant temperature of 863 K was the heating source. When the internal heating mode was used, the wall temperature of the internal heating tube was set to 863 K. Meanwhile, it was assumed that the reactor was well-insulated, thus the adiabatic boundary was adopted for the outer wall.
2.2.3. Validation
The simulation of the above heat storage process was implemented in the COMSOL software. To reduce the influence of grids on the results, firstly, the grid independence analysis was carried out. For case 0, when the cell number increased to 1600, the influence of the grids could be ignored, and thus this grid was selected for further research. Additionally, the same mesh generation method was applied to other cases, which also reduced the impact of the grids.
The previous experiment studied the Ca(OH)2/CaO thermochemical heat storage process in a fixed-bed reactor [28]. The experimental and simulation results of pure Ca(OH)2 with a wall temperature of 455 °C are shown in Figure 3. The changing trend of the reaction extent was similar, and at the initial stage of the reaction, due to the uneven temperature inside the reactor during the test, an initial temperature condition during simulation caused errors. However, as the reaction progressed, the gap between the simulation and the experiment decreased.
In addition, the simulation results of Chen et al. [16] were also used for model accuracy validation. The case without fins was calculated using the simulation method in this paper, and the comparison results are shown in Figure 4. There is little difference in the average temperature and reaction extent between the data provided by Chen et al. [16] and in this study. Therefore, according to the above verification, the model established in this study is credible.
3. Results and Discussion
The number and location of internal tubes can affect the heat transfer inside the reactor, thus affecting the heat storage process. Therefore, first of all, the effects of different heating modes on heat storage were analyzed, and the optimized scheme within the scope of this study could be obtained. Subsequently, to further comprehend the effects of internal heating, the temperature and the reaction extent distribution were analyzed. Moreover, the effects of different conditions such as solid particle porosity, wall temperature, outlet pressure, and solid particle size on heat storage for the optimized scheme were studied.
3.1. Effects of the Heating Mode
Figure 5, Figure 6 and Figure 7 display the effects of different heating modes on heat storage. It can be seen from the results that the different heating modes had a significant influence on heat storage. As shown in Figure 5, when Ntube = 2, the internal heating mode had an adverse effect on heat storage. Compared with case 0, which is the external wall heating mode, the reaction extent and the temperature decreased; thus, the reaction time and the molar concentration of the reactant increased. Due to the insufficient number of tubes, most areas in the reactor were too far from the heat source. In addition, when the tube was set in the middle position (case 2-B), the heat storage performance was better than that of the internal heating mode.
From Figure 6 and Figure 7, it can be seen that when Ntube increased to 4 and 6, the cases with some heating tubes near the center of the reactor, such as cases 4-A, 4-A-B, 4-A-C, 6-A, 6-A-B, 6-B-A, and 6-C-A, still had an adverse effect on heat storage compared with the external wall heating mode. However, in the cases where the heating tubes were located near the outer wall, half of r1 could improve the heat storage performance. When Ntube = 4 and 6, the optimal cases were 4-B-C and 6-B-C, respectively. A comparison of cases 0, 4-B-C, and 6-B-C is plotted in Figure 8. It can be seen that case 6-B-C had a superior performance. The reaction times of cases 4-B-C and 6-B-C were 11,200 s and 9700 s, and compared with case 0, the times decreased by 9.68% and 21.78%, respectively. Therefore, the best solution within the scope of this study was case 6-B-C. Additionally, compared with the results of Ntube = 4 and 6, it can be observed that some cases of Ntube = 4 had a better heat storage performance than Ntube = 6, indicating that both the number and location of tubes had a significant impact on the heat storage performance. In the follow-up study, satisfactory performance could be achieved with fewer heating tubes by optimizing the position of the heating tubes.
3.2. Temperature and Reaction Extent Distribution
To further comprehend the effects of internal heating, the temperature and the reaction extent distribution of case 0 and case 6-B-C were compared in this section, and the results are shown in Figure 9 and Figure 10. As shown in Figure 9 and Figure 10, it can be found that the temperature in the zone near the heat source rose rapidly, and, thus, the reaction extent in this zone was great. However, due to the different heat source positions for cases 0 and 6-B-C, the temperature distribution was different. At the initial stage of the reaction, such as at t = 1000 s and 3000 s, although the reactor center temperature of case 0 was lower than that of case 6-B-C, the continuous heating area of case 0 had a greater influence than that of case 6-B-C; thus, the average temperature and the reaction extent of case 0 were higher than those of case 6-B-C. As the reaction proceeded, e.g., at t = 5000 s and 7000 s, due to the fact that the internal zone of case 0 was far from the heat source, the reactor center temperature of case 0 was still low, as shown in Figure 7, and the average temperature and reaction extent of case 0 were lower than those of case 6-B-C at this stage.
3.3. Effects of Different Conditions
Based on the above analysis, the optimal scheme in this study was case 6-B-C. To further study this scheme, the effects of different conditions on case 6-B-C were investigated in this section. Moreover, when one condition changed, other conditions remained unchanged.
3.3.1. Solid Particle Porosity
Porosity can affect the amounts of reactants and thus the energy storage density. According to Equation (8), porosity can affect the permeability and thus the pressure of the reactor. In this section, the reaction time, average pressure, and volumetric energy storage rate, calculated by means of Equation (17), were analyzed, and the results are shown in Figure 11.
where Pwt means the volumetric energy storage rate, kW/(m3), and Rt is the reaction time, s.
From the figure, it can be seen that with an increase in porosity, due to a decline in the amounts of reactants and an increase in permeability, the reaction time decreased. When ε was 0.8, the reaction time was 9700 s, and compared with ε = 0.4, it decreased by 50%. According to Equation (17), the curve variation in Pwt in Figure 11a was the result of the combined effects of CA0 and Rt, with the peak value appearing at ε = 0.6.
As the dehydration reaction proceeds, water vapor is generated. Since water vapor cannot be discharged in time at the initial stage of the reaction, the pressure in the reactor increases first and then decreases with time. A smaller porosity means less permeability, and more reactants lead to more water vapor [27]. Thus, the peak of pressure is maximum when porosity ε = 0.4.
3.3.2. Wall Temperature
The effects of wall temperature are shown in Figure 12. It can be clearly observed from Figure 12 that the increase in wall temperature can obviously improve heat storage performance. Dehydration temperature could be reached faster due to higher wall temperature, and a higher wall temperature means a larger reaction extent at the same time and less reaction time. When the wall temperature was 903 K, the time when the reaction extent reached 1 was about 6100 s. Compared with 823 K, it decreased by 71.36%. The variation trend for the average temperature under each wall temperature was the same. At the initial stage of the reaction, the reaction extent was small, leading to a rapid increase in temperature. Then, as the endothermic reaction continued, the temperature increased more slowly. At the end of the reaction, the average temperature in the reactor was equal to the wall temperature and would not change.
3.3.3. Outlet Pressure
The effects of outlet pressure are shown in Figure 13. Since a lower outlet pressure is conducive to the discharge of water vapor [18], the pressure in the reactor drops. The equipment temperature corresponding to the pressure decreases, and dehydration occurs in advance. Therefore, as shown in Figure 13a, with an increase in outlet pressure, the reaction time increased. When the outlet pressure was 1000 Pa, the reaction time was 8800 s, which decreased by 11.34% compared with the outlet pressure of 28,415 Pa.
From Figure 13b, it can be seen that, as analyzed in Section 3.3.1, as the dehydration reaction proceeded, the average pressure in the reactor tended to increase first and then decrease. However, when the outlet pressure was 1000 Pa and 10,000 Pa, the pressure decreased at the initial stage of the reaction. To further analyze this changing trend, we can take the pressure distribution of 1000 Pa and 28,415 Pa as an example for comparison, and the results are shown in Figure 14. It can be seen that when the outlet pressure was 1000 Pa, the pressure in the reactor was much lower than that at 28,415 Pa. That is because low outlet pressure makes it easier for water vapor to flow out at the initial stage of the reaction.
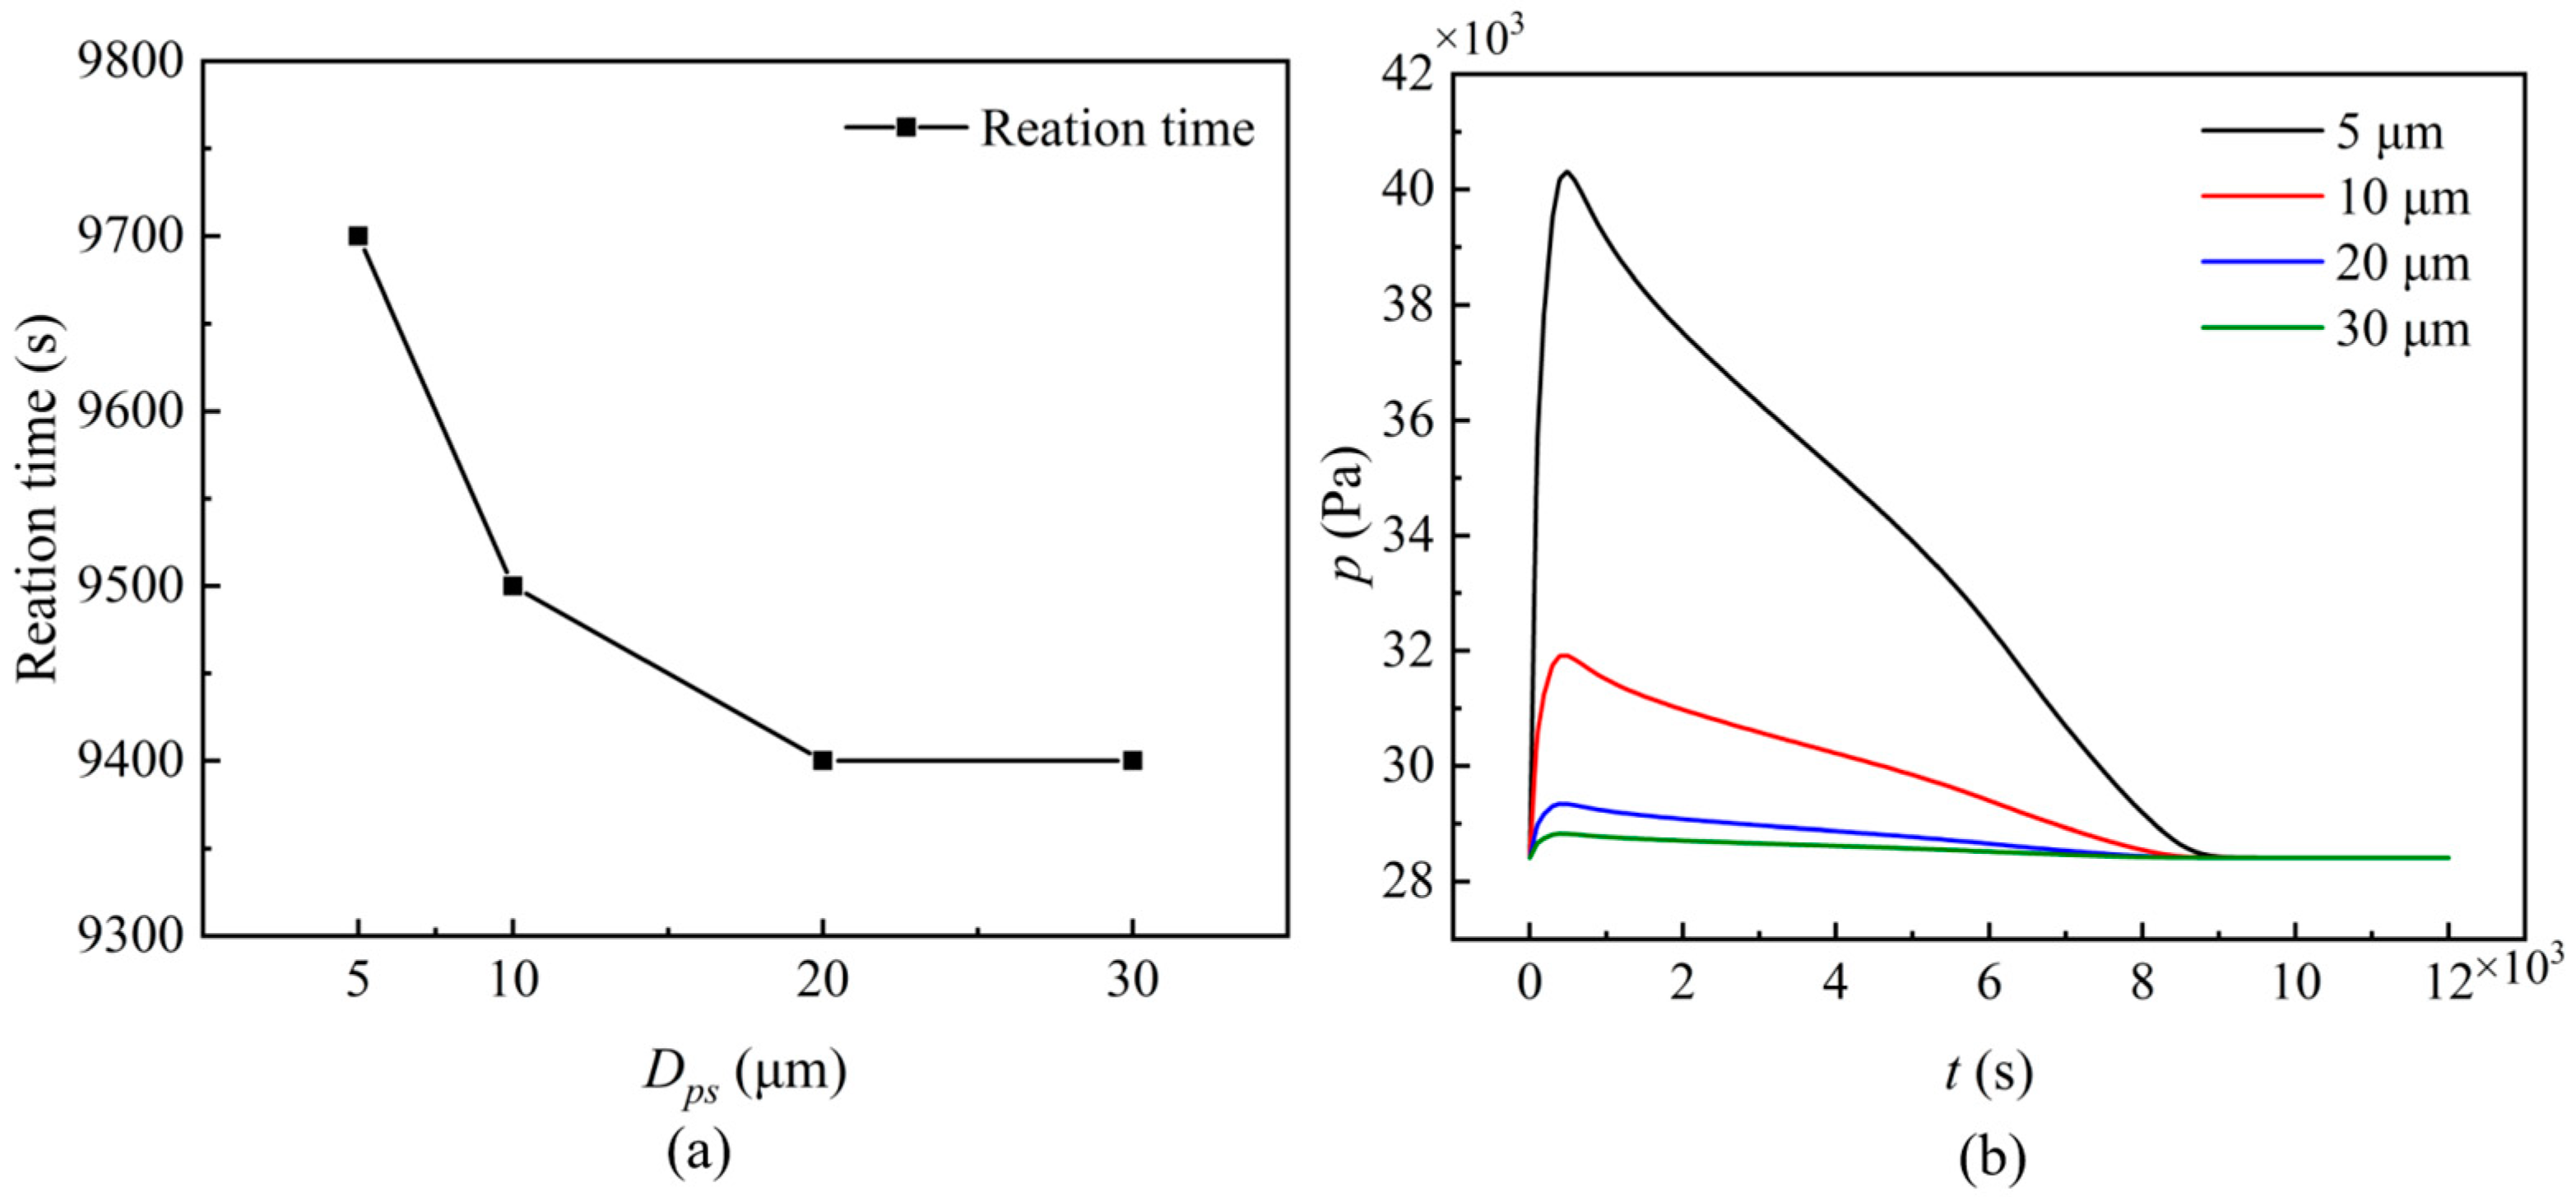
3.3.4. Solid Particle Size
In the above discussion, the particle size remained constant at 5 μm, and it may have been different in the actual reaction; thus, the effects of particle size are discussed in this section. Figure 15 shows the effects of particle size, and from this figure, it can be seen that when the particle size increased from 5 μm to 20 μm, the reaction time decreased. However, when the size continued to increase, the reaction time remained unchanged at about 9400 s, and similar conclusions are shown in [11]. From Figure 15b, it can be observed that with an increase in particle size, the pressure decreased. This is due to an increase in the permeability as the size increased; the pressure peak value at a size of 5 μm was obviously higher than the others. When the size increased to 20 μm, the permeability was already sufficiently large and no longer a limiting factor for water vapor emission. Thus, the average pressure at the particle size of 20 μm and 30 μm was similar, and this can also explain the curve variation rule in Figure 15a.
4. Conclusions
Based on the numerical model established in this study, the Ca(OH)2/CaO thermochemical heat storage process of the fixed-bed reactor with the internal heating mode was investigated. An optimized scheme of six internal heating tubes was obtained, and the main conclusions are summarized as follows:
(1) The number and location of internal heating tubes have a significant influence on heat storage performance, and the heat storage performance can be improved by optimizing the number and location of internal heating tubes. Compared with the external wall heating mode, the reaction time of the optimized scheme in this study decreased by 21.78%.
(2) Compared with the external wall heating mode, as the reaction proceeds, the optimized scheme has a higher temperature and reaction extent due to the closer distance between the reactant and the heat source.
(3) Due to a decline in the amount of reactants and an increase in permeability, the increase in solid particle porosity caused a higher heat storage rate. When the porosity increased from 0.4 to 0.8, the reaction time decreased by 50%. With the increase in wall temperature, the reaction time could also decrease. When the wall temperature increased from 823 K to 903 K, the reaction time decreased by 71.36%.
(4) Reducing the outlet pressure was conducive to the discharge of water vapor, and, thus, the reaction time could decrease. Compared with the outlet pressure of 28,415 Pa, the reaction time at 1000 Pa decreased by 11.34%. The increase in solid particle size could increase permeability, resulting in a low pressure inside the reactor, and, thus, the reaction time could also decrease. However, when the size increased to 20 μm, the permeability was already sufficiently large; thus, the effect of size was insignificant.
Due to the setting of an internal heating tube, the internal heating reactor structure is more complex, and the energy storage density decreases. However, the internal heating mode has advantages in terms of reaction time, especially with reactor scale-up.
Author Contributions
Conceptualization, J.Y. and L.J.; methodology, J.Y.; software, L.J.; validation, J.Y., L.J. and C.Z.; formal analysis, J.Y.; investigation, J.Y.; resources, J.Y.; data curation, J.Y.; writing—original draft preparation, L.J.; writing—review and editing, J.Y.; visualization, J.Y.; supervision, C.Z.; project administration, C.Z.; funding acquisition, C.Z. All authors have read and agreed to the published version of the manuscript.
Funding
This research was funded by the Major Program of the National Natural Science Foundation of China (grant No. 52090063).
Institutional Review Board Statement
Not applicable.
Informed Consent Statement
Not applicable.
Data Availability Statement
The data presented in this study are available on request from the corresponding author.
Acknowledgments
The authors wish to acknowledge the support of the Major Program of the National Natural Science Foundation of China (grant No. 52090063).
Conflicts of Interest
The authors declare no conflict of interest.
References
- Behabtu, H.A.; Messagie, M.; Coosemans, T.; Berecibar, M.; Anlay Fante, K.; Kebede, A.A.; Mierlo, J.V. A review of energy storage technologies’ application potentials in renewable energy sources grid integration. Sustainability 2020, 12, 10511. [Google Scholar] [CrossRef]
- Wang, Y.H.; Zhang, H.Y.; Qi, J.H.; Han, K.H.; He, S.Y.; Guo, C.; Cheng, S.; Gao, M. Thermodynamic and exergy analysis of a novel PEMFC-ORC-MH combined integrated energy system. Energy Conv. Manag. 2022, 264, 115709. [Google Scholar] [CrossRef]
- Sarbu, I.; Sebarchievici, C. A Comprehensive Review of Thermal Energy Storage. Sustainability 2018, 10, 191. [Google Scholar] [CrossRef]
- Pan, Z.H.; Zhao, C.Y. Gas-solid thermochemical heat storage reactors for high-temperature applications. Energy 2017, 130, 155–173. [Google Scholar] [CrossRef]
- Ma, Y.; Luo, Y.L.; Xu, H.X.; Du, R.Q.; Wang, Y. Review on air and water thermal energy storage of buildings with phase change materials. Exp. Comput. Multiph. Flow 2021, 3, 77–99. [Google Scholar] [CrossRef]
- Li, H.T.; Wang, N.N.; Zhao, B.; Feng, H.M.; Han, K.H.; He, S.Y.; Gao, M. Simulation study on the effect of fins on the heat transfer performance of horizontal dual-inner-tube latent thermal energy storage heat exchangers. J. Energy Storag. 2022, 49, 104125. [Google Scholar] [CrossRef]
- Schaube, F.; Koch, L.; Woerner, A.; Mueller-Steinhagen, H. A thermodynamic and kinetic study of the de-and rehydration of Ca(OH)2 at high H2O partial pressures for thermo-chemical heat storage. Thermochim. Acta 2012, 538, 9–20. [Google Scholar] [CrossRef]
- Schmidt, M.; Gutierrez, A.; Linder, M. Thermochemical energy storage with CaO/Ca(OH)2-Experimental investigation of the thermal capability at low vapor pressures in a lab scale reactor. Appl. Energy 2017, 188, 672–681. [Google Scholar] [CrossRef]
- Wang, K.; Yan, T.; Li, R.K.; Pan, W.G. A review for Ca(OH)2/CaO thermochemical energy storage systems. J. Energy Storag. 2022, 50, 104612. [Google Scholar] [CrossRef]
- Schmidt, M.; Szczukowski, C.; Roßkopf, C.; Linder, M.; Wörner, A. Experimental results of a 10 kW high temperature thermochemical storage reactor based on calcium hydroxide. Appl. Therm. Eng. 2014, 62, 553–559. [Google Scholar] [CrossRef]
- Ranjha, Q.; Oztekin, A. Numerical analyses of three-dimensional fixed reaction bed for thermochemical energy storage. Renew. Energy 2017, 111, 825–835. [Google Scholar] [CrossRef]
- Dai, L.; Long, X.-F.; Lou, B.; Wu, J. Thermal cycling stability of thermochemical energy storage system Ca(OH)2/CaO. Appl. Therm. Eng. 2018, 133, 261–268. [Google Scholar] [CrossRef]
- Azpiazu, M.N.; Morquillas, J.M.; Vazquez, A. Heat recovery from a thermal energy storage based on the Ca(OH)2/CaO cycle. Appl. Therm. Eng. 2003, 23, 733–741. [Google Scholar] [CrossRef]
- Fujii, I.; Tsuchiya, K.; Higano, M.; Yamada, J. Studies of an energy storage system by use of the reversible chemical reaction: CaO + H2O = Ca(OH)2. Sol. Energy 1985, 34, 367–377. [Google Scholar] [CrossRef]
- Ranjha, Q.; Vahedi, N.; Oztekin, A. High-temperature thermochemical energy storage-heat transfer enhancements within reaction bed. Appl. Therm. Eng. 2019, 163, 114407. [Google Scholar] [CrossRef]
- Chen, J.T.; Xia, B.Q.; Zhao, C.Y. Topology optimization for heat transfer enhancement in thermochemical heat storage. Int. J. Heat Mass Transf. 2020, 154, 119785. [Google Scholar] [CrossRef]
- Wang, M.; Chen, L.; He, P.; Tao, W.-Q. Numerical study and enhancement of Ca(OH)2/CaO dehydration process with porous channels embedded in reactors. Energy 2019, 181, 417–428. [Google Scholar] [CrossRef]
- Ye, H.; Tao, Y.B.; Wu, Z.H. Performance improvement of packed bed thermochemical heat storage by enhancing heat transfer and vapor transmission. Appl. Energy 2022, 326, 119946. [Google Scholar] [CrossRef]
- Rosskopf, C.; Haas, M.; Faik, A.; Linder, M.; Woerner, A. Improving powder bed properties for thermochemical storage by adding nanoparticles. Energy Conv. Manag. 2014, 86, 93–98. [Google Scholar] [CrossRef]
- Schaube, F.; Kohzer, A.; Schuetz, J.; Woerner, A.; Mueller-Steinhagen, H. De-and rehydration of Ca(OH)2 in a reactor with direct heat transfer for thermo-chemical heat storage. Part A: Experimental results. Chem. Eng. Res. Des. 2013, 91, 856–864. [Google Scholar] [CrossRef]
- Schaube, F.; Utz, I.; Woerner, A.; Mueller-Steinhagen, H. De- and rehydration of Ca(OH)2 in a reactor with direct heat transfer for thermo-chemical heat storage. Part B: Validation of model. Chem. Eng. Res. Des. 2013, 91, 865–873. [Google Scholar] [CrossRef]
- Shi, T.; Xu, H.; Qi, C.; Lei, B.; Wu, Y.; Zhao, C. Multi-physics modeling of thermochemical heat storage with enhance heat transfer. Appl. Therm. Eng. 2021, 198, 117508. [Google Scholar] [CrossRef]
- Afflerbach, S.; Kappes, M.; Gipperich, A.; Trettin, R.; Krumm, W. Semipermeable encapsulation of calcium hydroxide for thermochemical heat storage solutions. Sol. Energy 2017, 148, 1–11. [Google Scholar] [CrossRef]
- Afflerbach, S.; Afflerbach, K.; Trettin, R.; Krumm, W. Improvement of a semipermeable shell for encapsulation of calcium hydroxide for thermochemical heat storage solutions Material design and evaluation in laboratory and reactor scale. Sol. Energy 2021, 217, 208–222. [Google Scholar] [CrossRef]
- Xia, B.Q.; Zhao, C.Y.; Yan, J.; Khosa, A.A. Development of granular thermochemical heat storage composite based on calcium oxide. Renew. Energy 2020, 147, 969–978. [Google Scholar] [CrossRef]
- Guo, R.; Takasu, H.; Funayama, S.; Shinoda, Y.; Tajika, M.; Harada, T.; Kato, Y. Mechanical stability and heat transfer improvement of CaO-based composite pellets for thermochemical energy storage. Chem. Eng. Sci. 2022, 255, 117674. [Google Scholar] [CrossRef]
- Seitz, G.; Helmig, R.; Class, H. A numerical modeling study on the influence of porosity changes during thermochemical heat storage. Appl. Energy 2020, 259, 114152. [Google Scholar] [CrossRef]
- Yan, J.; Zhao, C.Y. Experimental study of CaO/Ca(OH)2 in a fixed-bed reactor for thermochemical heat storage. Appl. Energy 2016, 175, 277–284. [Google Scholar] [CrossRef]
Figure 1.
Schematic of the two-dimensional model.

Figure 2.
Boundary conditions.
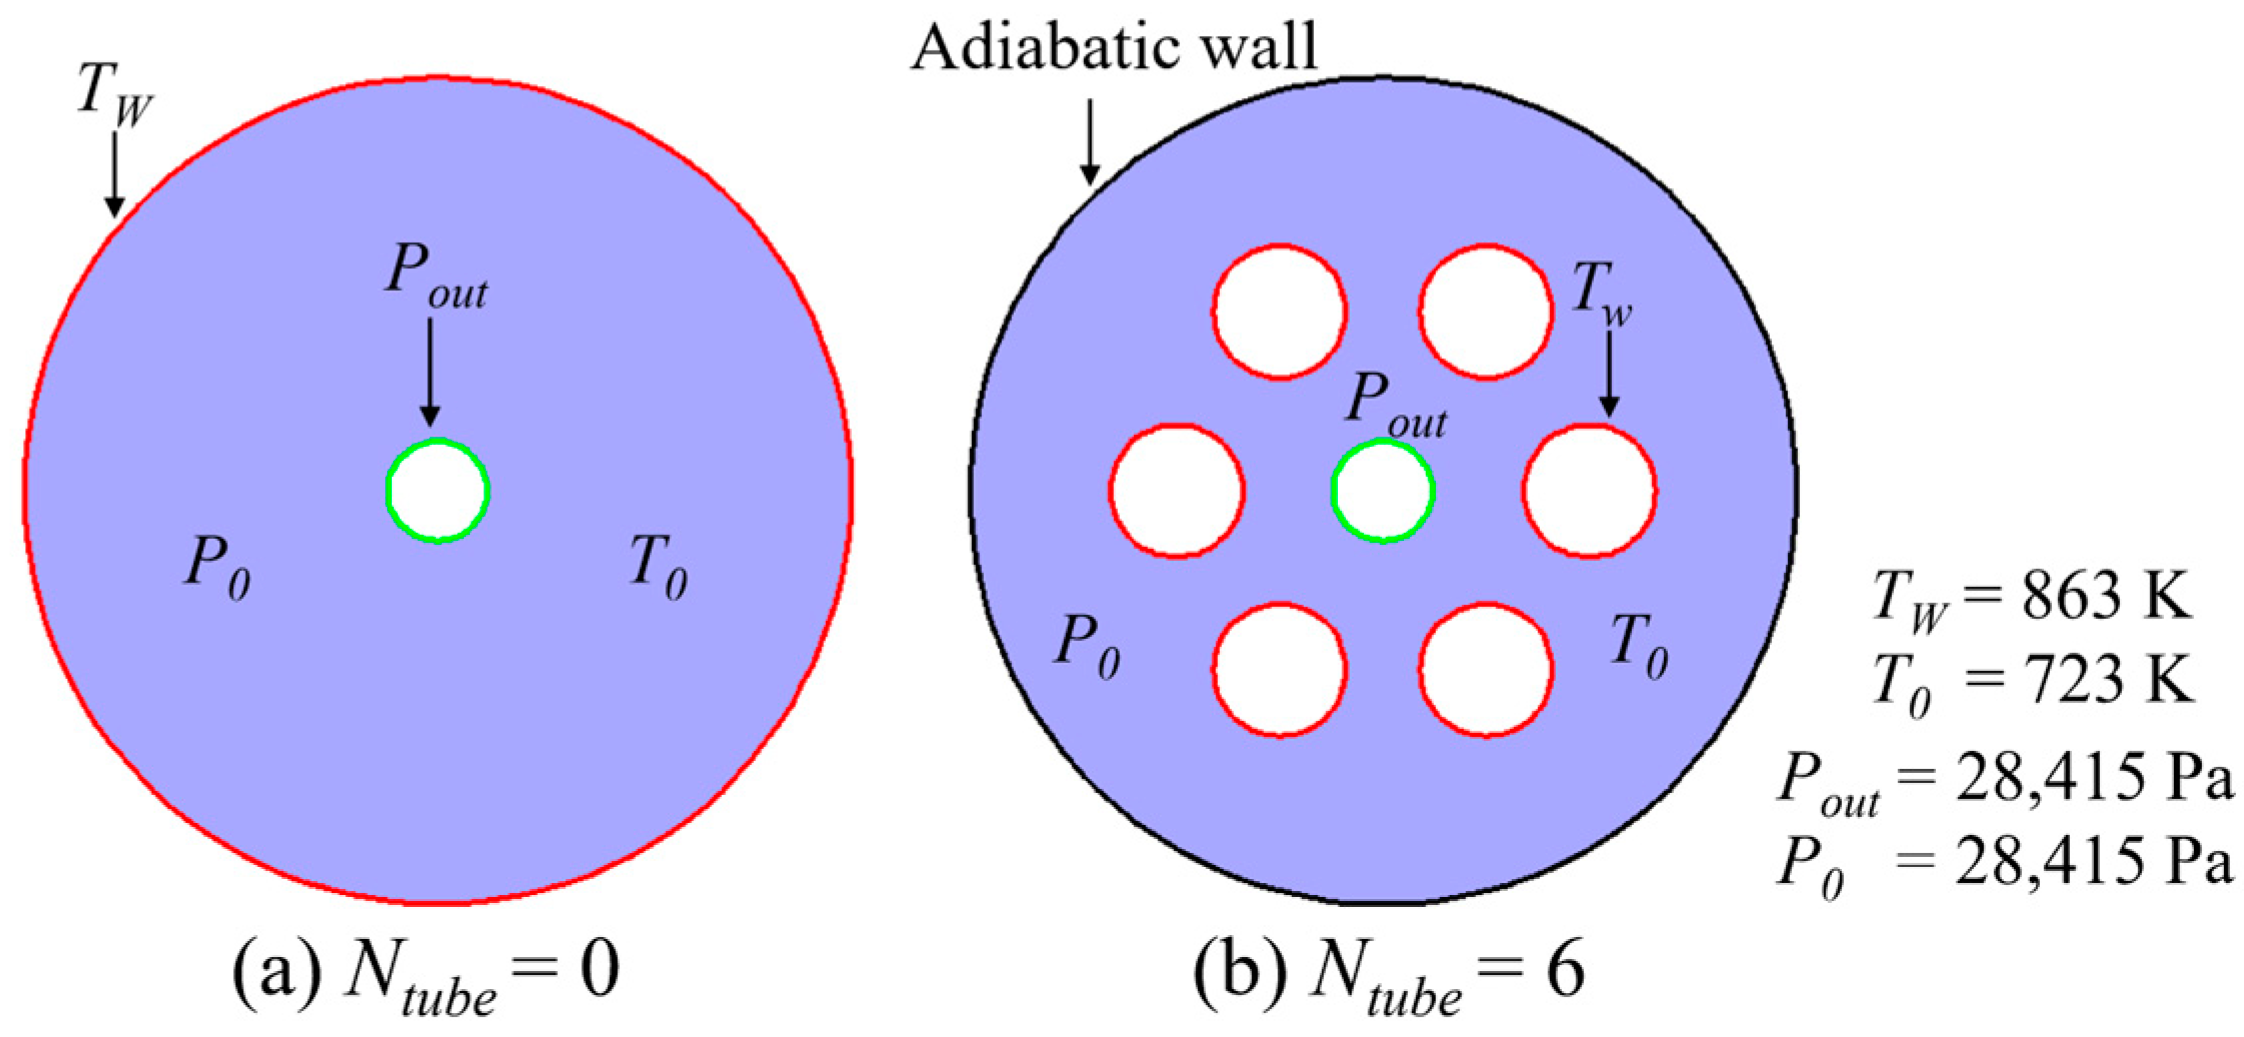
Figure 3.
Comparison between the experiment and the simulation.
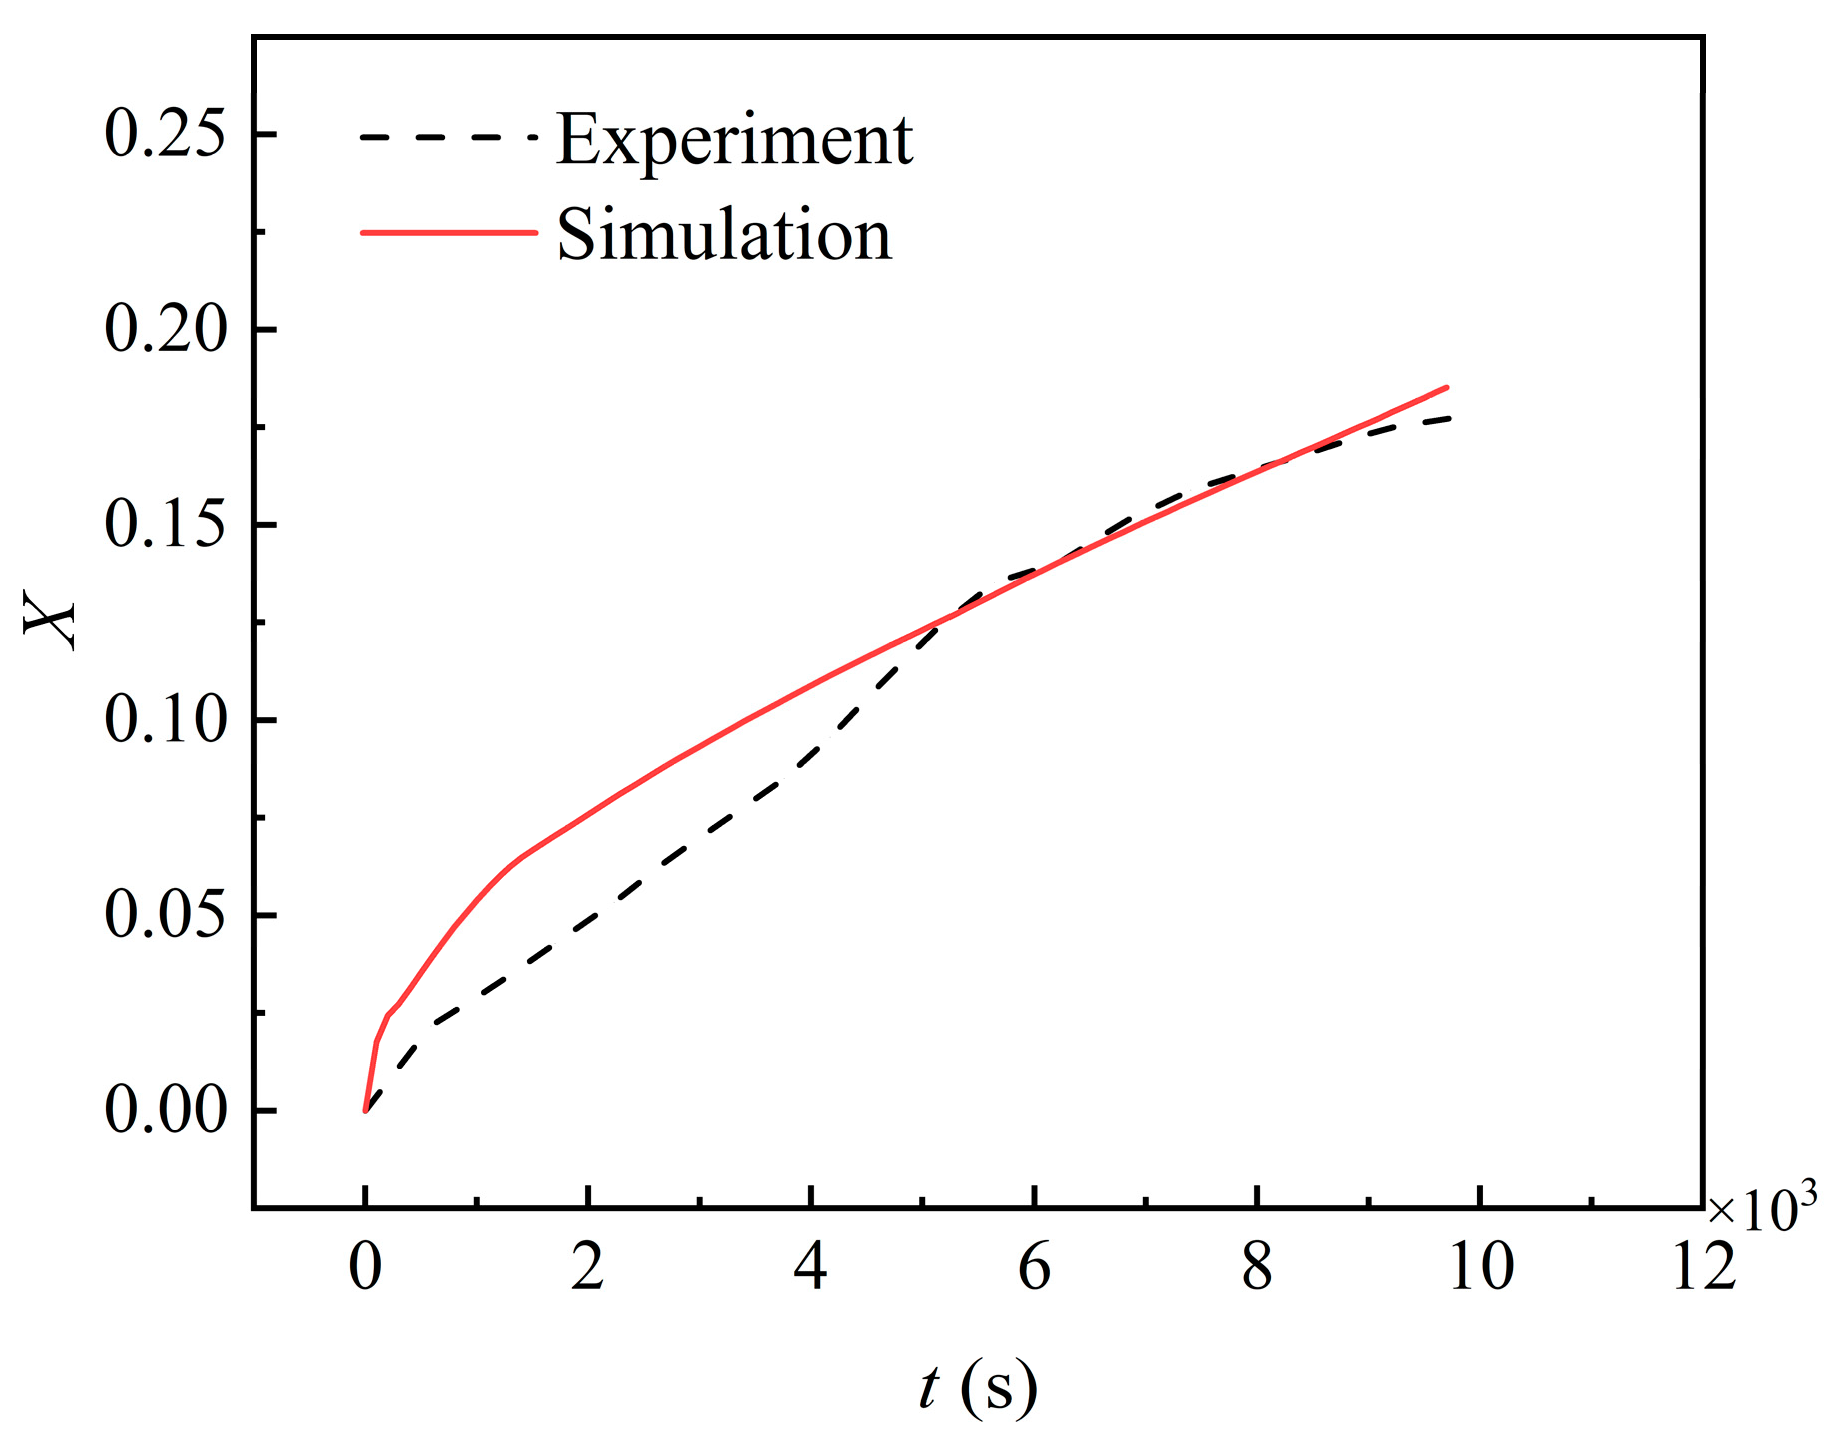
Figure 4.
Comparison of the simulation between this study and the reference: (a) average temperature; (b) average reaction extent [16].
Figure 4.
Comparison of the simulation between this study and the reference: (a) average temperature; (b) average reaction extent [16].
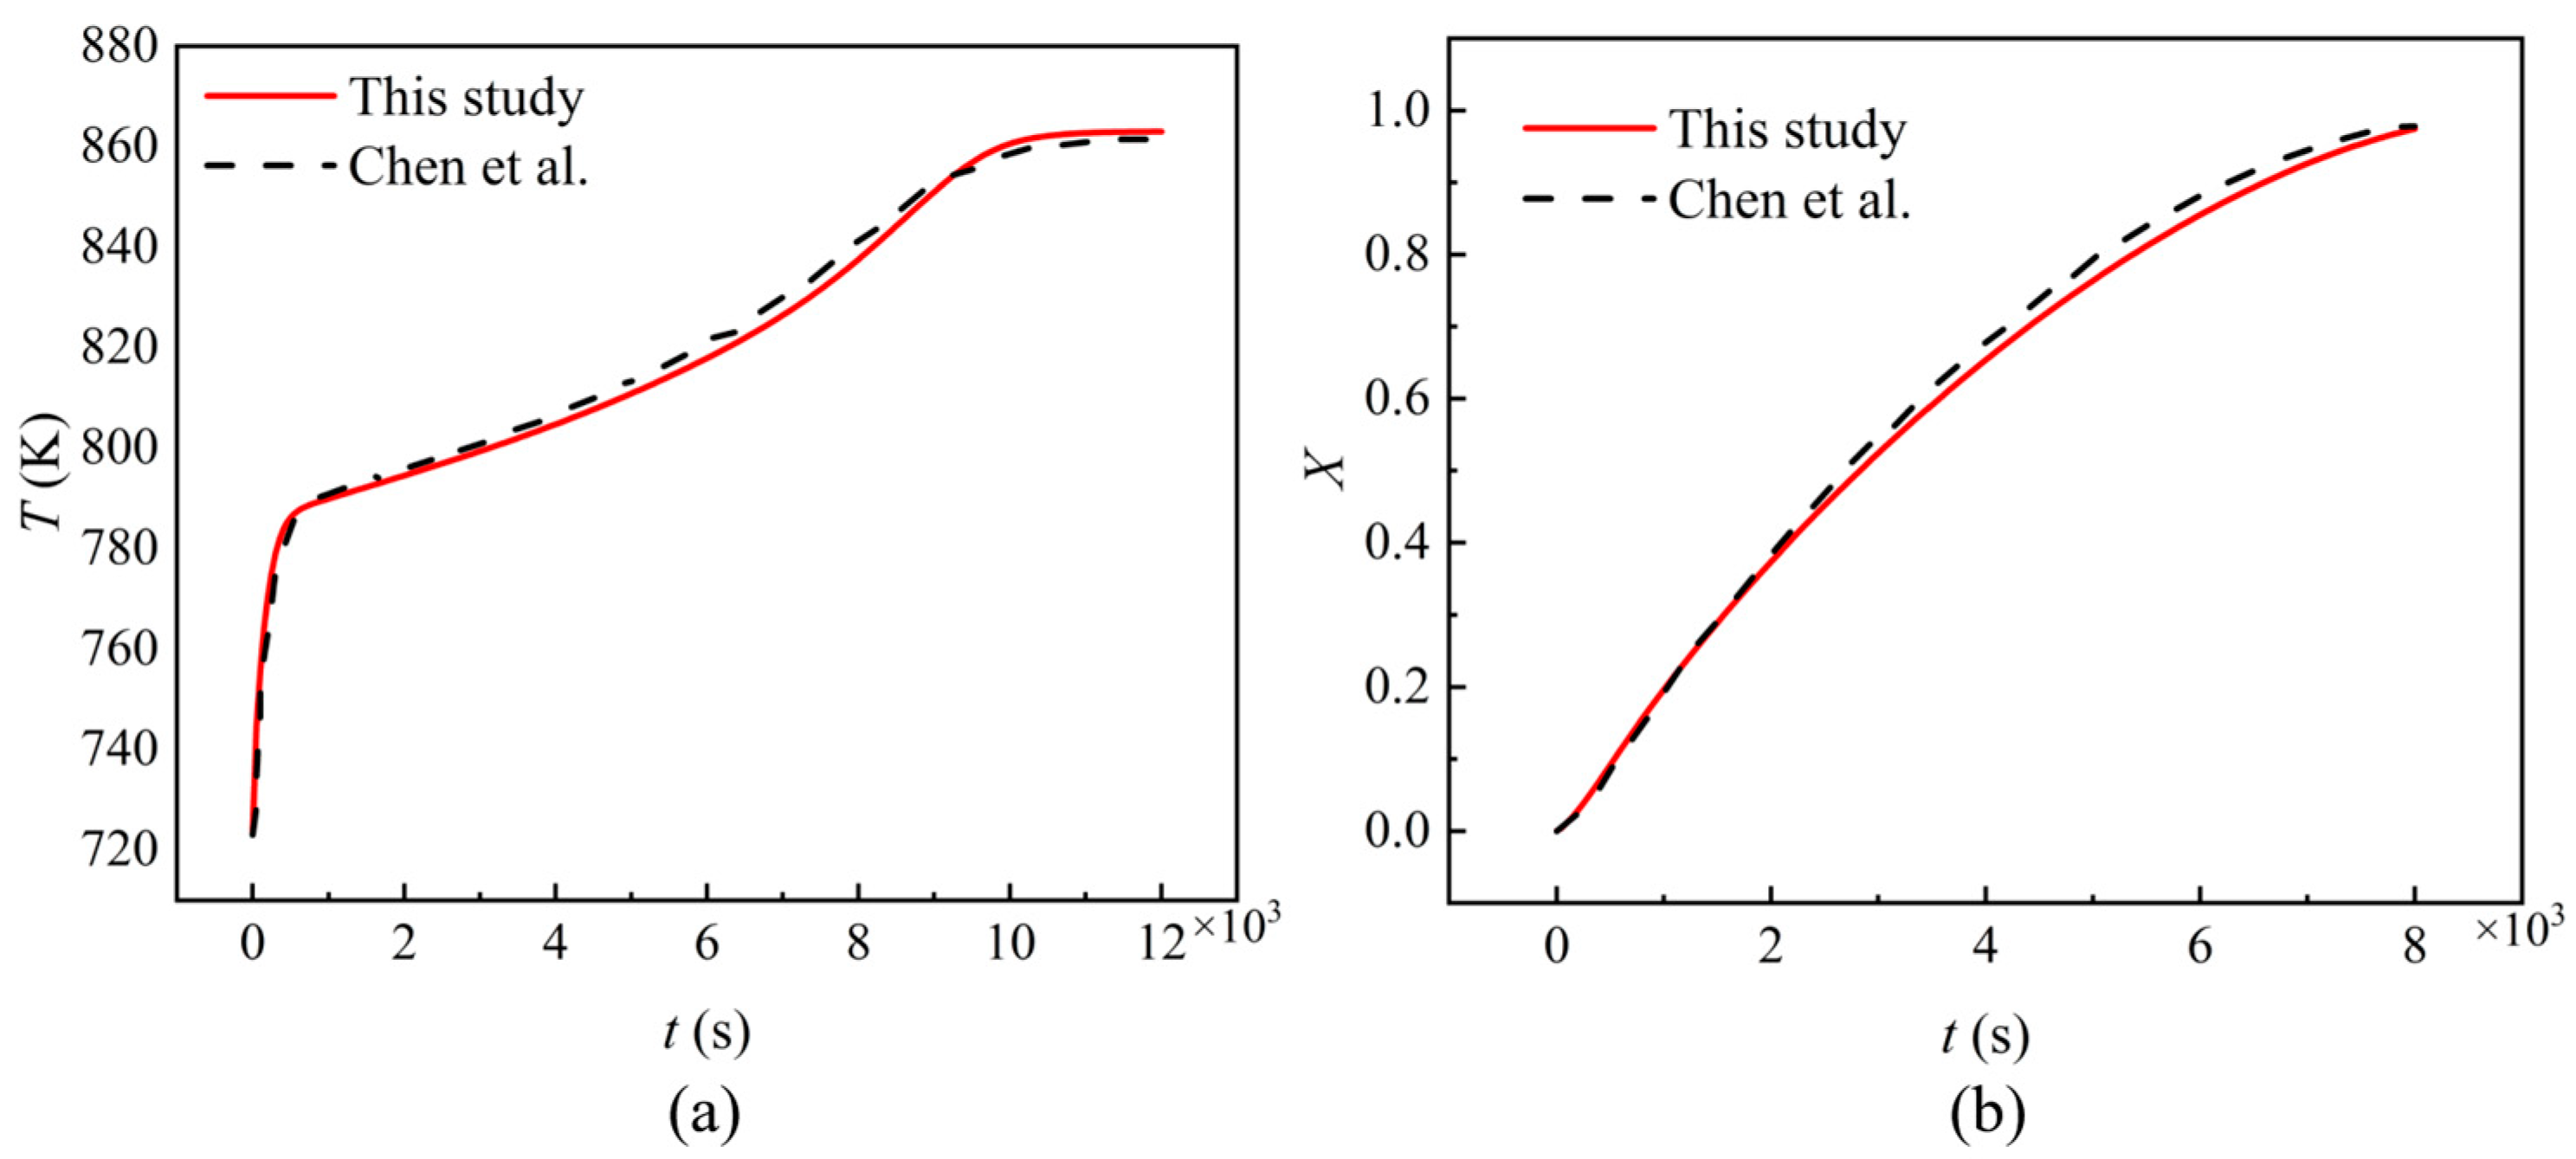
Figure 5.
Effects of Ntube = 2 on heat storage: (a) average reaction time; (b) average reaction extent; (c) average temperature; (d) average reactant concentration.
Figure 5.
Effects of Ntube = 2 on heat storage: (a) average reaction time; (b) average reaction extent; (c) average temperature; (d) average reactant concentration.
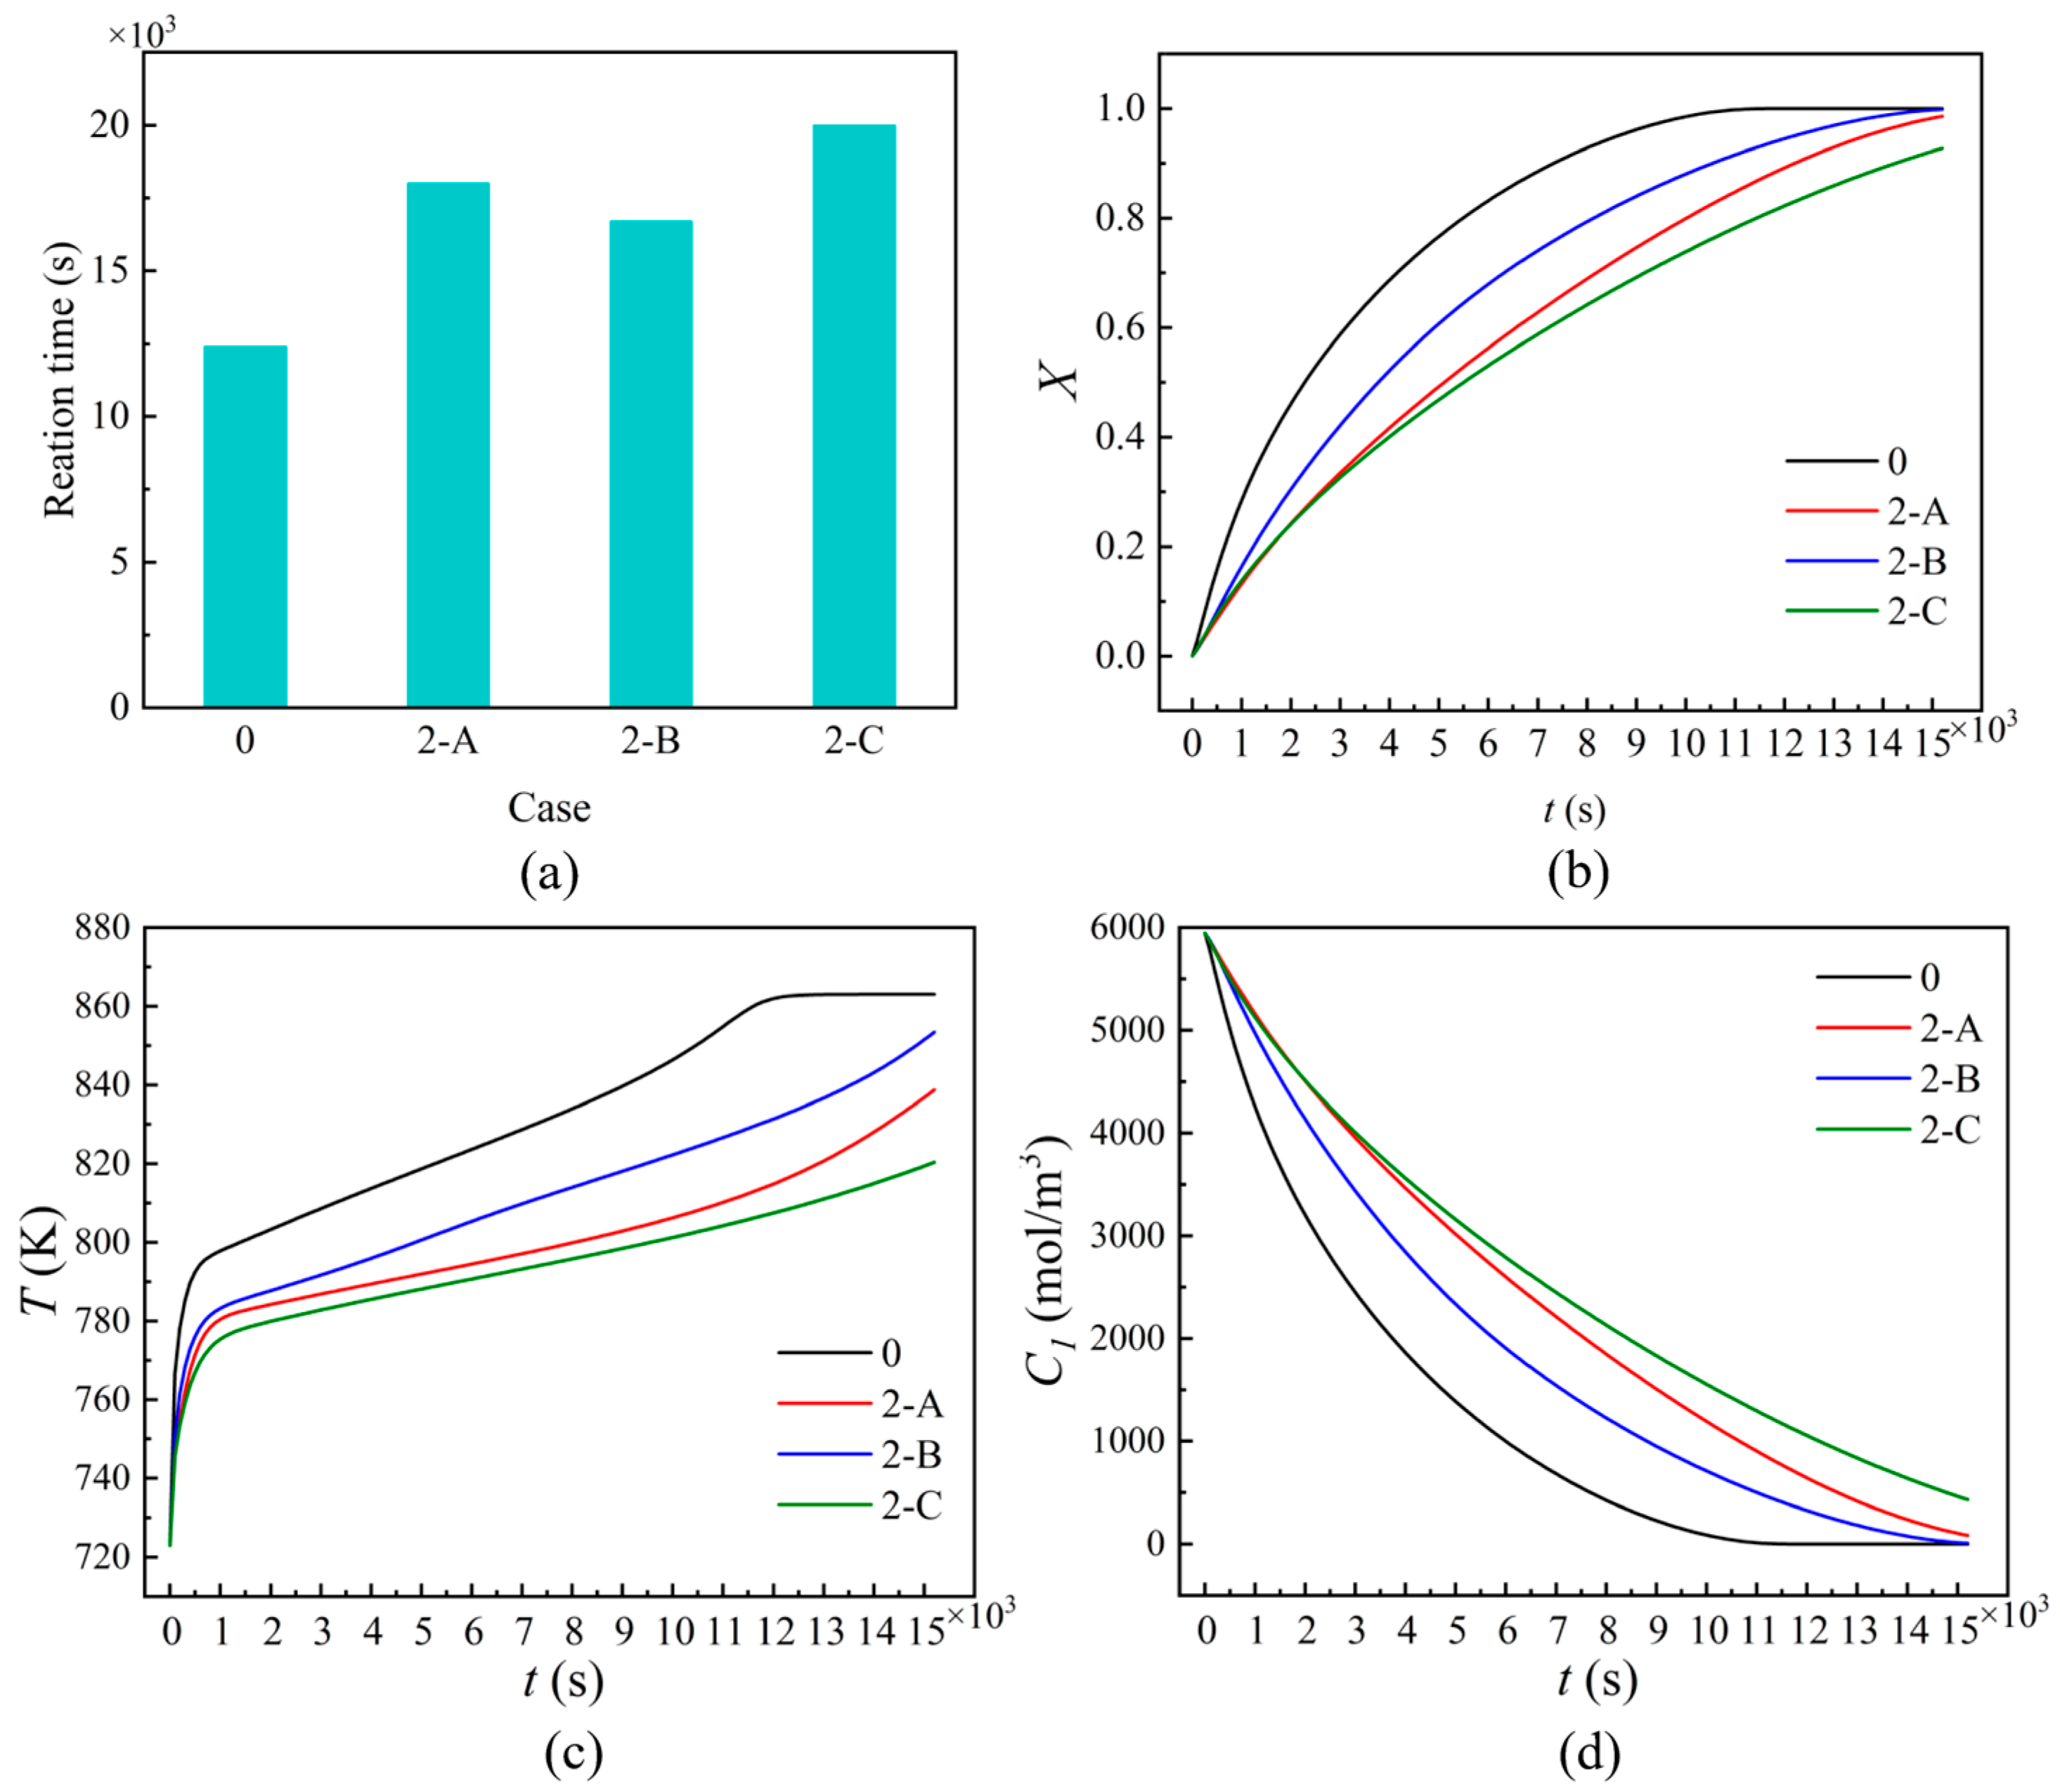
Figure 6.
Effects of Ntube = 4 on heat storage: (a) average reaction time; (b) average reaction extent; (c) average temperature; (d) average reactant concentration.
Figure 6.
Effects of Ntube = 4 on heat storage: (a) average reaction time; (b) average reaction extent; (c) average temperature; (d) average reactant concentration.
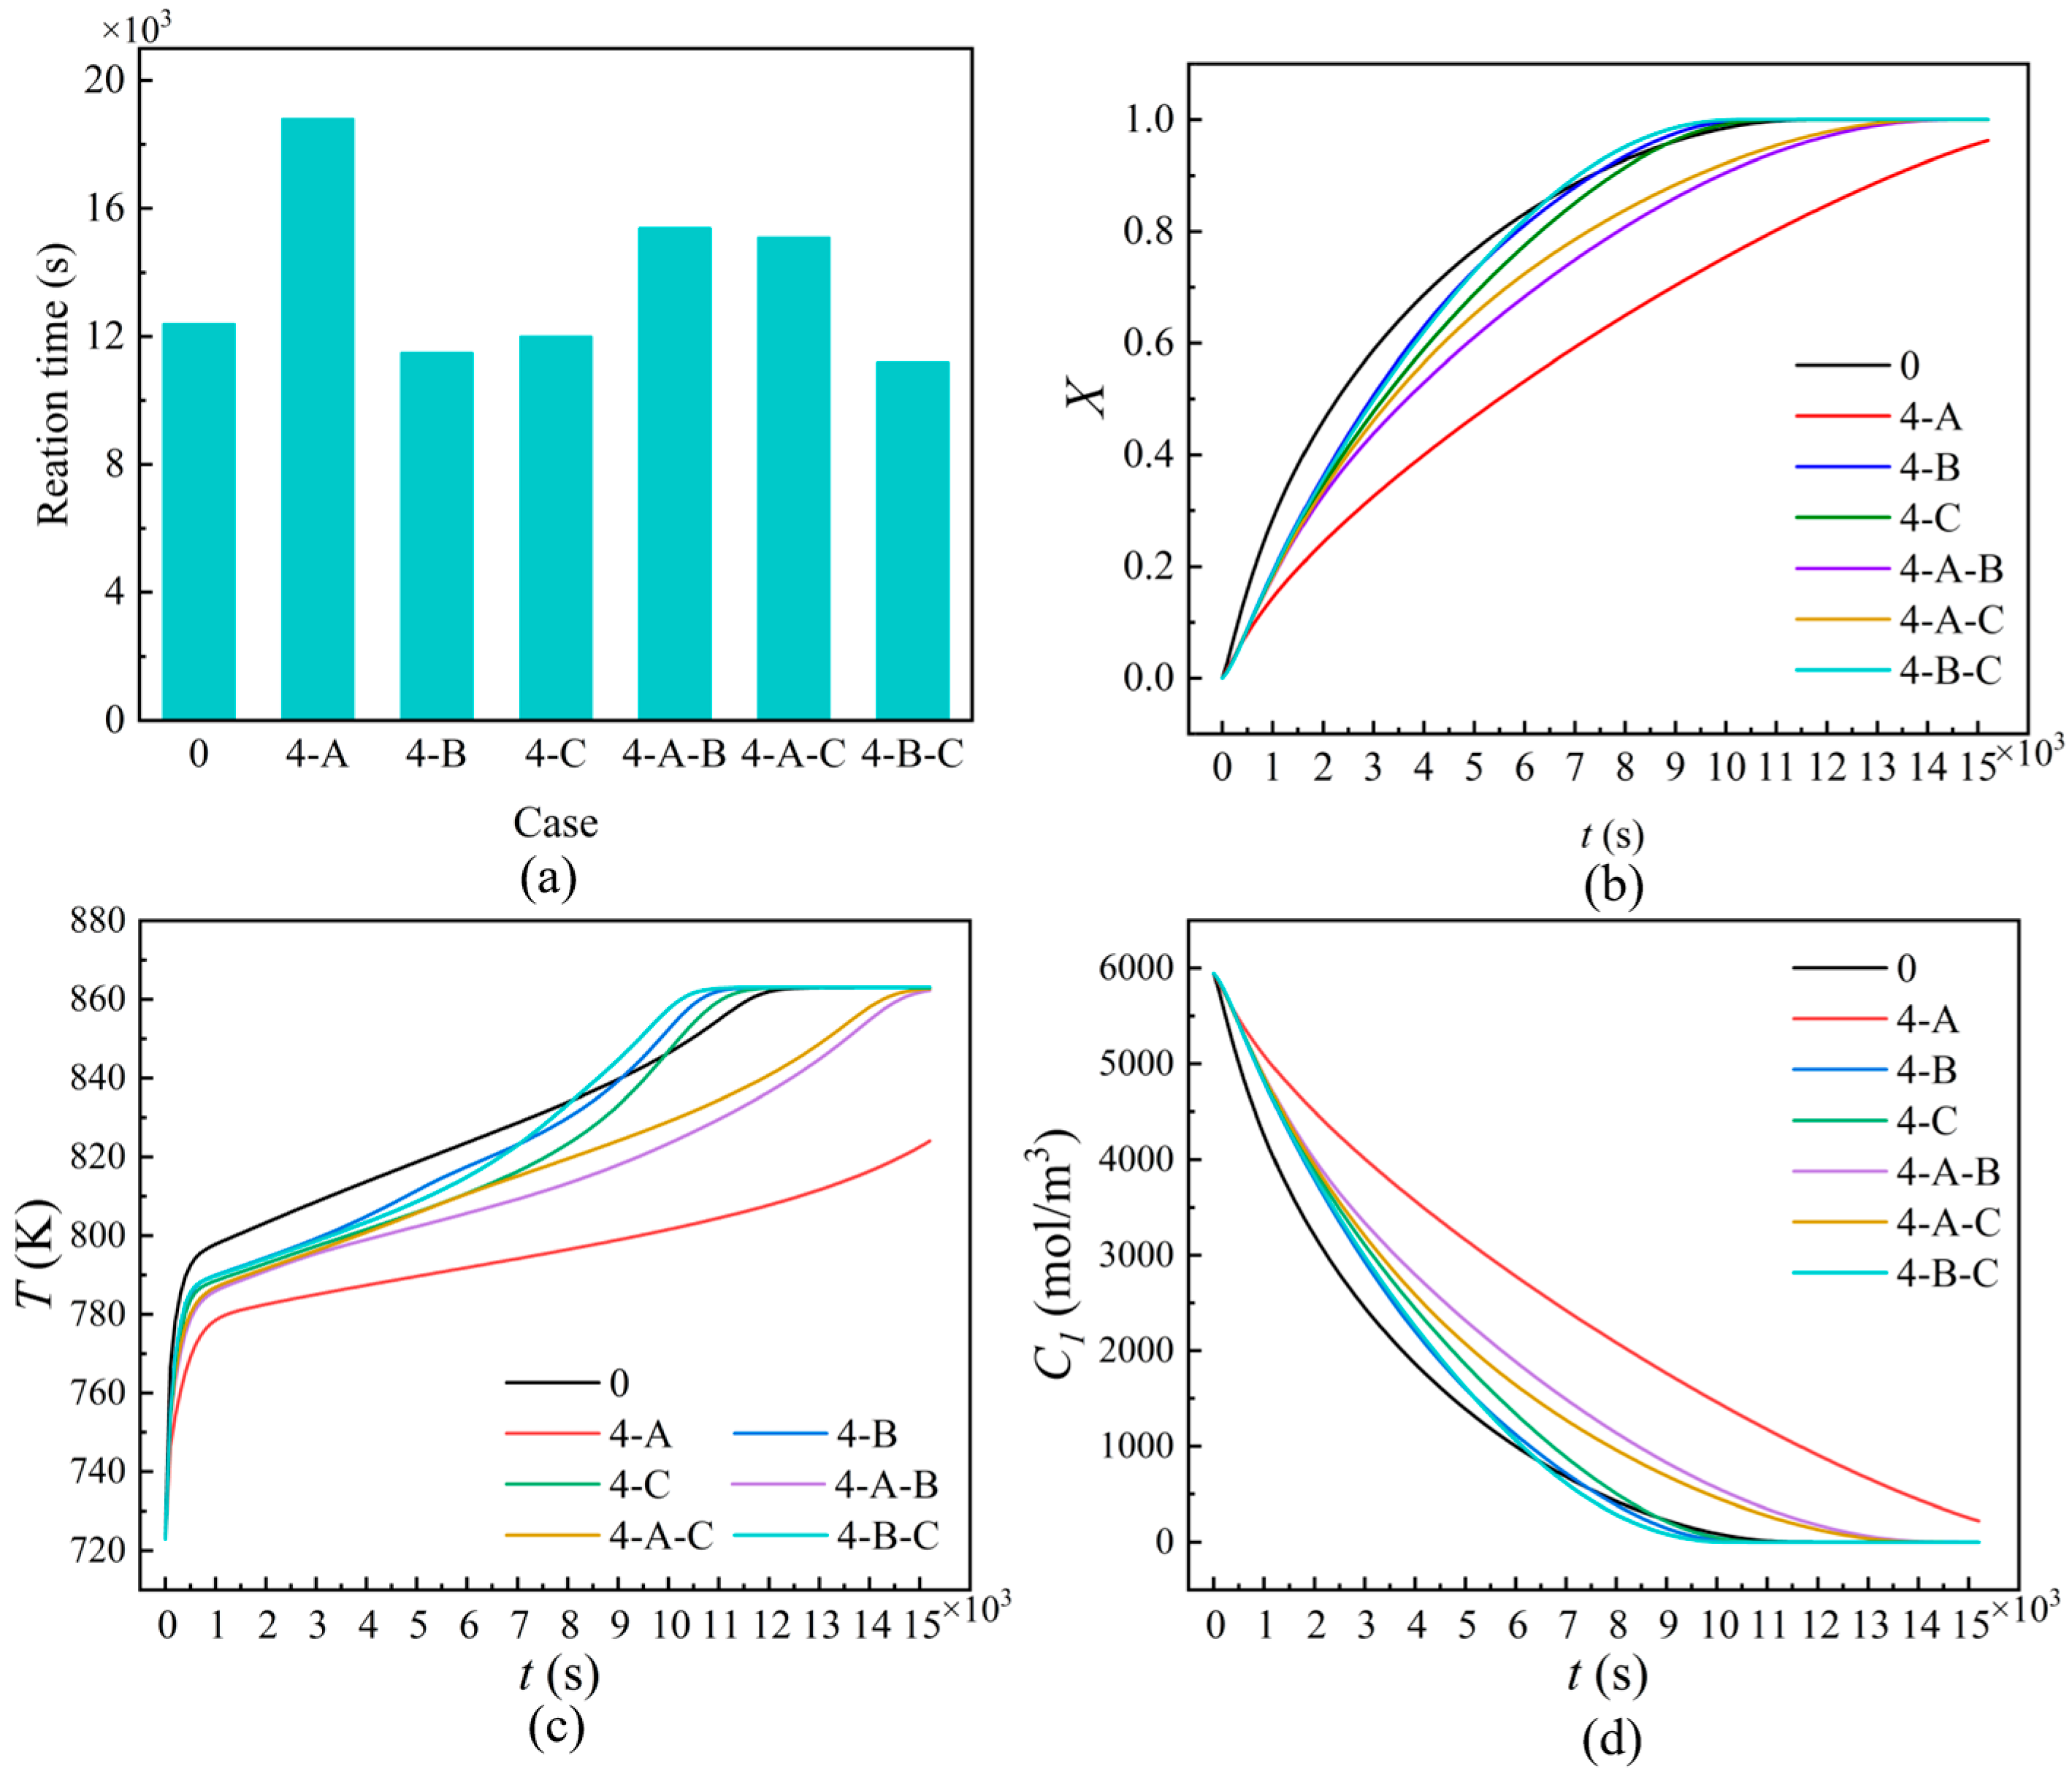
Figure 7.
Effects of Ntube = 6 on heat storage: (a) average reaction time; (b) average reaction extent; (c) average temperature; (d) average reactant concentration.
Figure 7.
Effects of Ntube = 6 on heat storage: (a) average reaction time; (b) average reaction extent; (c) average temperature; (d) average reactant concentration.

Figure 8.
Comparison of cases 0, 4-B-C, and 6-B-C: (a) average reaction extent; (b) average temperature; (c) average reactant concentration.
Figure 8.
Comparison of cases 0, 4-B-C, and 6-B-C: (a) average reaction extent; (b) average temperature; (c) average reactant concentration.
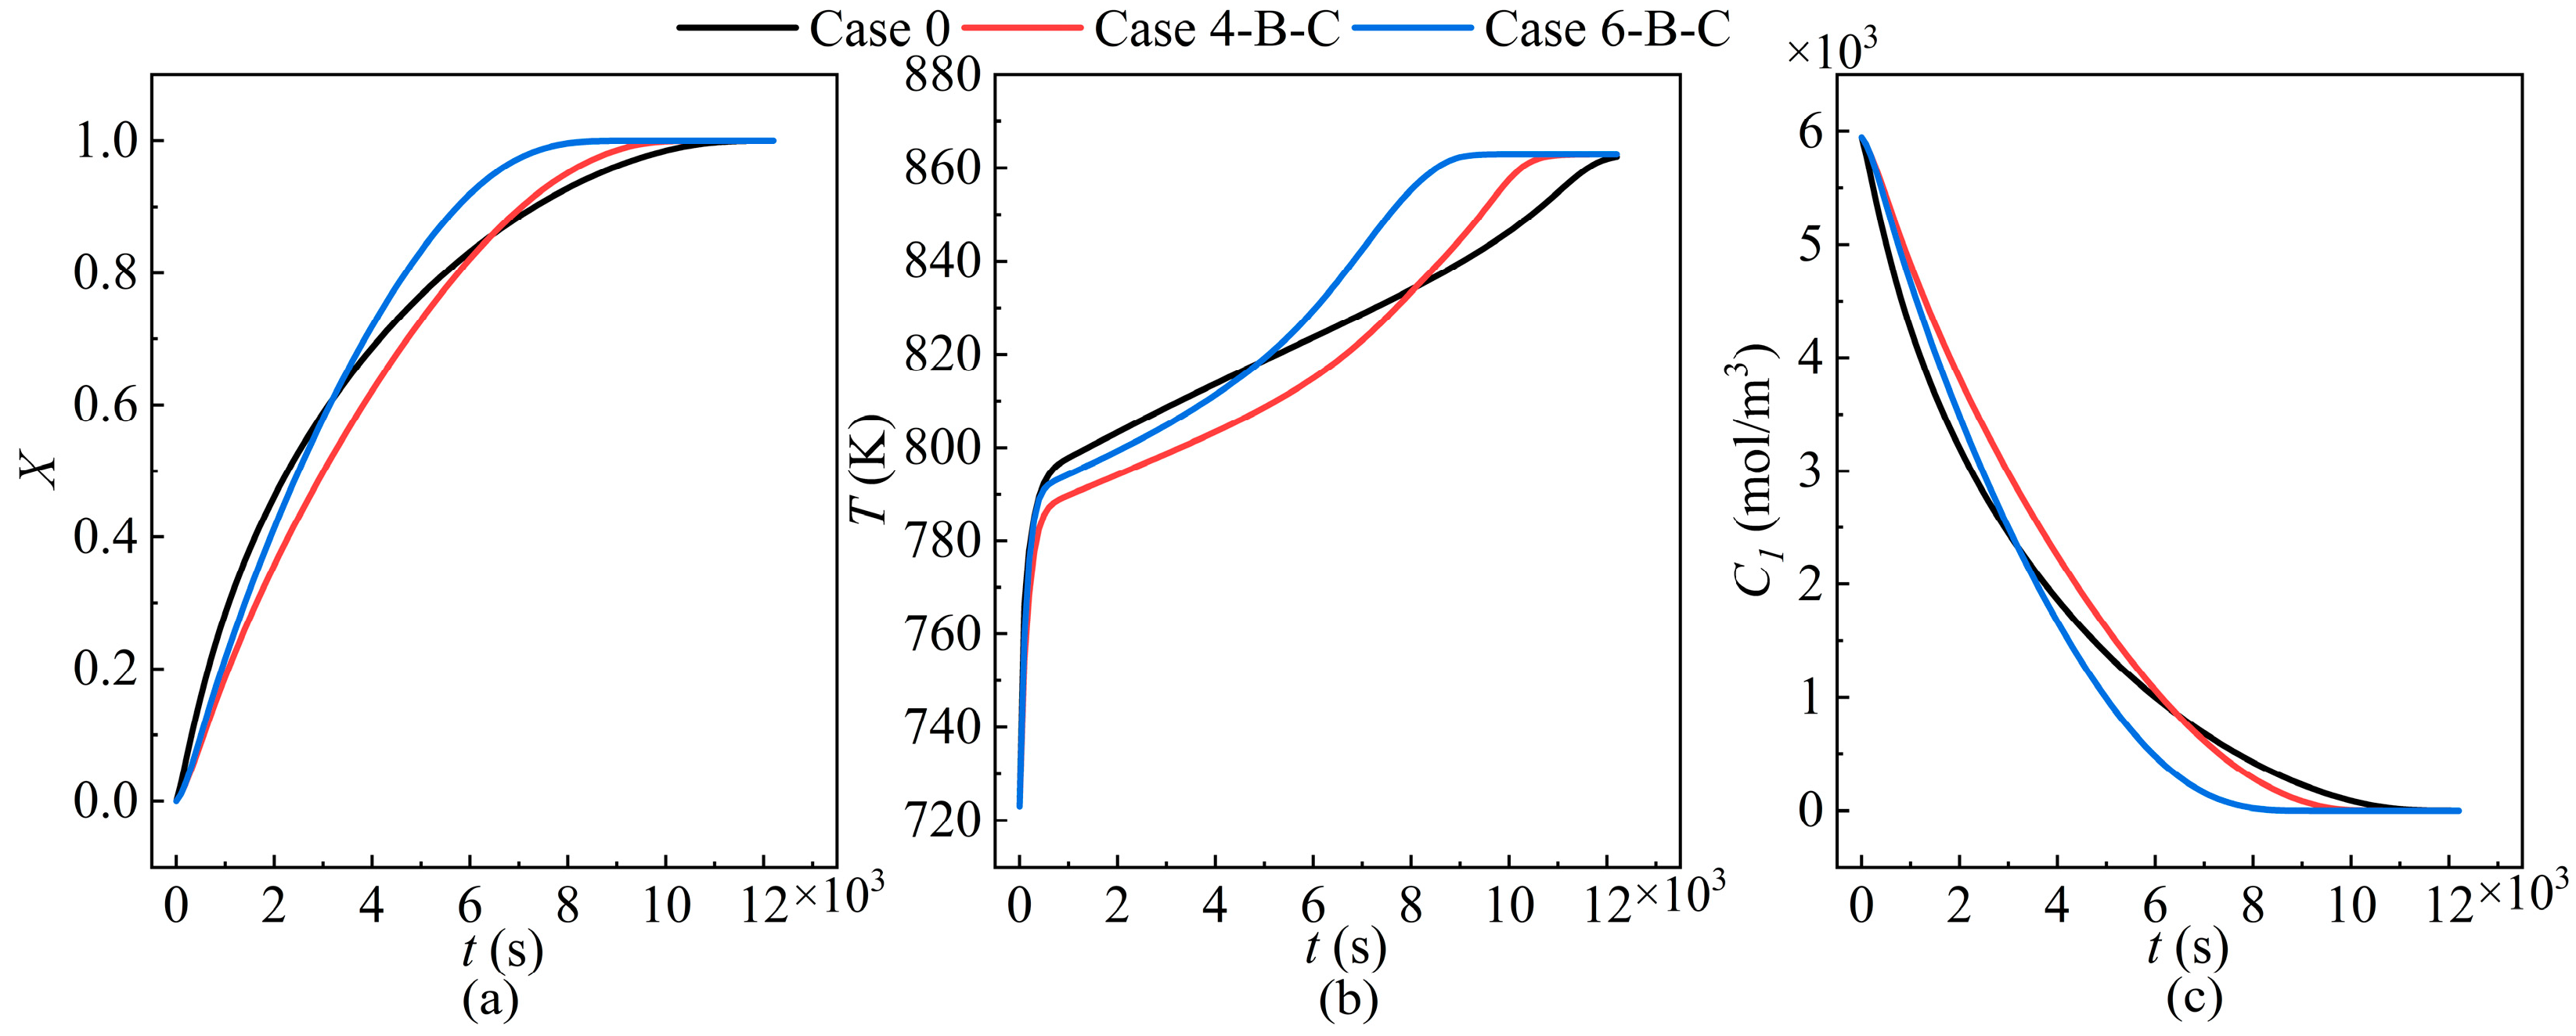
Figure 9.
Temperature distribution of cases 0 and 6-B-C.
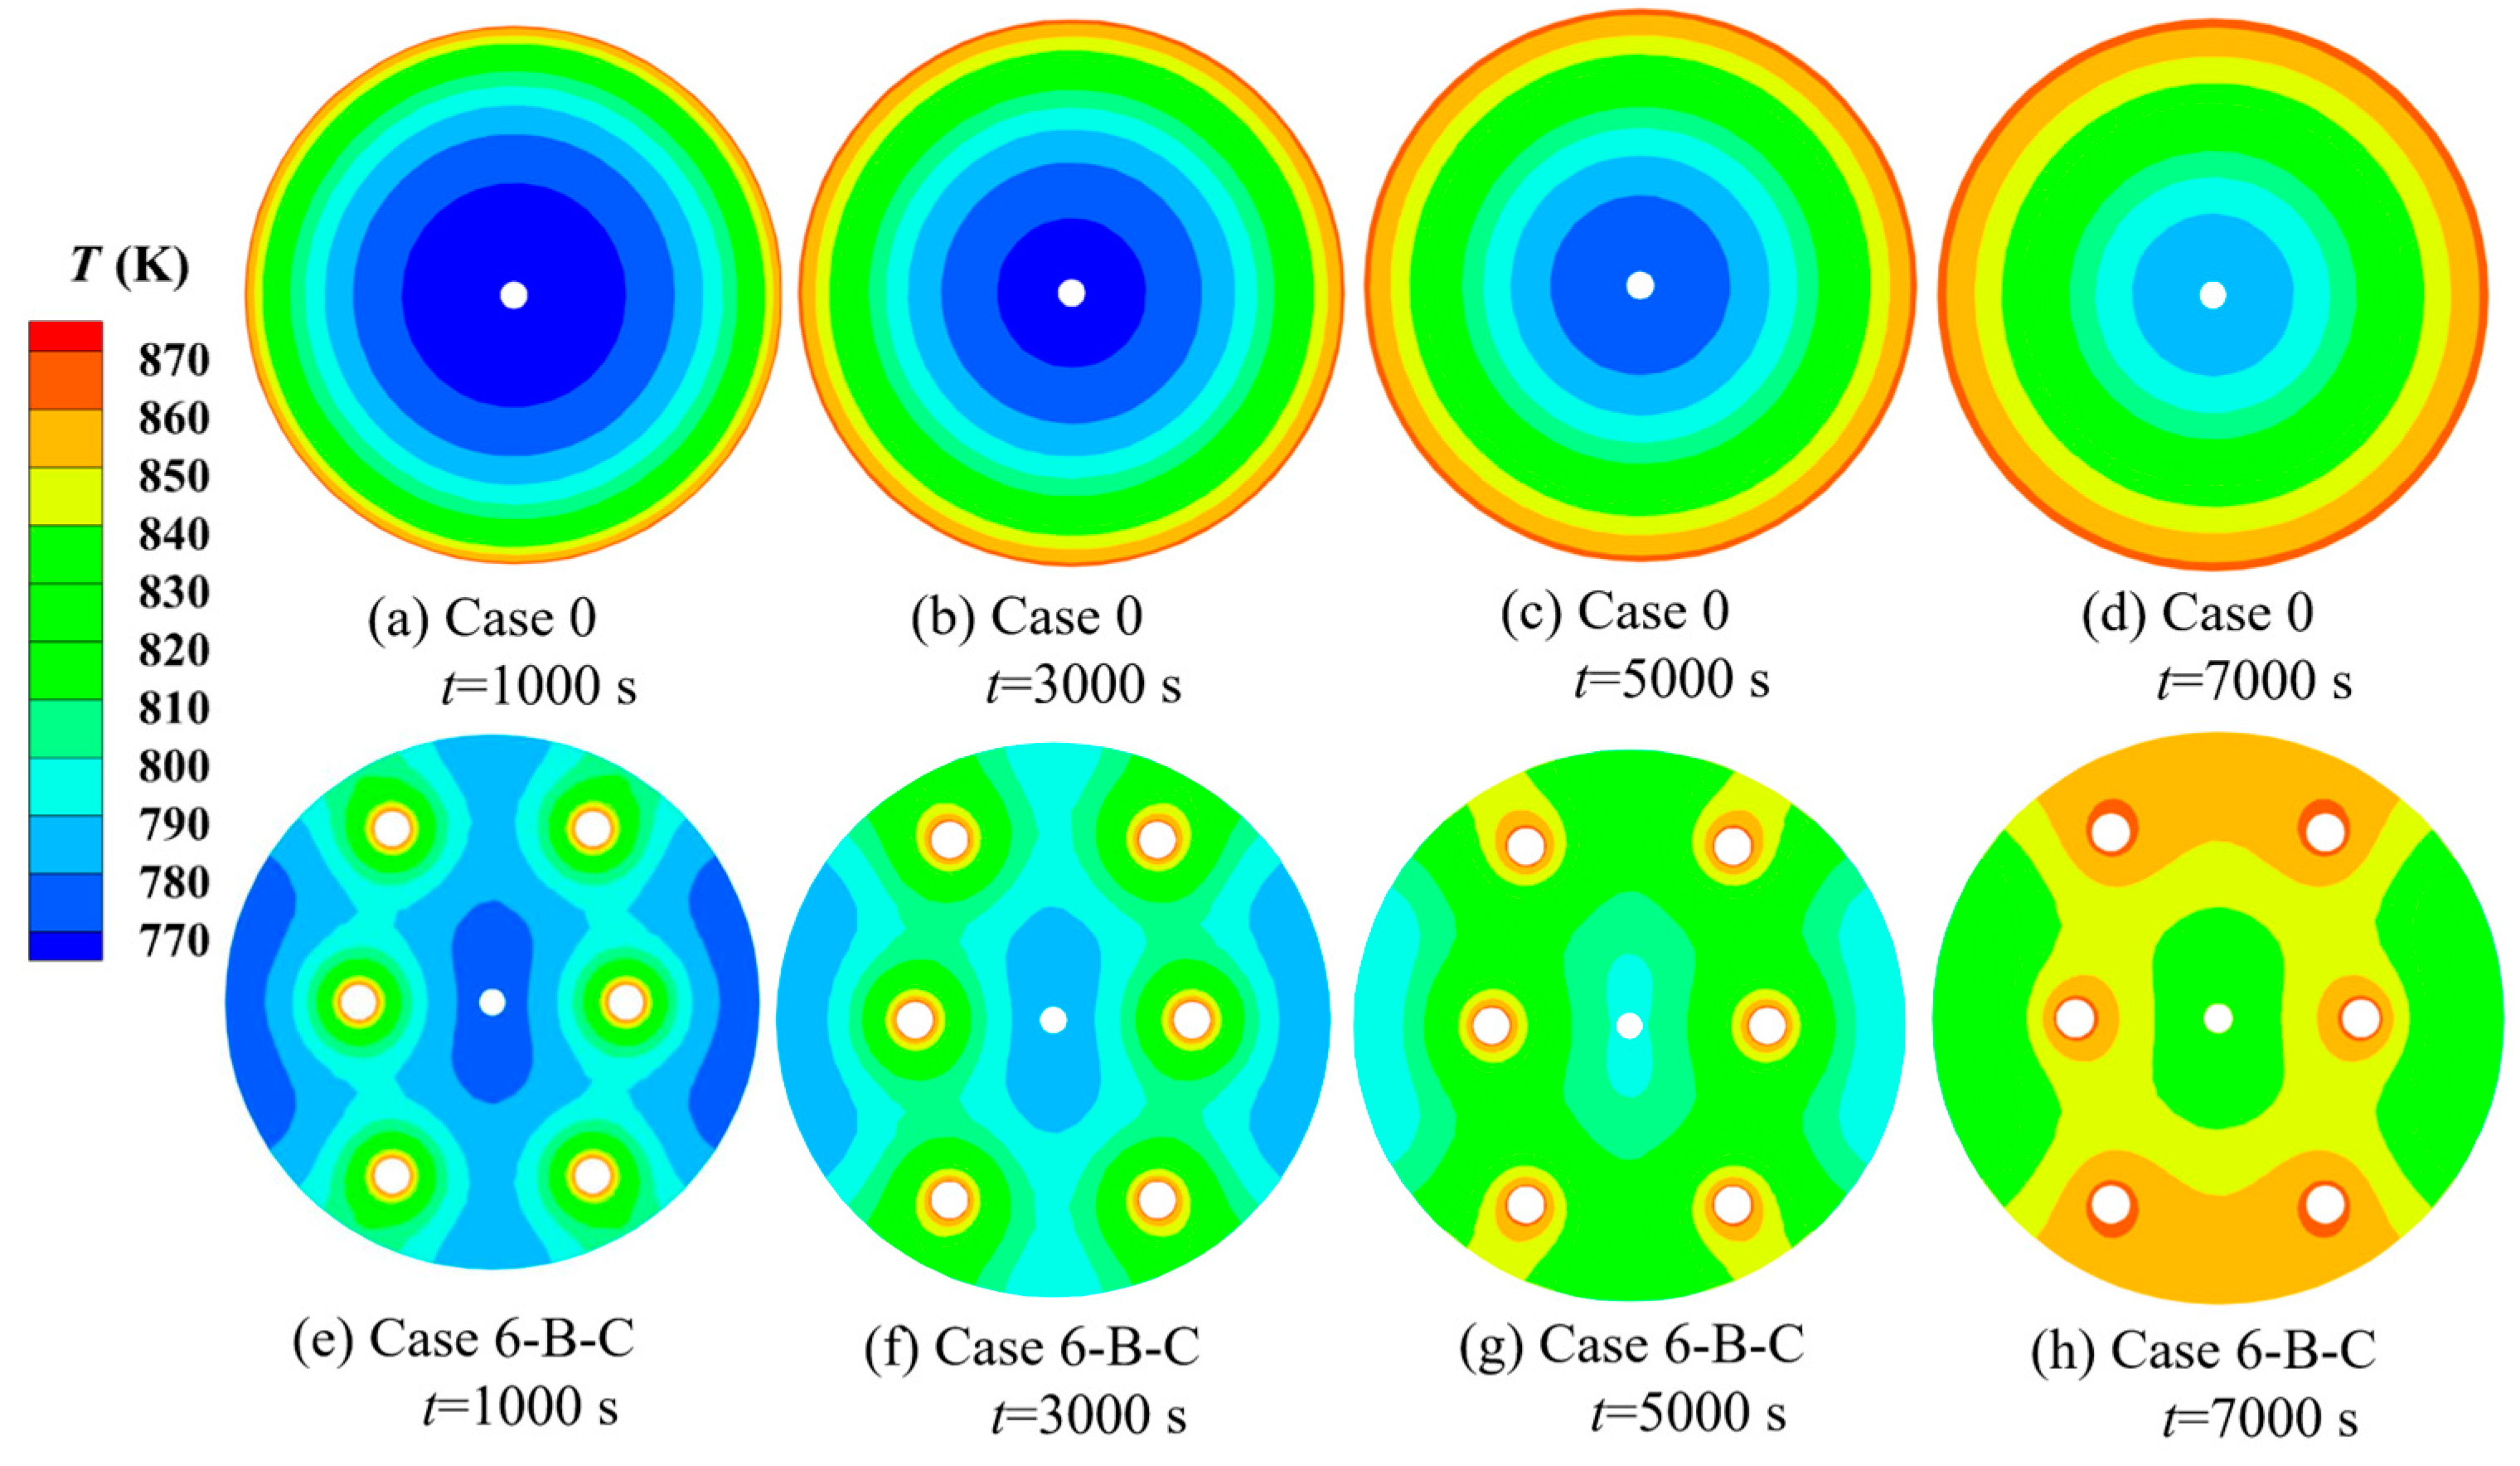
Figure 10.
Reaction extent distribution of cases 0 and 6-B-C.
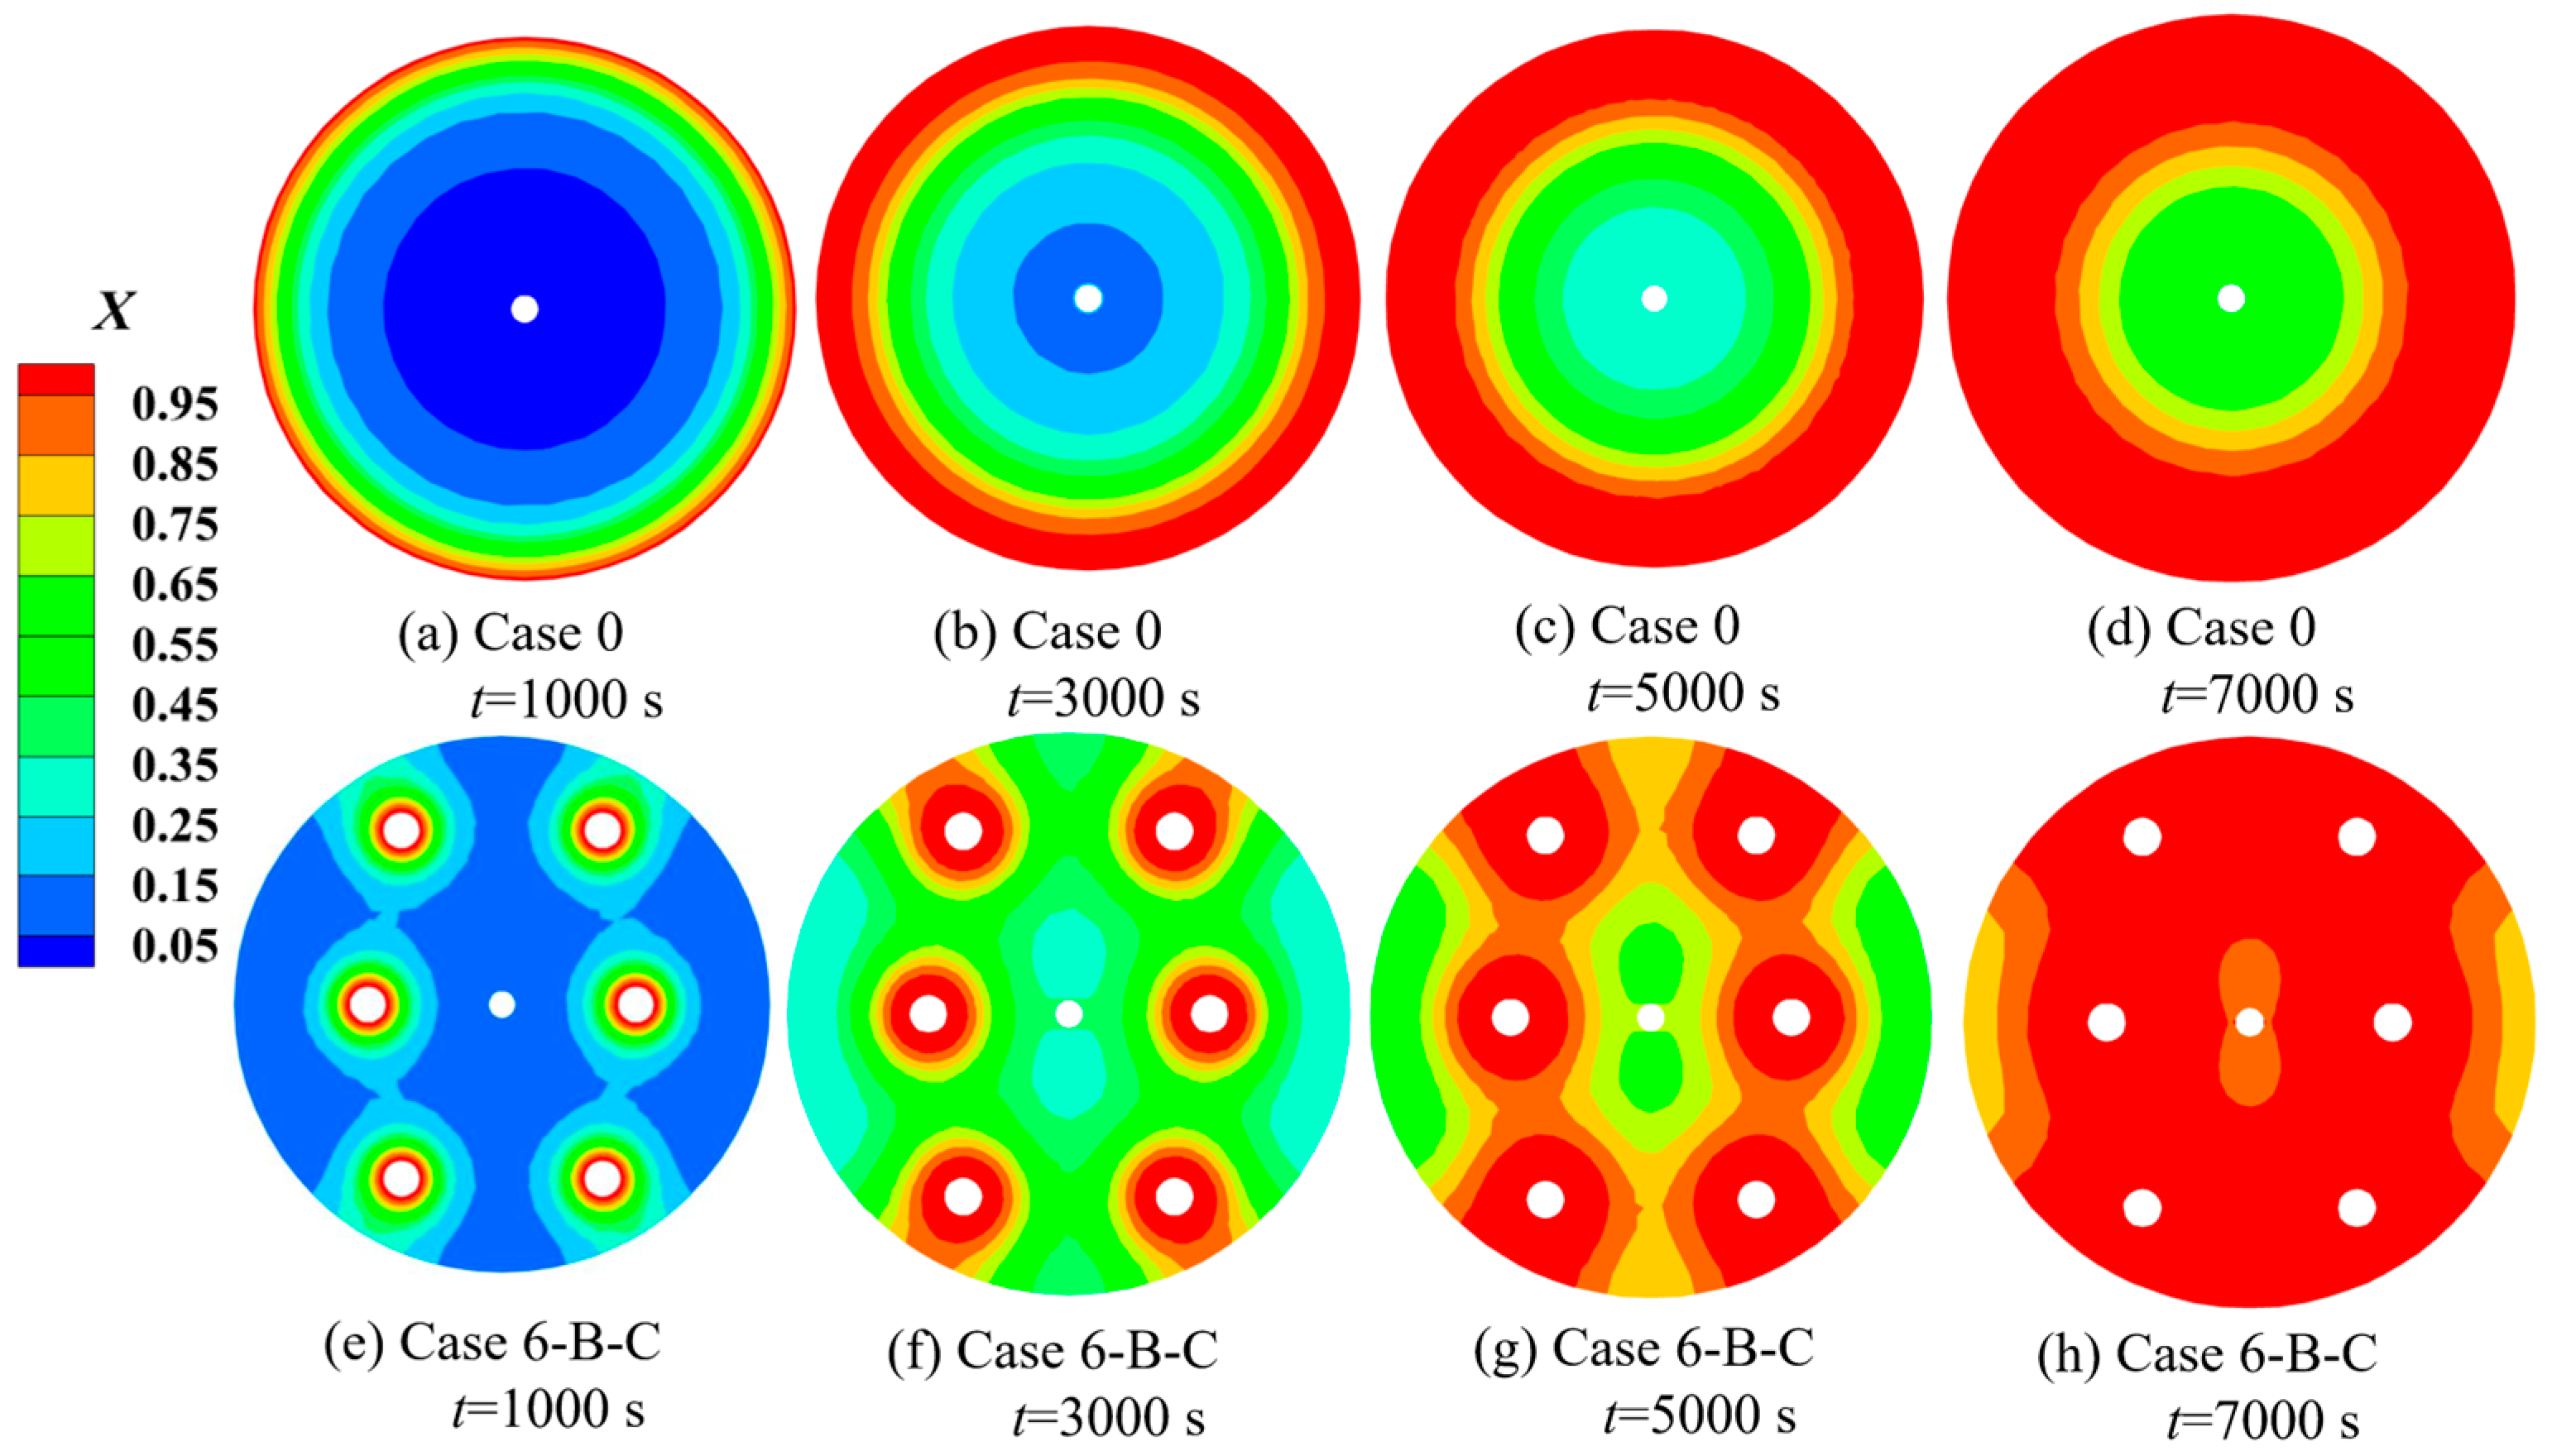
Figure 11.
Effects of porosity: (a) reaction time and volumetric energy storage rate; (b) average pressure.
Figure 11.
Effects of porosity: (a) reaction time and volumetric energy storage rate; (b) average pressure.
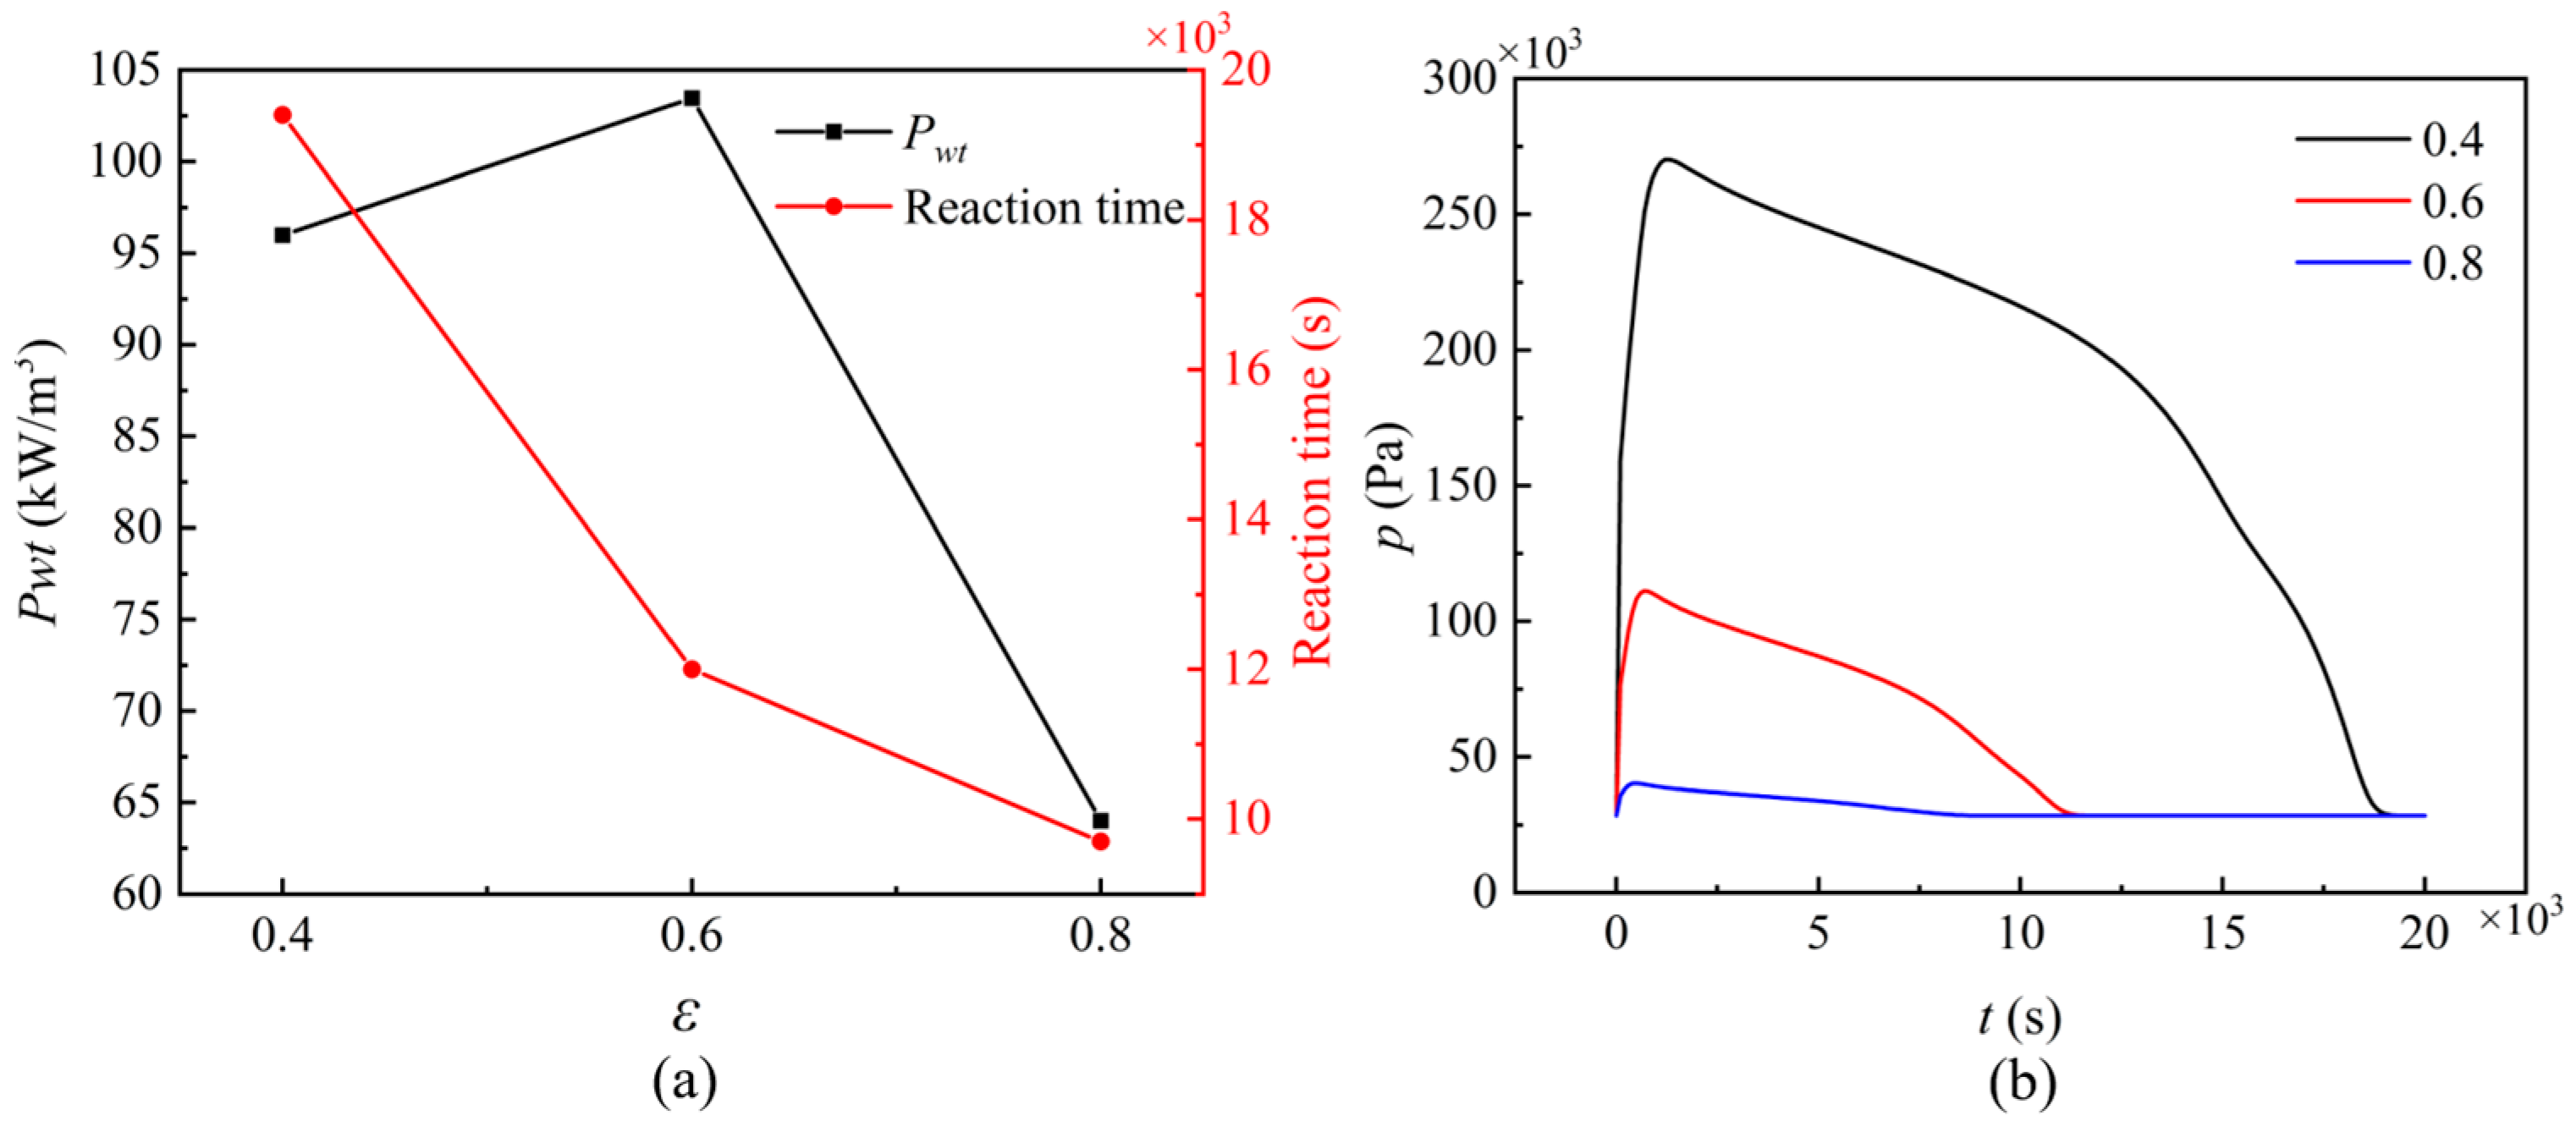
Figure 12.
Effects of wall temperature: (a) average reaction extent; (b) average temperature.
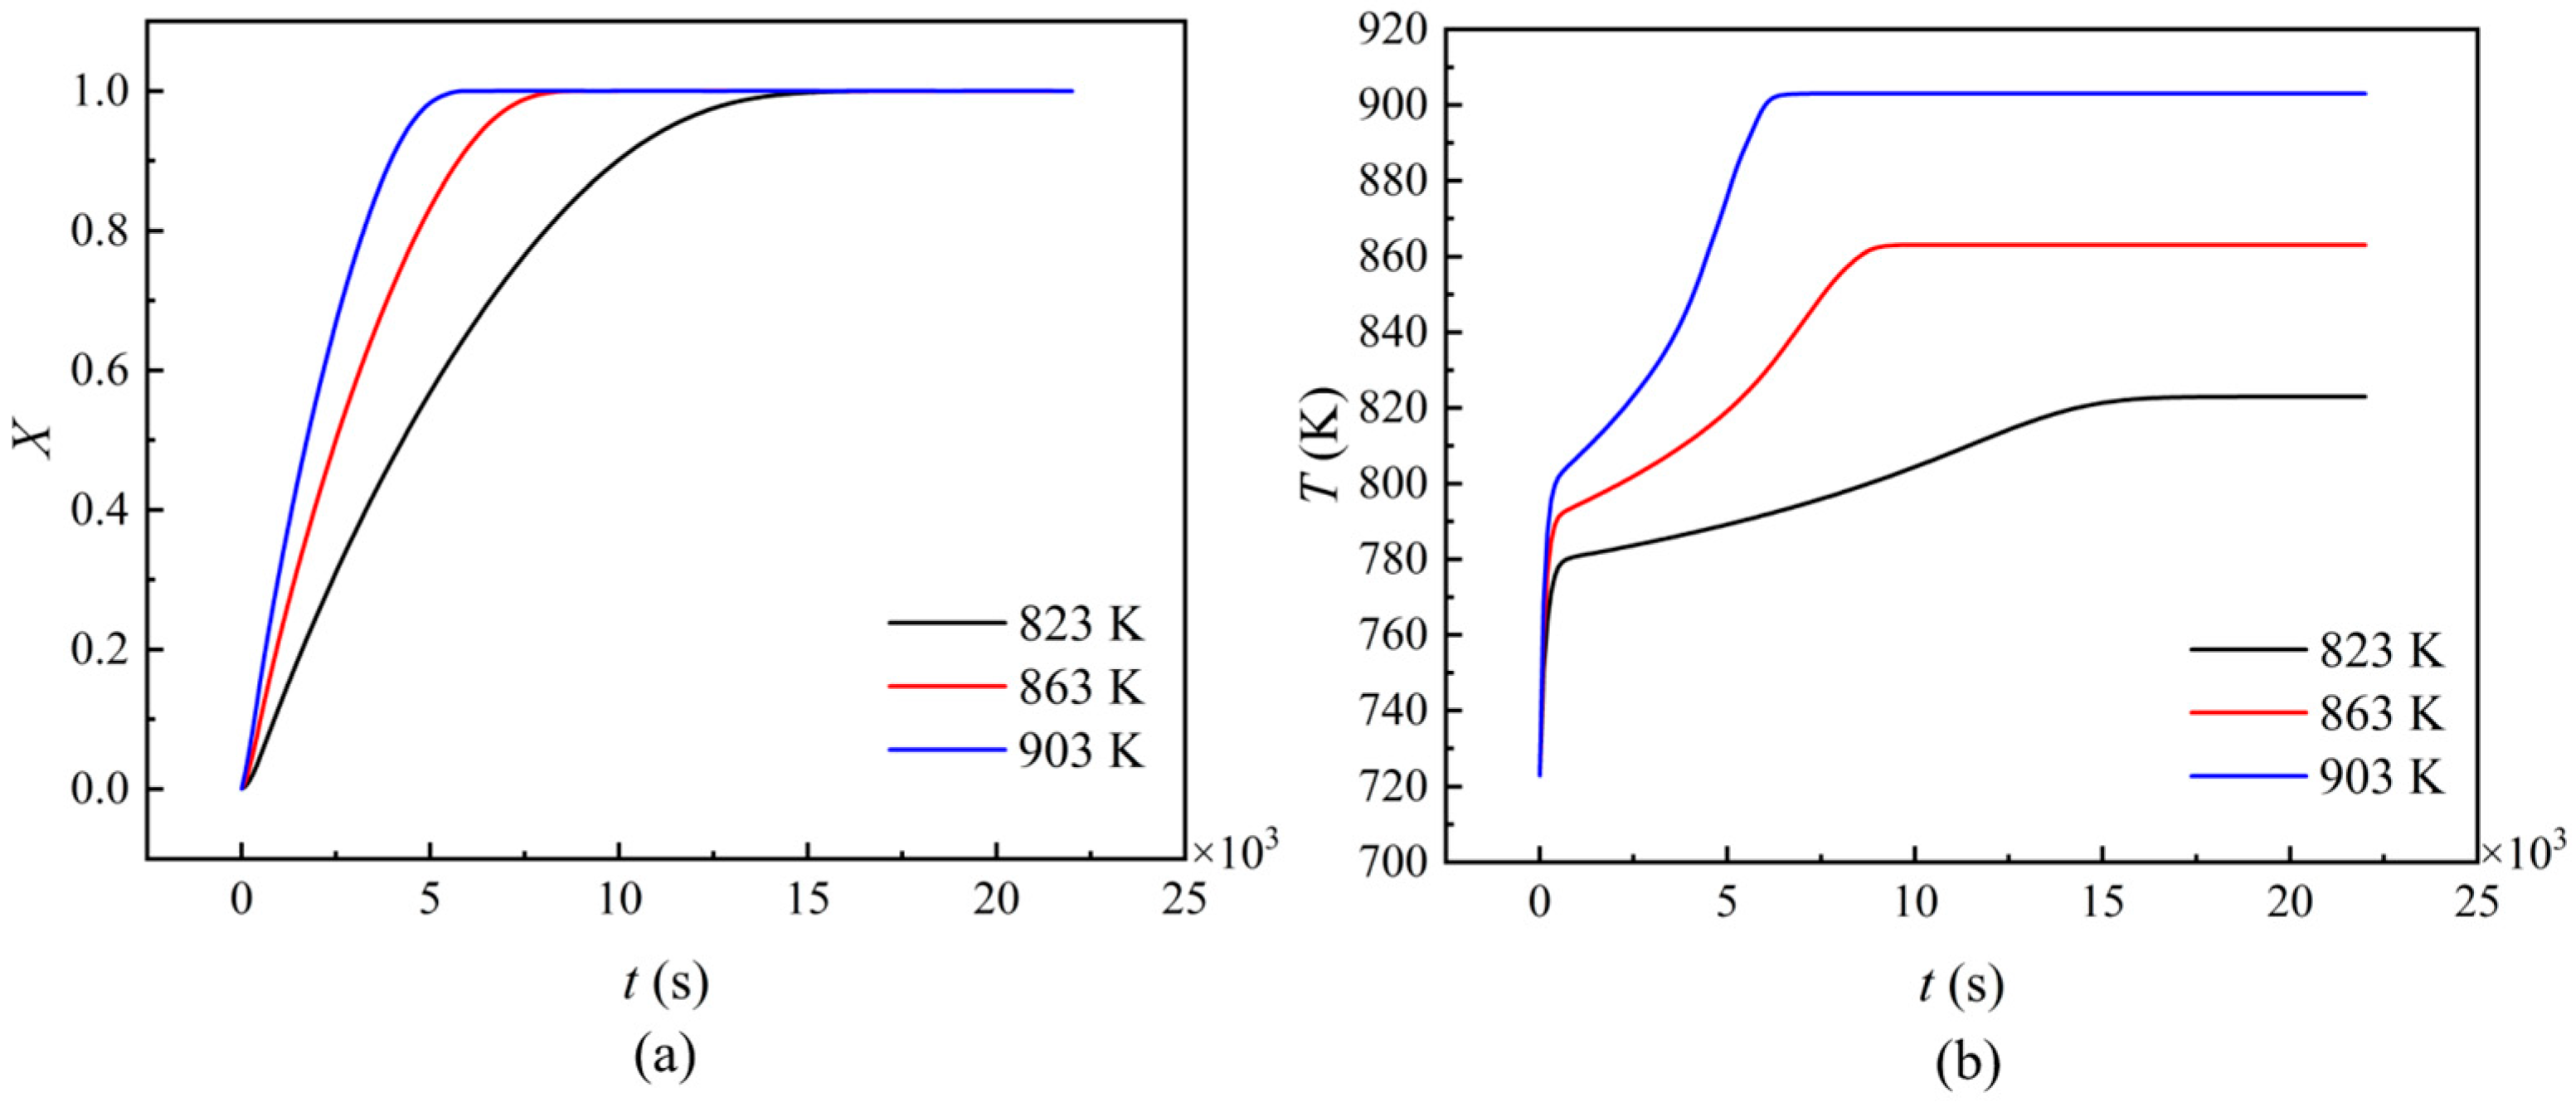
Figure 13.
Effects of outlet temperature: (a) reaction time; (b) average pressure.

Figure 14.
Pressure distribution when t = 100 s: (a) Pout = 1000 Pa; (b) Pout = 28,415 Pa.
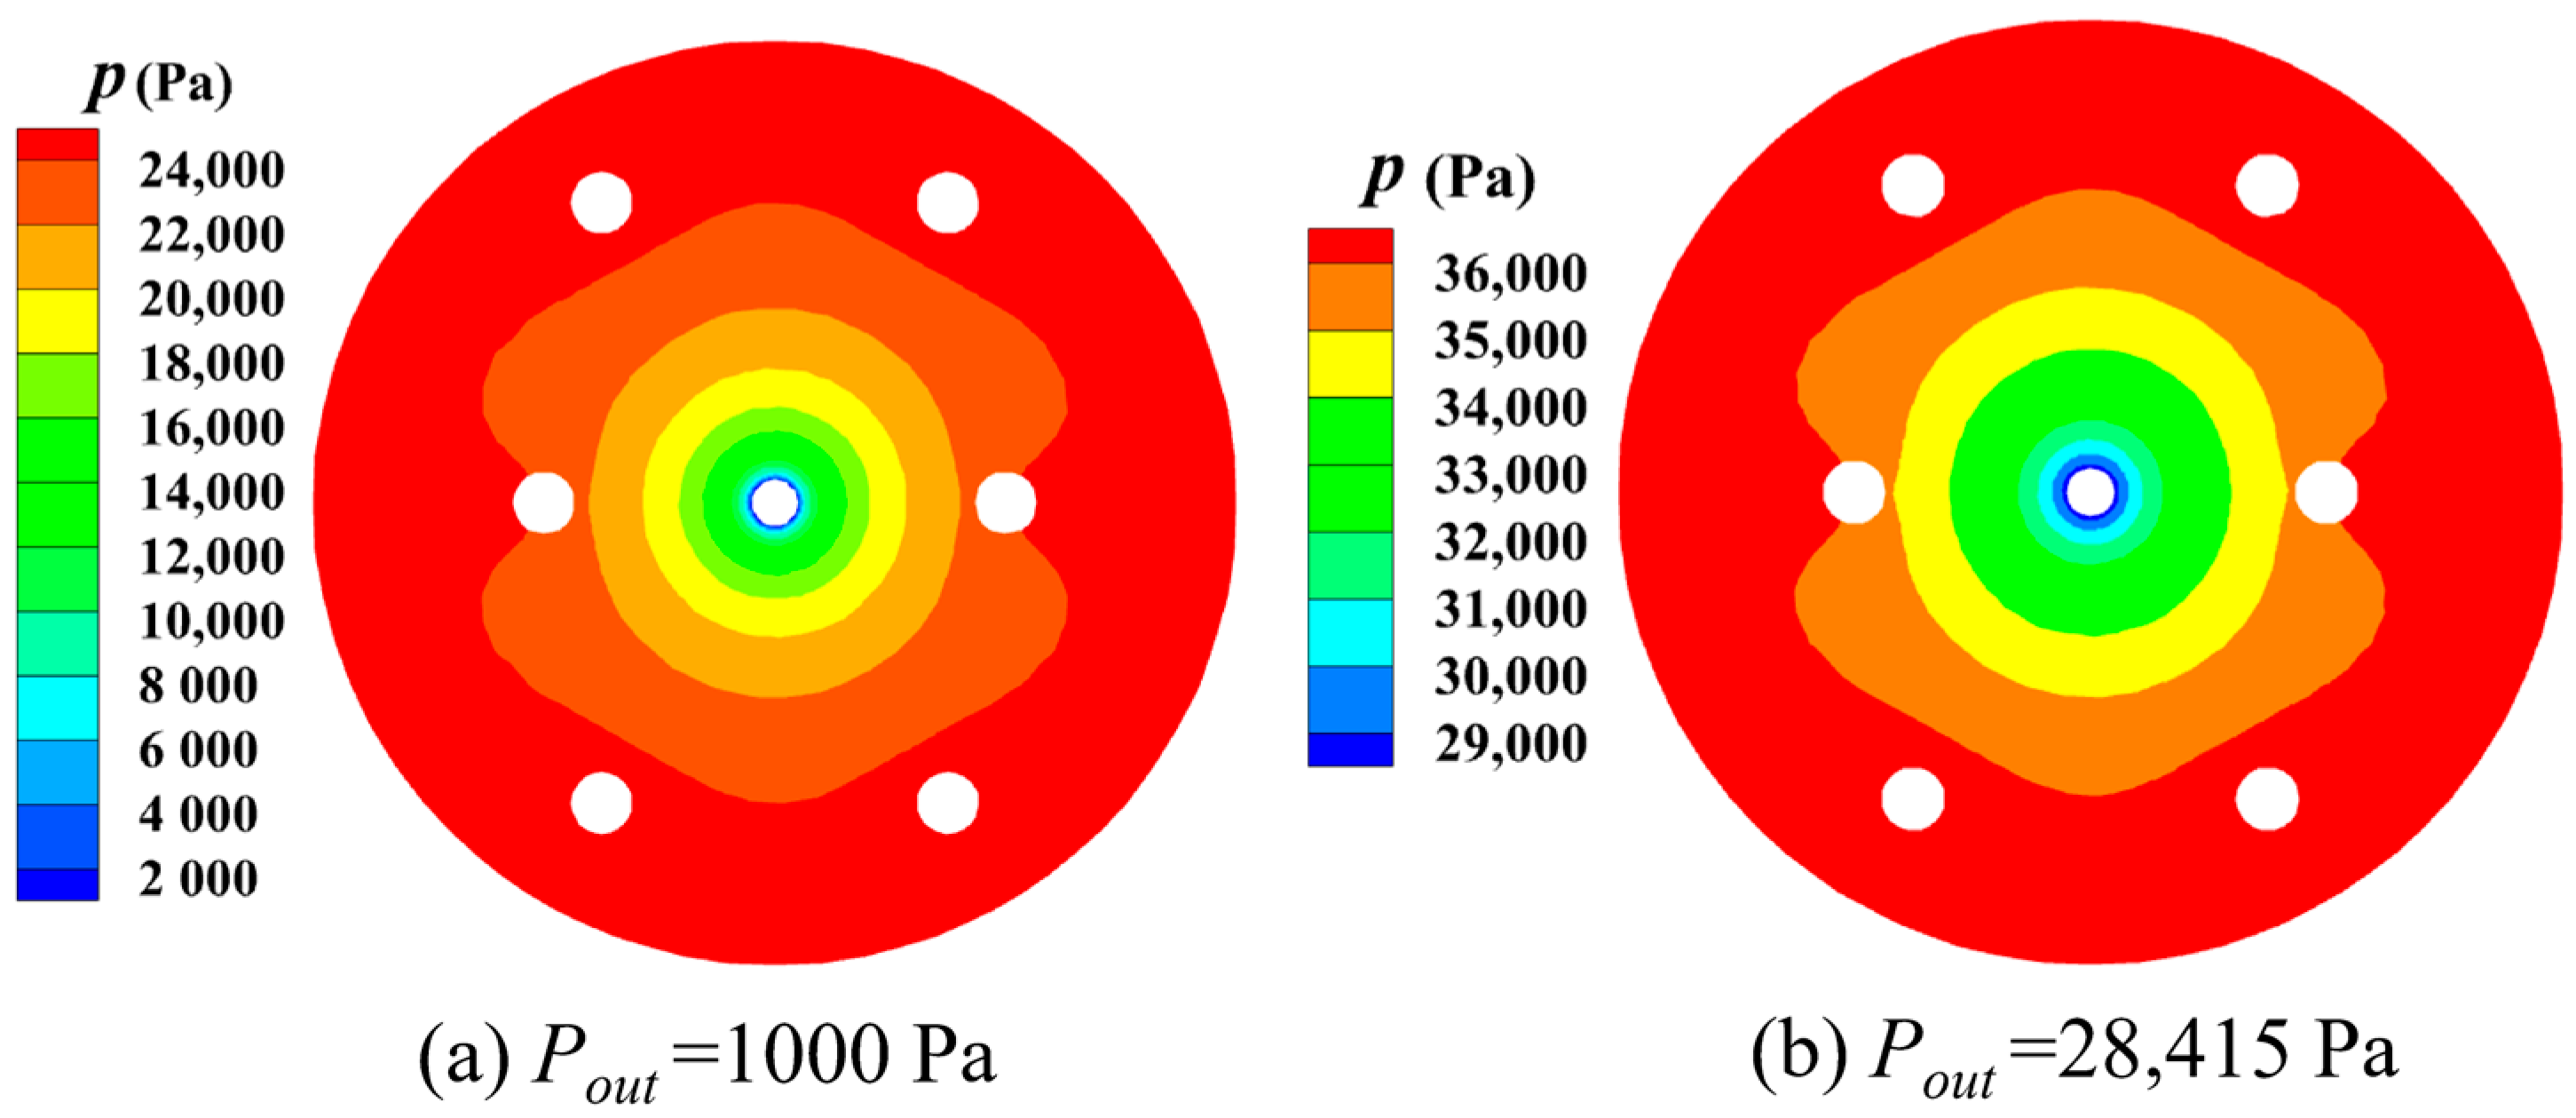
Figure 15.
Effects of particle size: (a) reaction time; (b) average pressure.

Table 1.
Cases in this study.
| Cases | Ntube | d1 (mm) | d2 (mm) | Cases | Ntube | d1 (mm) | d2 (mm) |
|---|---|---|---|---|---|---|---|
| 0 | 0 | – | – | 6-A | 6 | 12.5 | 12.5 |
| 2-A | 2 | 12.5 | – | 6-B | 25 | 25 | |
| 2-B | 25 | – | 6-C | 37.5 | 37.5 | ||
| 2-C | 37.5 | – | 6-A-B | 12.5 | 25 | ||
| 4-A | 4 | 12.5 | 12.5 | 6-A-C | 12.5 | 37.5 | |
| 4-B | 25 | 25 | 6-B-A | 25 | 12.5 | ||
| 4-C | 37.5 | 37.5 | 6-B-C | 25 | 37.5 | ||
| 4-A-B | 12.5 | 25 | 6-C-A | 37.5 | 12.5 | ||
| 4-A-C | 12.5 | 37.5 | 6-C-B | 37.5 | 25 | ||
| 4-B-C | 25 | 37.5 |
Disclaimer/Publisher’s Note: The statements, opinions and data contained in all publications are solely those of the individual author(s) and contributor(s) and not of MDPI and/or the editor(s). MDPI and/or the editor(s) disclaim responsibility for any injury to people or property resulting from any ideas, methods, instructions or products referred to in the content. |
© 2023 by the authors. Licensee MDPI, Basel, Switzerland. This article is an open access article distributed under the terms and conditions of the Creative Commons Attribution (CC BY) license (https://creativecommons.org/licenses/by/4.0/).
Share and Cite
MDPI and ACS Style
Yan, J.; Jiang, L.; Zhao, C. Numerical Simulation of the Ca(OH)2/CaO Thermochemical Heat Storage Process in an Internal Heating Fixed-Bed Reactor. Sustainability 2023, 15, 7141. https://doi.org/10.3390/su15097141
AMA Style
Yan J, Jiang L, Zhao C. Numerical Simulation of the Ca(OH)2/CaO Thermochemical Heat Storage Process in an Internal Heating Fixed-Bed Reactor. Sustainability. 2023; 15(9):7141. https://doi.org/10.3390/su15097141
Chicago/Turabian StyleYan, Jun, Lei Jiang, and Changying Zhao. 2023. "Numerical Simulation of the Ca(OH)2/CaO Thermochemical Heat Storage Process in an Internal Heating Fixed-Bed Reactor" Sustainability 15, no. 9: 7141. https://doi.org/10.3390/su15097141
Note that from the first issue of 2016, this journal uses article numbers instead of page numbers. See further details here.