


Serial Dynamics, Spatial Spillover and Common Factors of Carbon Emission Intensity in China’s Bohai Economic Rim

1
School of Business, Hebei University of Economics and Business, Shijiazhuang 050061, China
2
School of Management, China University of Mining and Technology-Beijing, Beijing 100083, China
*
Author to whom correspondence should be addressed.
Sustainability 2023, 15(9), 7182; https://doi.org/10.3390/su15097182
Submission received: 28 March 2023
/
Revised: 22 April 2023
/
Accepted: 24 April 2023
/
Published: 25 April 2023
(This article belongs to the Special Issue Carbon Neutrality: National Strategic Action Programmes and Technologies)
Abstract
:The Bohai Economic Rim (BER) is an important economic Rim in north China. Since the implementation of the Beijing−Tianjin−Hebei Coordinated Strategy in 2014, the provinces have become more closely connected in economic development and environmental governance. This paper investigates the dynamics and spillover effects of carbon emission intensity in the BER before and after removing the common factors, and analyzes the reasons for the difference. In this study, the serial dynamics characteristics and spatial spillover effects of the carbon emission intensity of provinces were analyzed in the BER provinces between 2000 and 2019. Based on the Moran index and the spatial Durbin model, the provincial carbon emission intensity and influence factors were examined. CD (Correlation Dependence) tests were then applied, with the test results indicating that the carbon intensities had strong spatial correlation. Therefore, the dynamic spatial Durbin common factor model was introduced, characterizing the dynamic characteristics of the carbon emission intensity and the spatial spillover effect in the BER. The consequences obtained are as follows: (1) The carbon emission intensities in the BER were influenced by the energy intensity, urbanization level, economic growth, and population density. There was a significant spatial spillover effect between a province and its neighboring provinces. (2) The carbon emission intensities of the provinces exhibited a strong correlation. (3) The reason for the strong carbon emission intensity correlation is associated with environmental protection policies that are similar and the common external development environment. Combining the above findings and study conclusions, the authors offer the following policy suggestions: (1) optimize the energy structure; (2) improve the industrial structure; (3) construct a regional collaborative governance mechanism for carbon emissions; and (4) formulate a precise policy. This study is crucial for reducing regional carbon emissions, promoting the transition to a green economy and society, and achieving the “carbon peaking” and “carbon neutrality” targets in China.
1. Introduction
In recent years, various extreme weather events caused by global warming have intensified [1]. Carbon emission is the primary cause of global warming. The general consensus of all countries now is to reduce carbon emissions to combat change [2,3,4]. During the past 40 years of reform and opening up, China has developed with considerable speed and undergone remarkable development, but has also damaged the environment. The challenge for the Chinese government to address is achieving balanced economic and environmental development as it shifts to a high-quality developmental pattern [5]. In October 2022, President Xi Jinping proposed that we should encourage environmentally friendly growth, cultivate harmony between humans and nature, and actively advance “carbon peaking” and “carbon neutrality”. During the Paris Agreement discussions in 2015, China promised to decrease carbon emission intensity by 60~65% from 2005 to 2030. President Xi suggested in September 2020 that we strive for “carbon neutrality” by 2060 and have carbon dioxide emissions peak before 2030. China’s carbon emission intensity has greatly reduced as the country’s economy and society continue to expand in a stable and healthy way. China exceeded its pledge to the international community by reducing carbon emission intensity by 48.4% from 2005 to 2020. However, China is still the world’s biggest source of carbon emissions. Although many measures have been introduced to attain the carbon emission reduction goals, China should still strengthen and consolidate its capacity to reduce carbon emissions for the purpose of accomplishing the carbon neutrality target before 2060 [6,7]. Under the reality in which total energy is limited and economic development requires increasing energy, the task of achieving carbon neutrality must be divided into the different regions of China. All regions need to take action to alter the mode of economic development and focus on low-carbon and environmentally friendly green development.
China’s Bohai Economic Rim (BER) refers to the coastal economic belt surrounding the Bohai Sea, which takes the Liaodong Peninsula, Shandong Peninsula, and Beijing−Tianjin−Hebei as the main body, and extends to Shanxi, Liaoning, Shandong, and the central-eastern part of Inner Mongolia (Figure 1). The BER makes up 22.2% of the population and 13.31% of the country’s total land area [8]. It is a vital region for China’s economic development, and an important center for political and cultural development. As one of the three major economic rims, it has natural geographical and resource advantages, a developed transportation network, and a strong industrial foundation. At present, the BER has become northern China’s most economically developed region [9]. Since the reform and opening up, the high-input, high-pollution, and high energy-consuming economic development pattern has caused major environmental contamination in the BER. The climate change caused by environmental pollution is closely linked to economic growth [10]. Therefore, determining how to effectively cut carbon emissions and maintain the area’s ecological environment while achieving the medium–high economic development of the BER is one of the major issues currently being faced [11].
Understanding the dynamics and spatial correlation of carbon emission intensity is crucial for realizing a low-carbon development mode [12,13]. To date, scholars have mainly focused on the elements affecting regional carbon emissions at the national, provincial, and municipal levels, but the common factors have not been taken into account. This paper investigates the dynamics and spillover effects of carbon emission intensity in the BER before and after the removal of the common factors, and analyzes the reasons for any differences. Meanwhile, it is of practical significance to quantitatively analyze the dynamics, spatial spillover and common factors of carbon emission intensity in seven provinces within the BER, namely Beijing, Tianjin, Hebei, Shanxi, the Inner Mongolia Autonomous Region, Liaoning, and Shandong. The reason why these seven provinces were chosen is that all the other provinces except Beijing and Tianjin surround Beijing and Tianjin and belong to the Pan-Bohai Rim. Moreover, it was found through research that the industrial transfer targets of Beijing−Tianjin−Hebei are mainly concentrated in these regions. During the industrial transfer process, the trade and allocation of environmental protection indicators will inevitably affect the relationship among carbon emission intensities within the BER. To reduce regional carbon emissions, advance the socio-economic green transformation, and ultimately realize China’s targets for “carbon peaking” and “carbon neutrality”, in this process, it is crucial to assess the dynamics and spatial spillover, as well as the common factors, of the BER’s carbon emission intensity.
2. Literature Review
Over the last several years, with the deterioration in the global climate environment and the deepening of people’s awareness of the need for environmental protection, studies on carbon emissions have emerged and various analytical methods have been proposed [14]. The term “carbon emission intensity” refers to the amount of carbon dioxide emitted per unit of gross domestic product (GDP). Compared with the more commonly known aggregate carbon emissions, carbon emission intensity can more accurately reflect the current status of a country’s economic development in relation to carbon emissions, and determine if a nation has successfully implemented an eco-friendly development paradigm. Scholars have carried out extensive research on carbon emission intensity using various estimation methods [15,16]. Meanwhile, many academics have examined the elements that affect the intensity of carbon emissions. Research conducted by Cary (2020) proved that, as the economy continues to upgrade, the global carbon emission intensity exhibits a decreasing slope [17]. A great deal of research has recently investigated the link between economic development and carbon emission intensity. To explore the connection between economic growth, energy demand, and carbon emissions in 19 different countries or economies, Apergis et al., (2010) tested a panel error correction model. The findings demonstrated that an increase in energy demand and economic expansion would result in higher carbon emissions [18]. Adebayo et al., (2021) identified a positive association between the development of the economy and carbon emissions in Egypt [19]. Sharma (2011) and Shahzad et al., (2017) researched how energy structure, population density, and trade openness influence carbon emission intensity [20,21]. Dong et al., (2018) evaluated the factors affecting the carbon emission intensity in 30 Chinese provinces using panel data from 1999 to 2014 based on quantile regression. The findings demonstrated that the final consumption rate, industrialization index, and energy structure all have an impact on carbon emission intensity [22]. According to a multivariate framework that took into account both labor and gross fixed capital investment, Soytas et al., (2009) explored the connection between Turkey’s energy use, economic growth, and carbon emissions [23]. Taking China as an example, Green et al., (2017) researched the factors that fueled China’s increase in carbon emissions and forecast future carbon emissions [24]. Using China’s Yellow River Basin as an illustration, Xu et al., (2022) investigated the spatio-temporal evolution of carbon emission efficiency and its affecting factors at the municipal level [25]. In addition, there is a wealth of literature describing the geographical difference or spatial spillover as possible influencing mechanism for carbon emissions. Padilla et al., (2013) used the Theil index to reflect the spatial differences and factors that affected carbon emissions in 27 EU countries during the 1990~2009 period [26]. Wang et al., (2019) conducted an analytical investigation into the spatial spillover effects and drivers of carbon emission intensity in Chinese cities nationwide using kernel density estimation and spatial autocorrelation [27]. Song et al., (2021) studied the regularity of space and time in the BER’s carbon emission intensity at the provincial level [28].
The above-mentioned studies show that scholars have mainly focused on the elements that affect regional carbon emissions at the national, provincial, and municipal levels. Research carried out by Sun et al., (2022) showed that coordinated carbon emission reduction was necessary for creating a balance between economic development and carbon emission reduction [12]. Taking the country level as the research scale can reflect the country’s total carbon emissions situation, but it is not conducive to making carbon reduction policies according to local conditions. This is because the ecological environment and economic development among regions are very different. Although taking the province level as the research scale can clearly reflect the traits of a province’s carbon emissions [29], it raises the expense of developing policies and coordination difficulties among provinces, thus greatly reducing the effectiveness of the policies [30]. Additionally, existing studies have shown that biased inference may result from methods that do not concurrently take into account serial dynamics, spatial dependency, and common factors, or that overlook one of these problems [31].
The potential innovations in this work compared with the previous literature are that this study introduces common factors because of the strong correlation of the BER’s carbon emission intensity, extracts the common factors affecting carbon emissions in all provinces, and then analyzes the serial dynamics and spatial spillover effects of carbon emission intensity. This paper aims to propose reasonable policy recommendations for reducing carbon emissions and reaching “carbon neutrality” at a regional level, and to improve the theoretical exploration of carbon emission intensity in China’s BER.
3. Theoretical Model and Data Description
First, the spatial correlation of the BER’s provinces is described by calculating the Moran index for each year in this research, considering whether carbon emission intensity is correlated with space. If there is a spatial correlation, the serial dynamics and spatial spillover effects of the carbon emission intensity of the BER’s seven provinces are carved out. Additionally, if the empirical findings show that strong serial dynamics and spatial spillover effects exist, various CD (correlation dependence) tests are applied to evaluate if the carbon emission intensity is strongly spatially correlated. A more thorough investigation of the spatial dependency and common factors of carbon emissions in each province is conducted if the carbon emission intensity connection is strong. The dynamic panel spatial Durbin model and the dynamic panel spatial Durbin common factor model were used to explore the above issues.
The explained variable is the carbon emission intensity (CEI) of the BER’s seven provinces, which indicates how carbon dioxide emissions fluctuate as the economy grows [32,33]. The method proposed by the Intergovernmental Panel on Climate Change (IPCC) is used to determine the provinces’ carbon dioxide emissions.
3.1. Theoretical Models
3.1.1. Methods for Measuring the Carbon Emission Intensity
Since there is currently no universal system for monitoring carbon emissions, only indirect methods—primarily three approaches: measurement, model simulation, and algorithms for balancing—can be used to measure carbon emissions [34,35]. With regard to the first method, it is challenging to conduct continuous monitoring and scientific sampling. Macro-emissions projections, on either a national or global scale, are usually conducted through model simulations. Most often, algorithms for balancing depending on fossil energy use are employed to estimate at the provincial level [14]. The carbon emissions of different energy sources are calculated in our paper using the emission coefficient approach (IPCC, 2006) (Table 1) [36]. First, each province’s carbon emissions are calculated in line with the carbon emission factors corresponding to different energy sources:
where denotes the carbon emissions of the region r; r () stands for, successively, Beijing, Tianjin, Hebei, Shanxi, Inner Mongolia, Liaoning, and Shandong; represents area r’s category p energy consumption; p () refers to the different energy resources shown in Table 1; stands for the typical coal coefficient; and represents the carbon emission factors. Table 1 includes a list of associated values. It should be noted that the and of comparable energy sources in various places are similar. The real provincial GDP of region r divided by the carbon emissions equals the carbon emission intensity:
3.1.2. Moran Index
The Moran index, which measures the strength of spatial correlation, has the following formula:
where is the deviation of the expected mean value of the attribute of element i; represents the spatial weight matrix ; refers to the total amount of elements; and stands for the total of the matrix’s spatial weights. The statistic Z form that corresponds to the Moran index is:
where,
The specific test procedure will be based on the form of the distribution obeyed by the variable .
3.1.3. Dynamic Spatial Durbin Model
The dynamic spatial Durbin model’s explanatory variables include the time-lagged and the explanatory variables’ spatially lagged values, along with the explained variables’ spatially lagged values. Following is the model form:
where denotes the province’s carbon emission intensity r () in the year t (T); measures the spatial autocorrelation; stands for the geospatial weight matrix; and are the logarithmic forms of energy intensity and population density, respectively; stands for urbanization level; and is the growth rate. The model can portray both the serial dynamics and the spatial spillover effects of carbon emission intensity.
3.1.4. Dynamic Durbin Common Factor Model
Based on the common factor approach, this paper considers the spatial spillover effects of carbon emission intensity among the BER’s provinces when the common influencing factors are excluded, then further analyzes the impacts of energy intensity, urbanization level, economic growth, and population density on carbon emission intensity. The construction of the spatial dynamic common factor model is divided into two steps [37,38,39].
The first step is establishing the following model:
where denotes the area’s average carbon emission intensity, obtained using the BER’s total carbon emissions divided by the GDP of the region; and is the random error term for the r-th province in the year t, with a mean of 0 and a variance of . According to the formula, each province has an intercept term and a response coefficient.
The carbon emission intensity after removing the common factors is represented by the residuals of Equation (7):
In this way, the common effects of carbon emissions from provinces in the BER can be removed, so that the remaining variables can be used to portray the true spatial correlation among the provinces.
The second step, the carbon emission intensity of the de-factor is constructed using a dynamic Durbin model,
where is defined as shown in Equation (8). The model portrays the dynamics, spatial dependence, and spatial spillover effects of carbon emission intensity after removing the common factors. The parameters were estimated using area effects and the bias-corrected QML (quasi-maximum likelihood) estimation method with both area and time-fixed effects [40,41,42].
3.2. Data Processing
The energy consumption data were obtained from the China Energy Statistical Yearbook. The raw data required for the level of urbanization, economic growth, and population density were obtained from the China Statistical Yearbook for each year and calculated accordingly. The selected data period is 2000 to 2019. In consideration of the large-scale outbreak of the COVID-19 pandemic in 2020 around the world, the data after 2019 may show relatively large fluctuations, which is not useful for reference, so only the 2000 to 2019 data were selected.
The following are the explanatory variables selected for use in this study:
- Energy intensity (LEI)
This indicator is obtained by dividing total energy consumption by nominal GDP. This paper used the logarithm of energy intensity as a proxy to research how industrial development affects carbon emission intensity.
- Level of urbanization (UR)
The percentage of the country’s total population that lives in cities is typically used to describe the level of urbanization, while some data prior to the 2006 urbanization levels are expressed as a percentage of the total household population in non-rural areas. In this paper, the degree of urbanization was used as a proxy to examine how carbon emission intensity is affected by urban−rural patterns.
- Economic growth (AGDP)
The GDP growth rate conveys the pace of economic growth as well as the current state of economic development.
- Population density (LPD)
This study investigated how rising populations have an impact on carbon emissions. The logarithmic form of population density is used.
Table 2 displays the variables’ descriptive statistics, with columns two through six displaying the variables’ observation, mean, standard deviation, and minimum and maximum values, respectively.
4. Results and Discussion
4.1. Temporal Regularity of Carbon Emission Intensity
Figure 2 displays the average annual carbon emission intensity as well as the total carbon emissions per province from 2000 to 2019. Overall, the mean value of carbon emission intensity showed a downward trend year by year, with a slight turning point in 2006 and in 2018. The average value of carbon emission intensity reached the highest in 2000, which was 7.47 ton/CNY10,000. The lowest was 2.94 ton/CNY10,000 in 2016.
The seven provinces show different carbon emission characteristics, and the average carbon emission intensity decreases year by year. The carbon emission trends and the related carbon emission intensity for each province between 2000 and 2019 are further displayed in Figure 3. Overall, although the carbon emissions in all provinces basically display a year-on-year increasing trend, the carbon emissions in Beijing, Tianjin, Hebei, and Liaoning have tended to level off in recent years. Shandong’s carbon emissions show a regular trend of year-on-year increase. Stimulated by the industrial rebound, carbon emissions in provinces such as Shanxi and Inner Mongolia have increased significantly in recent years.
However, considering the huge differences in population and economic scale of these provinces, the carbon emissions cannot reflect the real environmental changes, so carbon emission intensity was chosen to further assess the link between economic benefits and carbon emissions. Corresponding to the general national trend, the carbon emission intensity in the seven provinces generally tends to drop. From 2000 to 2019, with the advancement in environmental protection technologies, the carbon emission intensity in the country as a whole has been decreasing. Among them, Beijing, Tianjin, Hebei, Liaoning, and Shandong have a lower carbon emission intensity than other regions, and industrial restructuring in these areas has been successful. The carbon emission intensity in Shanxi and Inner Mongolia is higher than average and had a rebound trend in 2018. The explanation for this is simple; with the abundance of coal resources in Shanxi and Inner Mongolia, along with the higher economic contribution of the coal sector, carbon emissions are comparatively higher.
4.2. Spatial Correlation Analysis of Carbon Emission Intensity
In this study, we adopted the geographical distance weight matrix, also known as the adjacency spatial weight matrix; that is, a matrix was constructed to portray the adjacency relationship among the provinces. In addition, the elements in the matrix were represented by 0 or 1: if two provinces were adjacent, it was represented by 1; if not, it was represented by 0, and a row normalized form was chosen.
Table 3 and Figure 4 demonstrate that the spatial correlation of carbon emission intensity among the BER’s provinces starts to increase rapidly from 2002, declines in 2007, then increases gradually in the following years for a more moderate period, declines slightly in 2018, and starts to increase again in 2019. The general spatial correlation of the BER provinces’ carbon emission intensity indicates a trend of increasing year by year, notwithstanding some short-term variations. Therefore, to further separate out the impacts of the carbon emission spatial spillover effects from the provinces within the BER, the spatial Durbin model is taken into consideration.
4.3. Analysis of the Serial Dynamics and Spatial Spillover Effects
According to the estimation results in Table 4, level of urbanization, economic growth, and population density are all significant determinants of carbon emissions. Furthermore, these variables have a sizable effect on the provinces’ carbon emission intensity along with a strong spatial spillover effect. The spatial lagged values of all explanatory variables are significant at the 1% significance level, which illustrates that the carbon emission intensity has a significant spatial spillover impact among the provinces within the BER. The spatial correlation coefficient demonstrates that the correlation between the carbon emission intensity of each region within the BER and its neighboring regions is strong. The finding portraying the short- and long-term effects of each contributing factor on carbon emission intensity are shown in Table 5.
According to Table 5, the BER’s population density, level of urbanization, economic growth, and energy intensity all have significant short-term effects on carbon emission intensity, directly as well as indirectly. That is, each province’s carbon emission intensity is not only influenced by numerous variables in their own province, but also by various related factors in neighboring provinces, and a significant spatial spillover effect exists. All influencing factors have negligible long-term direct and long-term indirect impacts on the region’s carbon emission intensity. This is consistent with the short-term properties of carbon emissions, that is, there is a long-term equilibrium stability relationship. When spatial individuals show a strong correlation, the introduction of common factors can be considered to analyze the extent to which each province’s carbon emission intensity is influenced by the external macro-environment or policies. In the next section, the strong correlation among the carbon emission intensities will be examined.
4.4. Strong Correlation Test
Through the analysis of the above content, the authors believe that there may be a strong correlation among the carbon emission intensities, so a strong spatial correlation test is considered for carbon emission intensity. Table 6 displays the test’s outcomes.
Table 6 shows the results of the CD test, local CD test, and index test on the carbon emission intensity. The test results all show a substantial spatial association among the carbon emission intensities of the BER provinces. This strong spatial correlation suggests that it may be due to the external macro-environment’s influence or the policies that the province share, thus leading to a strong correlation among the provinces’ carbon emission intensities. Therefore, the decomposition of the spatial correlation is further explored in this research.
4.5. Spatial Common Factor Analysis
The identification of common factors (high cross-section correlation) and spatial dependency (weak cross-section correlation) is increasingly becoming the focus of research [43]. In our paper, the average carbon emission intensity of the BER’s seven provinces was used as a proxy variable for the common factor, and each province’s carbon emission intensity was regressed on the common factors. The portion of each province’s carbon emission intensity that was susceptible to common factors was represented by the common factors. The regression coefficients obtained are displayed in Table 7.
Each province’s carbon emission intensity was influenced by the common factor, additionally each province was affected differently by the common factor in terms of strength. Table 7 illustrates how common factors significantly affected all provinces, among which Shanxi Province was the most influenced by the common factor, which is closely related to the expansion of Shanxi Province’s coal industry. We further removed the common factor from consideration to obtain the de-factored carbon emission intensity, denoted by . The dynamic panel spatial Durbin model was still built for , with Table 8 reflecting the results.
This illustrates how significantly spatial dependence is affected by the extraction of common components. Furthermore, the carbon emission intensity without the common factor still has significant dynamics, but the spatial autocorrelation part becomes incompletely significant, indicating that its own spatial dependence is no longer significant, while the spatial spillover effect also decreases. Aside from the fact that the province’s carbon emission intensity is significantly influenced by its energy intensity, and there is a certain spatial spillover impact, the impact of other variables has declined or disappeared.
We describe in further detail the short- and long-term impacts of energy intensity, level of urbanization, economic growth, and population density on carbon emission intensity, with the outcomes displayed in Table 8.
Table 9 reveals that the only factor with a significant short-term direct effect on carbon emission intensity is energy intensity, and economic growth has a strong short-term spillover effect. The short-term effects of additional explanatory factors have declined or disappeared. Moreover, there are no long-term direct or spillover effects for any of the explanatory variables. This indicates that the BER’s carbon emissions have a spatial correlation that is mainly caused by the common external factors faced by the provinces. For instance, all provinces in the BER are situated in China’s northern region, with close geographical proximity and convenient transportation, and are facing the same or similar macroeconomic policies, as well as relatively similar environmental protection policies.
4.6. Robustness Test
Making the aforementioned research findings more compelling, we conducted a robustness test by replacing the spatial weight matrix. The spatial weight matrix of the above spatial panel Durbin model was reset, and the spatial distance matrix was replaced by the spatial economic matrix. Table 10 displays the model’s estimated outputs.
The main regression coefficients of the model remain largely consistent after changing the spatial weight matrix settings, which pass the significance test and remain consistent with the main findings of the paper.
The spatial distance matrix takes the place of the spatial economy matrix, and Table 10 displays the outcomes of the spatial Durbin model estimation of carbon emission intensity after de-factoring.
Putting the spatial weight matrix of economic distance in place of the spatial weight matrix of geographic distance, the spatial Durbin model of carbon emission intensity was estimated after extracting the common factors. It is evident that the main regression coefficients in Table 8 and Table 11, along with the significant levels, are similar.
In summary, the measures in this paper are all relatively reliable.
4.7. Discussion
By comparing our findings with the existing literature, we found that the spatial correlation results of carbon emission intensity were consistent with Wang et al., (2020) [44]. The results of the effect of energy intensity, level of urbanization, economic growth, and population density on carbon emission intensity are basically consistent with the finding of Song et al., (2021) [28], Wang et al., (2016) [45], Liu et al., (2023) [46], and Wu et al., (2018) [47]. However, the influence of common factors was not taken into account in the previous studies, nor did they eliminate common factors to study the spillover effect of carbon emission intensity. Furthermore, when the common factor has been eliminated, the conclusions drawn in this paper are more in contrast with the previous papers. The only factor with a significant short-term direct effect on carbon emission intensity is energy intensity, and economic growth has a strong short-term spillover effect. The short-term effects of other explanatory factors declined or disappeared. Moreover, our study takes into account the dynamics for carbon emission intensity, and the dynamics exist for each model. Since the strategy of the “coordinated development of Beijing, Tianjin, and Hebei” was proposed in 2014, the environmental links between the provinces in China’s BER have become closer. Therefore, a strong carbon emission intensity correlation is present. The primary factors behind this strong association are the common environmental policies and the strong association between the economic environments of the provinces. Similar effect factors also cause a strong correlation, so after removing the common factors, some spillover effects become non-significant. To reduce emissions, more attention should be paid to regional coordination and the optimization and adjustment of the macroeconomic environment and policies.
5. Conclusions and Policy Suggestions
5.1. Conclusions
This study selected China’s BER to study the dynamics and spatial spillover of the carbon emission intensity, and to examine the dynamics and spatial spillover after removing the common factors for the carbon emission intensity. Specifically, first, the Moran index was calculated for the carbon emission intensity of the BER’s provinces. The results demonstrated that the spatial correlation increased year by year starting from 2002. A dynamic spatial Durbin model was then considered to quantitatively examine the spatial spillover effect of the carbon emission intensity of BER’s provinces. According to the results, the carbon emission intensity was strongly determined by its lagged value, and significantly influenced by the energy intensity, level of urbanization, economic growth, and population density. Additionally, provinces in the BER had a Moran index of carbon emission intensity that exceeded 0.4 in 2019, and the authors believe that there may be a strong spatial correlation. The results of the CD test, local CD test, and index test all indicated that carbon emissions had a strong spatial correlation among the provinces. Therefore, the extraction of common factors within the BER and the impact of common factors on each province’s carbon emission spillover effect were further explored. The empirical analysis revealed that, after removing the common factors, the dependent variable’s spatial autocorrelation part became insignificant, all of the explanatory variables’ absolute values became smaller, and some explanatory variables became no longer significant, indicating that all of the explanatory variables’ levels of influence on the carbon emission intensity decreased.
We draw several conclusions from the study: (1) The energy intensity, urbanization, economic growth, and population density are the four main factors that have a marked impact on the BER’s carbon emission intensity. In addition, both direct and indirect effects exist, which means that each province’s carbon emission intensity is not only affected by various factors in their own province, but also by various related factors in neighboring provinces. Hence, there exists a significant spatial spillover effect. (2) There may be a strong correlation among the levels of the variables affecting carbon emissions in each province, thus exhibiting a strong correlation between the carbon emission intensities of each province. (3) The reason for the strong correlation among carbon emission intensities is mainly related to the similar environmental protection policies faced by each province. Meanwhile, the common external development environment also has a great impact on the spatial correlation among carbon emission intensities within this economic rim.
5.2. Policy Suggestions
Combining the above findings and study conclusions, the authors offer the following policy suggestions.
5.2.1. Optimization of Energy Structure
The empirical research results demonstrate that energy intensity, level of urbanization, economic growth, and population density all have substantial effects on carbon emission intensity. Carbon emission intensity is significantly impacted by energy intensity in particular. Furthermore, after extracting the common factors, energy intensity has an impact on carbon emission intensity both directly and indirectly over the short term, as well as directly and indirectly over the long term. All other influencing factors were not fully significant. Therefore, the first step in reducing carbon emissions in the BER is to make appropriate adjustments to the energy consumption structure. The government should encourage businesses to use sustainable and environmentally friendly energy, and promote clean energy for the purpose of transforming the composition of energy used. The production of heavy chemical enterprises would become greener, and the economy could be more easily transformed to a green economy.
5.2.2. Optimizing Industrial Structure
Reducing carbon emissions in the BER depends on improvements to the industrial structure. Enhancing industry’s level of advancement and rationalization can reduce the burden of carbon emissions to some extent. For industries that do not achieve the carbon emission indicators, corresponding environmental protection policies can be formulated, and strict control and regulation can be carried out. In the rationalization of the industrial structure, optimizing the rationalization of resource allocation should be actively advanced, enabling the achievement of high profits and low emissions. We should strive to modernize and transform traditional industries while fostering strategic emerging industries.
5.2.3. Constructing a Regional Collaborative Governance Mechanism for Carbon Emissions
As one of the three major economic rims in China, the BER has been crucial in advancing China’s economic development. However, the BER development method is characterized by high input and high energy consumption, bringing severe environmental pollution during development. From the results regarding the spatial spillover effects and other analyses, it can be seen that the provinces in the BER possess a high spatial correlation, moreover the carbon emission intensity exhibits a strong correlation. For the purpose of reducing carbon emissions in the BER, a regional cooperative governance mechanism for carbon emissions should be constructed. In addition, we should try to establish a regional carbon compensation and carbon trading system according to the level of economic development. Among these, carbon trading can help industrial enterprises to actively seek clean fuels and green production methods as a way to encourage cooperation among enterprises from all provinces in the BER, and to jointly promote the regional economy’s green and synergistic growth.
5.2.4. Making Precise Policy
The construction of a regional collaborative governance mechanism for carbon emissions is not a “one-size-fits-all” strategy. Instead, its aim is to implement differentiated emission reduction policies and to promote regional industrial technology cooperation according to the industrial structure and the economic development status of each province and city. For example, the Hebei region should focus more on reducing emissions and saving energy at the production end, with the opportunity to decommission Beijing’s non-core functions. In addition, the introduction of advanced production technologies and processes in Beijing and Tianjin should be encouraged, eliminating backward production capacity, adjusting and optimizing industrial structure, and vigorously lowering the proportion of heavy industry. Furthermore, while Beijing and Tianjin adjust and optimize their own industries, they should strengthen their technology transfer to assist Hebei and Shandong, along with other provinces, to implement an industrial low-carbon energy-saving transformation, as well as putting low-carbon cooperative development into practice in the BER.
Additionally, the regional carbon emission accounting system should be refined by the government. The government should fully consider the economic benefits gained by the provinces, as well as their energy-use efficiency, on the verge of developing provincial carbon emission accounting guidelines, so as to assure the sustainability of provincial efforts to reduce carbon emissions.
With thoroughness, to accomplish the BER’s carbon emission reduction targets, we should focus on optimizing the energy structure and the industrial structure, constructing a regional collaborative governance mechanism for carbon emissions, and trying to establish a regional carbon compensation and carbon trading system. Furthermore, differentiated emission reduction policies should be implemented according to the economic development status of each province. Enterprises in each province need to be encouraged to strengthen cooperation and to jointly promote the regional economy’s green and synergistic growth.
5.3. Limitations and Future Research
There are three limitations in this paper. First, the method presented in this paper can only be used to solve long panel data problems. Second, this paper only analyzed the serial dynamics, spatial spillover and common factors of carbon emission intensity in the BRE, without further exploring the influencing mechanism of carbon emission intensity. Finally, only the BER is studied in this paper without a comparative analysis of multiple regions. In future, studies could be carried out on the influence mechanism of carbon intensity and a comparison between multiple regions based on common factors made.
Author Contributions
Conceptualization, Y.G. and L.Z.; data curation, Y.G. and L.Z.; formal analysis, X.W.; investigation, Y.G. and X.W.; methodology, Y.G.; resources, Y.G.; software, Y.G.; supervision, Y.G.; validation, Y.G., X.W. and L.Z.; visualization, X.W. and L.Z.; writing—original draft, Y.G.; writing—review and editing, Y.G. and L.Z. All authors have read and agreed to the published version of the manuscript.
Funding
This study was funded by research on the Integration and Development Path of Digital Economy and Real Economy in Hebei Province (NO.: HB21YJ031).
Institutional Review Board Statement
Not applicable.
Informed Consent Statement
Not applicable.
Data Availability Statement
The data presented in this study are available upon request from the corresponding author.
Acknowledgments
We thank the academic editors and anonymous reviewers for their suggestions and valuable comments.
Conflicts of Interest
The authors declare no conflict of interest.
References
- Azam, M.; Younes, B.Z.; Hunjra, A.I.; Hussain, N. Integrated Spatial-Temporal Decomposition Analysis for Life Cycle Assessment of Carbon Emission Intensity Change in Various Regions of China. Resour. Policy 2022, 79, 103062. [Google Scholar] [CrossRef]
- Raihan, A.; Tuspekova, A. The Nexus between Economic Growth, Renewable Energy Use, Agricultural Land Expansion, and Carbon Emissions: New Insights from Peru. Energy Nexus 2022, 6, 100067. [Google Scholar] [CrossRef]
- Shahbaz, M.; Kumar Tiwari, A.; Nasir, M. The Effects of Financial Development, Economic Growth, Coal Consumption and Trade Openness on CO2 Emissions in South Africa. Energy Policy 2013, 61, 1452–1459. [Google Scholar] [CrossRef]
- Rehman, E.; Rehman, S. Modeling the Nexus between Carbon Emissions, Urbanization, Population Growth, Energy Consumption, and Economic Development in Asia: Evidence from Grey Relational Analysis. Energy Rep. 2022, 8, 5430–5442. [Google Scholar] [CrossRef]
- Wu, Z.X.; Yan, H.J. Influence of economic growth and industrial structure on Huan Bo Hai sea economic region’s carbon emission based on spatial panel data model. Chin. J. Manag. Sci. 2014, 22, 724–730. [Google Scholar] [CrossRef]
- Wang, Y.M. Changes unseen in a century, high-quality development, and the construction of a new development pattern. J. Manag. World 2020, 36, 1–13. [Google Scholar] [CrossRef]
- Zhang, H.S.; Li, S.P.; Peng, M. Regional imbalance of carbon emissions from China’s rural energy consumption and dynamic identification of driving factors. Integr. Rural Econ. 2022, 1, 112–134. [Google Scholar]
- Xiong, Y.H.; Wu, S.G.; Zhang, D.W. Strengthening environmental management and promoting stable economic growth in Bohai Rim region. Environ. Prot. 2012, 20, 37–40. [Google Scholar] [CrossRef]
- Li, H.; Gao, Q.; Wu, F. Ecological environment response to marine economy development and the influence factors in Bohai Bay Rim Area. Chin. J. Popul. Resour. Environ. 2017, 27, 36–43. [Google Scholar]
- Xu, S.; Wang, X.H.; Song, W.L.; Dong, W. Analysis of the relationship between economic growth and environmental pollution in Circum-Bohai-Sea Zone: Based on Environmental Kuznrts Curve. Mar. Sci. Bull. 2011, 30, 601–606. [Google Scholar]
- Li, K.F.; Ni, J.C.; Zhang, Z. Analysis of influencing factors of carbon emission performance in three economic circles—Based on the perspective of foreign capital transfer. Wuhan Financ. 2018, 3, 50–55. [Google Scholar]
- Sun, X.; Zhang, H.; Wang, X.; Qiao, Z.; Li, J. Towards Sustainable Development: A Study of Cross-Regional Collaborative Carbon Emission Reduction in China. Sustainability 2022, 14, 9624. [Google Scholar] [CrossRef]
- Hao, R.J.; Wei, W.; Liu, C.F.; Xie, B.B.; Du, H.B. Spatialization and spatio-temporal dynamics of energy consumption carbon emissions in China. Environ. Sci. 2022, 43, 5305–5314. [Google Scholar] [CrossRef]
- Shao, S.; Yang, L.; Yu, M.B.; Yu, M.L. Estimation, characteristics, and determinants of energy related industrial CO2 emissions in Shanghai (China), 1994–2009. Energy Policy 2011, 39, 6476–6494. [Google Scholar] [CrossRef]
- Acheampong, A.O.; Boateng, E.B. Modelling Carbon Emission Intensity: Application of Artificial Neural Network. J. Clean. Prod. 2019, 225, 833–856. [Google Scholar] [CrossRef]
- Bhattacharya, M.; Inekwe, J.N.; Sadorsky, P. Consumption-Based and Territory-Based Carbon Emissions Intensity: Determinants and Forecasting Using Club Convergence across Countries. Energy Econ. 2020, 86, 104632. [Google Scholar] [CrossRef]
- Cary, M. Molecules of Inefficiency: How Tariffs Impact Carbon Intensities, Carbon Dioxide Emissions, and the Environment. Sci. Total Environ. 2020, 713, 136531. [Google Scholar] [CrossRef] [PubMed]
- Apergis, N.; Payne, J.E.; Menyah, K.; Wolde-Rufael, Y. On the Causal Dynamics between Emissions, Nuclear Energy, Renewable Energy, and Economic Growth. Ecol. Econ. 2010, 69, 2255–2260. [Google Scholar] [CrossRef]
- Adebayo, T.S.; Beton Kalmaz, D. Determinants of CO2 Emissions: Empirical Evidence from Egypt. Environ. Ecol. Stat. 2021, 28, 239–262. [Google Scholar] [CrossRef]
- Sharma, S.S. Determinants of Carbon Dioxide Emissions: Empirical Evidence from 69 Countries. Appl. Energy 2011, 88, 376–382. [Google Scholar] [CrossRef]
- Shahzad, S.J.H.; Kumar, R.R.; Zakaria, M.; Hurr, M. Carbon Emission, Energy Consumption, Trade Openness and Financial Development in Pakistan: A Revisit. Renew. Sustain. Energy Rev. 2017, 70, 185–192. [Google Scholar] [CrossRef]
- Dong, F.; Yu, B.; Hadachin, T.; Dai, Y.; Wang, Y.; Zhang, S.; Long, R. Drivers of Carbon Emission Intensity Change in China. Resour. Conserv. Recycl. 2018, 129, 187–201. [Google Scholar] [CrossRef]
- Soytas, U.; Sari, R. Energy Consumption, Economic Growth, and Carbon Emissions: Challenges Faced by an EU Candidate Member. Ecol. Econ. 2009, 68, 1667–1675. [Google Scholar] [CrossRef]
- Green, F.; Stern, N. China’s Changing Economy: Implications for Its Carbon Dioxide Emissions. Clim. Policy 2017, 17, 423–442. [Google Scholar] [CrossRef]
- Xu, Y.; Cheng, Y.; Zheng, R.; Wang, Y. Spatiotemporal Evolution and Influencing Factors of Carbon Emission Efficiency in the Yellow River Basin of China: Comparative Analysis of Resource and Non-Resource-Based Cities. Int. J. Environ. Res. Public Health 2022, 19, 11625. [Google Scholar] [CrossRef]
- Padilla, E.; Duro, J.A. Explanatory Factors of CO2 per Capita Emission Inequality in the European Union. Energy Policy 2013, 62, 1320–1328. [Google Scholar] [CrossRef]
- Wang, S.J.; Huang, Y.Y. Spatial spillover effect and driving forces of carbon emissions intensity at city level in China. Acta. Geogr. Sin. 2019, 74, 1131–1148. [Google Scholar] [CrossRef]
- Song, M.; Wu, J.; Song, M.R.; Zhang, L.Y.; Zhu, Y.X. Spatiotemporal regularity and spillover effects of carbon emission intensity in China's Bohai Economic Rim. Sci. Total Environ. 2020, 740, 140–184. [Google Scholar] [CrossRef] [PubMed]
- Wang, Y.; He, Y.F. Spatiotemporal dynamics and influencing factors of provincial carbon emissions in China. World Reg. Stud. 2020, 29, 512–522. [Google Scholar] [CrossRef]
- Yang, S.J. Spatial effects of energy consumption and carbon emissions in provinces of China based on the perspective of different spatial weight matrix. Environ. Sci. Technol. 2019, 42, 180–185. [Google Scholar] [CrossRef]
- Solmaria, H.V.; Paul, E.J. A regional unemployment model simultaneously accounting for serial dynamics, spatial dependence and common factors. Reg. Sci. Urban Econ. 2016, 60, 85–95. [Google Scholar] [CrossRef]
- Jiang, W.B.; Han, M.Y.; Tang, Z.P. International comparison of carbon intensity from the perspective of economic development levels and industrial transfers. Resour. Sci. 2019, 41, 1814–1823. [Google Scholar] [CrossRef]
- Su, B.; Ang, B.W. Demand contributors and driving factors of Singapore’s aggregate carbon intensities. Energy Policy 2020, 146, 111817. [Google Scholar] [CrossRef]
- Li, Z.; Shao, S.; Shi, X.; Sun, Y.; Zhang, X. Structural Transformation of Manufacturing, Natural Resource Dependence, and Carbon Emissions Reduction: Evidence of a Threshold Effect from China. J. Clean. Prod. 2019, 206, 920–927. [Google Scholar] [CrossRef]
- Yin, L.; Liu, G.; Zhou, J.; Liao, Y.; Ma, X. A Calculation Method for CO2 Emission in Utility Boilers Based on BP Neural Network and Carbon Balance. Energy Procedia 2017, 105, 3173–3178. [Google Scholar] [CrossRef]
- IPCC. The 2006 IPCC Guidelines for National Greenhouse Gas Inventories. WWW.Document. Intergov. Panel Clim. Chang URL. 2006. Available online: https://www.ipcc-nggip.iges.or.jp/public/2006gl/ (accessed on 17 September 2021).
- Bailey, N.; Holly, S.; Pesaran, M.H. A Two-Stage Approach to Spatio-Temporal Analysis with Strong and Weak Cross-Sectional Dependence: A Two-stage Approach to Spatio-temporal Analysis. J. Appl. Econ. 2016, 31, 249–280. [Google Scholar] [CrossRef]
- Elhorst, J.P. Spatial Econometrics: From Cross-Sectional Data to Spatial Panels; Springer: Berlin/Heidelberg, Germany, 2014. [Google Scholar]
- Elhorst, J.P.; Madre, J.-L.; Pirotte, A. Car Traffic, Habit Persistence, Cross-Sectional Dependence, and Spatial Heterogeneity: New Insights Using French Departmental Data. Transp. Res. Part A Policy Pract. 2020, 132, 614–632. [Google Scholar] [CrossRef]
- Yu, J.; de Jong, R.; Lee, L. Quasi-Maximum Likelihood Estimators for Spatial Dynamic Panel Data with Fixed Effects When Both n and T Are Large. J. Econ. 2008, 146, 118–134. [Google Scholar] [CrossRef]
- Lee, L.; Yu, J. A Spatial Dynamic Panel Data Model with Both Time and Individual Fixed Effects. Econom. Theory 2010, 26, 564–597. [Google Scholar] [CrossRef]
- Lee, L.; Yu, J. Estimation of Spatial Autoregressive Panel Data Models with Fixed Effects. J. Econ. 2010, 154, 165–185. [Google Scholar] [CrossRef]
- Chudik, A.; Pesaran, M.H.; Tosetti, E. Weak and strong cross-section dependence and estimation of large panels. Econ. J. 2011, 14, 45–90. [Google Scholar] [CrossRef]
- Wang, Z.G.; Su, B.; Xie, R.; Long, H.Y. China’s aggregate embodied CO2 emission intensity from 2007 to 2012: A multi-region multiplicative structural decomposition analysis. Energy Econ. 2020, 85, 104568. [Google Scholar] [CrossRef]
- Wang, Z.H.; Zhang, B.; Liu, T.F. Empirical analysis on the factors influencing national and regional carbon intensity in China. Renew. Sustain. Energy Rev. 2016, 55, 34–42. [Google Scholar] [CrossRef]
- Liu, X.J.; Jin, X.B.; Luo, X.L.; Zhou, Y.K. Multi-scale variations and impact factors of carbon emission intensity in China. Sci. Total Environ. 2023, 857, 159403. [Google Scholar] [CrossRef]
- Wu, R.W.; Dong, J.F.; Zhou, L.; Zhang, L. Regional Distribution of Carbon Intensity and its Driving Factors in China: An Empirical Study Based on Provincial Data. Pol. J. Environ. Stud. 2018, 27, 1331–1341. [Google Scholar] [CrossRef]
Figure 1.
The geographical position of the BER in China.

Figure 2.
The average annual carbon emission intensity and the total carbon emissions in the BER, 2000–2019.
Figure 2.
The average annual carbon emission intensity and the total carbon emissions in the BER, 2000–2019.

Figure 3.
The carbon emission trends and the related carbon emission intensity for each province, 2000–2019.
Figure 3.
The carbon emission trends and the related carbon emission intensity for each province, 2000–2019.
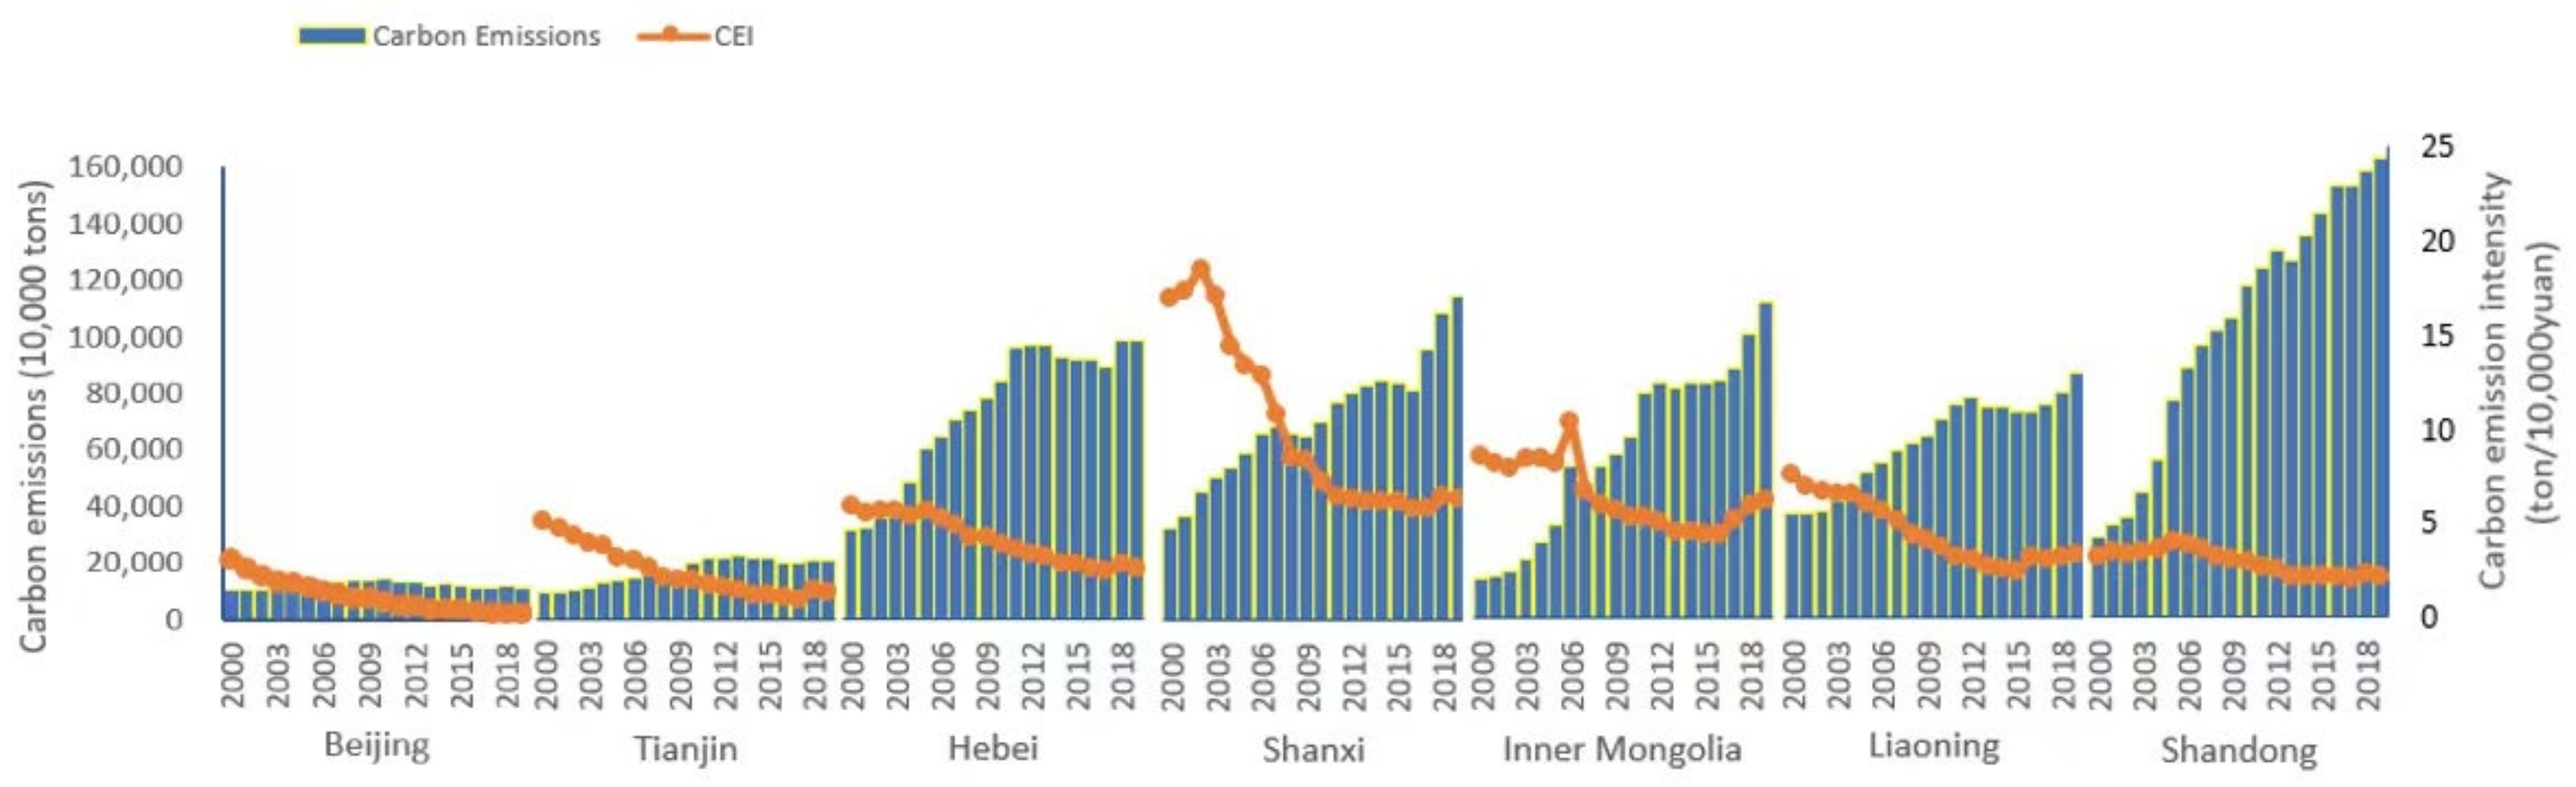
Figure 4.
Moran index of carbon emission intensity in provinces in the BER, 2000−2019.


Table 1.
Carbon emission factors of different energy resources.
| Energy Source | Coal | Coke | Crude Oil | Fuel Oil | Gasoline | Kerosene | Diesel | Natural Gas |
|---|---|---|---|---|---|---|---|---|
| SCC (kg standard coal/kg) | 0.7143 | 0.9714 | 1.4286 | 1.4286 | 1.4714 | 1.4714 | 1.4517 | 1.33 |
| CEF (kg/kg standard coal) | 0.7559 | 0.855 | 0.5857 | 0.6185 | 0.5538 | 0.5714 | 0.5921 | 0.4483 |
Source: IPCC, 2006.
Table 2.
Descriptive statistics.
| Variables | Obs | Mean | Std. Dev. | Min | Max |
|---|---|---|---|---|---|
| CEI | 140 | 4.7118 | 3.6030 | 0.3275 | 19.3251 |
| LEI | 140 | 0.1074 | 0.5969 | −1.5698 | 1.3907 |
| UR | 140 | 61.0322 | 34.3533 | 34.3533 | 93.9885 |
| AGDP | 140 | 2.0860 | 0.7260 | 0.9071 | 3.6832 |
| LPD | 140 | 5.7812 | 1.2631 | 2.9984 | 7.1883 |
Table 3.
Moran index for the provinces in the BER, 2000–2017.
| Year | 2000 | 2001 | 2002 | 2003 | 2004 | 2005 | 2006 | 2007 | 2008 | 2009 |
|---|---|---|---|---|---|---|---|---|---|---|
| Moran’s I | 0.151 | 0.140 | 0.123 | 0.182 | 0.250 | 0.276 | 0.370 | 0.280 | 0.338 | 0.314 |
| Z-Value | 1.604 | 0.113 | 1.526 | 1.763 | 1.990 | 2.084 | 2.347 | 2.090 | 2.263 | 2.175 |
| Year | 2010 | 2011 | 2012 | 2013 | 2014 | 2015 | 2016 | 2017 | 2018 | 2019 |
| Moran’s I | 0.331 | 0.356 | 0.354 | 0.322 | 0.325 | 0.330 | 0.399 | 0.439 | 0.415 | 0.430 |
| Z-Value | 2.222 | 2.272 | 2.277 | 2.163 | 2.206 | 2.224 | 2.483 | 2.587 | 2.495 | 2.544 |
Table 4.
Results of the dynamic panel spatial Durbin model estimation.
| Main | Wx | ||
|---|---|---|---|
| L.CO2 | 0.4878 *** (10.8765) | ||
| LEI | 11.7014 *** (21.8454) | LEI | 15.4547 *** (20.9148) |
| UR | 0.0778 *** (5.5383) | UR | 0.3510 *** (15.6908) |
| AGDP | −0.2371 * (−2.2827) | AGDP | −1.2212 *** (−8.2902) |
| LPD | −8.9321 *** (−5.4003) | LPD | 92.4067 *** (27.1613) |
| 0.7007 *** (7.4619) | 0.2847 *** (9.0249) |
Note: *** and * indicate significance at the 1% and 10% levels, respectively.
Table 5.
Direct and spillover effects of each explanatory variable on carbon emission intensity (short-term and long-term).
Table 5.
Direct and spillover effects of each explanatory variable on carbon emission intensity (short-term and long-term).
| Variables | Short-Term Direct Effects | Short-Term Spillove r Effects | Long-Term Direct Effects | Long-Term Spillover Effects |
|---|---|---|---|---|
| LEI | 9.8585 *** (15.3239) | 6.2073 *** (7.7820) | 45.4678 (0.0831) | −22.8609 (−0.0418) |
| UR | 0.0051 (0.2444) | 0.2496 *** (13.5079) | −3.2842 (−0.0418) | 3.6428 (0.0464) |
| AGDP | 0.0239 (0.1731) | −0.8929 *** (−5.7331) | 9.1986 (0.0432) | −10.4223 (−0.0489) |
| LPD | −33.5870 *** (−6.8704) | 83.0126 *** (20.4094) | −1500 (−0.0442) | 1600 (0.0462) |
Note: *** indicate significance at the 1% levels.
Table 6.
Results of various strong correlation tests for carbon emission intensity.
| Variables | Test Statistic | Value of Test Statistic | p-Value | Standard Error |
|---|---|---|---|---|
| Carbon emission intensity | CD | 18.3210 | 0.000 | 1 |
| Local CD | 10.6756 | 0.000 | 0.0806 | |
| Index | 1.0127 | 0.000 | 0.0889 |
Note: indicates a strong correlation between cross-sectional individuals. Under the null hypothesis of cross-section independence, CD~N (0, 1).
Table 7.
Regression results of carbon emission intensity on common factors for each province.
| T-Statistic | T-Statistic | |||
|---|---|---|---|---|
| Beijing | −1.232 ** | (−2.82) | 0.622 *** | (6.06) |
| Tianjin | −1.377 *** | (−3.15) | 0.965 *** | (9.4) |
| Hebei Province | 0.567 | (1.3) | 0.953 *** | (9.28) |
| Shanxi Province | −3.409 *** | (−7.8) | 3.450 *** | (33.6) |
| Inner Mongolia Autonomous Region | 1.775 ** | (4.06) | 1.201 *** | (11.7) |
| Liaoning Province | −0.5889 | (−1.35) | 1.290 *** | 12.56) |
| Shandong Province | 1.108 ** | (2.54) | 0.441 *** | (4.3) |
| 0.9907 | ||||
| F (14, 126) | 955.28 |
Note: ***, ** indicate significance at the 1%, 5% levels, respectively.
Table 8.
Spatial Durbin model estimation results for carbon emission intensity after de-factoring.
| Main | Wx | ||
|---|---|---|---|
| L. | 0.7154 *** (9.7105) | ||
| LEI | 2.4573 *** (2.8448) | LEI | −1.8785 * (−2.0333) |
| UR | 0.0013 (0.0796) | UR | −0.0053 (−0.1471) |
| AGDP | 1.1497 (0.4044) | AGDP | −12.0461 ** (−3.1882) |
| LPD | −10.0486 ** (−2.6105) | LPD | 1.5287 (0.2200) |
| 0.1519 (1.5472) | 0.5080 *** (9.4572) |
Note: ***, **, and * indicate significance at the 1%, 5%, and 10% levels, respectively.
Table 9.
Direct and spillover effects of each explanatory variable on carbon intensity after de-factoring (short term and long term).
Table 9.
Direct and spillover effects of each explanatory variable on carbon intensity after de-factoring (short term and long term).
| Variables | Short-Term Direct Effects | Short-Term Spillover Effects | Long-Term Direct Effects | Long-Term Spillover Effects |
|---|---|---|---|---|
| LEI | 2.3442 *** (4.0844) | −1.6566 (−1.7180) | 8.5081 (0.8330) | −0.7152 (−0.0088) |
| UR | 0.0026 (0.1561) | −0.0046 (−0.1098) | 0.0358 (0.0577) | 0.2215 (0.0447) |
| AGDP | 0.5116 (0.1890) | −13.6424 *** (−3.3804) | −10.1149 (−0.1198) | −110 (−0.1634) |
| LPD | −10.0308 * (-2.5698) | −0.0428 (−0.0057) | −47.7209 (−0.3498) | −93.6846 (−0.0877) |
Note: *** and * indicate significance at the 1% and 10% levels, respectively.
Table 10.
Robustness test results of spatial economic matrix.
| Main | Wx | ||
|---|---|---|---|
| L.CO2 | 1.106 *** (27.3916) | ||
| LEI | 16.108 *** (33.2388) | LEI | 21.737 *** (28.8538) |
| UR | 0.114 *** (8.9595) | UR | 0.163 *** (7.8659) |
| AGDP | −2.682 *** (−23.0522) | AGDP | −1.029 *** (−6.4240) |
| LPD | −8.919 *** (−9.1732) | LPD | 287.122 *** (54.1891) |
| 0.518 *** (9.2307) | 0.263 *** (8.4720) |
Note: *** indicate significance at the 1% levels.
Table 11.
Robustness test results using the spatial economic matrix to de-factor.
| Main | Wx | ||
|---|---|---|---|
| L. | 0.6017 *** (8.7155) | ||
| LEI | 1.4315 *** (3.6027) | LEI | −0.0898 (−0.1515) |
| UR | 0.0086 (0.9080) | UR | 0.0278 (1.7139) |
| AGDP | 0.0605 (0.6832) | AGDP | −0.1493 (−1.2307) |
| LPD | 1.1406 (1.4812) | LPD | 5.4395 (1.2835) |
| 0.0538 (0.6828) | 0.1681 *** (8.3754) |
Note: *** indicate significance at the 1% levels.
Disclaimer/Publisher’s Note: The statements, opinions and data contained in all publications are solely those of the individual author(s) and contributor(s) and not of MDPI and/or the editor(s). MDPI and/or the editor(s) disclaim responsibility for any injury to people or property resulting from any ideas, methods, instructions or products referred to in the content. |
© 2023 by the authors. Licensee MDPI, Basel, Switzerland. This article is an open access article distributed under the terms and conditions of the Creative Commons Attribution (CC BY) license (https://creativecommons.org/licenses/by/4.0/).
Share and Cite
MDPI and ACS Style
Gao, Y.; Wang, X.; Zhang, L. Serial Dynamics, Spatial Spillover and Common Factors of Carbon Emission Intensity in China’s Bohai Economic Rim. Sustainability 2023, 15, 7182. https://doi.org/10.3390/su15097182
AMA Style
Gao Y, Wang X, Zhang L. Serial Dynamics, Spatial Spillover and Common Factors of Carbon Emission Intensity in China’s Bohai Economic Rim. Sustainability. 2023; 15(9):7182. https://doi.org/10.3390/su15097182
Chicago/Turabian StyleGao, Yan, Xin Wang, and Liyan Zhang. 2023. "Serial Dynamics, Spatial Spillover and Common Factors of Carbon Emission Intensity in China’s Bohai Economic Rim" Sustainability 15, no. 9: 7182. https://doi.org/10.3390/su15097182
Note that from the first issue of 2016, this journal uses article numbers instead of page numbers. See further details here.