Article

Activated Carbon Fabricated from Biomass for Adsorption/Bio-Adsorption of 2,4-D and MCPA: Kinetics, Isotherms, and Artificial Neural Network Modeling

1
Department of Civil Engineering, College of Engineering, Jouf University, Sakakah 72388, Saudi Arabia
2
Environmental Engineering Department, Faculty of Engineering, Zagazig University, Zagazig 44519, Egypt
3
Civil Engineering Department, College of Engineering, Shaqra University, Al-Duwadmi 11911, Saudi Arabia
4
Computer and Systems Engineering Department, Faculty of Engineering, Zagazig University, Zagazig 44519, Egypt
5
Department of Computer Science, College of Science and Humanities, Shaqra University, Al Quwaiiyah 11961, Saudi Arabia
*
Authors to whom correspondence should be addressed.
Sustainability 2024, 16(1), 299; https://doi.org/10.3390/su16010299
Submission received: 25 October 2023 / Revised: 14 December 2023 / Accepted: 25 December 2023 / Published: 28 December 2023

Abstract

:
Adsorption is an effective and economical alternative to remove herbicides from polluted water. The aim of this study is to investigate the adsorption of the most common herbicides (2,4-dichlorophenoxy-acetic acid (2,4-D) and 4-chloro-2-methylphenoxyacetic acid (MCPA)) onto activated carbon (AC) fabricated from wheat straw under different conditions. The adsorption of MCPA and 2,4-D onto the selected AC (CLW) and the effects of the ionic strength, the solution pH, and the presence of microorganisms in the medium were investigated. The results showed that the selected AC had a high surface area (1437 m2/g). The adsorption rate increased with an increase in the AC mass. The selected AC had a higher adsorption capacity (1.32 mmol/g) for 2,4-D compared to MCPA (0.76 mmol/g). The adsorption of 2,4-D and MCPA was not affected by variation in the solution pH. However, the presence of electrolytes exerted a major effect on adsorption. The presence of microorganisms enhanced adsorption onto the AC by 17% and 32% for 2,4-D and MCPA, respectively. Moreover, a radial basis function neural network (RBFNN) was employed to accurately predict the adsorption capacity based on the pollutant type, carbon dose, initial concentration, pH, ionic strength, and presence of bacteria. The RBFNN showed excellent accuracy in predicting the adsorption capacity, with an R2 value of 0.96 and a root mean square error (RMSE) of 0.054. These findings showed that the AC fabricated from biomass residues of wheat straw is a promising option to recycle this type of biomass waste and reduce environmental threats, consequently contributing to achieving sustainability.

1. Introduction

The increase in worldwide population has resulted in intensification of the practices of agriculture to increase the rate of crop yield production [1]. This has been partly achieved by using more pesticides [2]. The increase in pesticide application is beneficial in controlling weeds, killing insects, staving off fungi, preventing hazardous crop diseases, improving crop yields, and preserving the financial sustainability of agriculture [3]. Although pesticides work on their intended targets, they have harmful impacts on the wider ecosystem [4]. The increase in pesticide application raises the possibility of human exposure, which could lead to health problems including respiratory, neurological, and cancerous effects [5]. Additionally, it increases the risk of these compounds interacting with aquatic environments [6]. According to the Food and Agriculture Organization (FAO) of the United Nations, worldwide pesticide usage in 2019 reached 4.2 million tons [7], and it is predicted to increase with global warming and demographic pressure [8].
Herbicides are considered the most common pesticides, representing approximately 80% of total pesticide use [9]. They are chemicals that are used to prevent unwanted plant growth, including the growth of invasive species and weeds in homes or farms [4]. Over the years, the consumption of crop products protected by pesticides has increased significantly [10]. An estimated 2.7 million tons were used annually in agriculture in 2020, with approximately 52% of that amount being attributed to herbicides, 23% being attributed to fungicides, 18% being attributed to insecticides, and 7% being attributed to other pesticides [7]. Because of the high solubility of phenoxy herbicides in water, they can easily leach into groundwater and surface water sources [11]. There are two herbicides (2,4-dichlorophenoxy-acetic acid (2,4-D) and 4-chloro-2-methylphenoxyacetic acid (MCPA)) that have been found in groundwater, surface water, and in various parts of the world because of their poor biodegradability, low absorption coefficients in soil, and high solubility in water [12]. They are categorized as human carcinogens (Group 2B) by the International Agency for Research on Cancer (IARC) and are identified as relatively toxic by the World Health Organization (WHO) [13]. Due to their increasing use and their serious effects on human health and the environment, their effective removal from the environment is essential and important [4].
The removal of hazardous compounds from polluted water using clean and feasible technologies represents an important issue in research on water treatment [14]. Several methods can be used for herbicide removal from aqueous solutions, including biodegradation, photocatalytic degradation, adsorption, and electrochemical methods [4,15,16,17]. Adsorption is considered an attractive option for the depletion of phenoxy acetic herbicides because it is a simple, eco-friendly, and economical method [14]. The adsorption process is a surface phenomenon which depends on various factors such as the specific surface area and porosity of the adsorbent, the interaction types, and the number of active sites for adsorption [4]. Moreover, adsorption has advantages over other techniques for the treatment and reuse of polluted water due to its simplicity and flexibility in design, ease of operation, low initial cost, and insensitivity to toxic pollutants, and because it does not cause the formation of harmful materials [18].
The removal of pesticides from aqueous solutions is achieved through the use of various adsorbents, such as activated carbon (AC), polymeric adsorbents, fly ash, bioadsorbents, and inorganic adsorbents [4]. Carbon materials constitute the most widely used adsorbents in the removal of organic compounds from water [14]. The usage of AC in wastewater treatment has been established to be more effective and efficient compared to other adsorbent materials [19]. There are a wide variety of waste materials used for the production of effective AC [16,17,20,21,22,23]. The use of agricultural biomass wastes as ecological, cheap, and renewable sources can reduce greenhouse gas emissions while achieving sustainability in AC production [24]. The preparation of AC from biomass waste is considered necessary as it offers various environmental, economic, and sustainability benefits, such as waste valorization, resource efficiency, carbon sequestration, circular economy practices, reduced dependency on fossil fuels, environmental impact reduction, water and air purification, green chemistry and sustainable industry, diversification of feedstock sources, community and rural development, and maximization of benefits from agricultural residues [10]. Therefore, AC obtained from sustainable biomass resources has the advantages of low cost and eco-friendliness compared to that obtained from non-renewable sources such as coal. Table 1 presents a summary of previous studies on the preparation of AC from different biomass residues. Based on these studies, AC fabricated from wheat straw using KOH as an activation agent shows a high surface area, pore volume, and adsorption capacity [16,25,26]. Moreover, wheat straw is considered one of the most abundant biomass residues in different countries [26].
The solution pH, the ionic strength, and the presence of microorganisms represent the most important operational parameters that can affect adsorption capacity. The solution pH plays a crucial role in the adsorption processes, influencing the efficiency and effectiveness of adsorption for various pollutants [34]. The surface charge of an adsorbent material is highly dependent on the solution pH. Different adsorbents exhibit varying degrees of surface charge under different pH conditions. This charge affects the attraction or repulsion of charged species in the solution [16,17]. Moreover, the chemical speciation of both the adsorbate and the adsorbent is influenced by the solution pH. Changes in the solution pH can alter the forms of the adsorbate present in the solution, affecting their adsorption behavior [10]. Furthermore, ionic strength is a critical parameter in the adsorption processes, particularly in aqueous solutions [34]. It refers to the concentration of ions in a solution and is influenced by the concentration of electrolytes that are present. Ionic strength affects the electrostatic interactions between charged species, including between the adsorbate and the adsorbent. High ionic strength can shield electrostatic forces, reducing the impact of charge on the adsorption processes [10]. The presence of microorganisms in the adsorption processes can significantly influence the behavior and efficiency of these processes. Microorganisms, such as bacteria, fungi, and algae, can play both positive and negative roles in adsorption, depending on the specific conditions (contact time, solution pH, initial concentration, and concentration of microorganisms) and objectives of the processes [10].
Artificial neural networks (ANNs) have gained popularity as the method of choice for modeling and predicting a wide range of environmental issues [36,37,38]. They offer several advantages over traditional methods, including the capacity to learn intricate input/output relations, parallel computing, and generalization. ANN models have found success in environmental engineering applications, including for water resources and wastewater and water treatments [36]. To check the consistency between the projected and observed concentrations of important parameters, ANNs are widely used in a range of environmental applications [37,38]. Two factors contribute to the good performance of ANN modeling: first, it allows for theoretical analysis, and second, it provides a practical model for predicting the level of output parameters given similar input data. When used to analyze data to estimate the adsorption capacity based on the pollutant under study, carbon dose, initial concentration, pH, ionic strength, and presence of bacteria, ANN modeling is a less complex and faster method that yields good findings.
Numerous neural network techniques have been employed in recent research to forecast the adsorption processes for the removal of contaminants using different adsorbents [39,40,41,42,43]. The radial base function (RDB) is a common tool used in different studies to build neural networks; however, there are limited studies that have applied the RDB to predict adsorption processes and recommended its application for further research [39,40,41,42]. Table 2 shows some previous studies utilizing ANN modeling to predict adsorption processes, including RDB models.
Against this background, the main objective of the current study is to investigate the adsorption of the most common herbicides (2,4-D and MCPA) onto AC fabricated from wheat straw under different conditions, including different preparation, mixing, and washing methods. The adsorption of the fabricated AC was investigated through an analysis of the kinetics and isotherm processes, and then the effects of ionic strength and the solution pH on the yield of adsorption were analyzed. Moreover, the effects on 2,4-D and MCPA adsorption due to the presence of bacteria in the medium were also investigated. Furthermore, ANN modeling was applied to the experimental data using a radial basis function neural network (RBFNN) as an effective modeling method to achieve a reasonable match between the experimental and predicted adsorption capacities of the fabricated AC as the output based on six inputs (pollutant type, carbon dose, initial concentration of pollutant, solution pH, ionic strength, and presence of microorganisms).

2. Materials and Methods

The methodology of the current study is illustrated in Figure 1. It includes the following phases: Phase 1: characterization of raw wheat straw; Phase 2: characteristics of 2,4-D and MCPA; Phase 3: preparation of AC; Phase 4: characterization of AC; Phase 5: adsorption/bio-adsorption processes; and Phase 6: ANN modeling.

2.1. Reagents

All chemical reagents used in this study (sodium chloride (NaCl), potassium hydroxide (KOH), hydrochloric acid (HCl), silver nitrate (AgNO3), and hydrofluoric acid (HF)) were high-purity analytical-grade reagents provided by Sigma-Aldrich (Ontario, Canada). The solutions were made with ultrapure water provided by Millipore’s Milli-Q® machinery (manufacture, France). Table 3 displays the molecular sizes and physicochemical characteristics of 2,4-D and MCPA, which were calculated using the ChemIDplus advanced database. The species distribution and chemical composition of 2,4-D and MCPA are indicated in Figure 2. A UV-visible spectrophotometer (DRB200 Reactor 1 Block 9 × 16 MM/2 × 20 MM) (Colorado, USA) was used to measure the concentrations of 2,4-D and MCPA at 284 nm and 276 nm, respectively. Three measurement series per sample were taken, and the average value and standard deviation (SD) were calculated.

2.2. Preparation of AC

The wheat straw samples used to fabricate the AC were characterized according to our previous work [16]. The lignocellulose composition of the wheat straw showed a cellulose content of 37.50%, a hemicellulose content of 27.80%, and a lignin content of 18.40%. Moreover, a high content of volatile solids (86.70%) and a high carbon content (44.82%) were detected. These characteristics could enhance wheat straw’s ability to be converted into carbon materials [17]. Using a VIKING shredder with a power of 2500 W (GE150) (Buttington, UK), the wheat straw was shredded to small pieces (about 4 mm), rinsed to eliminate any contaminants, and subsequently dried at 105 °C.
The dried wheat straw samples were combined with KOH in a weight-to-weight impregnation ratio of 1:1 (wheat straw: KOH) using two different preparation techniques (origination (O) and carbonization (C)). All samples were pyrolyzed under N2 (Q = 300 cm3/min) at 300 °C for 2 h and then at 800 °C for 1 h at a heating rate of 10 °C/min when using the O preparation technique. When using the C preparation method, the same procedure used in the O preparation method was followed by pyrolyzing the raw samples of wheat straw under N2 at 350 °C for 2 h at a heating rate of 10 °C/min. The raw samples obtained from both methods (O and C) were mixed with KOH in a liquid state (L) (mixing with KOH in a liquid phase for 48 h at 60 °C) or in a solid state (S) (mixing with KOH in a solid phase). After removing KOH from the acquired AC using 0.10 M of HCl, the samples were rinsed with distilled water till chloride ions could no longer be seen using 0.10 M AgNO3 solution. Finally, the AC was washed with HF (W) or left unwashed (U), and all samples were dried for 24 h at 105 °C.
The most crucial procedure for producing useful and statistically significant models of material fabrication when carrying out a minimal number of carefully planned experiments is multivariate analysis. The design of the experiment (DOE) reveals the significance of each variable and how they interact. Consequently, a two-level full factorial design was created using the Statistica software version 8 to examine the impacts of the preparation procedures (O or C), mixing states (L or S), and washing (W or U) (Table 4). Equation (1), therefore, is a polynomial regression equation that determines the two-way interaction effects of the three predictor variables, namely, the preparation procedure (P), mixing state (M), and washing (W):
Z = β 0 + β 1 P + β 2 W + β 3 M + β 4 P × W + β 5 P × M + β 6 M × W
where Z is the carbon characteristic as a response to the predictor variables’ effects and βi (i = [0, 6]) represents the regression coefficients, which are helpful in creating the relationships between the property response and the predictor variables.
The surface area, oxygen surface groups, pH of the point of zero charge (pHpzc), and pore-size distribution were measured for all AC samples. The measuring processes have already been described in detail in previous publications [20,21]. Three measurement series per sample were taken, and the average value and SD were calculated.

2.3. Adsorption Processes

2.3.1. Adsorption Kinetics

An AC mass of 25, 50, or 100 mg was added to 200 mL Erlenmeyer flasks containing 100 mg/L of the starting concentration of 2,4-D or MCPA. The adsorption kinetics were studied to determine the best AC sample. Without any additions, the pH of the solution was maintained in its natural state. In a previous research study by Abdel daiem et al. [17], the kinetics processes were explained in more detail. The equations for the kinetic models, shown in Equations (2) and (3), correspond to common adsorption kinetic models:
q = q pred , 1 ( 1 e k 1 t )
q = q pred , 2 2 k 2 t 1 + q pred , 2 k 2 t
where q is the adsorption yield in mmol/g; qpred,1 is the adsorption yield predicted from the first-order kinetic model in mmol/g; qpred,2 is the adsorption yield predicted from the second-order kinetic model in mmol/g; k1 is the adsorption rate of the first-order kinetic model in L/h; k2 is the constant of the second-order kinetic model in g/mmol/h; and t is the time in h.
Both kinetic models are utilized to compute the average absolute percentage deviations using Equation (4):
% D = 1 N i = 1 N | q exp q pred q exp | × 100 %
where %D is the deviation percentage; N is the experiment number; qexp is the experimental adsorption yield in mmol/g; and qPred is the predicted adsorption yield in mmol/g.

2.3.2. Adsorption Isotherm

The initial 2,4-D or MCPA concentrations used to estimate the adsorption isotherms of the best AC sample were 50, 100, 200, 300, 400, and 500 mg/L. Equations (5)–(7) reflect the Langmuir, Freundlich, and Prausnitz–Radke adsorption isotherm models. These models are considered the most popular models for the adsorption process and can be used to establish the adsorption type and mechanism:
X eq = BX m C e 1 + BC e
X eq = K F C e 1 nF
q = aC A 1 + bC A β
where Xeq is the adsorption yield (mmol/g); Xm is the capacity for adsorption (mmol/g); B is the Langmuir yield constant (L/mg); Ce is the equilibrium concentration of the pollutant (mmol/L); 1/nF is the heterogeneity of the AC surface; KF is the relative capacity for adsorption; and a (L/g), b (Lβ/mmolβ), and β are the constants.

2.3.3. Operational Parameters

A number of factors including the pH (3, 5, 7, and 10) and the presence of electrolytes (0 to 0.01 M of NaCl) at the initial concentration of 500 mg/L of 2,4-D or MCPA and the same temperature (25 °C) were examined in relation to the adsorption isotherm and the presence of the best AC sample.
An extended aeration tank at the Al-Jouf Wastewater Treatment Plant was used to seed microorganisms into the unfiltered effluent water samples in order to determine the adsorption isotherms in the presence of bacteria (bio-adsorption). In a nutshell, a dehydrated culture medium, Tryptone Soy Broth (Difco Lab), was used to grow a 1 mL unfiltered sample for three days at 37 °C with a little agitation (45 rpm). To recover the cells, the sample was centrifuged for 15 min at 4000 rpm. Then, 50 mL of sterile distilled water was used to re-suspend the cells after washing the sediment three times with sterile water. After adding 5 mL of bacterial suspension with an absorbance range of 0.08–0.11 at 520 nm and 0.07–0.10 at 600 nm to each flask holding the best AC sample, the adsorption isotherms of 2,4-D and MCPA were attained as previously described. Some bacteria were adsorbed on the AC sample in the bio-adsorption trials. Using a LEO GEMINI-1530 high-resolution electron microscope (Carl Zeiss) (Wetzlar, Germany), scanning electron microscopic (SEM) images of the AC sample were taken after 2,4-D or MCPA bio-adsorption to validate the bio-adsorption process.

2.4. Artificial Neural Networks

Figure 3 shows the RBFNN used in this study, which includes three layers and three levels. The input layer is the one from which the inputs of the model are derived. These inputs were obtained from an analysis of the slope angles and locations for various cutoff wall positions. Based on the uplift pressure, seepage, and exit hydraulic gradient in the static state, the most effective location and the impacts of the slope angle on limiting leachate discharge were estimated. The input for each hidden layer was computed based on Equation (8), where y is the number of neurons in the hidden layer, k is the number of inputs, wxy is the weight from input x to neuron y, and by is the bias for neuron y. The radbas equation (Equation (9)) was used to compute the value of neurons with a specific level of activity in the hidden layer, and a PC with a 2.8 GHz core i5 processor and 8 GB of RAM was used to train the models under study. The ANN Toolbox in Matlab R2020a was used for the simulation.
n y = x = 1 k i x   w x y + b y
r a d b a s ( n ) = e ( n 2 )
The neural output is often expressed as in Equation (10). Obtaining the optimal weights and biases for the connections between the network’s layers is the aim of network training.
O p = f ( y = 1 m h y   w y + b o u t )
Here, Op is the predicted output, (wy) indicates the connection weight between the y-th neuron in the preceding layer, (hy) is the output from the hidden neuron y, and (bout) is a bias for the output layer.
The RBFNN-based prediction model’s training process is depicted in the flowchart shown in Figure 4. A training group of 70%, a validation group of 15%, and a test group of 15% were randomly selected from the data samples. In many different applications, the test criterion for neural network models often falls between 70 and 30 percent. This criterion has been extensively utilized in other research with related objectives [36]. A set of weights and biases for each randomly chosen connection were used to train the RBFNN-based model. The R-squared coefficient (R2, calculated using Equation (11)) and the root mean square error (RMSE, calculated using Equation (12)) were used to assess the model’s performance. The equations are as follows:
R 2 = 1 i = 1 N ( T i O i ) 2 i = 1 N ( T i T ¯ ) 2
R M S E = 1 N i = 1 N ( T i O i ) 2
where T i is the targeted value (i.e., the experiment’s outcome), T ¯ is the average of the target values, and O i is the model output, considering the sample size (training, validation, or testing). The monitoring of model behavior and the prevention of overfitting were achieved by computing the RMSEs for both the training and validation sets. Upon completion of the training phase, the RMSE of the test set was calculated. All of this was performed a predefined number of times in order to find the usual behavior of the model.

3. Results and Discussion

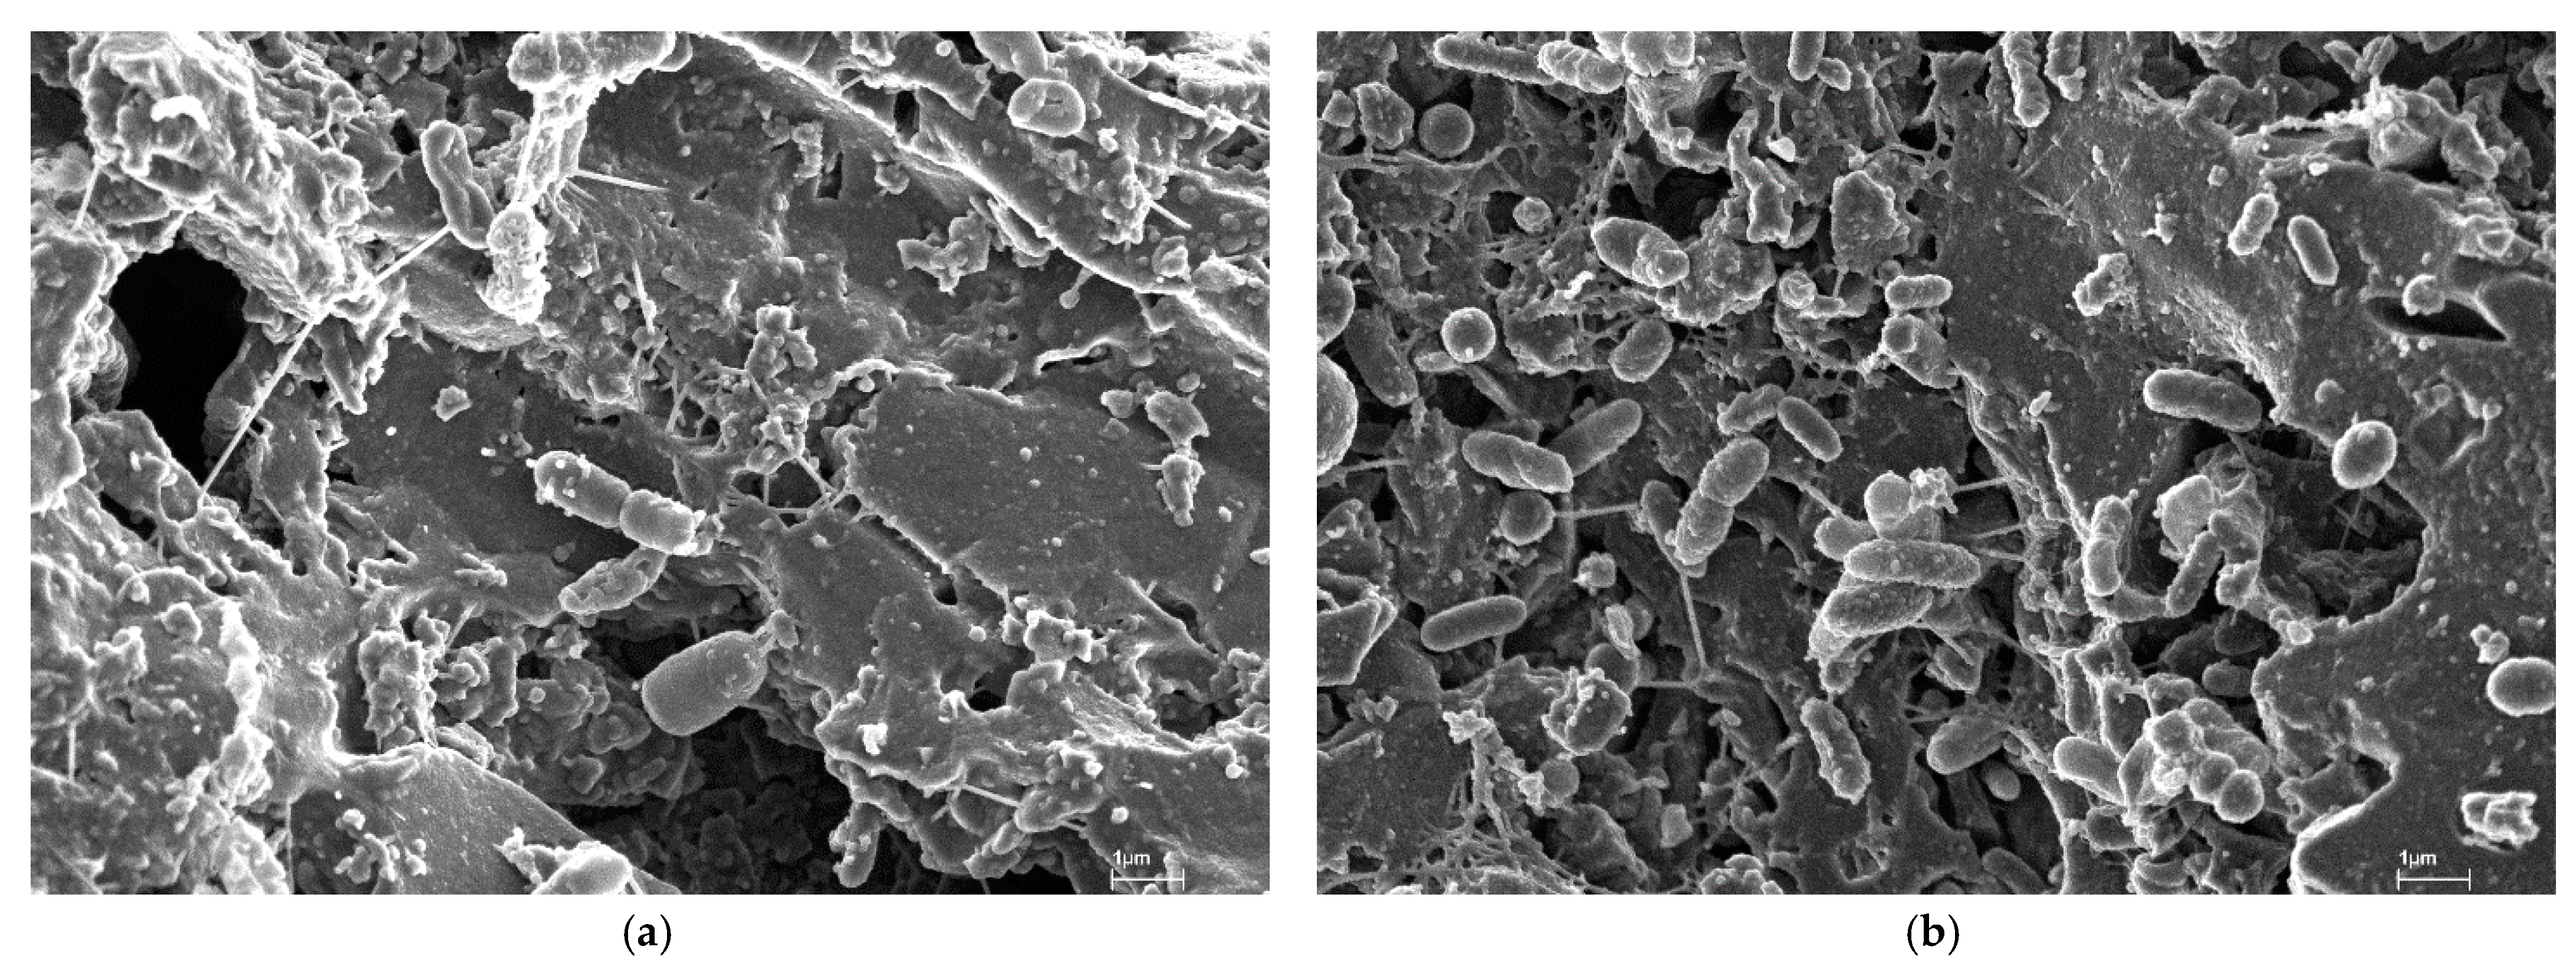
3.1. Characteristics of Activated Carbon

The textural and chemical features of the fabricated AC are displayed in Table 5. The CLW has the largest surface area (1437 ± 2.52 m2/g), the greatest micropore volume (W0) obtained via N2 adsorption (0.60 ± 0.06 cm3/g), and a high value of micropore volume (W0) obtained via CO2 adsorption (0.43 ± 0.02 cm3/g). Although W0 (CO2) is not the highest, the mean width of micropores (L0) after N2 and CO2 adsorption is considered large (1.20 ± 0.02 nm and 0.70 ± 0.02 nm, respectively). For CLW, the pHpzc is 3.10 ± 0.05, indicating that it has an acidic chemical character, which is supported by the fact that there are many acidic groups (7.02 ± 0.08 meq/g) and very few basic groups (0.02 ± 0.02 meq/g).
Because surface area represents the most critical parameter in the adsorption process, the surface area variation in the fabricated AC is illustrated in Figure 5. The O preparation method yielded the highest surface area in the case of L mixing; moreover, no significant difference was detected between the W and U processes (Figure 5a). This may be attributed to the liquid-phase activation, which allows for a controlled and uniform distribution of the activating agent throughout the precursor material, thereby contributing to the creation of well-defined pore structures [49,50]. In the case of the C preparation method, a high surface area was obtained with the W process (Figure 5b), which was higher than that obtained using the O method (Figure 5). This may be attributed to the lower moisture content, higher thermal stability, and higher carbon content of the material after using the C method compared to the O method. The W samples had a higher surface area than that of the U samples because the interaction between HF and carbon was stronger with the use of the C method with the use of the O method, which increased the surface area and the pore volume as well [51,52]. The volume and width of micropores are considered the most essential parameters after surface area in the adsorption process. Table 6 displays the coefficients of regression for the surface area and the micropore volume and mean width of the fabricated AC. It is clear that all parameters have a high goodness of fit (R2), with values of 0.98, 0.97, and 0.95, respectively. Based on these findings, the CLW carbon was selected to investigate the adsorption kinetics and isotherm to remove 2,4-D and MCPA from aqueous solutions.

3.2. Adsorption Kinetics

The adsorption kinetics of the first- and second-order kinetic models are shown in Figure 6 for 2,4-D and MCPA. Additionally, Table 7 displays the values of the constants from the adsorption kinetic models that were computed using the Statistica software (version 7). The second-order kinetic model more closely matched the experimental data than the first-order kinetic model, with a lower %D for 2,4-D. However, the first-order kinetic model was more fitted for MCPA, except in the case of using 50 mg of carbon, which was more fitted by the second-order kinetic model. Furthermore, the predicted adsorption equilibrium calculated by the second-order model agreed with the results of the experiment data. Moreover, the adsorption rate was higher in the case of 2,4-D compared to MCPA because 2,4-D has a lower molecular size, which accelerates its adsorption rate compared to that of MCPA. Additionally, the kinetic constants for the majority of the tests increased as the carbon mass increased. This could mean a larger quantity of the adsorbent material would lead to a faster or more effective removal of the adsorbate from the solution. This indicates that increasing the amount of carbon material enhances the adsorption rate [16,17]. Thus, 100 mg of carbon was selected as the carbon mass for further experiments.

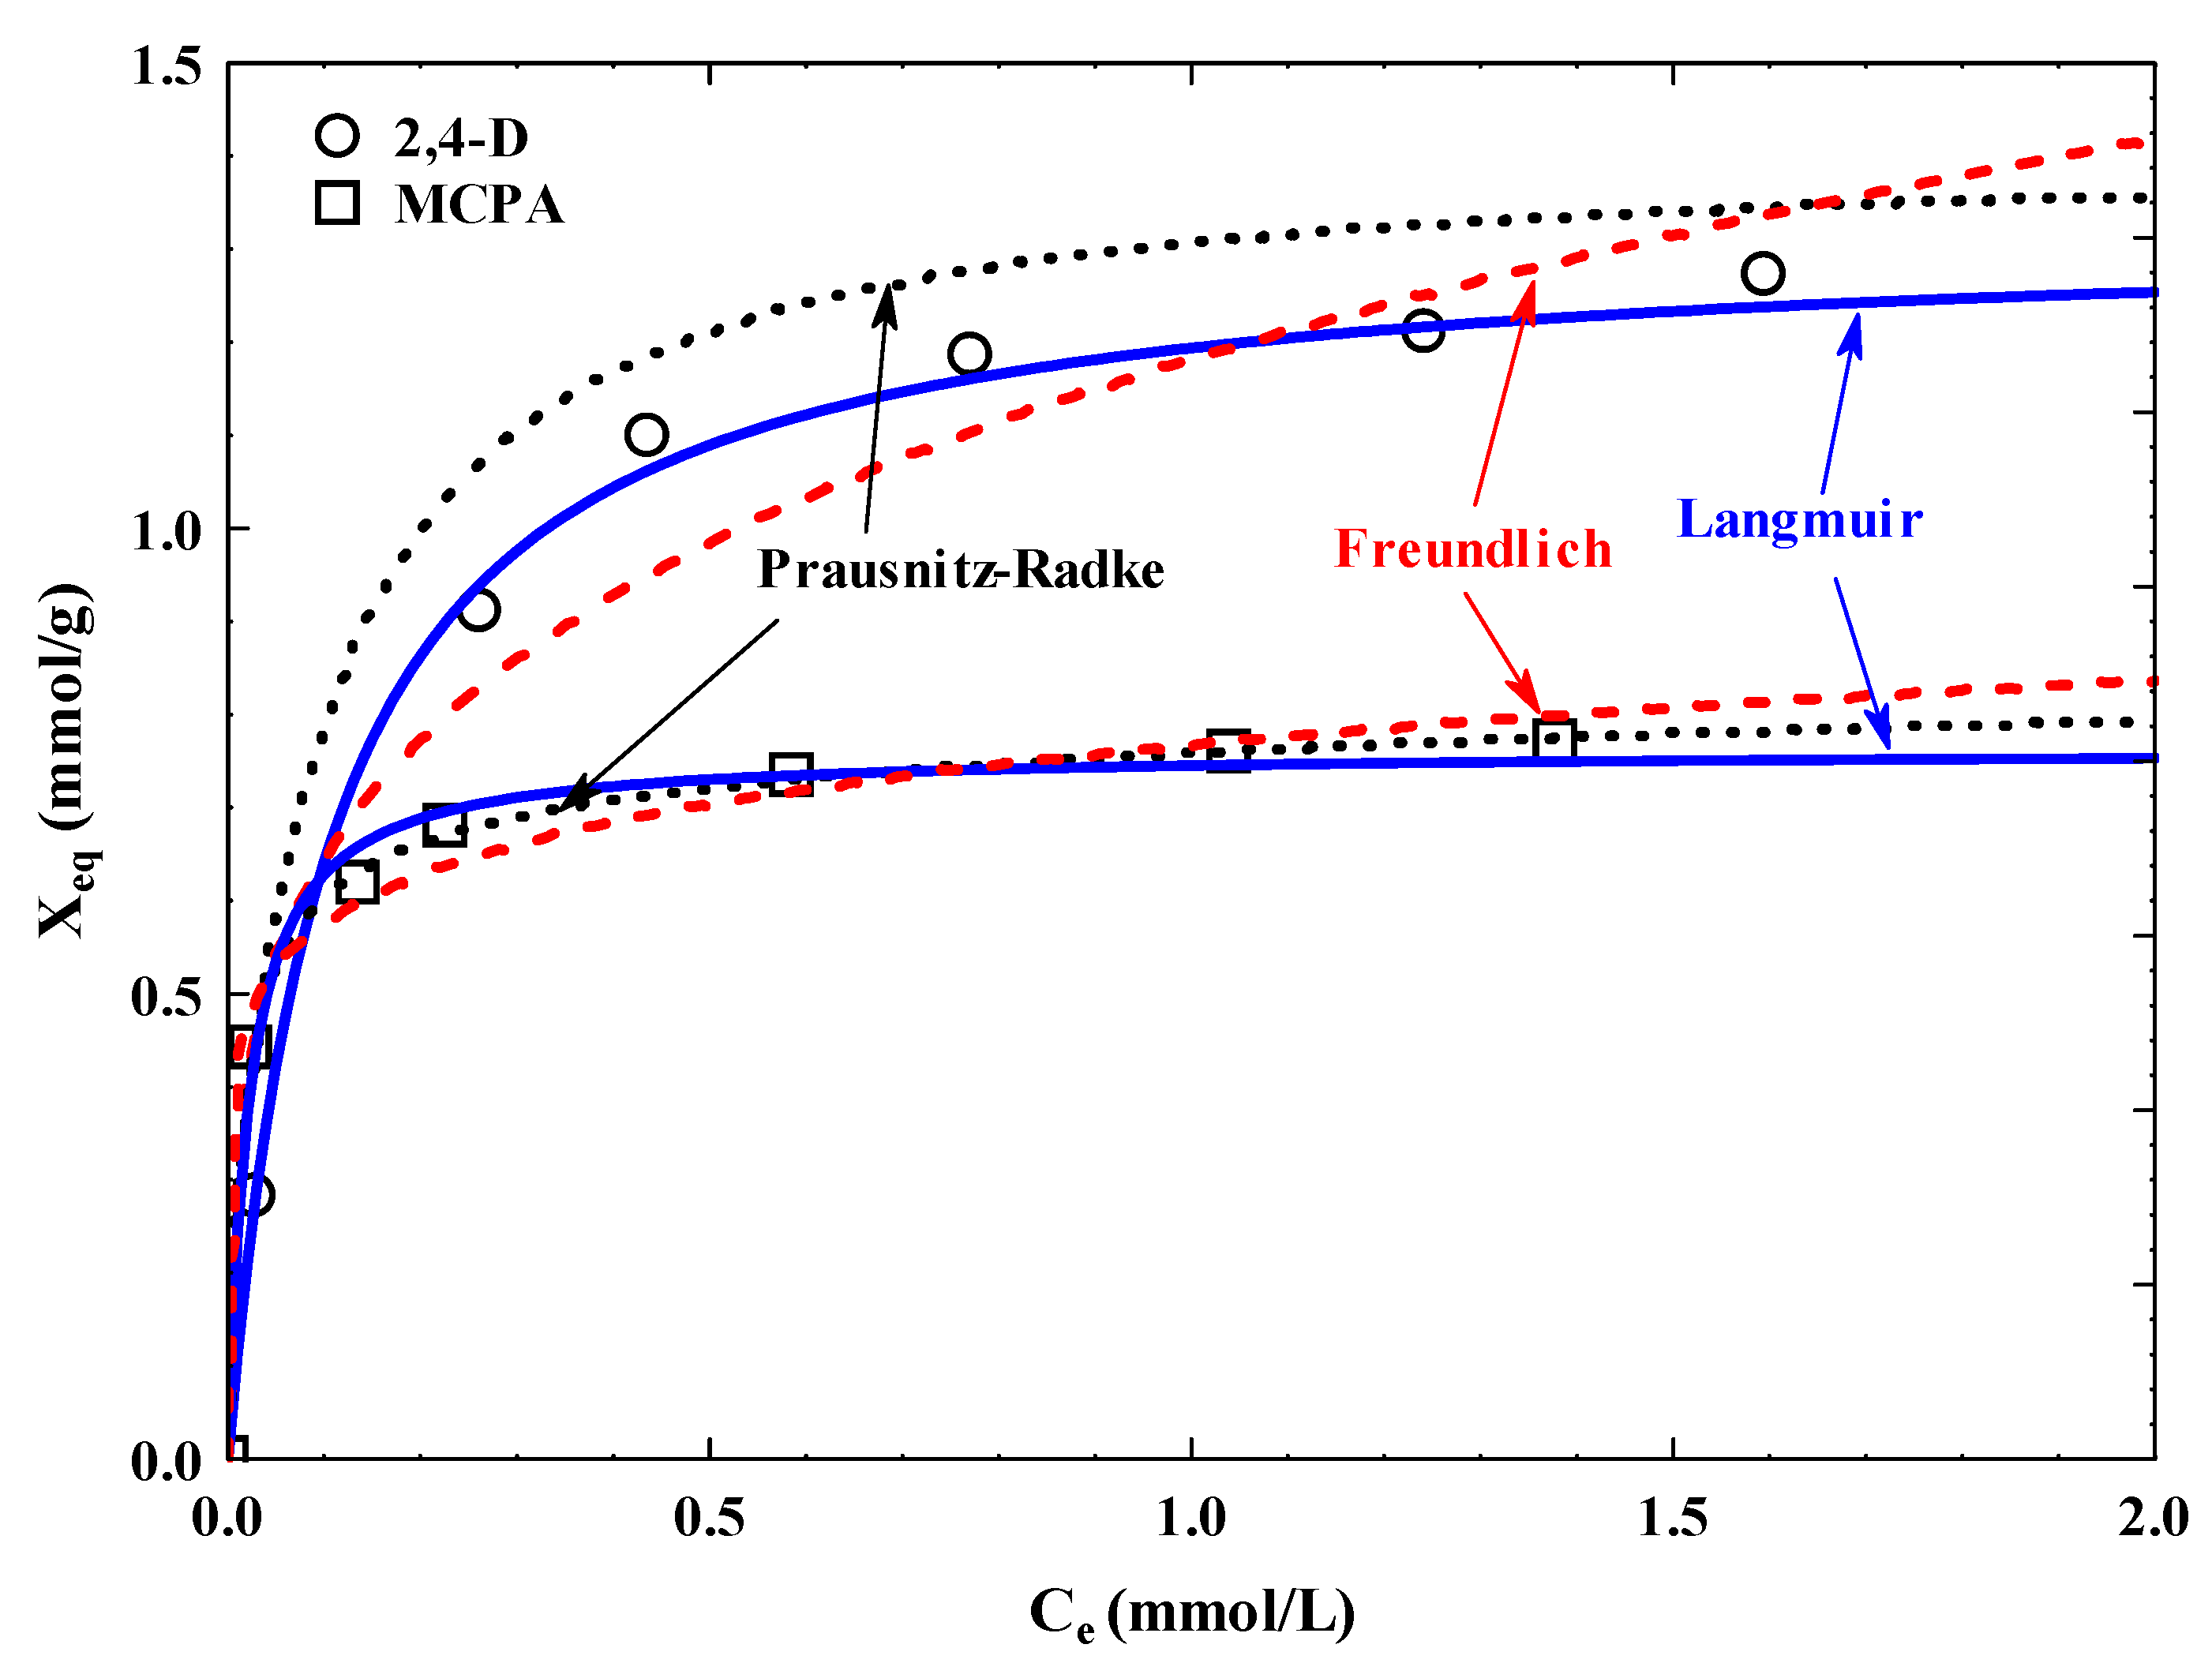
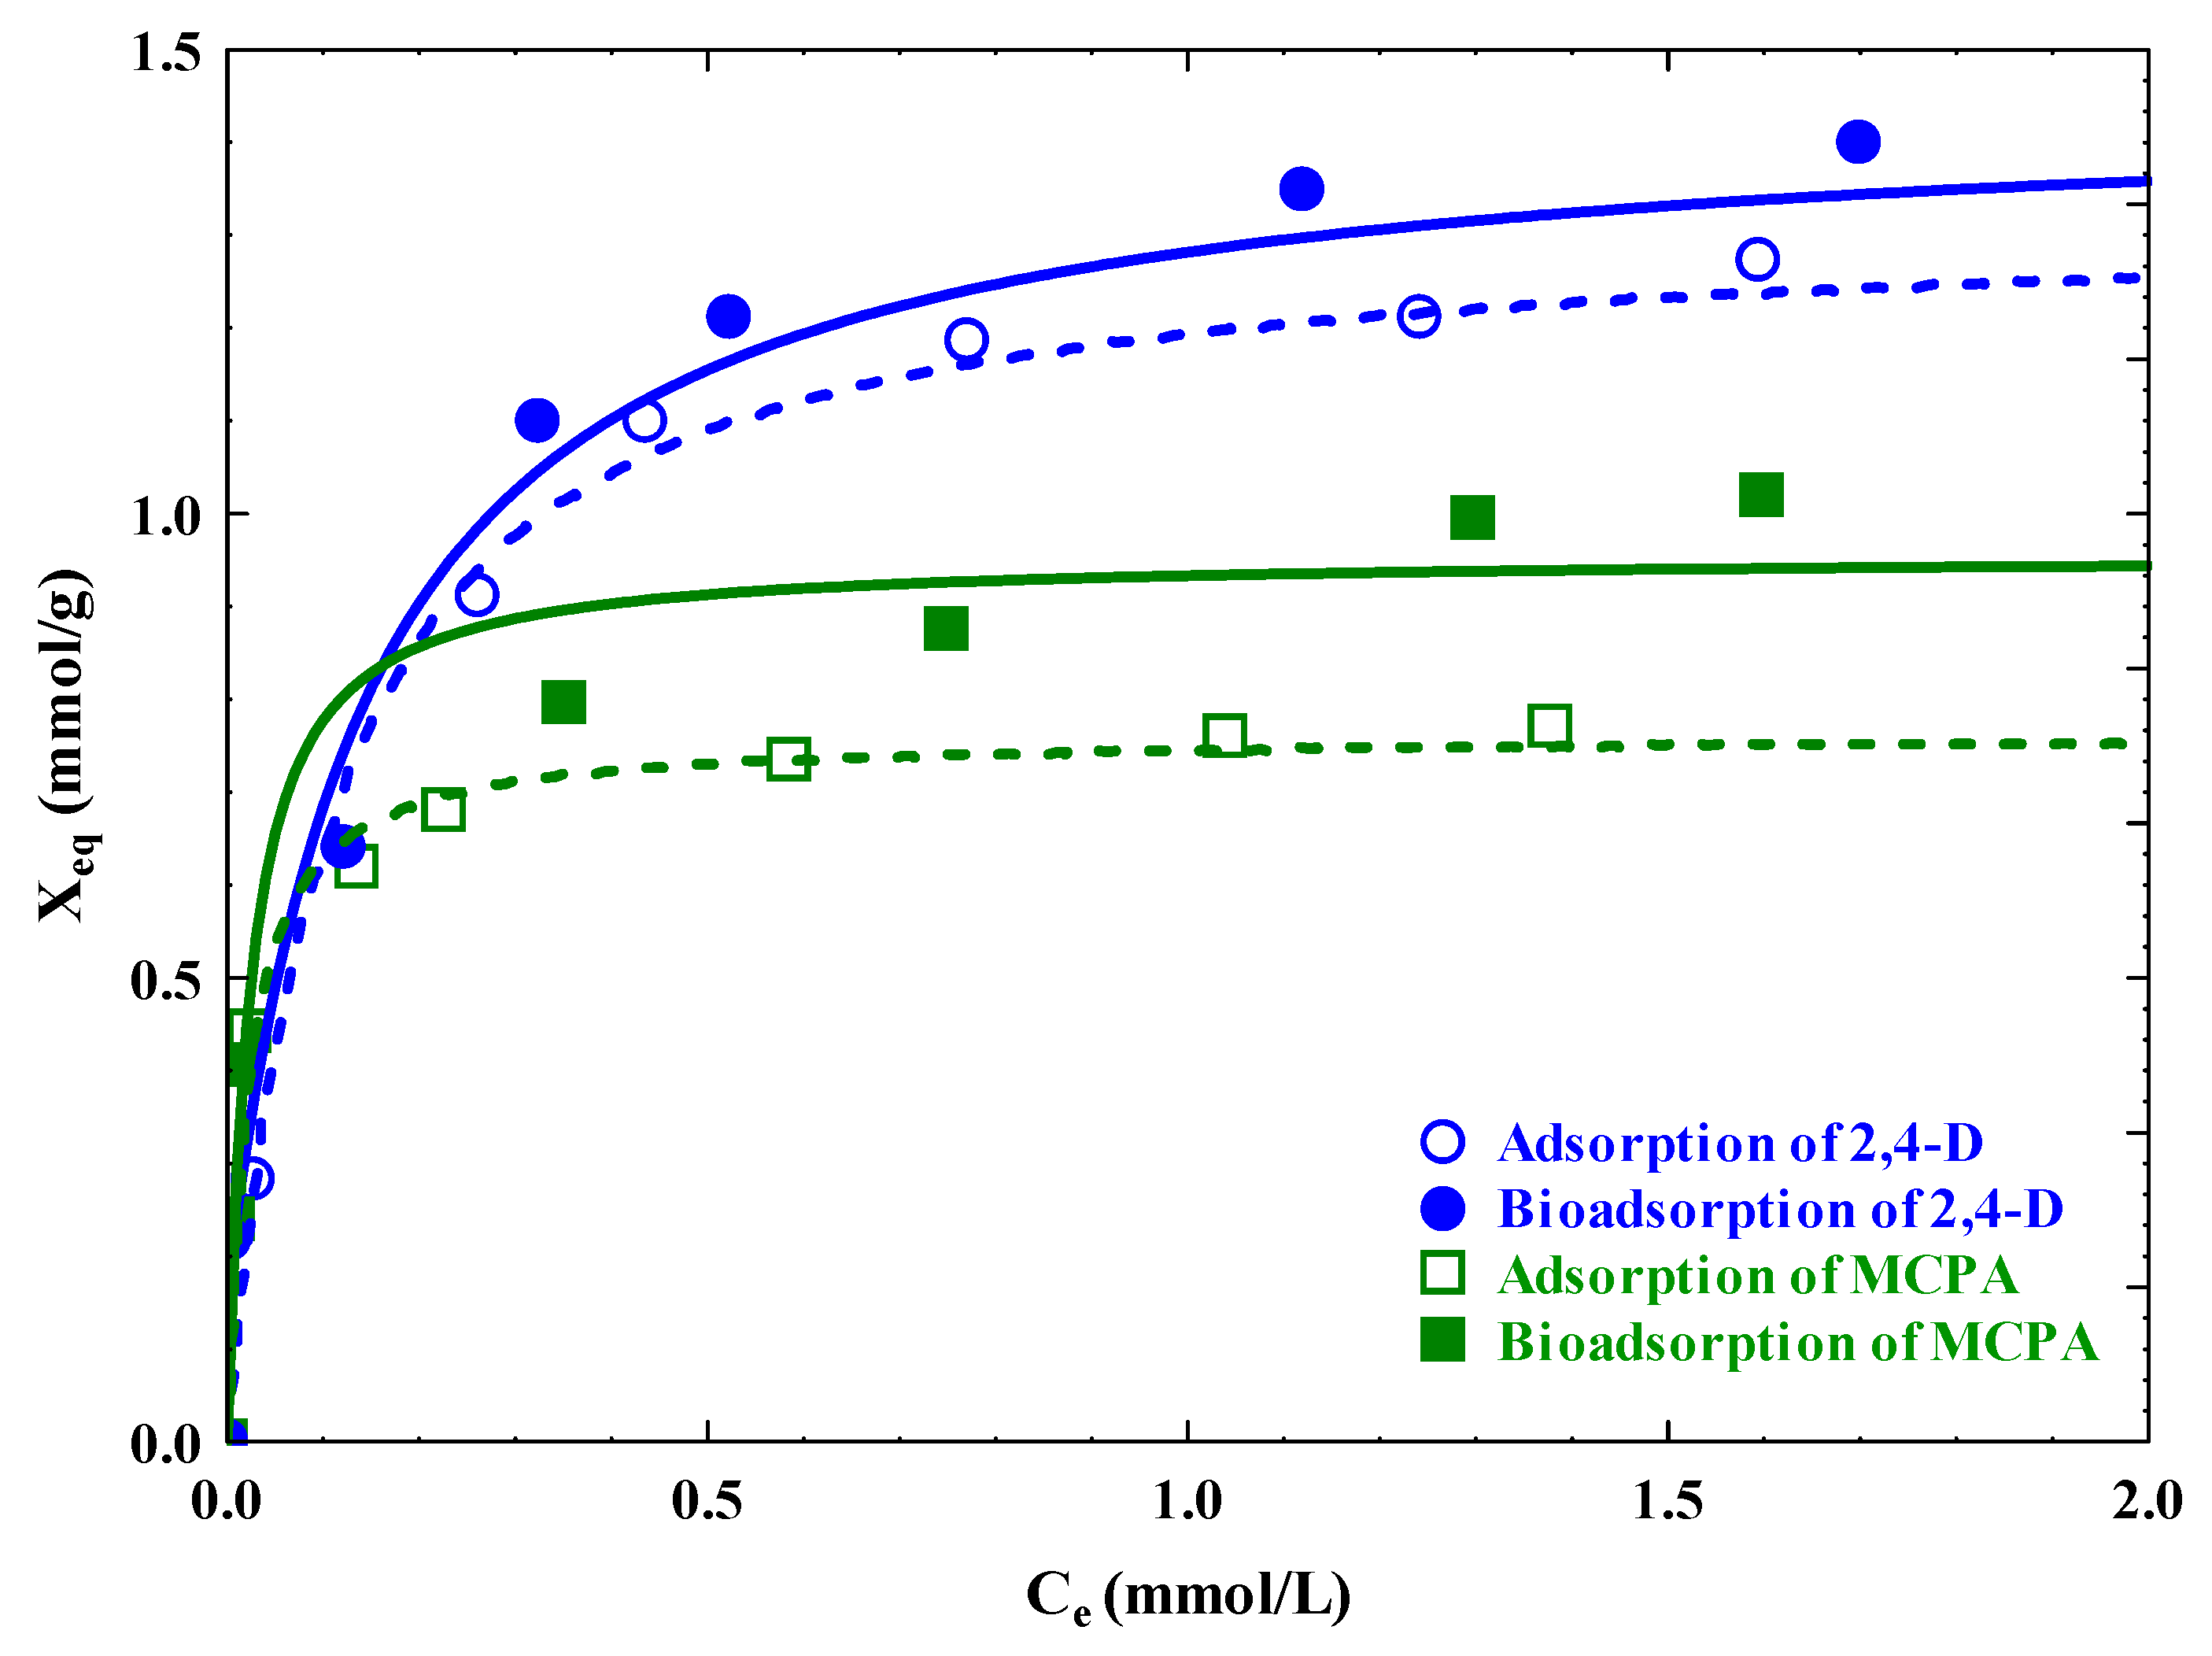
3.3. Adsorption Isotherms

Figure 7 shows the adsorption isotherms of MCPA and 2,4-D onto CLW at pH ≈ 3.5 and T = 25 °C. According to Giles classification, both adsorption isotherms exhibited L-behavior [15,16], which means that a concave curve is produced when there is a decrease in the ratio between the residual concentration of both contaminants in the aqueous solution and their adsorbed quota onto CLW. Additionally, such a behavior demonstrated a strong affinity between the molecules of the adsorbate and the surface of the adsorbent. Moreover, it verified that the two aromatic rings connected to both pollutants were adsorbed parallel to the surface of the AC [16,17,18].
Langmuir, Freundlich, and Prausnitz–Radke isotherm models were applied to the obtained experimental data. The Langmuir model had a slightly better fit than the Prausnitz–Radke model to the adsorption data of 2,4-D, with %D of 2.07 and 2.37, respectively, whereas the Freundlich model showed a high %D (40.96), which means the adsorption mechanism of 2,4-D onto CLW was monolayer adsorption. However, in the adsorption of MCPA, the Prausnitz–Radke model closely fitted the experimental data (%D of 0.87), followed by the Langmuir model (%D of 3.08) and Freundlich model (%D of 4.47), which means the adsorption of MCPA onto CLW showed both mono- and multilayer adsorption. This is supported by the fact that 2,4-D had a higher adsorption capacity (Xm) (1.32 mmol/g) than MCPA (0.76 mmol/g). According to Table 8, 2,4-D had a higher adsorption capacity per area (X′m = 9.19 mmol/m2/g) than MCPA (5.29 mmol/m2/g). This is because the molecular size of 2,4-D is smaller than that of MCPA. For 2,4-D and MCPA, the relative adsorbent–adsorbate affinity (BXm) was 12.46 L/g and 35.99 L/g, respectively. This is in line with recent findings regarding the adsorption of aromatic chemicals and similar pollutants [16,17,18]. However, the relative adsorption yield (KF) of 2,4-D (1.18 L/g) was higher than that of MCPA (0.77 L/g).

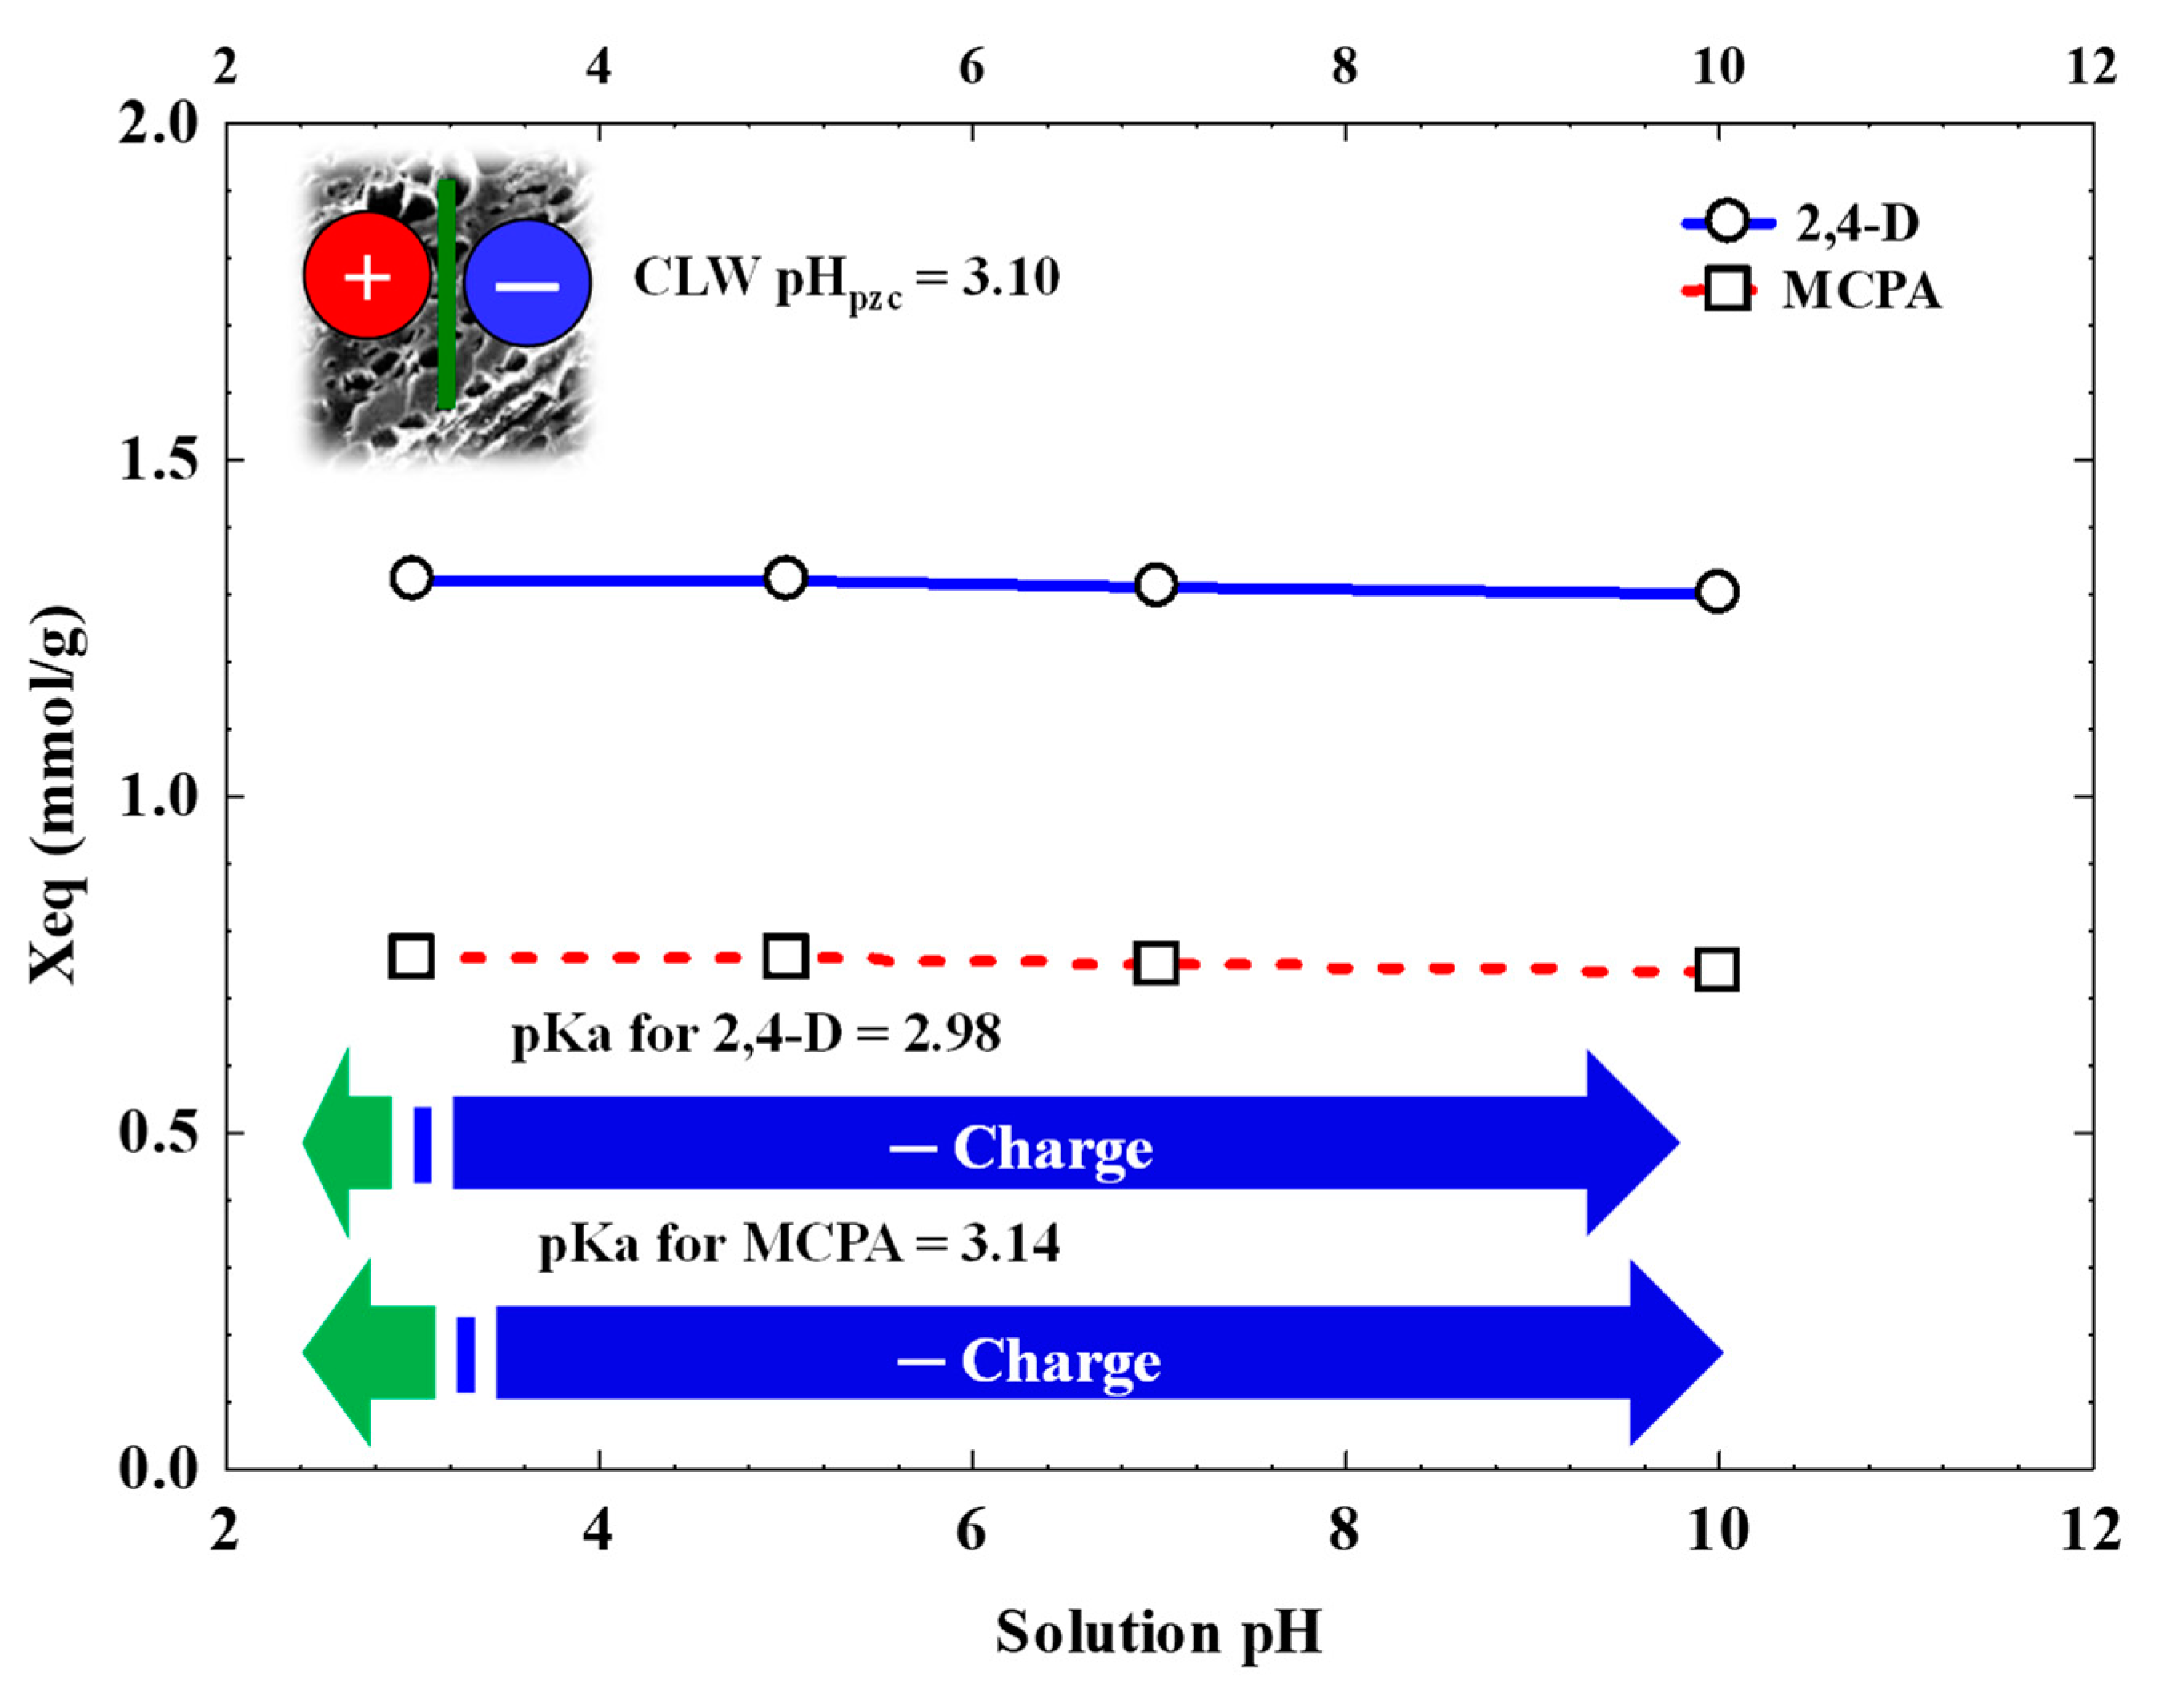
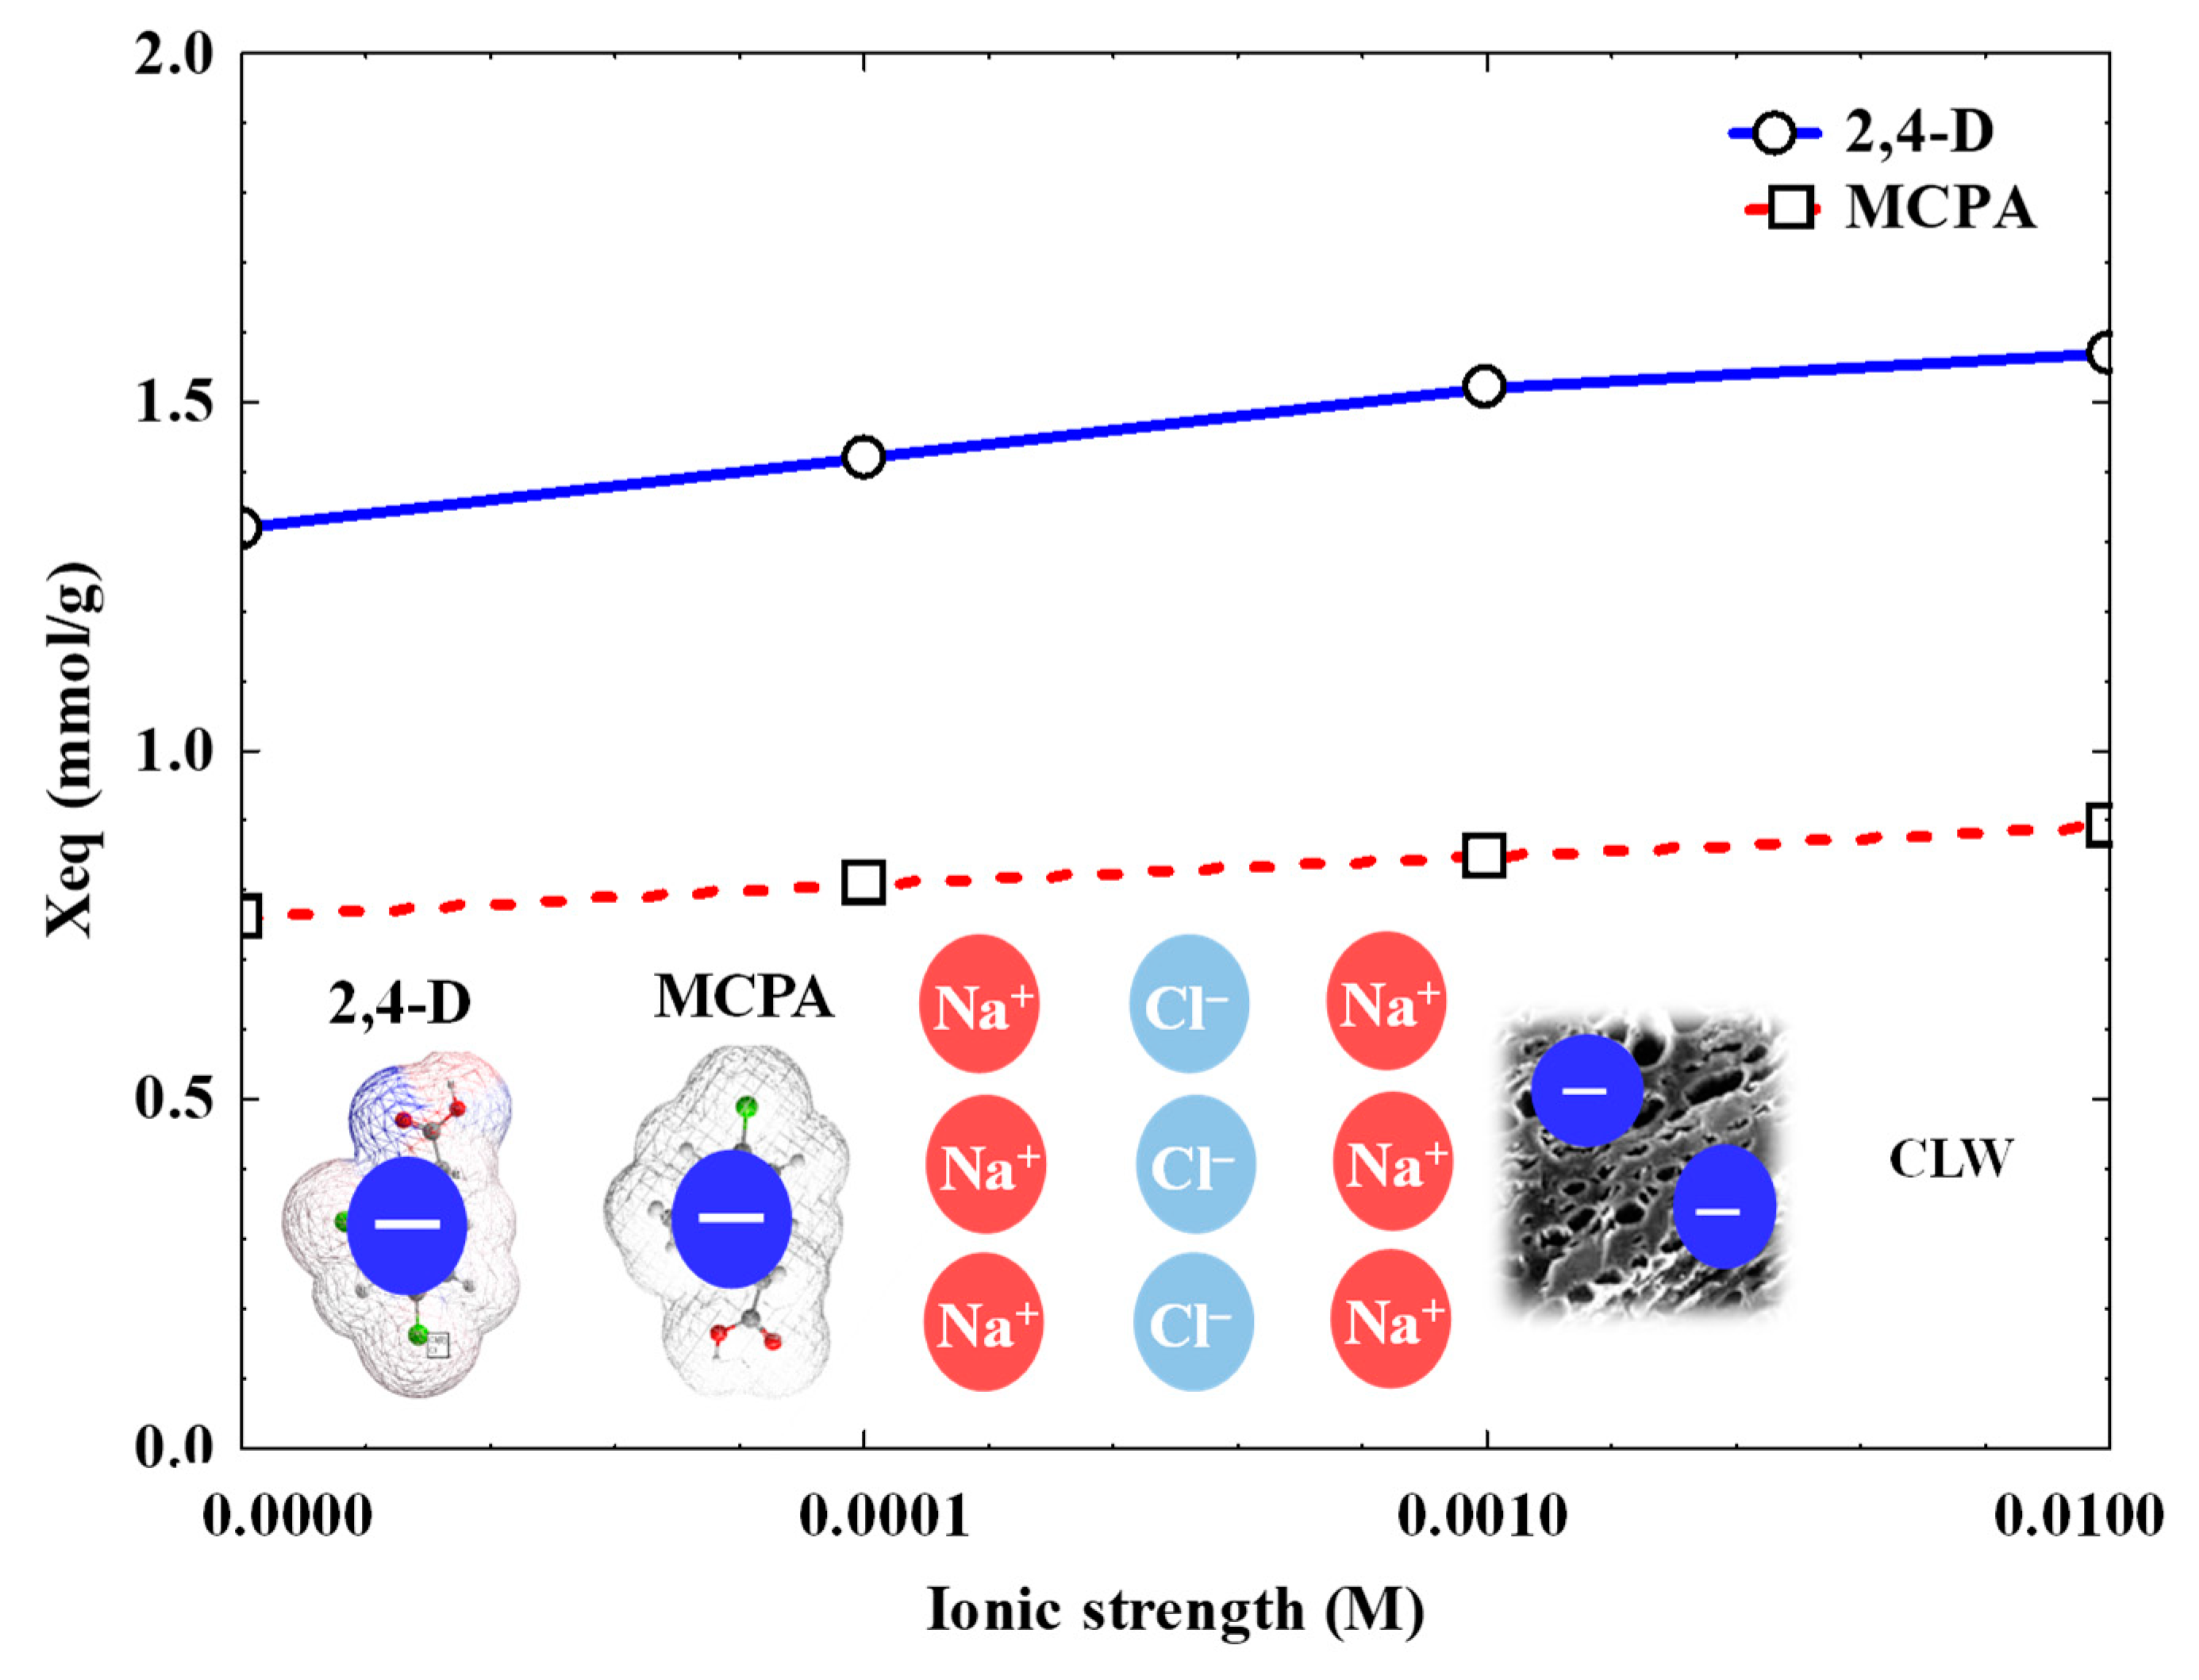
3.4. Influence of Operational Variables

Figure 8 illustrates the influence of solution pH on the adsorption of both contaminants onto CLW. As observed, solution pH had no discernible effect on the adsorption capacity. For both contaminants, the adsorption capacity was constant at different solution pH levels. Solution pH can affect the surface charge of AC and the species distribution of contaminants. At a solution pH greater than 3.10, the CLW carbon exhibited a negative charge density in the adsorption of 2,4-D and MCPA. At solution pH values greater than 2.98 and 3.14, there was a larger density of negative charges in the species distribution of 2,4-D and MCPA. This indicates that the electrostatic interactions between the adsorbent and the adsorbate are crucial to the adsorption procedure onto CLW and are unaffected by solution pH as there is no clear correlation between the changes in pH and the changes in the efficiency or extent of adsorption.
Figure 9 shows the outcomes of 2,4-D and MCPA adsorption onto CLW when NaCl ions are present in varied concentrations (0.0 to 0.01) at a solution pH of approximately 3.5. As shown in the figure, the elimination of 2,4-D and MCPA was significantly influenced by the ionic strength of the solution. The presence of NaCl ions was found to increase the adsorption of both pollutants. This is explained by the fact that MCPA and 2,4-D have negative net charges in their molecular forms at a solution pH of 3.5, and the AC also has a negative charge at the same solution pH. Because of the screening effect (a phenomenon in which ions in a solution surround and shield the charges on other ions, thereby reducing their mutual electrostatic attraction), the presence of NaCl ions promotes the adsorbent–adsorbate interactions [15,16].
The 2,4-D and MCPA bio-adsorption isotherms onto CLW in the presence and absence of microorganisms are shown in Figure 10. The Langmuir equation was applied to these isotherms and revealed that the presence of microorganisms during the adsorption process improved the adsorption capacity of CLW by 17% and 32% for 2,4-D and MCPA, respectively. These results may be attributed to the surfaces of microorganisms, such as bacteria or fungi, which often contain functional groups (e.g., hydroxyl, carboxyl, and amino) that can act as adsorption sites for certain pollutants or ions. Moreover, Abdel daiem et al. [17] reported the following changes in the chemical and textural characteristics of AC caused by microorganism adsorption: (i) a decreased external surface area because of pore blocking and (ii) a decrease in the pHPZC value, which increases the density of negative charges on the AC surface. Additionally, as phospholipids make up the outer layer of bacteria [17], their adsorption onto an AC improves the carbon surface’s hydrophobicity, which greatly facilitates the adsorption of micro-pollutants in the aqueous phase such as 2,4-D and MCPA. Additionally, extracellular polymeric compounds are generated by bacteria on the AC, which improves the adsorption process and increases the adsorption capacity of the carbon material (Figure 11).

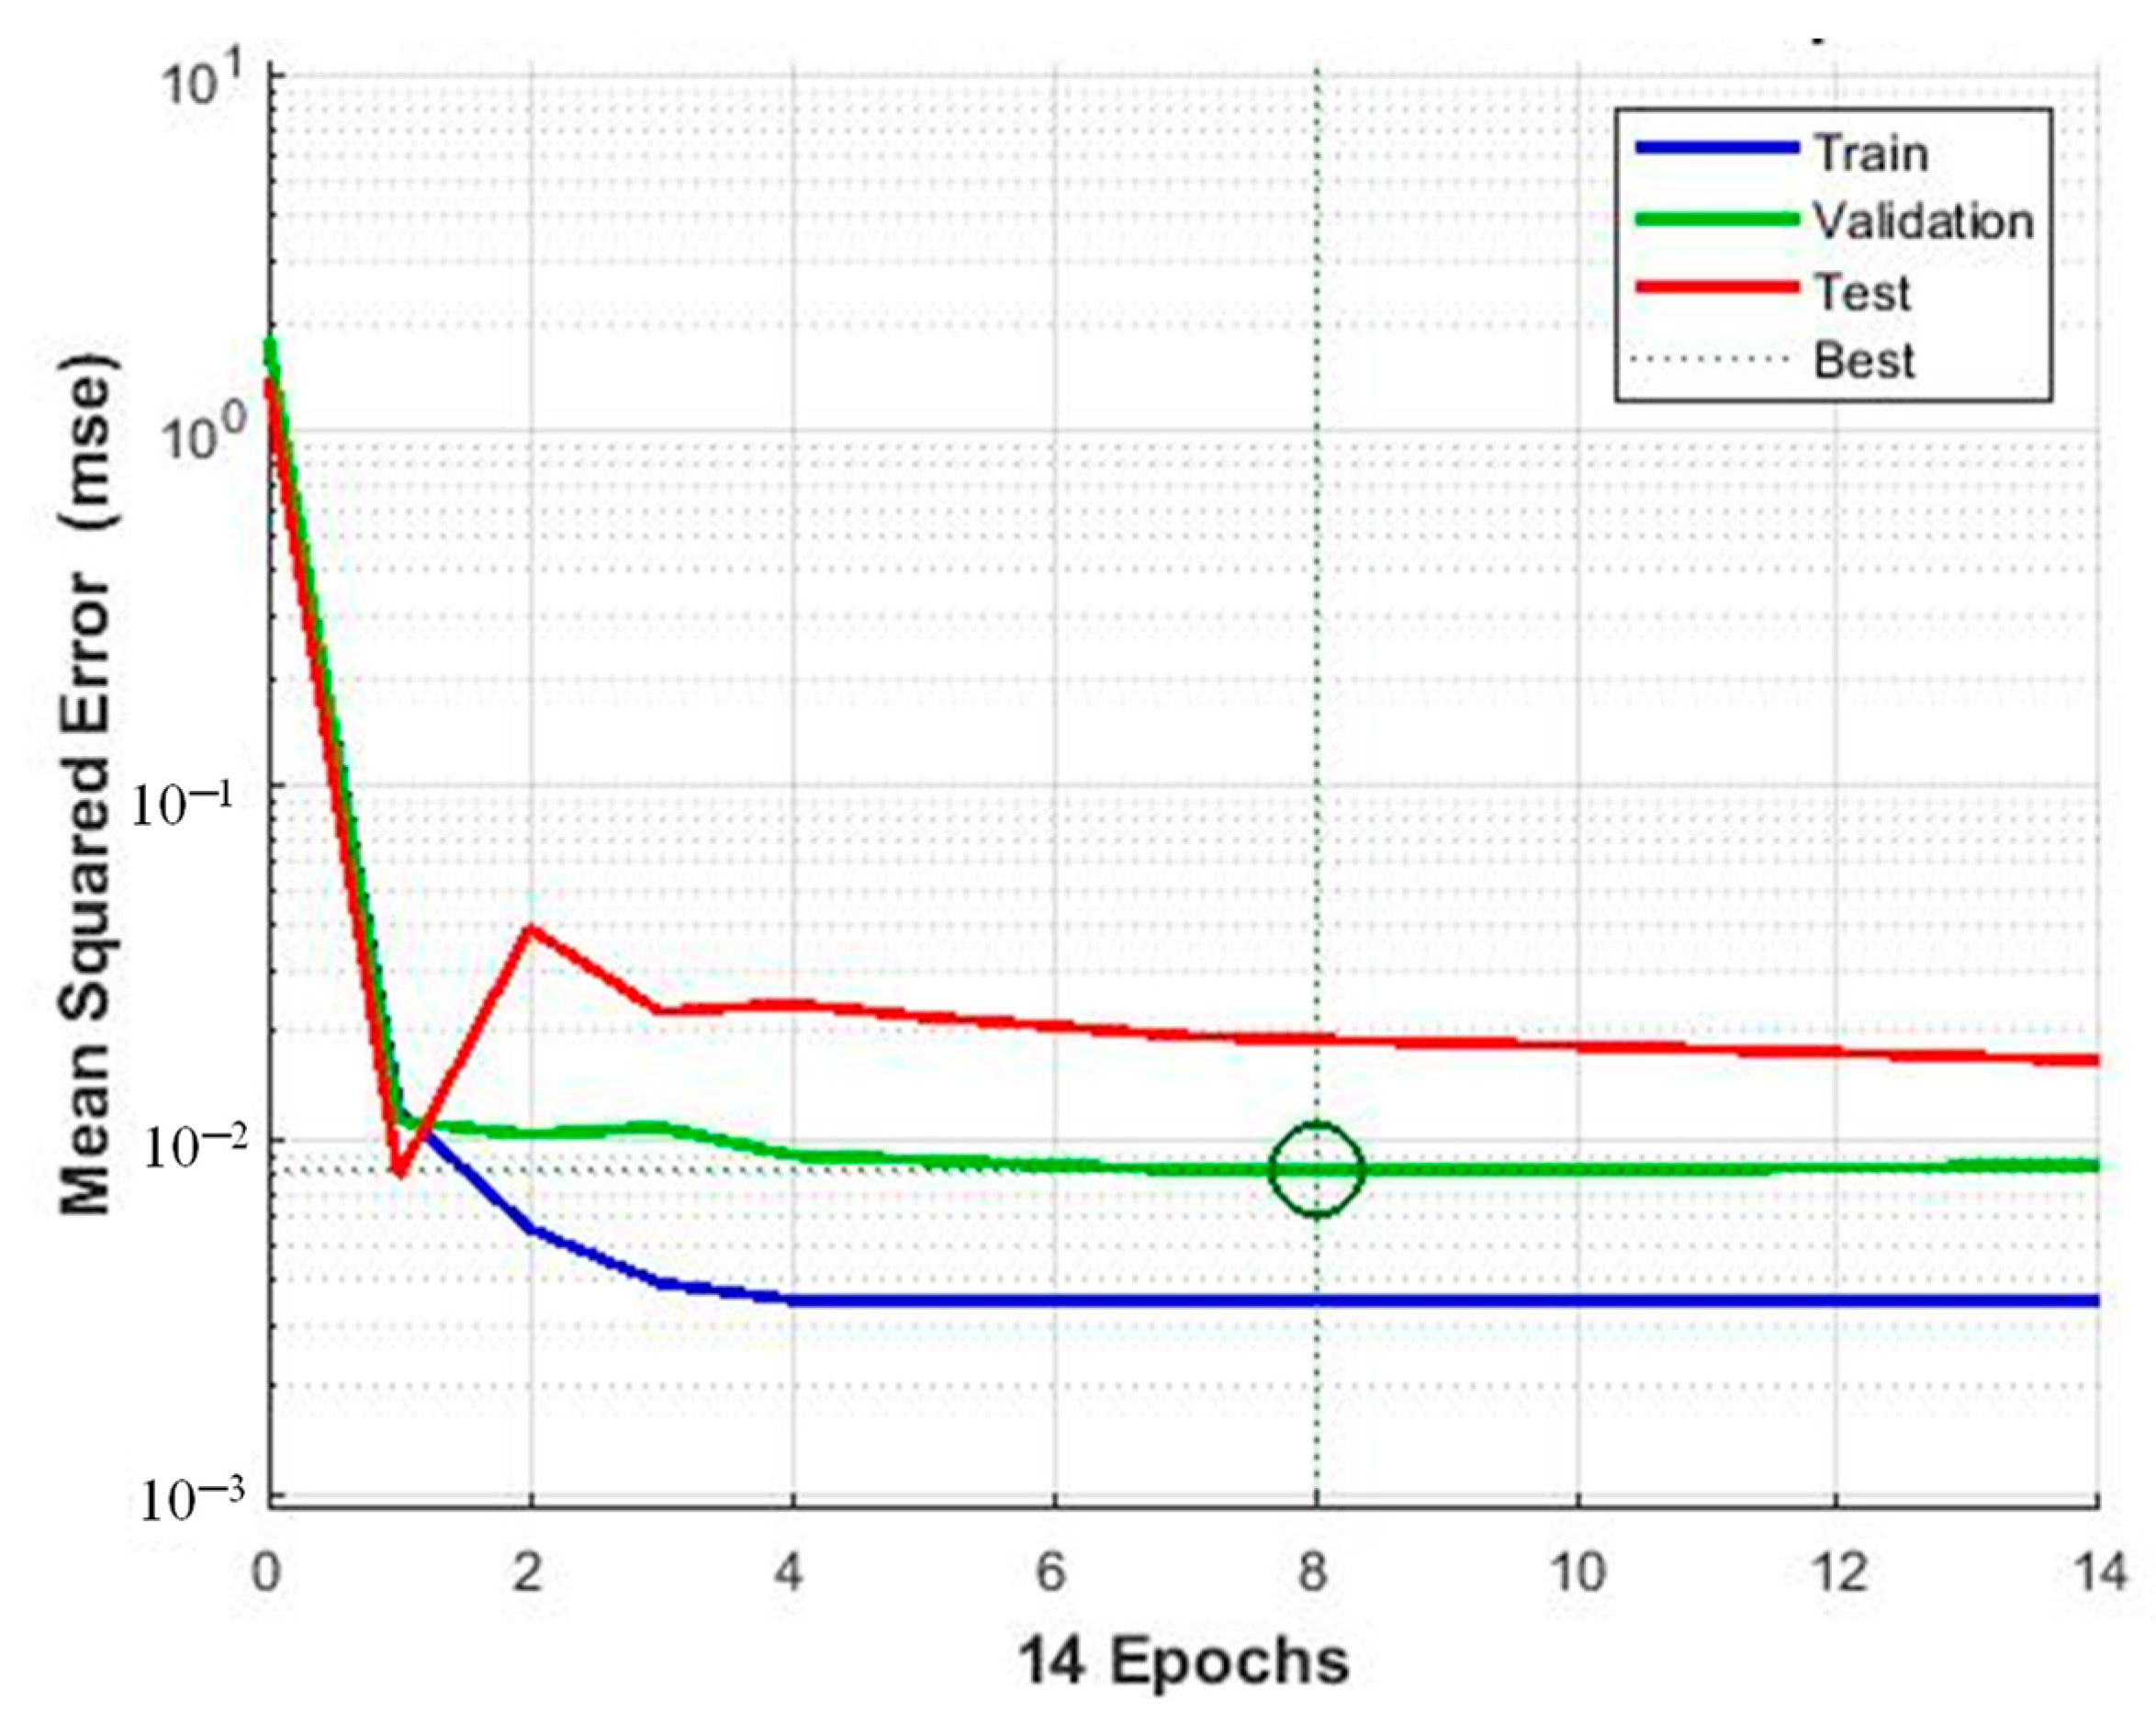
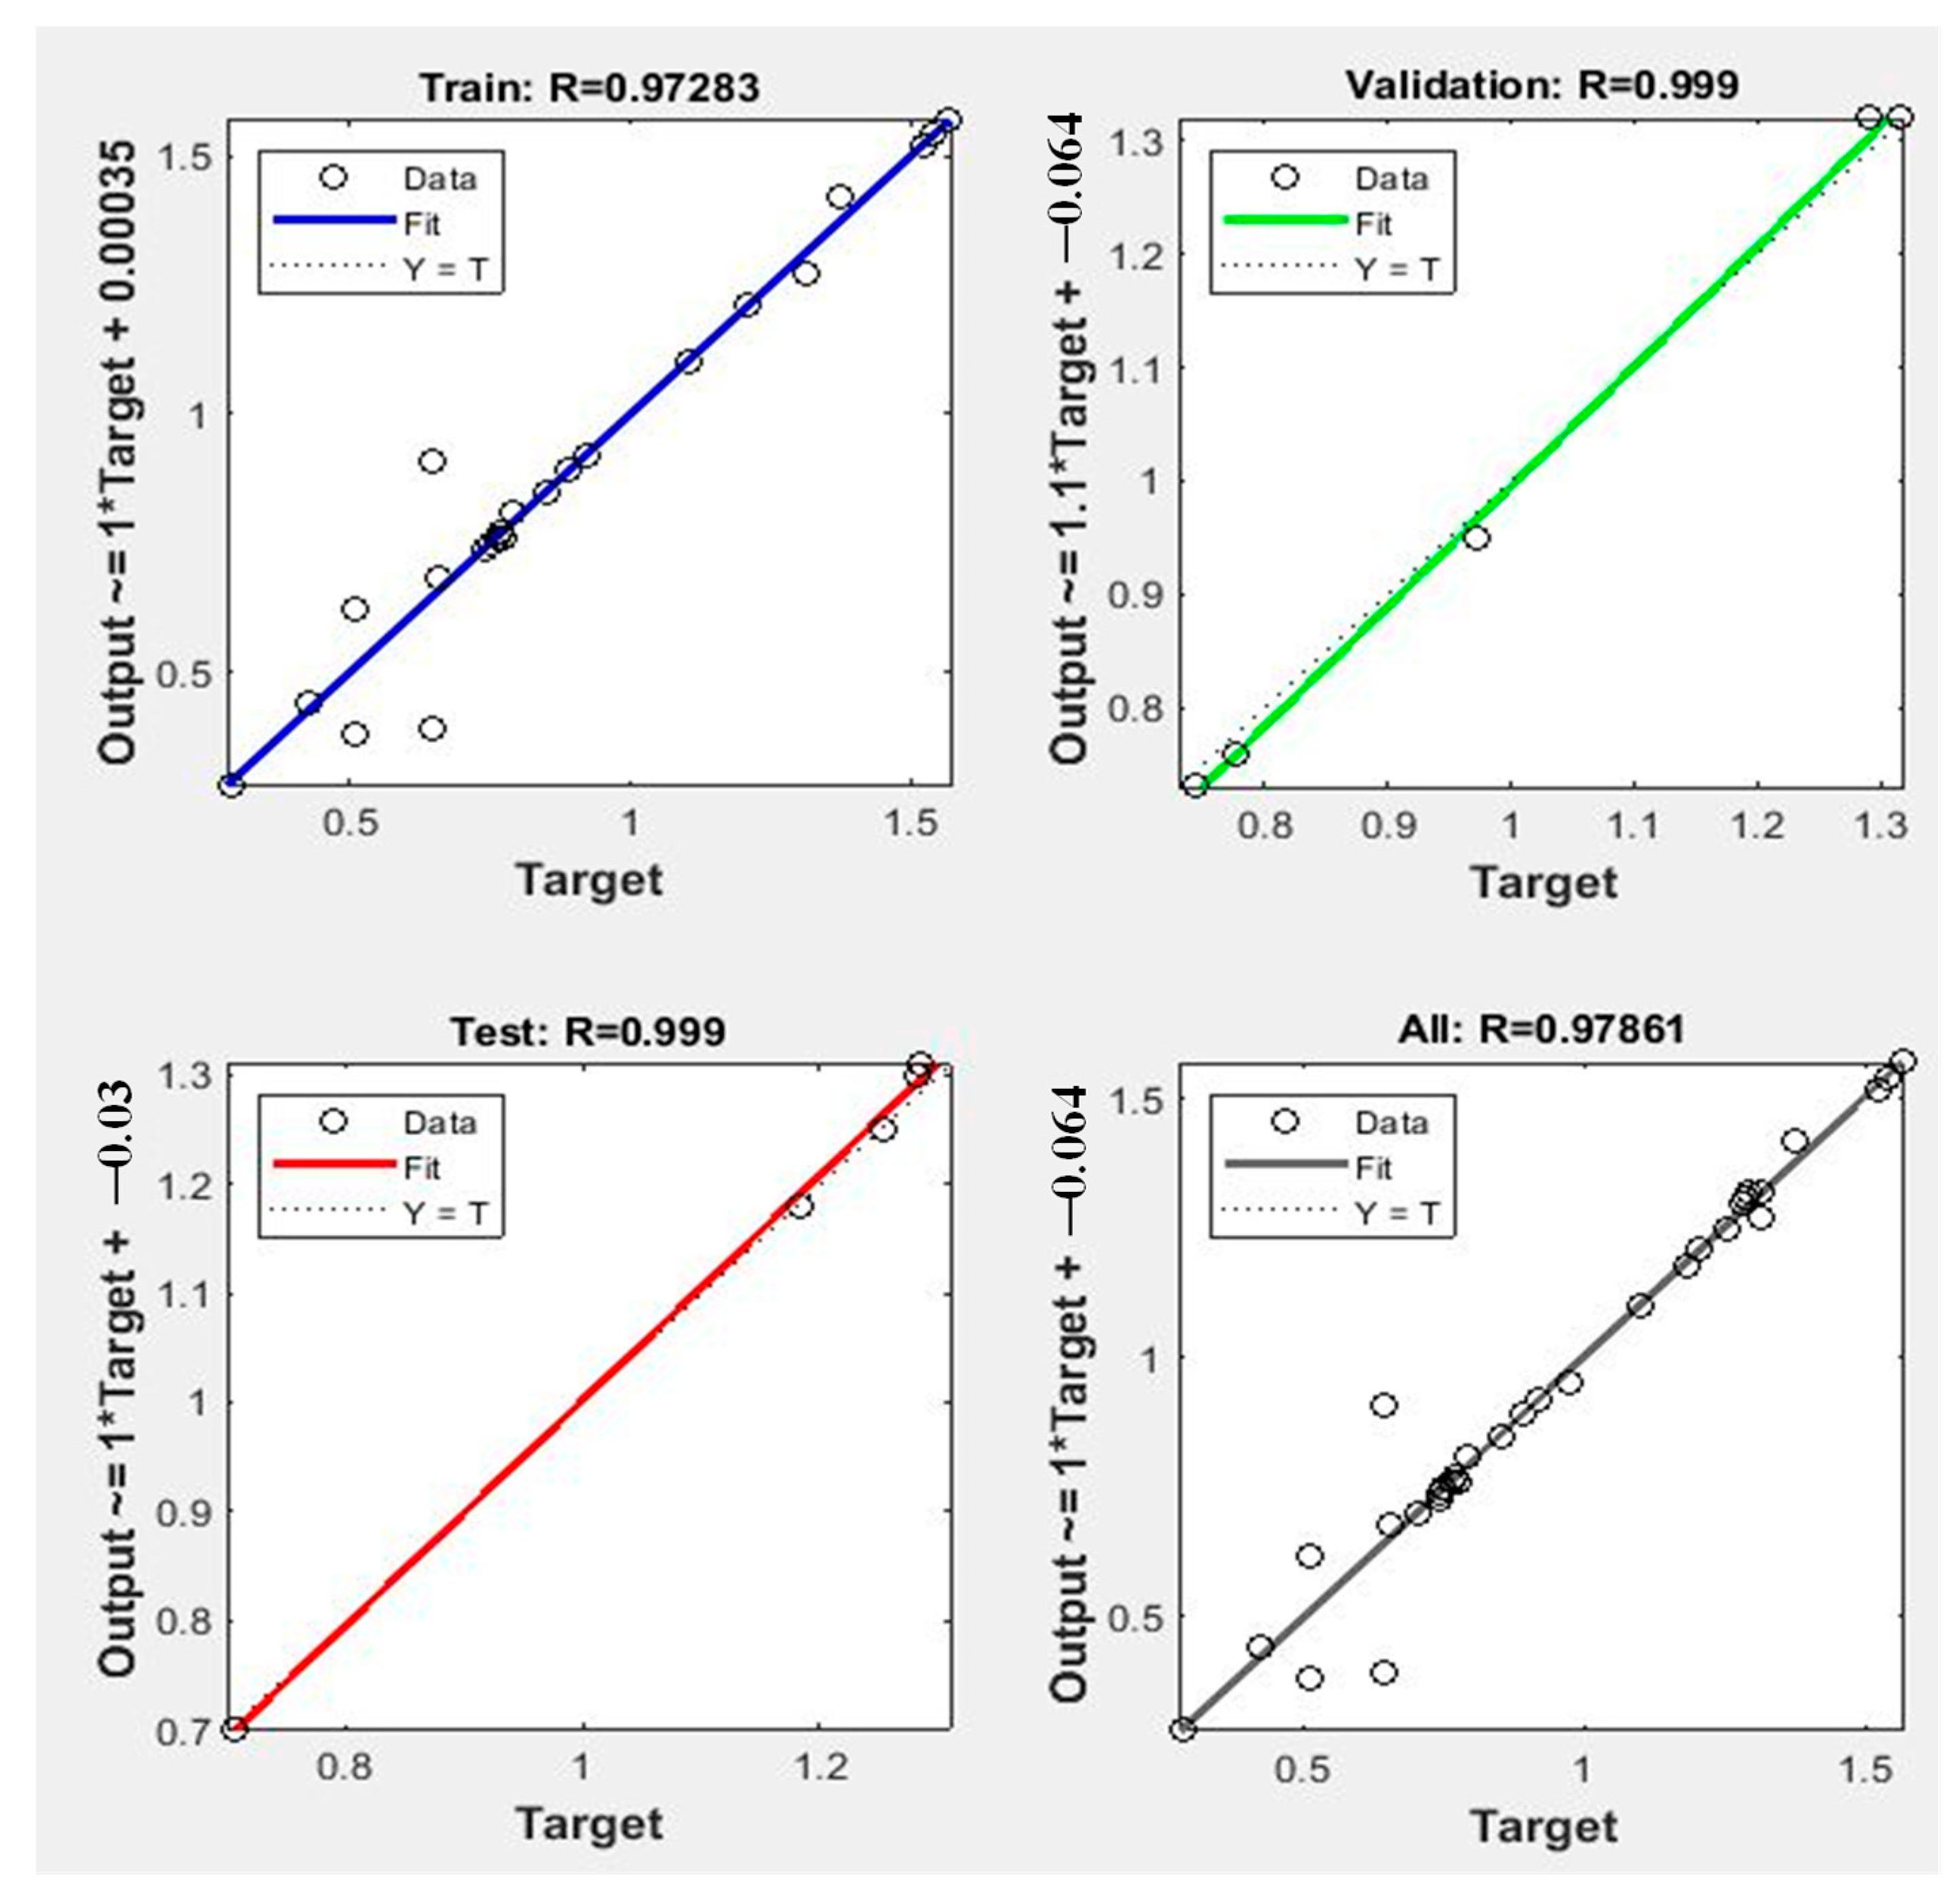
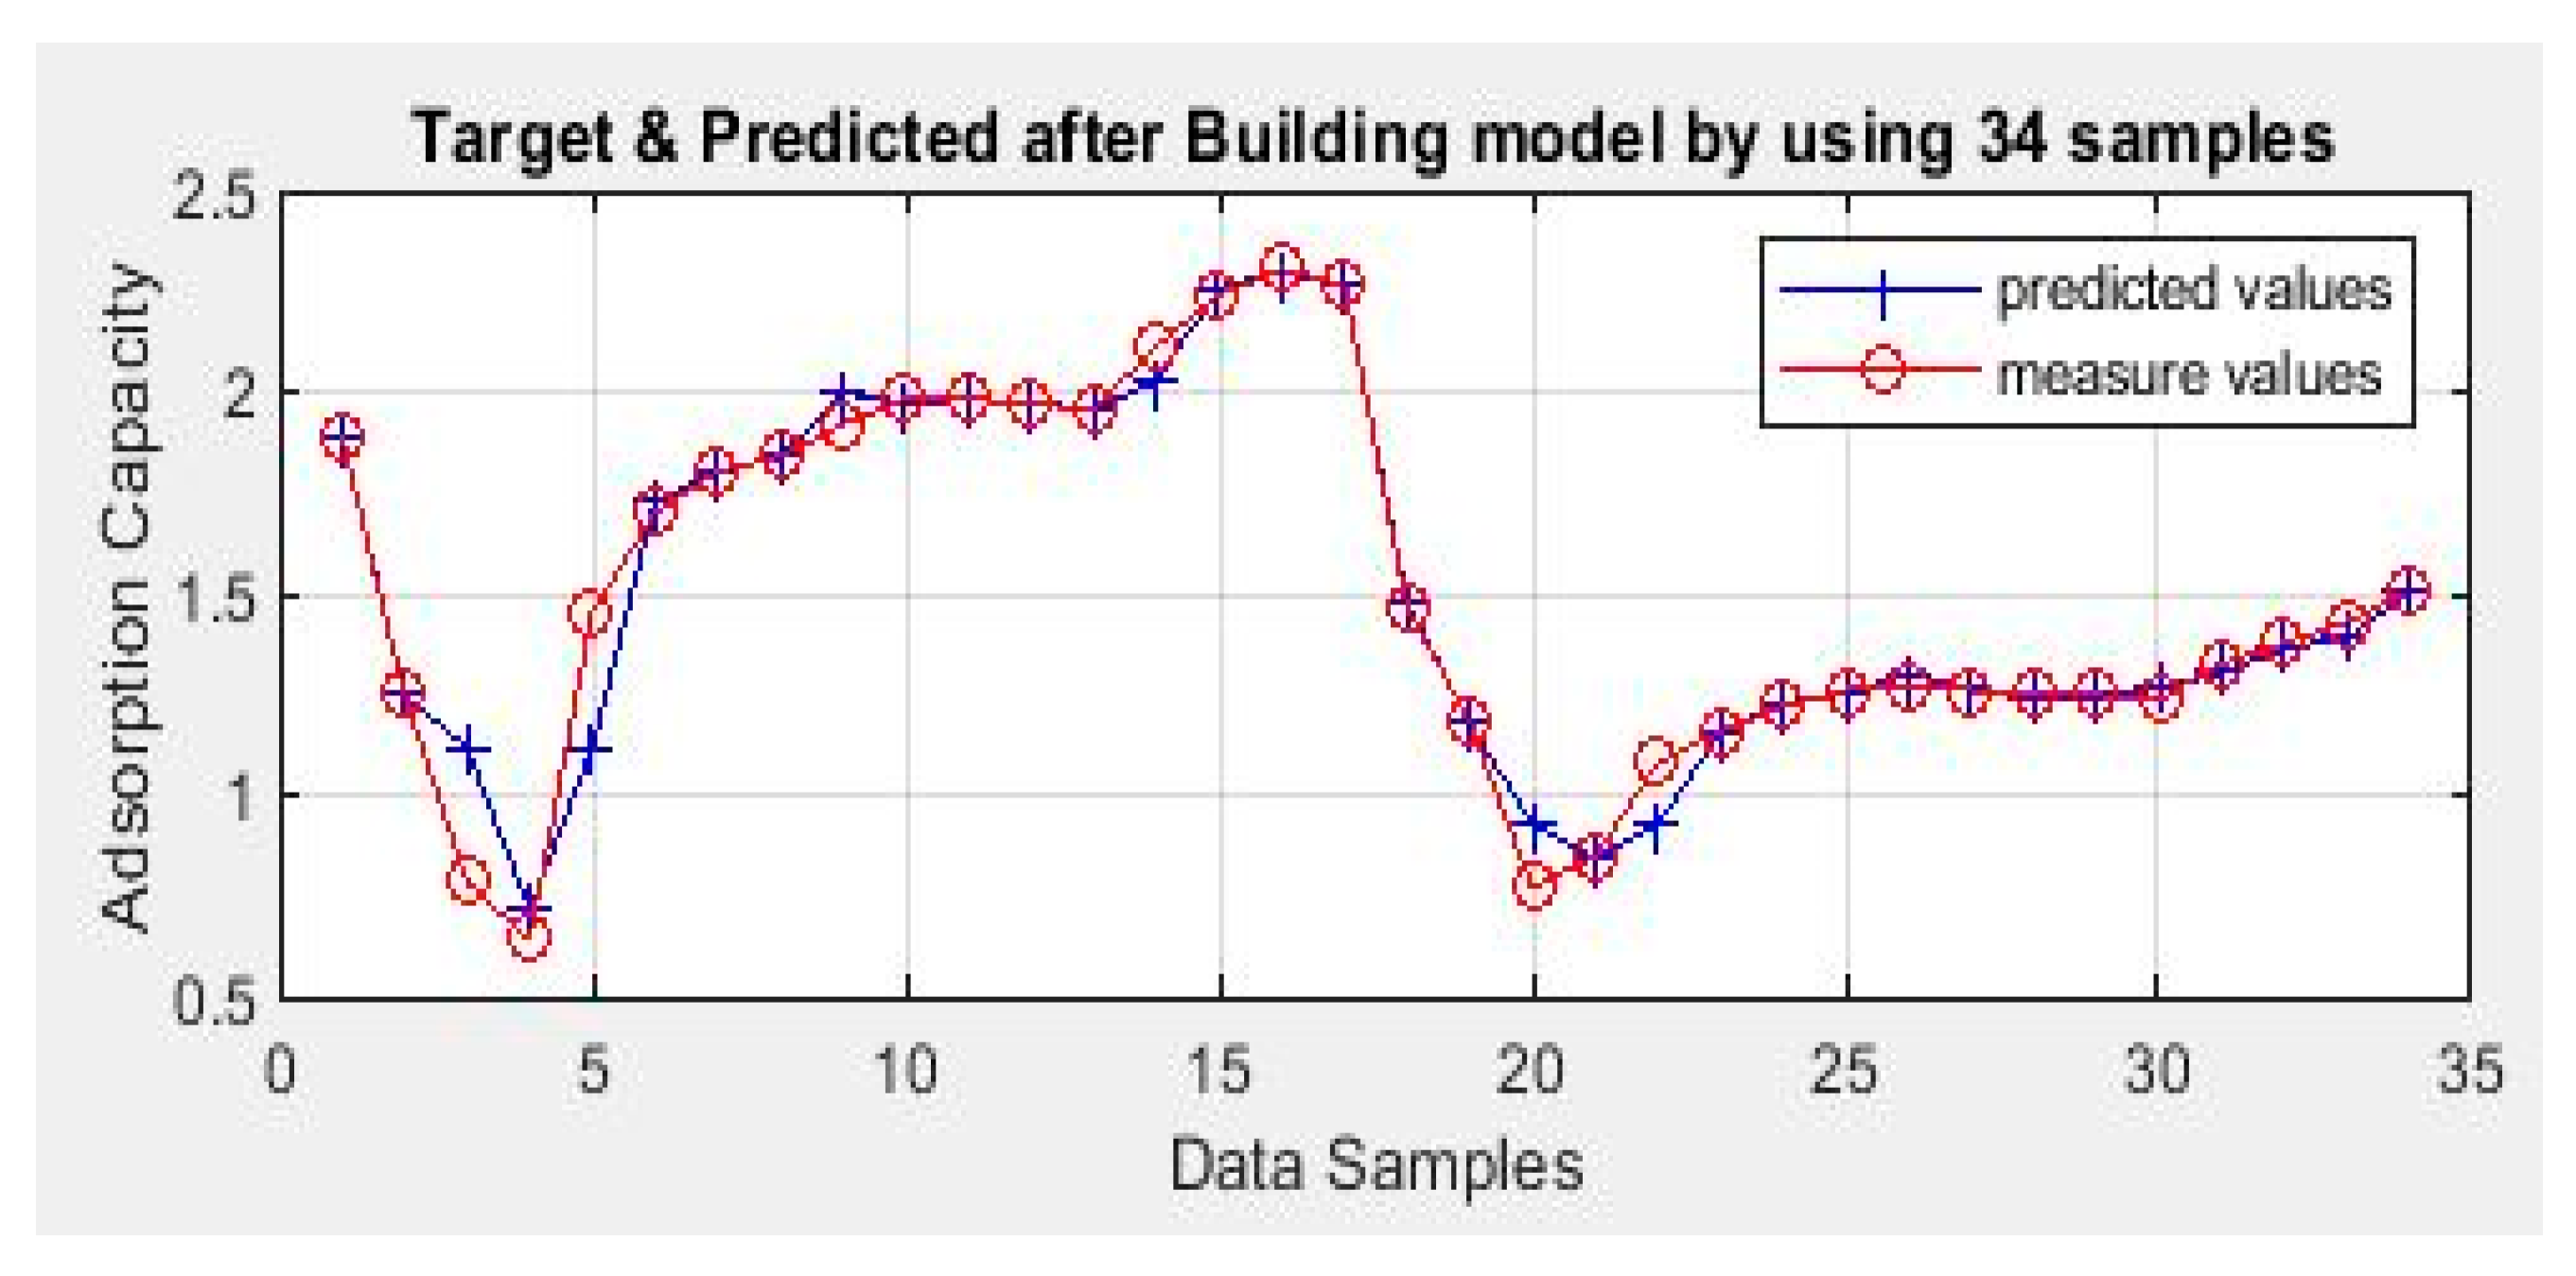
3.5. Modeling via Neural Networks

RBFNN was used to estimate the adsorption capacity of the selected AC. It is crucial to assess model performance across several runs because such a model starts by randomly dividing data patterns and assigning weights to links. After completing the entire training phase, Figure 4 displays the best, average, and SD values of the RMSE for 20 distinct computer runs. The simulations demonstrate the process-simulating ability of the RBFFNN model with 11 neurons in the hidden layer. The training technique was back-propagation using Bayesian regularization, and the activation function of the hidden layer was the radial base function (radbas). To prevent overfitting, the model was trained for an average of 25 epochs. The training, testing, and validation curves of the proposed model (RBFNN) all follow the same pattern, as seen in the convergence curves (Figure 12). This indicates that the model is appropriate for predicting adsorption capacity. To avoid overfitting, the model must be trained for an average of 25 epochs before termination.
The regression coefficients of the training, testing, validation, and overall models are all greater than 0.988, as demonstrated in Figure 13. The RBFNN forecasts for the entire data set are highlighted in Figure 14, showing that the predicted values closely resemble the experimental values. The experimental results and the RBFNN predictions for the test set are shown in Figure 15. The best network and training configurations were chosen by conducting research on the FBFNN hyper-parameters. The numerical results obtained from an evaluation of the test set’s hidden layer size are shown in Table 9 for a range of values (5, 11, 15, and 20). A slight improvement in model performance was obtained when 15 or 20 neurons were used in the hidden layer as opposed to 11. However, this came at the expense of increased training complexity. When 10 or fewer neurons were used, the hidden layer performed much worse (higher RMSE compared to using 20 neurons), as shown in Table 10. The optimal choice for the activation function was (radbas), while the triangular basis transfer function (tribas) or (tansig) yielded inferior RMSE results. In summary, a number of factors were taken into account when determining the ideal RBFNN training settings. The built RBFNN’s suitability for the obtained experimental data indicates that the model may be applied to accurately predict the output under similar experimental conditions. The model may also need to have its structure changed and retrained if the experimental parameters or inputs change. Still, the above-described procedure for selecting the optimal regression model proves to be valid.
Table 11 presents a comparison of the numerical results of some related studies and the current work. Silva et al. [44] divided 45 samples into 70% for training and 30% for testing a model to predict the sorption of diuron, hexazinone, and sulfometuron-methyl in different soils. Their FFNN model was relatively complex, with 12 input parameters; thus, a high RMSE was recorded (1.22). Sridevi et al. [45] employed an FFNN model to predict the adsorption of 2,4-D onto AC generated from Ulva prolifera biomass, and they recorded an R2 = 0.96 and an RMSE = 0.1007. Dahlan et al. [46] used an FFNN to model the adsorption process of 2,4-D onto a modified hydrogel using three input layers; the model complexity was substantially reduced, and they found high accuracy (R2 = 0.99 and RMSE = 0.0004). Isiyaka et al. [47] reported the use of an FFNN model to predict the remediation of MCPA in an aqueous medium using an aluminum-based metal–organic framework and recorded high accuracy (R2 = 0.99 and RMSE = 0.0040). Thus, their FFNN model gave notable results, as shown in Table 11. The proposed model in the current work applies RBFNN to model the adsorption process in the removal of 2,4-D and MCPA from aqueous solutions. Although the current study included a higher number of neurons, which means higher complexity compared to the other studies, the applied model showed high accuracy (R2 = 0.69 and RMSE = 0.054).

4. Conclusions

The selected AC (CLW) in this study had a high surface area (1437 m2/g) and a high volume (0.60 cm3/g) and width of micropores (1.20 nm). The experimental data were best fitted to the second-order kinetic model. The adsorption isotherm of 2,4-D was consistent with the Prausnitz–Radke model; however, the adsorption isotherm of MCPA was best fitted to the Langmuir model.
The AC showed a higher adsorption capacity (1.32 mmol/g) for 2,4-D compared to MCPA (0.76 mmol/g), and the presence of electrolytes exerted a major effect on adsorption. Moreover, the presence of microorganisms enhanced adsorption onto the AC by 17% and 32% for 2,4-D and MCPA, respectively.
The proposed RBFNN model showed excellent accuracy in predicting the adsorption capacity, with an R2 value of 0.96 and a root mean square error (RMSE) of 0.054.

5. Relevant Topics for Future Work

There are numerous relevant and promising topics for future research on adsorption processes using carbon-based biomass wastes. These topics can address environmental challenges, sustainability, and the utilization of biomass waste for efficient adsorption, such as the optimization of activation processes, hybrid adsorption processes, adsorption of emerging contaminants, kinetics and thermodynamics, scale-up and techno-economic analysis, regeneration and reusability, and life cycle assessment.

Author Contributions

All authors whose names appear on the submission made substantial contributions. Conceptualization, R.A., M.M.A.d. and N.S.; methodology, R.A., M.M.A.d. and N.S.; analysis, M.M.A.d. and N.S. Modeling and simulation: B.M.N. The first draft of the manuscript was written by M.M.A.d. and N.S.; revised and presented suggestive comments about the previous versions of the manuscript, R.A., M.M.A.d., B.M.N. and N.S. All authors have read and agreed to the published version of the manuscript.

Funding

Ministry of Education in Saudi Arabia; project number 223202 (IF-JU-2-070).

Institutional Review Board Statement

Not applicable.

Informed Consent Statement

Not applicable.

Data Availability Statement

Data are contained within the article.

Acknowledgments

The authors extend their appreciation to the Deputyship for Research & Innovation, Ministry of Education in Saudi Arabia for funding this research work through the project number 223202 (IF-JU-2-070).

Conflicts of Interest

The authors declare no conflict of interest.

References

  1. McGinley, J.; Healy, M.G.; Ryan, P.C.; Mellander, P.-E.; Morrison, L.; O’Driscoll, J.H.; Siggins, A. Batch adsorption of herbicides from aqueous solution onto diverse reusable materials and granulated activated carbon. J. Environ. Manag. 2022, 323, 116102. [Google Scholar] [CrossRef] [PubMed]
  2. Khalid, S.; Shahid, M.; Murtaza, B.; Bibi, I.; Naeem, M.A.; Niazi, N.K. A critical review of different factors governing the fate of pesticides in soil under biochar application. Sci. Total Environ. 2020, 711, 134645. [Google Scholar] [CrossRef] [PubMed]
  3. Maggi, F.; la Cecilia, D.; Tang, F.H.M.; McBratney, A. The global environmental hazard of glyphosate use. Sci. Total Environ. 2020, 717, 137167. [Google Scholar] [CrossRef] [PubMed]
  4. Samadi-Maybodi, A.; Ghezel-Sofla, H.; BiParva, P. Simultaneous removal of phenoxy herbicides, 2-methyl-4-chlorophenoxyacetic acid and 2.4-dichlorophenoxyacetic acid from aqueous media by magnetized MgAl-LDH@ Fe3O4 composite: Application of partial least squares and Doehlert experimental design. Design, 2022; preprint. [Google Scholar] [CrossRef]
  5. Pouchieu, C.; Piel, C.; Carles, C.; Gruber, A.; Helmer, C.; Tual, S.; Marcotullio, E.; Lebailly, P.; Baldi, I. Pesticide use in agriculture and Parkinson’s disease in the AGRICAN cohort study. Int. J. Epidemiol. 2018, 47, 299–310. [Google Scholar] [CrossRef]
  6. Sahin, C.; Karpuzcu, M.E. Mitigation of organophosphate pesticide pollution in agricultural watersheds. Sci. Total Environ. 2020, 710, 136261. [Google Scholar] [CrossRef]
  7. FAO. Pesticides Use, Pesticides Trade and Pesticides Indicators. Global, Regional and Country Trends, 1990–2020; FAO: Rome, Italy, 2020. [Google Scholar]
  8. Deyris, P.-A.; Pelissier, F.; Grison, C.M.; Hesemann, P.; Petit, E.; Grison, C. Efficient removal of persistent and emerging organic pollutants by biosorption using abundant biomass wastes. Chemosphere 2023, 313, 137307. [Google Scholar] [CrossRef]
  9. Kumar, V.; Kumar, P. Pesticides in agriculture and environment: Impacts on human health. Contam. Agric. Environ. Health Risks Remediat. 2019, 1, 76–95. [Google Scholar]
  10. Blachnio, M.; Kusmierek, K.; Swiatkowski, A.; Derylo-Marczewska, A. Adsorption of Phenoxyacetic Herbicides from Water on Carbonaceous and Non-Carbonaceous Adsorbents. Molecules 2023, 28, 5404. [Google Scholar] [CrossRef]
  11. Pandiarajan, A.; Kamaraj, R.; Vasudevan, S.; Vasudevan, S. OPAC (orange peel activated carbon) derived from waste orange peel for the adsorption of chlorophenoxyacetic acid herbicides from water: Adsorption isotherm, kinetic modelling and thermodynamic studies. Bioresour. Technol. 2018, 261, 329–341. [Google Scholar] [CrossRef]
  12. Kuśmierek, K.; Sankowska, M.; Świątkowski, A. Kinetic and equilibrium studies of simultaneous adsorption of monochlorophenols and chlorophenoxy herbicides on activated carbon. Desalination Water Treat. 2014, 52, 178–183. [Google Scholar] [CrossRef]
  13. Loomis, D.; Guyton, K.; Grosse, Y.; El Ghissasi, F.; Bouvard, V.; Benbrahim-Tallaa, L.; Guha, N.; Mattock, H.; Straif, K. Carcinogenicity of lindane, DDT, and 2,4-dichlorophenoxyacetic acid. Lancet Oncol. 2015, 16, 891–892. [Google Scholar] [CrossRef] [PubMed]
  14. Spaltro, A.; Pila, M.; Simonetti, S.; Álvarez-Torrellas, S.; Rodríguez, J.G.; Ruiz, D.; Compañy, A.D.; Juan, A.; Allegretti, P. Adsorption and removal of phenoxy acetic herbicides from water by using commercial activated carbons: Experimental and computational studies. J. Contam. Hydrol. 2018, 218, 84–93. [Google Scholar] [CrossRef] [PubMed]
  15. El-Shatoury, S.; El-Baz, A.; Abdel Daiem, M.; El-Monayeri, D. Enhancing wastewater treatment by commercial and native microbial Inocula with factorial design. Life Sci. J. 2014, 11, 736–742. [Google Scholar]
  16. Alrowais, R.; Said, N.; Bashir, M.T.; Ghazy, A.; Alwushayh, B.; Abdel daiem, M.M. Adsorption of Diphenolic Acid from Contaminated Water onto Commercial and Prepared Activated Carbons from Wheat Straw. Water 2023, 15, 555. [Google Scholar] [CrossRef]
  17. Abdel daiem, M.M.; Sánchez-Polo, M.; Rashed, A.S.; Kamal, N.; Said, N. Adsorption mechanism and modelling of hydrocarbon contaminants onto rice straw activated carbons. Pol. J. Chem. Technol. 2019, 21, 1–12. [Google Scholar] [CrossRef]
  18. Blachnio, M.; Derylo-Marczewska, A.; Charmas, B.; Zienkiewicz-Strzalka, M.; Bogatyrov, V.; Galaburda, M. Activated carbon from agricultural wastes for adsorption of organic pollutants. Molecules 2020, 25, 5105. [Google Scholar] [CrossRef]
  19. Nyijime, T.A.; Ayuba, A.M.; Chahul, H.F. Experimental and computational studies on activated Bambara groundnut (Vigna subterranean) hulls for the adsorptive removal of herbicides from aqueous solution. Bull. Natl. Res. Cent. 2021, 45, 189. [Google Scholar] [CrossRef]
  20. Boontham, W.; Habaki, H.; Egashira, R. Removal of phenol from oil mill effluent using activated carbon prepared from Kernel Shell in Thailand’s Palm Industry. J. Chem. Eng. Jpn. 2020, 53, 682–688. [Google Scholar] [CrossRef]
  21. Ibeh, P.O.; García-Mateos, F.J.; Rosas, J.M.; Rodríguez-Mirasol, J.; Cordero, T. Activated carbon monoliths from lignocellulosic biomass waste for electrochemical applications. J. Taiwan Inst. Chem. Eng. 2019, 97, 480–488. [Google Scholar] [CrossRef]
  22. Wang, H.; Xu, J.; Liu, X.; Sheng, L. Preparation of straw activated carbon and its application in wastewater treatment: A review. J. Clean. Prod. 2021, 283, 124671. [Google Scholar] [CrossRef]
  23. Feng, P.; Li, J.; Wang, H.; Xu, Z. Biomass-based activated carbon and activators: Preparation of activated carbon from corncob by chemical activation with biomass pyrolysis liquids. ACS Omega 2020, 5, 24064–24072. [Google Scholar] [CrossRef] [PubMed]
  24. Arena, N.; Lee, J.; Clift, R. Life Cycle Assessment of activated carbon production from coconut shells. J. Clean. Prod. 2016, 125, 68–77. [Google Scholar] [CrossRef]
  25. Mao, H.; Zhou, D.; Hashisho, Z.; Wang, S.; Chen, H.; Wang, H.H.; Lashaki, M.J. Microporous activated carbon from pinewood and wheat straw by microwave-assisted KOH treatment for the adsorption of toluene and acetone vapors. RSC Adv. 2015, 5, 36051–36058. [Google Scholar] [CrossRef]
  26. Ma, Y. Comparison of activated carbons prepared from wheat straw via ZnCl2 and KOH activation. Waste Biomass Valorization 2017, 8, 549–559. [Google Scholar] [CrossRef]
  27. Abd-Elhamid, A.I.; Emran, M.; El-Sadek, M.H.; El-Shanshory, A.A.; Soliman, H.M.A.; Akl, M.A.; Rashad, M. Enhanced removal of cationic dye by eco-friendly activated biochar derived from rice straw. Appl. Water Sci. 2020, 10, 45. [Google Scholar] [CrossRef]
  28. Li, M.; Lu, X.; Xia, H.; Zhang, C.; Wang, X.; Chen, Z.; Qu, K.; Huang, B.; Moore, S.; Mao, Y. In-depth characterization of the pituitary transcriptome in Simmental and Chinese native cattle. Domest. Anim. Endocrinol. 2019, 66, 35–42. [Google Scholar] [CrossRef]
  29. Wan Ibrahim, W.M.H.; Mohamad Amini, M.H.; Sulaiman, N.S.; Kadir, W.R.A. Powdered activated carbon prepared from Leucaena leucocephala biomass for cadmium removal in water purification process. Arab. J. Basic Appl. Sci. 2019, 26, 30–40. [Google Scholar] [CrossRef]
  30. Cansado, I.P.P.; Mourão, P.A.M.; Gomes, J.; Almodôvar, V. Adsorption of MCPA, 2,4-D and diuron onto activated carbons from wood composites. Ciência Tecnol. Dos Mater. 2017, 29, e224–e228. [Google Scholar] [CrossRef]
  31. Ramamoorthy, M.; Ragupathy, S.; Sakthi, D.; Arun, V.; Kannadasan, N. Synthesis of SnO2 loaded on corn cob activated carbon for enhancing the photodegradation of methylene blue under sunlight irradiation. J. Environ. Chem. Eng. 2020, 8, 104331. [Google Scholar] [CrossRef]
  32. Lafi, R.; Montasser, I.; Hafiane, A. Adsorption of congo red dye from aqueous solutions by prepared activated carbon with oxygen-containing functional groups and its regeneration. Adsorpt. Sci. Technol. 2019, 37, 160–181. [Google Scholar] [CrossRef]
  33. Borah, L.; Goswami, M.; Phukan, P. Adsorption of methylene blue and eosin yellow using porous carbon prepared from tea waste: Adsorption equilibrium, kinetics and thermodynamics study. J. Environ. Chem. Eng. 2015, 3, 1018–1028. [Google Scholar] [CrossRef]
  34. Özsin, G.; Kılıç, M.; Apaydın-Varol, E.; Pütün, A.E. Chemically activated carbon production from agricultural waste of chickpea and its application for heavy metal adsorption: Equilibrium, kinetic, and thermodynamic studies. Appl. Water Sci. 2019, 9, 56. [Google Scholar] [CrossRef]
  35. Ghorbani, F.; Kamari, S.; Zamani, S.; Akbari, S.; Salehi, M. Optimization and modeling of aqueous Cr (VI) adsorption onto activated carbon prepared from sugar beet bagasse agricultural waste by application of response surface methodology. Surf. Interfaces 2020, 18, 100444. [Google Scholar] [CrossRef]
  36. Alrowais, R.; Abdel daiem, M.M.; Li, R.; Maklad, M.A.; Helmi, A.M.; Nasef, B.M.; Said, N. Groundwater Quality Assessment for Drinking and Irrigation Purposes at Al-Jouf Area in KSA Using Artificial Neural Network, GIS, and Multivariate Statistical Techniques. Water 2023, 15, 2982. [Google Scholar] [CrossRef]
  37. Alrowais, R.; Yousef, R.S.; Ahmed, O.K.; Mahmoud-Aly, M.; Abdel daiem, M.M.; Said, N. Enhanced detoxification methods for the safe reuse of treated olive mill wastewater in irrigation. Environ. Sci. Eur. 2023, 35, 95. [Google Scholar] [CrossRef]
  38. Naz, M.; Uyanik, S.; Yesilnacar, M.I.; Sahinkaya, E. Side-by-side comparison of horizontal subsurface flow and free water surface flow constructed wetlands and artificial neural network (ANN) modelling approach. Ecol. Eng. 2009, 35, 1255–1263. [Google Scholar] [CrossRef]
  39. Ghaedi, A.M.; Vafaei, A. Applications of artificial neural networks for adsorption removal of dyes from aqueous solution: A review. Adv. Colloid Interface Sci. 2017, 245, 20–39. [Google Scholar] [CrossRef]
  40. Reynel-Ávila, H.E.; Aguayo-Villarreal, I.A.; Diaz-Muñoz, L.L.; Moreno-Pérez, J.; Sánchez-Ruiz, F.J.; Rojas-Mayorga, C.K.; Mendoza-Castillo, D.I.; Bonilla-Petriciolet, A. A review of the modeling of adsorption of organic and inorganic pollutants from water using artificial neural networks. Adsorpt. Sci. Technol. 2022, 2022, 9384871. [Google Scholar] [CrossRef]
  41. Messikh, N.; Bougdah, N.; Bousba, S.; Djazi, F. Modeling the adsorption of chlorobenzene on modified bentonite using an artificial neural network. Curr. Res. Green Sustain. Chem. 2020, 3, 100026. [Google Scholar] [CrossRef]
  42. Azqhandi, M.H.A.; Ghaedi, M.; Yousefi, F.; Jamshidi, M. Application of random forest, radial basis function neural networks and central composite design for modeling and/or optimization of the ultrasonic assisted adsorption of brilliant green on ZnS-NP-AC. J. Colloid Interface Sci. 2017, 505, 278–292. [Google Scholar] [CrossRef] [PubMed]
  43. Asfaram, A.; Ghaedi, M.; Azqhandi, M.H.A.; Goudarzi, A.; Hajati, S. Ultrasound-assisted binary adsorption of dyes onto Mn@ CuS/ZnS-NC-AC as a novel adsorbent: Application of chemometrics for optimization and modeling. J. Ind. Eng. Chem. 2017, 54, 377–388. [Google Scholar] [CrossRef]
  44. Silva, T.S.; de Freitas Souza, M.; da Silva Teófilo, T.M.; Dos Santos, M.S.; Porto, M.A.F.; Souza, C.M.M.; Dos Santos, J.B.; Silva, D.V. Use of neural networks to estimate the sorption and desorption coefficients of herbicides: A case study of diuron, hexazinone, and sulfometuron-methyl in Brazil. Chemosphere 2019, 236, 124333. [Google Scholar] [CrossRef] [PubMed]
  45. Sridevi, H.; Bhat, R.; Selvaraj, R. Removal of an agricultural herbicide (2,4-Dichlorophenoxyacetic acid) using magnetic nanocomposite: A combined experimental and modeling studies. Environ. Res. 2023, 238, 117124. [Google Scholar]
  46. Dahlan, I.; Azhar, E.E.M.; Hassan, S.R.; Aziz, H.A.; Hung, Y.-T. Statistical Modeling and Optimization of Process Parameters for 2, 4-Dichlorophenoxyacetic Acid Removal by Using AC/PDMAEMA Hydrogel Adsorbent: Comparison of Different RSM Designs and ANN Training Methods. Water 2022, 14, 3061. [Google Scholar] [CrossRef]
  47. Isiyaka, H.A.; Jumbri, K.; Sambudi, N.S.; Zango, Z.U.; Abdullah, N.A.F.; Saad, B.; Mustapha, A. Adsorption of dicamba and MCPA onto MIL-53 (Al) metal–organic framework: Response surface methodology and artificial neural network model studies. RSC Adv. 2020, 10, 43213–43224. [Google Scholar] [CrossRef] [PubMed]
  48. Mohamed Mohamed, M. Integrated Technologies Based on the Use of Activated Carbon and Radiation to Remove Contaminants Present in Landfill Leachates. Ph.D. Thesis, Granada University, Granada, Spain, 2013. [Google Scholar]
  49. Prahas, D.; Kartika, Y.; Indraswati, N.; Ismadji, S. Activated carbon from jackfruit peel waste by H3PO4 chemical activation: Pore structure and surface chemistry characterization. Chem. Eng. J. 2008, 140, 32–42. [Google Scholar] [CrossRef]
  50. Mokti, N.; Borhan, A.; Zaine, S.N.A.; Zaid, H.F.M. Synthesis and Characterisation of Pyridinium-Based Ionic Liquid as Activating Agent in Rubber Seed Shell Activated Carbon Production for CO2 Capture. J. Adv. Res. Fluid Mech. Therm. Sci. 2021, 82, 85–95. [Google Scholar] [CrossRef]
  51. Kozyatnyk, I.; Benavente, V.; Weidemann, E.; Gentili, F.G.; Jansson, S. Influence of hydrothermal carbonization conditions on the porosity, functionality, and sorption properties of microalgae hydrochars. Sci. Rep. 2023, 13, 8562. [Google Scholar] [CrossRef]
  52. Boakye, P.; Tran, H.N.; Lee, D.S.; Woo, S.H. Effect of water washing pretreatment on property and adsorption capacity of macroalgae-derived biochar. J. Environ. Manag. 2019, 233, 165–174. [Google Scholar] [CrossRef]
Figure 1. Research methodology for AC preparation and ANN modeling of the adsorption of herbicides onto AC.
Sustainability 16 00299 g001
Figure 2. Chemical structure and distribution of species of (a) 2,4-D and (b) MCPA [48].
Sustainability 16 00299 g002
Figure 3. Neural network structure based on RDB for the hidden layer for predicting adsorption capacity.
Sustainability 16 00299 g003
Figure 4. Flow chart for utilizing RBFNN to forecast the appropriateness of adsorption capacity.
Sustainability 16 00299 g004
Figure 5. Surface area variation in AC prepared from wheat straw as a result of preparation techniques (a) origination (O) and (b) carbonization (C).
Sustainability 16 00299 g005
Figure 6. Adsorption kinetics of (a) 2,4-D and (b) MCPA onto CLW at T = 25 °C, [C]o = 100 mg/L, and pH ≈ 3.5.
Sustainability 16 00299 g006
Figure 7. Adsorption isotherms of MCPA and 2,4-D onto CLW at T = 25 °C, AC mass of 100 mg, and solution pH ≈ 3.5.
Sustainability 16 00299 g007
Figure 8. Effect of pH on the adsorption of MCPA and 2,4-D onto CLW at [C]o = 500 mg/L and T = 25 °C.
Sustainability 16 00299 g008
Figure 9. Influence of ionic strength on the adsorption of 2,4-D and MCPA onto CLW at [C]o = 500 mg/L and T = 25 °C.
Sustainability 16 00299 g009
Figure 10. Influence of the presence of microorganisms on the adsorption of MCPA and 2,4-D onto CLW at [C]o = 500 mg/L and T = 25 °C.
Sustainability 16 00299 g010
Figure 11. SEM images of bio-adsorption of (a) 2,4-D and (b) MCPA onto CLW.
Sustainability 16 00299 g011
Figure 12. Training convergence curves of the proposed RBFNN model.
Sustainability 16 00299 g012
Figure 13. Adsorption capacity as predicted by the RBFNN model: linear regression coefficients for the training, testing, validation, and overall models.
Sustainability 16 00299 g013
Figure 14. Prediction of adsorption capacity by the RBFNN model.
Sustainability 16 00299 g014
Figure 15. The experimental data sample used in the test set for predicting the adsorption capacity using the RBFNN model.
Sustainability 16 00299 g015
Table 1. Surface characteristics of AC prepared from different biomass residues and its adsorption capacity.
Raw MaterialActivation AgentBET Surface Area (m2/g)Pore Volume
(cm3/g)
Adsorption Capacity (mg/g)Ref.
Wheat strawKOH11640.51265[16]
Wheat strawKOH12500.60200[25]
Wheat strawKOH552--147[26]
Wheat strawZnCl2907--266[26]
Rice strawH3PO46130.25176 to 329[17]
Rice strawZnCl27710.23155 to 329[17]
Rice strawWet attrition223--46 to 91[27]
Rice huskCO210970.83163[28]
Leucaena leucocephala biomassNaOH185 to 776--70[29]
WoodCO2805 to 12110.33 to 0.58226 to 539[30]
WoodKOH20440.93200[25]
Corn cobH3PO42930.35--[31]
Coffee wasteCH3CO2K2200.1391[32]
Tea precursorsH3PO420541.75400 to 402[33]
Chickpea huskKOH and K2CO320821.0756 to 136[34]
Sugar beet bagasseH3PO47480.3610[35]
BET: Brunauer, Emmett, and Teller.
Table 2. Previous studies utilizing ANN modeling to predict adsorption processes.
ANN Model ExperimentData Used (Training-
Testing-Validation)
Input VariablesAdsorption CapacityRef.
RDB feed forward, Levenberg–Marquardt back-propagationKinetics and isotherm--40.92 mmol/g[40]
RDBEquilibrium RSM (CCD)36-0-18398.89%[41]
RDB neural network with Kernel stone algorithmBinary, RSM (CCD)22-10-05126.42 to 115.08 mg/g[42]
FFNNAdsorption in soil12-9-112--[44]
FFNNRSM (CCD)4-9-147.29 mg/g[45]
FFNNRSM3-9-2394.52 mg/g[46]
FFNNRSM (CCD), ANOVA5-7-15272.2 to 232.5 mg/g[47]
RSM: response surface methodology; CCD: central composite design; FFNN: feed-forward neural network; ANOVA: analysis of variance.
Table 3. Physicochemical properties and molecular sizes of 2,4-D and MCPA [48].
Molecular Size
(x, y, z) (nm)
Molecular Weight (g/mol)VA (a) (cm3/mol)S (b)
(g/L)
log Kow (c)pKa1 (d)
2,4-D1.29 × 0.73 × 0.42221.001822.162.692.98
MCPA1.24 × 0.84× 0.42200.621851.382.223.14
Note: (a) molar volume of liquid at the boiling point; (b) water solubility; (c) log octanol–water partition coefficient; (d) corresponding successive deprotonations.
Table 4. Full factorial design for the preparation of AC.
Exp. No.PMWDesigned Sample
1O−1L−1U−1OLU
2O−1S+1U−1OSU
3O−1L−1W+1OLW
4O−1S+1W+1OSW
5C+1L−1U−1CLU
6C+1S+1U−1CSU
7C+1L−1W+1CLW
8C+1S+1W+1CSW
P is the preparation method, M is the mixing method, and W is the washing method.
Table 5. Textural and chemical characteristics of fabricated AC (average ± SD).
ACSN2 (a)
(m2/g)
Wo (N2) (b)
(cm3/g)
Wo (CO2) (c)
(cm3/g)
Lo (N2) (d)
(nm)
Lo (CO2) (e)
(nm)
AGC (f)
(meq/g)
BGC (g)
(meq/g)
pHpzc (h)
OLU1263 ± 4.580.50 ± 0.030.34 ± 0.031.21 ± 0.020.68 ± 0.038.90 ± 0.2610.12 ± 0.017.80 ± 0.02
OSU1164 ± 2.650.51 ± 0.020.48 ± 0.021.27 ± 0.030.92 ± 0.028.71 ± 0.103.63 ± 0.065.99 ± 0.03
OLW1285 ± 2.000.51 ± 0.030.53 ± 0.031.25 ± 0.030.72 ± 0.048.88 ± 0.193.95 ± 0.045.10 ± 0.05
OSW934 ± 3.610.37 ± 0.030.33 ± 0.041.02 ± 0.030.67 ± 0.037.65 ± 0.130.41 ± 0.043.20 ± 0.02
CLU870 ± 3.000.35 ± 0.030.42 ± 0.031.20 ± 0.020.68 ± 0.048.90 ± 0.173.24 ± 0.135.20 ± 0.05
CSU785 ± 3.460.31 ± 0.030.38 ± 0.031.10 ± 0.090.65 ± 0.037.80 ± 0.263.01 ± 0.044.10 ± 0.04
CLW1437 ± 2.520.60 ± 0.060.43 ± 0.021.20 ± 0.020.70 ± 0.027.02 ± 0.080.02 ± 0.023.10 ± 0.05
CSW1342 ± 3.790.55 ± 0.040.40 ± 0.020.99 ± 0.050.65 ± 0.026.52 ± 0.040.03 ± 0.023.00 ± 0.02
Note: (a) external surface area of AC; (b,c) micropore volume after N2 and CO2 adsorption, respectively; (d,e) micropores’ mean width after N2 and CO2 adsorption, respectively; (f) acidic group’s concentration; (g) basic group’s concentration; (h) pHpzc: pH of the point of zero charge.
Table 6. Regression coefficients of the surface area, volume, and mean width of micropores of the fabricated AC.
SN2 (m2/g) (a)Wo (N2) (cm3/g) (b)Lo (N2) (nm) (c)
βiSDp-Value βiSDp-Value βiSDp-Value
Intercept+1135.00±30.250.02+0.46±0.020.07+1.16±0.020.01
P−53.00±60.500.54−0.02±0.040.63−0.065±0.050.39
W+229.00±60.500.16+0.09±0.040.57−0.08±0.050.33
M−157.50±60.500.23−0.06±0.040.72−0.12±0.050.23
P × W+333.00±60.500.11+0.16±0.040.69+0.03±0.050.68
P × M+67.50±60.500.47+0.01±0.040.39−0.04±0.050.58
M × W−65.50±60.500.47−0.04±0.040.43−0.10±0.050.27
R20.980.970.95
Note: (a) AC surface area; (b) micropore volume (N2); (c) micropore mean width (N2); preparation methods (P), washing (W), and mixing state (M); R2: goodness of fit.
Table 7. Data of the adsorption kinetics of 2,4-D and MCPA onto CLW after applying the first- and second-order kinetic models.
PollutantMass of Carbon (mg)qe (exp.)
(mmol/g)
1st Order2nd Order
qe (pred.)
(mmol/g)
k1 (1/h)%Dqe (pred.) (mmol/g)k2
(g/mmol/h)
%D
2,4-D251.2731.2160.30811.031.2540.4106.65
500.7680.7280.3899.680.7480.8775.53
1000.4100.3810.32612.090.3911.4538.17
MCPA250.9370.9180.06419.291.0170.08327.84
500.6700.6440.06615.810.7030.1417.43
1000.3930.3760.1899.370.3960.65412.37
Table 8. Parameters obtained by applying the Langmuir, Freundlich, and Prausnitz–Radke adsorption isotherm models to the adsorption of 2,4-D and MCPA onto CLW.
PollutantLangmuirFreundlichPrausnitz–Radke
Xm(a)
(mmol/g)
B (b)
(L/mmol)
BXm (c)
(L/g)
X′m × 10−4
(mmol/m2/g)
%DKF (d)
(L/g)
1/nF (e)%Da (f)
(L/g)
b (g)
(Lβ/mmolβ)
β (h)%D
2,4-D1.329.4412.469.192.071.180.2640.9612.059.091.012.37
MCPA0.7647.2935.945.293.080.770.124.4756.3373.240.940.87
Note: (a) Xm: capacity of adsorption (mmol/g); (b) B: constant (L/mmol); (c) BXm: adsorbent–adsorbate relative affinity (L/g); (d) KF: relative capacity for adsorption (L/g); (e) 1/nF: sorption intensity or surface heterogeneity; (f) constant (L/g); (g) constant (Lβ/mmolβ); and (h) constant.
Table 9. Influence of the number of neurons used in the hidden layer of the proposed model.
ModelErrorNumber of Neurons
5111520
RBFNNRMSE0.07750.0700.0720.0706
R20.95500.960.9570.9560
RMSE: root mean square error & bold number means the optimal case.
Table 10. Effect of the training algorithm and hidden layer’s activation function used in the model.
ModelActivation Function of the Hidden LayersErrorTraining Algorithm
TrainlmTrainscgTrainbr
RBFNNtansigRMSE0.05600.07750.1862
R20.95600.94000.8900
radbasRMSE0.05400.07230.1849
R20.96000.95600.9100
tribasRMSE0.05500.08510.4286
R20.95600.94000.7998
RMSE: root mean square error & bold number means the optimal case.
Table 11. Comparison of models used in previous studies and current work.
Model (Input: Number of Neurons: Output)R2RMSERef.
FFNN (12:9:1)0.971.2200[44]
FFNN (4:9:1)0.960.1007[45]
FFNN (3:9:2)0.990.0004[46]
FFNN (5:7:1)0.990.0040[47]
RBFNN (6:13:1)0.960.0540Current work
RMSE: root mean square error.
Disclaimer/Publisher’s Note: The statements, opinions and data contained in all publications are solely those of the individual author(s) and contributor(s) and not of MDPI and/or the editor(s). MDPI and/or the editor(s) disclaim responsibility for any injury to people or property resulting from any ideas, methods, instructions or products referred to in the content.

