

Heavy Metals and Pesticide Residues in Small Farm Cheese Production in Croatia—Challenge between Quality and Quantity
 , , , , , and
Abstract
:1. Introduction
2. Materials and Methods
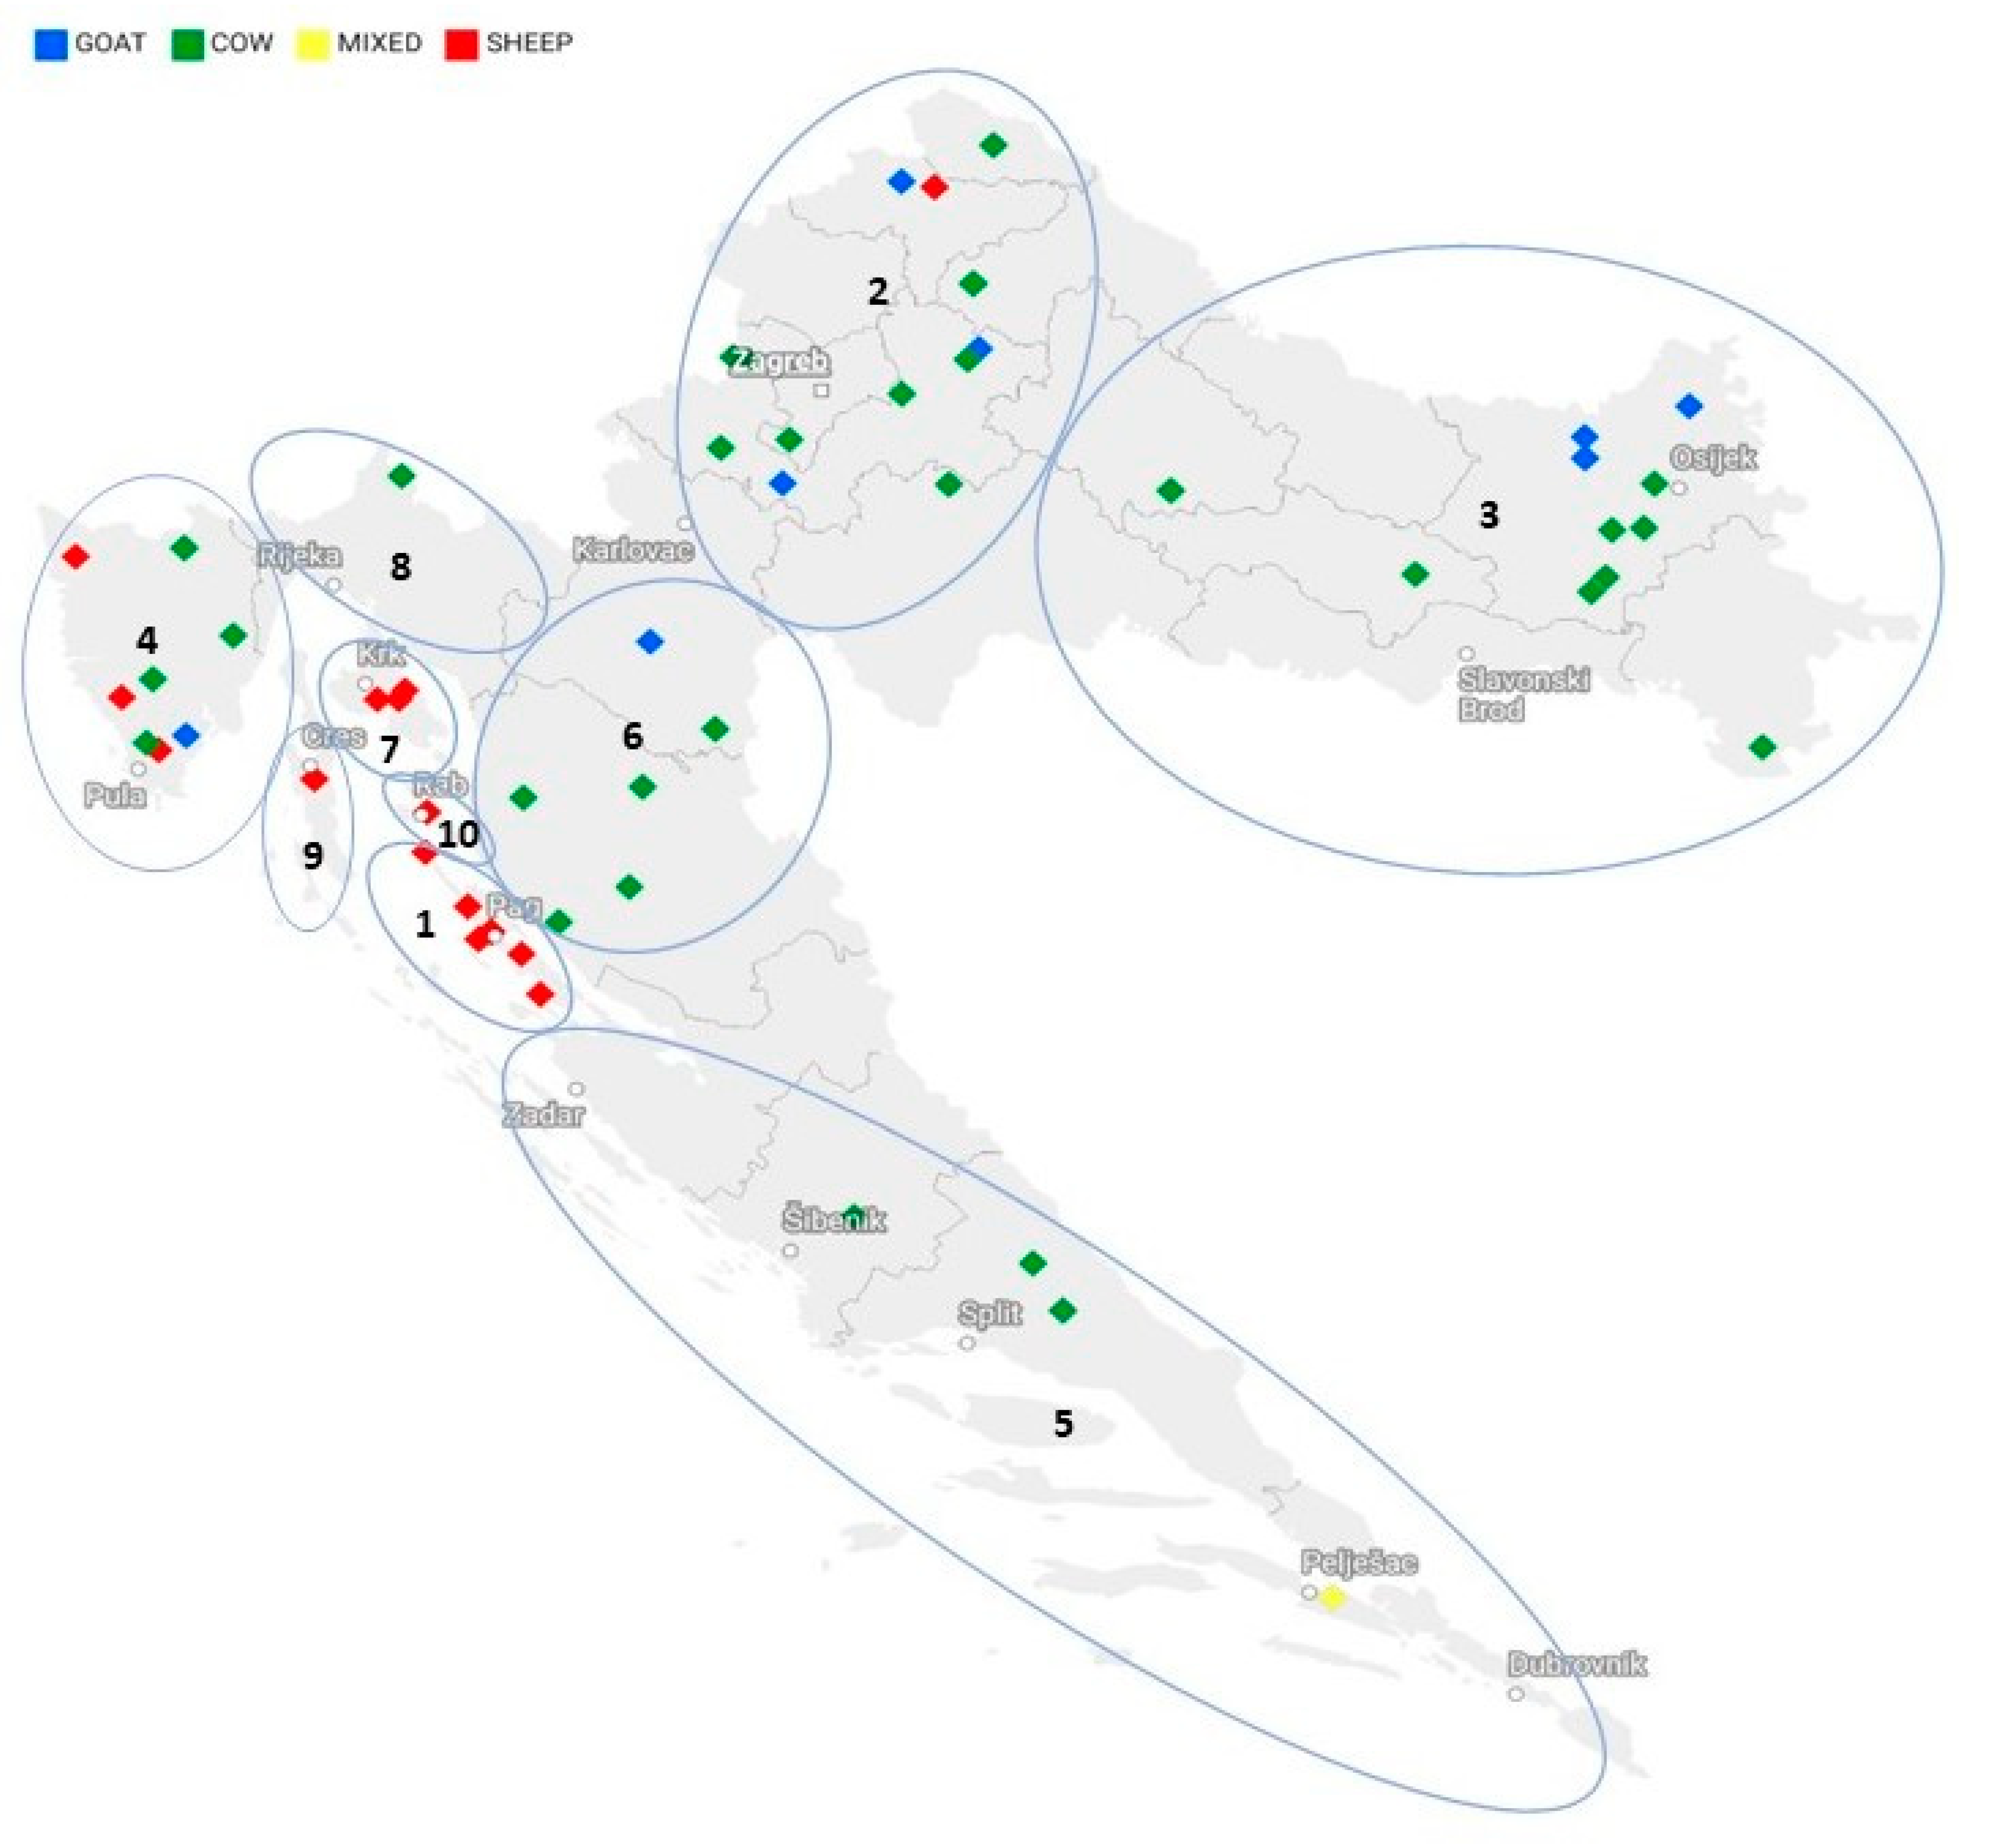
2.1. Sample
2.2. Methods for the Determination of Target Compounds in Cheese Samples
2.2.1. Sample Preparation and Extraction Procedure
2.2.2. Determination of Pesticide Residues
GC-MS/MS Analysis
LC-MS/MS Analysis
ICP-MS Analysis
2.3. Physicochemical Cheese Analysis
2.4. Statistical Analyses
3. Results and Discussion
4. Conclusions
Author Contributions
Funding
Institutional Review Board Statement
Informed Consent Statement
Data Availability Statement
Conflicts of Interest
References
- International Dairy Foods Association (IDFA). History of Cheese. Available online: https://www.idfa.org/history-of-cheese (accessed on 22 April 2023).
- Santiago-López, L.; Aguilar-Toalá, J.E.; Hernández-Mendoza, A.; Vallejo-Cordoba, B.; Liceaga, A.M.; González-Córdova, A.F. Invited Review: Bioactive Compounds Produced during Cheese Ripening and Health Effects Associated with Aged Cheese Consumption. J. Dairy Sci. 2018, 101, 3742–3757. [Google Scholar] [CrossRef]
- Helal, A.; Tagliazucchi, D. Peptidomics Profile, Bioactive Peptides Identification and Biological Activities of Six Different Cheese Varieties. Biology 2023, 12, 78. [Google Scholar] [CrossRef]
- Tunick, M.H.; Van Hekken, D.L. Dairy Products and Health: Recent Insights. J. Agric. Food Chem. 2015, 63, 9381–9388. [Google Scholar] [CrossRef]
- Pasin, G.; Comerford, K.B. Dairy Foods and Dairy Proteins in the Management of Type 2 Diabetes: A Systematic Review of the Clinical Evidence. Adv. Nutr. 2015, 6, 245–259. [Google Scholar] [CrossRef]
- Miller, V.; Reedy, J.; Cudhea, F.; Zhang, J.; Shi, P.; Erndt-Marino, J.; Coates, J.; Micha, R.; Webb, P.; Mozaffarian, D.; et al. Global, Regional, and National Consumption of Animal-Source Foods between 1990 and 2018: Findings from the Global Dietary Database. Lancet Planet Health 2022, 6, e243–e256. [Google Scholar] [CrossRef]
- Feeney, E.L.; Lamichhane, P.; Sheehan, J.J. The Cheese Matrix: Understanding the Impact of Cheese Structure on Aspects of Cardiovascular Health—A Food Science and a Human Nutrition Perspective. Int. J. Dairy Technol. 2021, 74, 656–670. [Google Scholar] [CrossRef]
- Croatian Bureau of Statistics. Basic Characteristics of Household Consumption in 2019. Available online: https://web.dzs.hr/Hrv_Eng/publication/2020/14-01-02_01_2020.htm (accessed on 1 December 2023).
- Croatian Bureau of Statistics. Production and Use of Milk on Agricultural Farms in 2022, POLJ-2023-3-7. Available online: https://podaci.dzs.hr/2023/hr/58415 (accessed on 1 December 2023).
- Pesticide Action Network Europe. Banned and Hazardous Pesticides in European Food. Available online: https://www.pan-europe.info/resources/reports/2020/09/banned-and-hazardous-pesticides-european-food (accessed on 12 April 2023).
- Witczak, A.; Pohoryło, A. The Estimation of Consumer Health Risk Associated with Organochlorine Xenobiotics in Hard Smoked Cheese in Poland. J. Environ. Sci. Health Part B 2015, 50, 595–606. [Google Scholar] [CrossRef]
- European Food Safety Authority (EFSA). Pesticides. Available online: https://www.efsa.europa.eu/en/topics/topic/pesticides (accessed on 22 April 2023).
- Schopf, M.F.; Pierezan, M.D.; Rocha, R.; Pimentel, T.C.; Esmerino, E.A.; Marsico, E.T.; De Dea Lindner, J.; da Cruz, A.G.; Verruck, S. Pesticide Residues in Milk and Dairy Products: An Overview of Processing Degradation and Trends in Mitigating Approaches. Crit. Rev. Food Sci. Nutr. 2022, 63, 12610–12624. [Google Scholar] [CrossRef]
- Koller, M.; Saleh, H.M. Introductory Chapter: Introducing Heavy Metals. In Heavy Metals; InTech: London, UK, 2018. [Google Scholar] [CrossRef]
- Reinholds, I.; Rusko, J.; Pugajeva, I.; Berzina, Z.; Jansons, M.; Kirilina-Gutmane, O.; Tihomirova, K.; Bartkevics, V. The Occurrence and Dietary Exposure Assessment of Mycotoxins, Biogenic Amines, and Heavy Metals in Mould-Ripened Blue Cheeses. Foods 2020, 9, 93. [Google Scholar] [CrossRef]
- Kim, J.-H.; Byun, H.-M.; Chung, E.-C.; Chung, H.-Y.; Bae, O.-N. Loss of Integrity: Impairment of the Blood-Brain Barrier in Heavy Metal-Associated Ischemic Stroke. Toxicol. Res. 2013, 29, 157–164. [Google Scholar] [CrossRef]
- Batool, F.; Iqbal, S.; Tariq, M.I.; Akbar, J.; Noreen, S.; Danish, M.; Chan, K.W. MILK: Carrier of Heavy Metals from Crops through Ruminant Body to Human Beings. J. Chem. Soc. Pak. 2016, 38, 39. [Google Scholar]
- Mitra, S.; Chakraborty, A.J.; Tareq, A.M.; Bin Emran, T.; Nainu, F.; Khusro, A.; Idris, A.M.; Khandaker, M.U.; Osman, H.; Alhumaydhi, F.A.; et al. Impact of Heavy Metals on the Environment and Human Health: Novel Therapeutic Insights to Counter the Toxicity. J. King Saud. Univ. Sci. 2022, 34, 101865. [Google Scholar] [CrossRef]
- Năstăsescu, V.; Mititelu, M.; Goumenou, M.; Docea, A.O.; Renieri, E.; Udeanu, D.I.; Oprea, E.; Arsene, A.L.; Dinu-Pîrvu, C.E.; Ghica, M. Heavy Metal and Pesticide Levels in Dairy Products: Evaluation of Human Health Risk. Food Chem. Toxicol. 2020, 146, 111844. [Google Scholar] [CrossRef] [PubMed]
- Rehman, K.; Fatima, F.; Waheed, I.; Akash, M.S.H. Prevalence of Exposure of Heavy Metals and Their Impact on Health Consequences. J. Cell. Biochem. 2018, 119, 157–184. [Google Scholar] [CrossRef] [PubMed]
- Li, B.; Xia, M.; Zorec, R.; Parpura, V.; Verkhratsky, A. Astrocytes in Heavy Metal Neurotoxicity and Neurodegeneration. Brain Res. 2021, 1752, 147234. [Google Scholar] [CrossRef]
- European Food Safety Authority (EFSA). Pesticide Evaluation: Tools. Available online: https://www.efsa.europa.eu/en/applications/pesticides/tools (accessed on 23 April 2023).
- European Chemicals Agency (ECHA). Regulation (EU) No 528/2012 Concerning the Making Available on the Market and Use of Biocidal Products, Evaluation of Active Substances, Assessment Report, Piperonyl Butoxide Product-Type 18 (Insecticides, Acaricides and Products to Control Other Arthropods), January 2017, Greece. Available online: https://echa.europa.eu/documents/10162/a521088e-3a21-2bba-96ad-a1fd55e91325 (accessed on 24 April 2023).
- EFSA CONTAM Panel. Cadmium in Food—Scientific Opinion of the Panel on Contaminants in the Food Chain. EFSA J. 2009, 7, 980. [Google Scholar] [CrossRef]
- EFSA CONTAM Panel. Scientific Opinion on the Risks to Public Health Related to the Presence of Chromium in Food and Drinking Water. EFSA J. 2014, 12, 3595. [Google Scholar] [CrossRef]
- Schrenk, D.; Bignami, M.; Bodin, L.; Chipman, J.K.; del Mazo, J.; Grasl-Kraupp, B.; Hogstrand, C.; Hoogenboom, L.; Leblanc, J.; Nebbia, C.S.; et al. Update of the Risk Assessment of Nickel in Food and Drinking Water. EFSA J. 2020, 18, e06268. [Google Scholar] [CrossRef]
- EFSA CONTAM Panel. Scientific Opinion on Lead in Food. EFSA J. 2010, 8, 1570. [Google Scholar] [CrossRef]
- European Commission. Regulation No 1881/2006 of 19 December 2006 Setting Maximum Levels for Certain Contaminants in Foodstuffs (OJ L 364, 20.12.2006, p. 5). Available online: https://eur-lex.europa.eu/legal-content/EN/TXT/HTML/?uri=CELEX%3A32021R1323, (accessed on 2 February 2024).
- Moreno-Rojas, R.; Sánchez-Segarra, P.J.; Cámara-Martos, F.; Amaro-López, M.A. Heavy Metal Levels in Spanish Cheeses: Influence of Manufacturing Conditions. Food Addit. Contam. Part B 2010, 3, 90–100. [Google Scholar] [CrossRef]
- Castro-González, N.P.; Calderón-Sánchez, F.; Castro de Jesús, J.; Moreno-Rojas, R.; Tamariz-Flores, J.V.; Pérez-Sato, M.; Soní-Guillermo, E. Heavy Metals in Cow’s Milk and Cheese Produced in Areas Irrigated with Waste Water in Puebla, Mexico. Food Addit. Contam. Part B 2018, 11, 33–36. [Google Scholar] [CrossRef]
- Anastassiades, M.; Lehotay, S.J.; Štajnbaher, D.; Schenck, F.J. Fast and Easy Multiresidue Method Employing Acetonitrile Extraction/Partitioning and “Dispersive Solid-Phase Extraction” for the Determination of Pesticide Residues in Produce. J. AOAC Int. 2003, 86, 412–431. [Google Scholar] [CrossRef]
- Lehotay, S.J.; Son, K.A.; Kwon, H.; Koesukwiwat, U.; Fu, W.; Mastovska, K.; Hoh, E.; Leepipatpiboon, N. Comparison of QuEChERS Sample Preparation Methods for the Analysis of Pesticide Residues in Fruits and Vegetables. J. Chromatogr. A 2010, 1217, 2548–2560. [Google Scholar] [CrossRef]
- He, Z.; Wang, Y.; Wang, L.; Peng, Y.; Wang, W.; Liu, X. Determination of 255 Pesticides in Edible Vegetable Oils Using QuEChERS Method and Gas Chromatography Tandem Mass Spectrometry. Anal. Bioanal. Chem. 2017, 409, 1017–1030. [Google Scholar] [CrossRef]
- Anagnostopoulos, C.; Miliadis, G.E. Development and Validation of an Easy Multiresidue Method for the Determination of Multiclass Pesticide Residues Using GC–MS/MS and LC–MS/MS in Olive Oil and Olives. Talanta 2013, 112, 1–10. [Google Scholar] [CrossRef] [PubMed]
- SANTE/2020/12830 Guidance Document on Analytical Quality Control and Method Validation Procedures for Pesticide Residues and Analysis in Food and Feed. Available online: https://food.ec.europa.eu/system/files/2023-04/pesticides_mrl_guidelines_2020-12830.pdf (accessed on 2 February 2024).
- European Commission. Regulation No 396/2005 of the European Parliament and of the Council of 23 February 2005 on Maximum Residue Levels of Pesticides in or on Food and Feed of Plant and Animal Origin and Amending Council Directive 91/414/EEC, OJ L 70, 16.3.2005. Available online: https://eur-lex.europa.eu/eli/reg/2005/396/oj (accessed on 2 February 2024).
- HRN EN ISO/IEC 17025:2017; General Requirements for the Competence of Testing and Calibration Laboratories. Croatian Standard Institute: Zagreb, Croatia, 2017.
- HRN EN ISO 5534:2008; Cheese and Processed Cheese—Determination of the Total Solids Content (Reference Method). Croatian Standard Institute: Zagreb, Croatia, 2008.
- HRN EN ISO 8968-1:2014; Milk and Milk Products—Determination of Nitrogen Content, Part 1: Kjeldahl Principle and Crude Protein Calculation. Croatian Standard Institute: Zagreb, Croatia, 2014.
- HRN ISO ISO 3433:2008; Cheese—Determination of Fat Content—Van Gulik Method. Croatian Standard Institute: Zagreb, Croatia, 2008.
- HRN EN ISO 5943:2007; Cheese and Processed Cheese—Determination of Chloride Content Potentiometric Titration Method. Croatian Standard Institute: Zagreb, Croatia, 2007.
- SAS®. SAS User’s Guide: Statistics; Release 9.4; SAS Institute, Inc.: Cary, NC, USA, 2013. [Google Scholar]
- Mallatou, H.; Pappas, C.P.; Kondyli, E.; Albanis, T.A. Pesticide Residues in Milk and Cheeses from Greece. Sci. Total Environ. 1997, 196, 111–117. [Google Scholar] [CrossRef] [PubMed]
- Llobet, J.M.; Falcó, G.; Casas, C.; Teixidó, A.; Domingo, J.L. Concentrations of Arsenic, Cadmium, Mercury, and Lead in Common Foods and Estimated Daily Intake by Children, Adolescents, Adults, and Seniors of Catalonia, Spain. J. Agric. Food Chem. 2003, 51, 838–842. [Google Scholar] [CrossRef]
- Qin, L.-Q.; Wang, X.-P.; Li, W.; Tong, X.; Tong, W.-J. The Minerals and Heavy Metals in Cow’s Milk from China and Japan. J. Health Sci. 2009, 55, 300–305. [Google Scholar] [CrossRef]
- Bilandžić, N.; Đokić, M.; Sedak, M.; Solomun, B.; Varenina, I.; Knežević, Z.; Benić, M. Trace Element Levels in Raw Milk from Northern and Southern Regions of Croatia. Food Chem. 2011, 127, 63–66. [Google Scholar] [CrossRef]
- Christophoridis, C.; Kosma, A.; Evgenakis, E.; Bourliva, A.; Fytianos, K. Determination of Heavy Metals and Health Risk Assessment of Cheese Products Consumed in Greece. J. Food Compos. Anal. 2019, 82, 103238. [Google Scholar] [CrossRef]
- Vural, A.; Narin, I.; Erkan, M.E.; Soylak, M. Trace Metal Levels and Some Chemical Parameters in Herby Cheese Collected from South Eastern Anatolia-Turkey. Environ. Monit. Assess. 2008, 139, 27–33. [Google Scholar] [CrossRef]
- Favretto, L.G. Investigation of Trace Element Content of Cheese. Food Addit. Contam. 1990, 7, 425–432. [Google Scholar] [CrossRef]
- Suturović, Z.; Kravić, S.; Milanović, S.; Đurović, A.; Brezo, T. Determination of Heavy Metals in Milk and Fermented Milk Products by Potentiometric Stripping Analysis with Constant Inverse Current in the Analytical Step. Food Chem. 2014, 155, 120–125. [Google Scholar] [CrossRef]
- McNamara, J.P.; Valdez, F. Adipose Tissue Metabolism and Production Responses to Calcium Propionate and Chromium Propionate. J. Dairy. Sci. 2005, 88, 2498–2507. [Google Scholar] [CrossRef]
- Spears, J.W. Micronutrients and Immune Function in Cattle. Proc. Nutr. Soc. 2000, 59, 587–594. [Google Scholar] [CrossRef]
- Bratakos, M. Chromium Content of Selected Greek Foods. Sci. Total Environ. 2002, 290, 47–58. [Google Scholar] [CrossRef]
- European Commission. Regulation 2021/1317 of 9 August 2021 Amending Regulation (EC) No 1881/2006 as Regards Maximum Levels of Lead in Certain Foodstuffs. Available online: https://eur-lex.europa.eu/eli/reg/2021/1317/oj (accessed on 2 February 2024).

| Type | Cd [mg kg−1] | Cr [mg kg−1] | Mn [mg kg−1] | Ni [mg kg−1] | Pb [mg kg−1] | N |
|---|---|---|---|---|---|---|
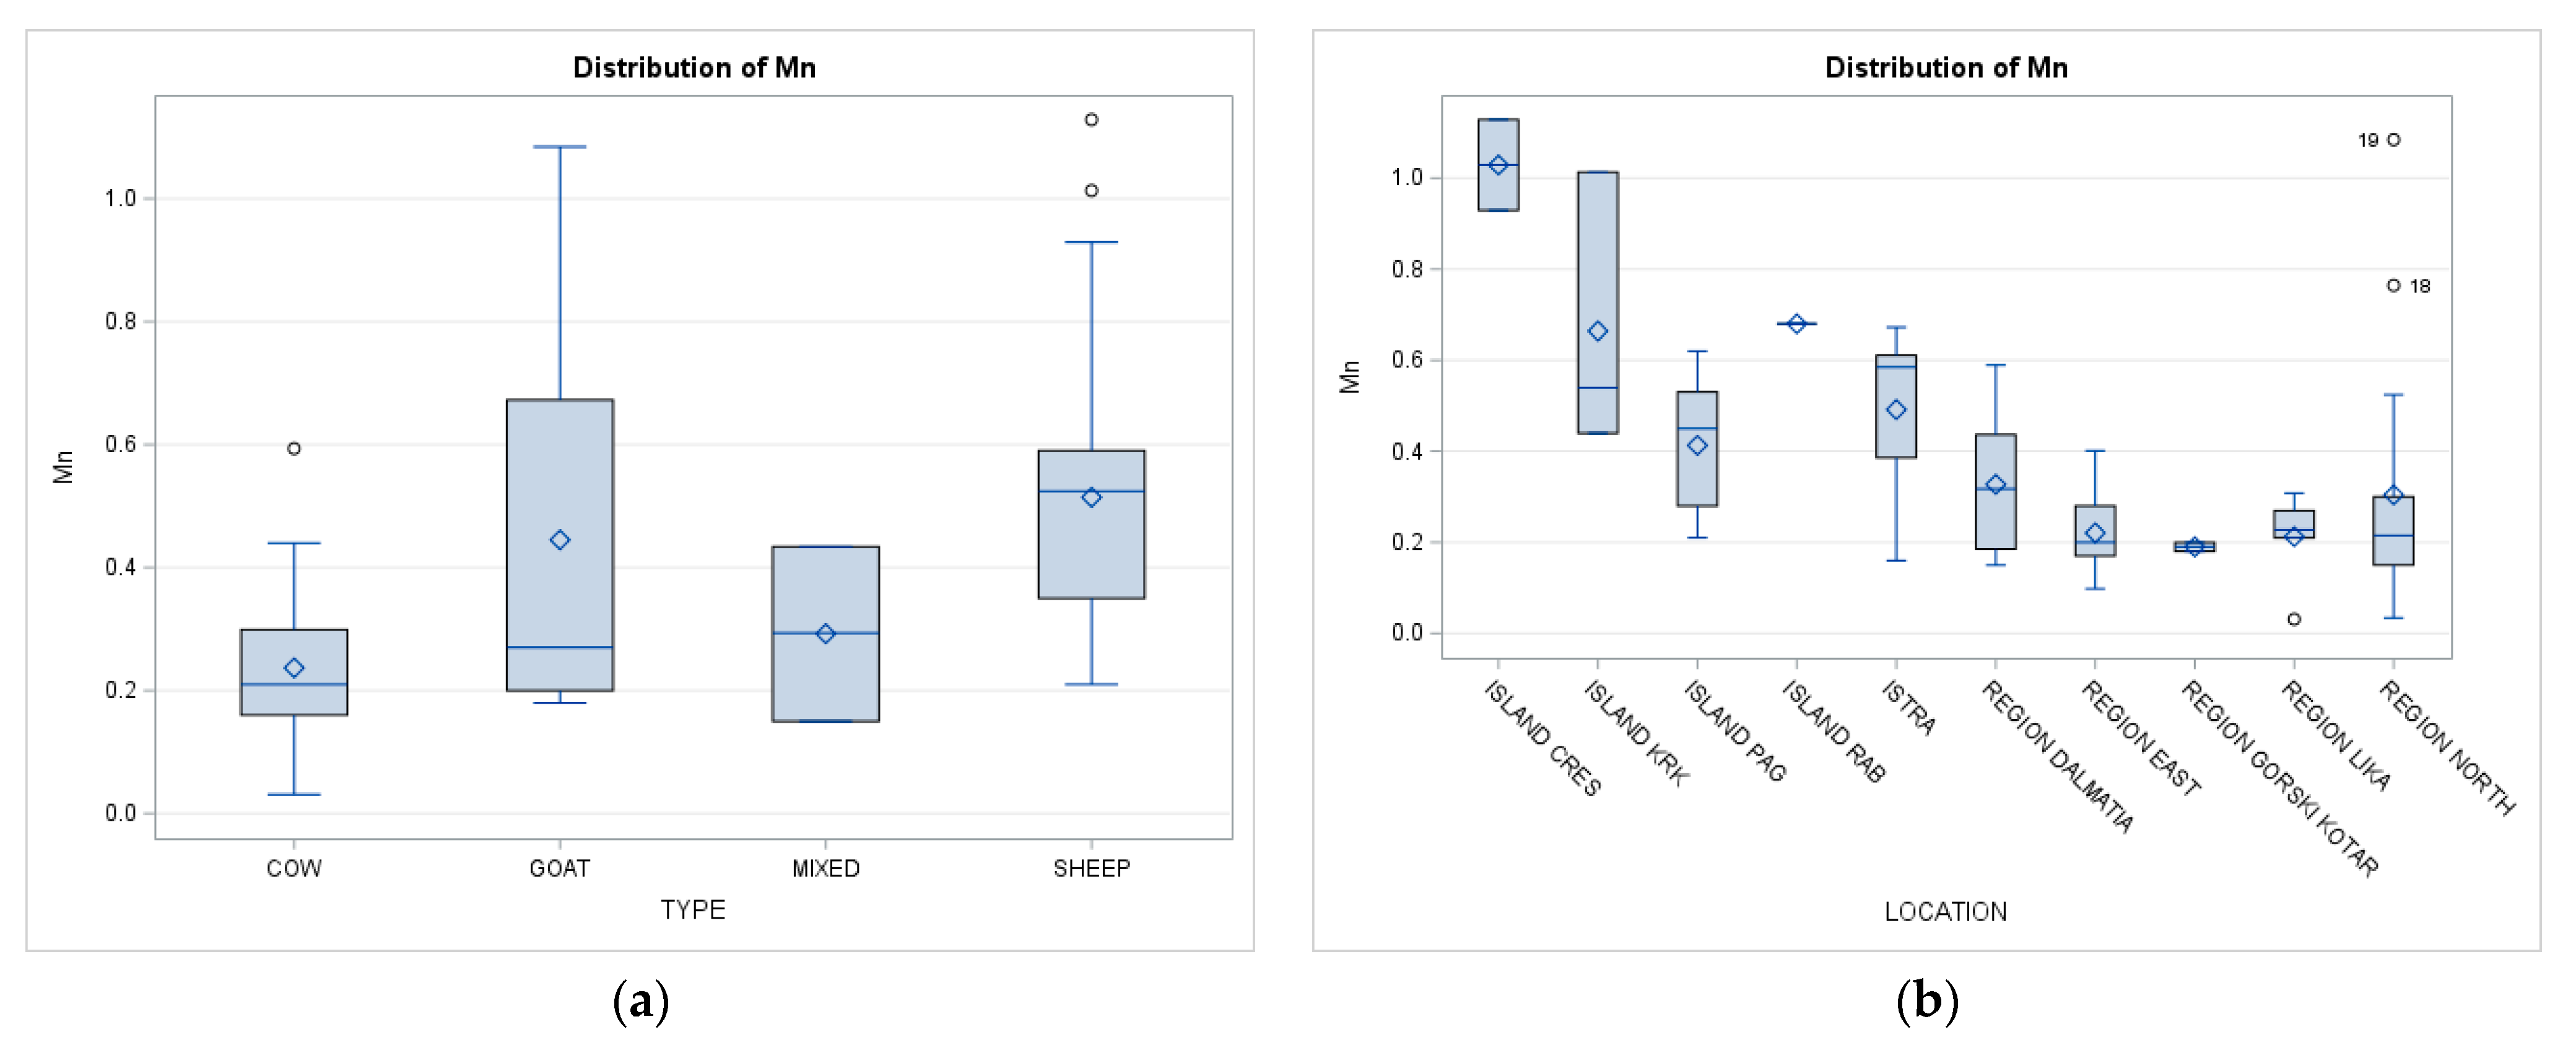
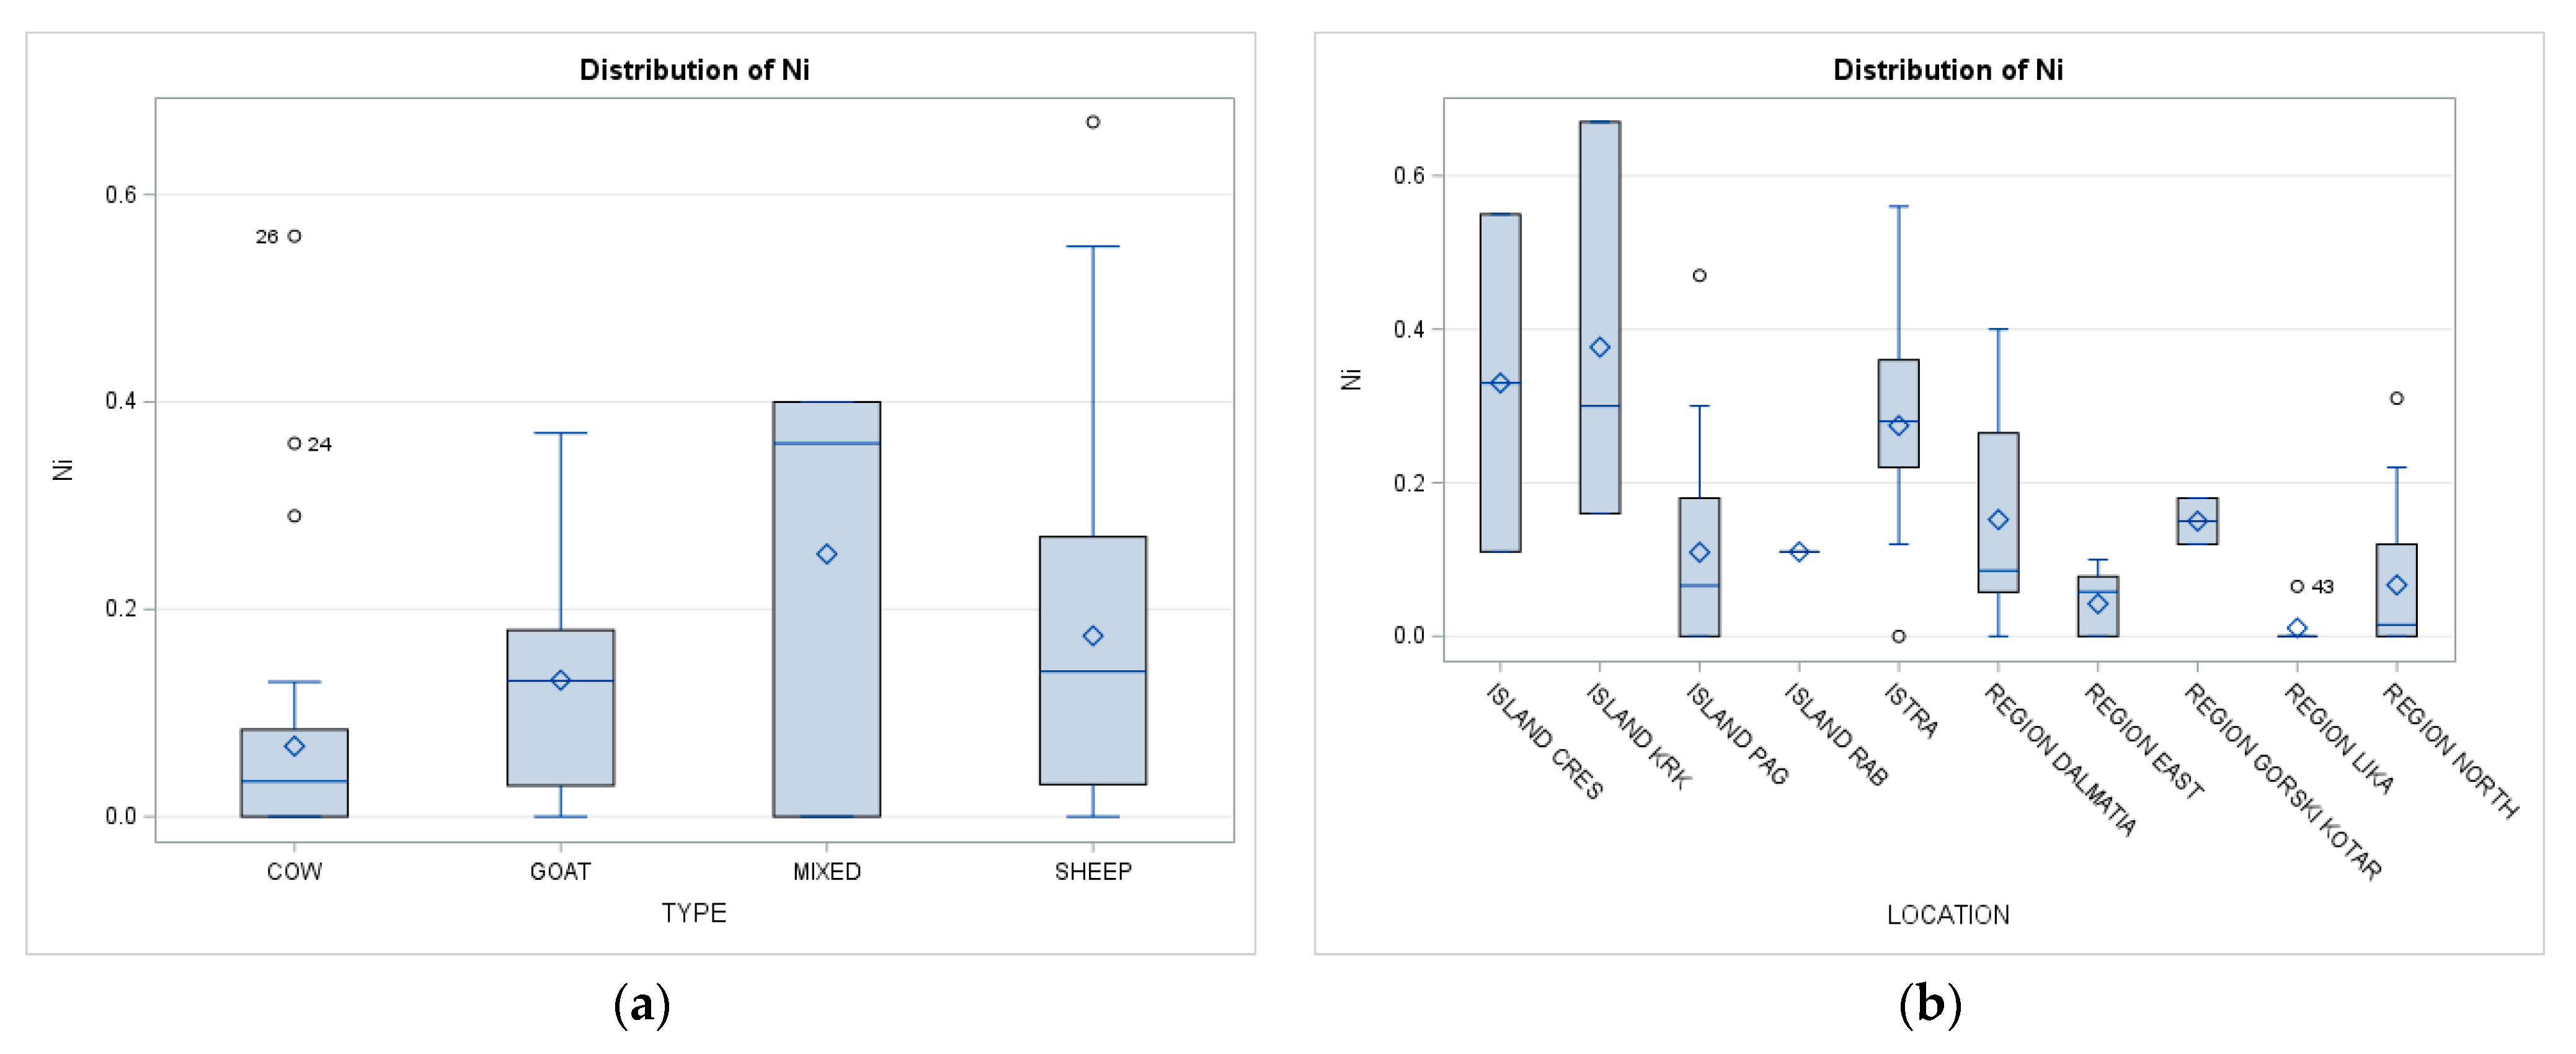
| Cow | <LOQ | 0.129 ± 0.129 | 0.237 ± 0.118 a | 0.068 ± 0.115 a | 0.023 ± 0.025 | 37 |
| Sheep | <LOQ | 0.110 ± 0.096 | 0.514 ± 0.223 b | 0.174 ± 0.173 ab | 0.029 ± 0.021 | 29 |
| Goat | <LOQ | 0.180 ± 0.247 | 0.445 ± 0.314 bc | 0.132 ± 0.116 ab | 0.029 ± 0.010 | 10 |
| Mixed | <LOQ | 0.163 ± 0.146 | 0.292 ± 0.142 ac | 0.253 ± 0.220 b | 0.027 ± 0.012 | 3 |
| Region Code | Cd [mg kg−1] | Cr [mg kg−1] | Mn [mg kg−1] | Ni [mg kg−1] | Pb [mg kg−1] | N |
|---|---|---|---|---|---|---|
| Pag Island (1) | <LOQ | 0.076 ± 0.092 | 0.413 ± 0.138 abc | 0.109 ± 0.129 ab | 0.026 ± 0.020 ab | 19 |
| North Region (2) | <LOQ | 0.136 ± 0.117 | 0.304 ± 0.272 bc | 0.067 ± 0.096 ab | 0.021 ± 0.022 ab | 16 |
| East Region (3) | <LOQ | 0.179 ± 0.235 | 0.221 ± 0.084 b | 0.042 ± 0.042 a | 0.021 ± 0.014 a | 13 |
| Istra | <LOQ | 0.194 ± 0.112 | 0.492 ± 0.166 acd | 0.274 ± 0.158 bcd | 0.043 ± 0.032 bcd | 9 |
| Dalmatia Region (4) | <LOQ | 0.115 ± 0.108 | 0.327 ± 0.155 bc | 0.152 ± 0.149 abd | 0.029 ± 0.018 abd | 8 |
| Lika Region (5) (6) | <LOQ | 0.087 ± 0.119 | 0.212 ± 0.096 b | 0.011 ± 0.027 a | 0.016 ± 0.013 a | 6 |
| Krk Island (7) | <LOQ | 0.217 ± 0.015 | 0.664 ± 0.306 ad | 0.377 ± 0.264 c | 0.036 ± 0.033 c | 3 |
| Gorski Kotar Region (8) | <LOQ | 0.034 ± 0.047 | 0.190 ± 0.014 b | 0.150 ± 0.042 abd | 0.023 ± 0.004 abd | 2 |
| Cres Island (9) | <LOQ | 0.181 ± 0.126 | 1.029 ± 0.141 e | 0.330 ± 0.311 cd | 0.048 ± 0.002 cd | 2 |
| Rab Island (10) | <LOQ | 0.046 ± 0.000 | 0.680 ± 0.000 d | 0.110 ± 0.000 ab | <LOQab | 1 |
| Cheese Type | Fat [g 100 g−1] | Protein [g 100 g−1] | Total Solids [g 100 g−1] | NaCl [g 100 g−1] | pH Value | N |
|---|---|---|---|---|---|---|
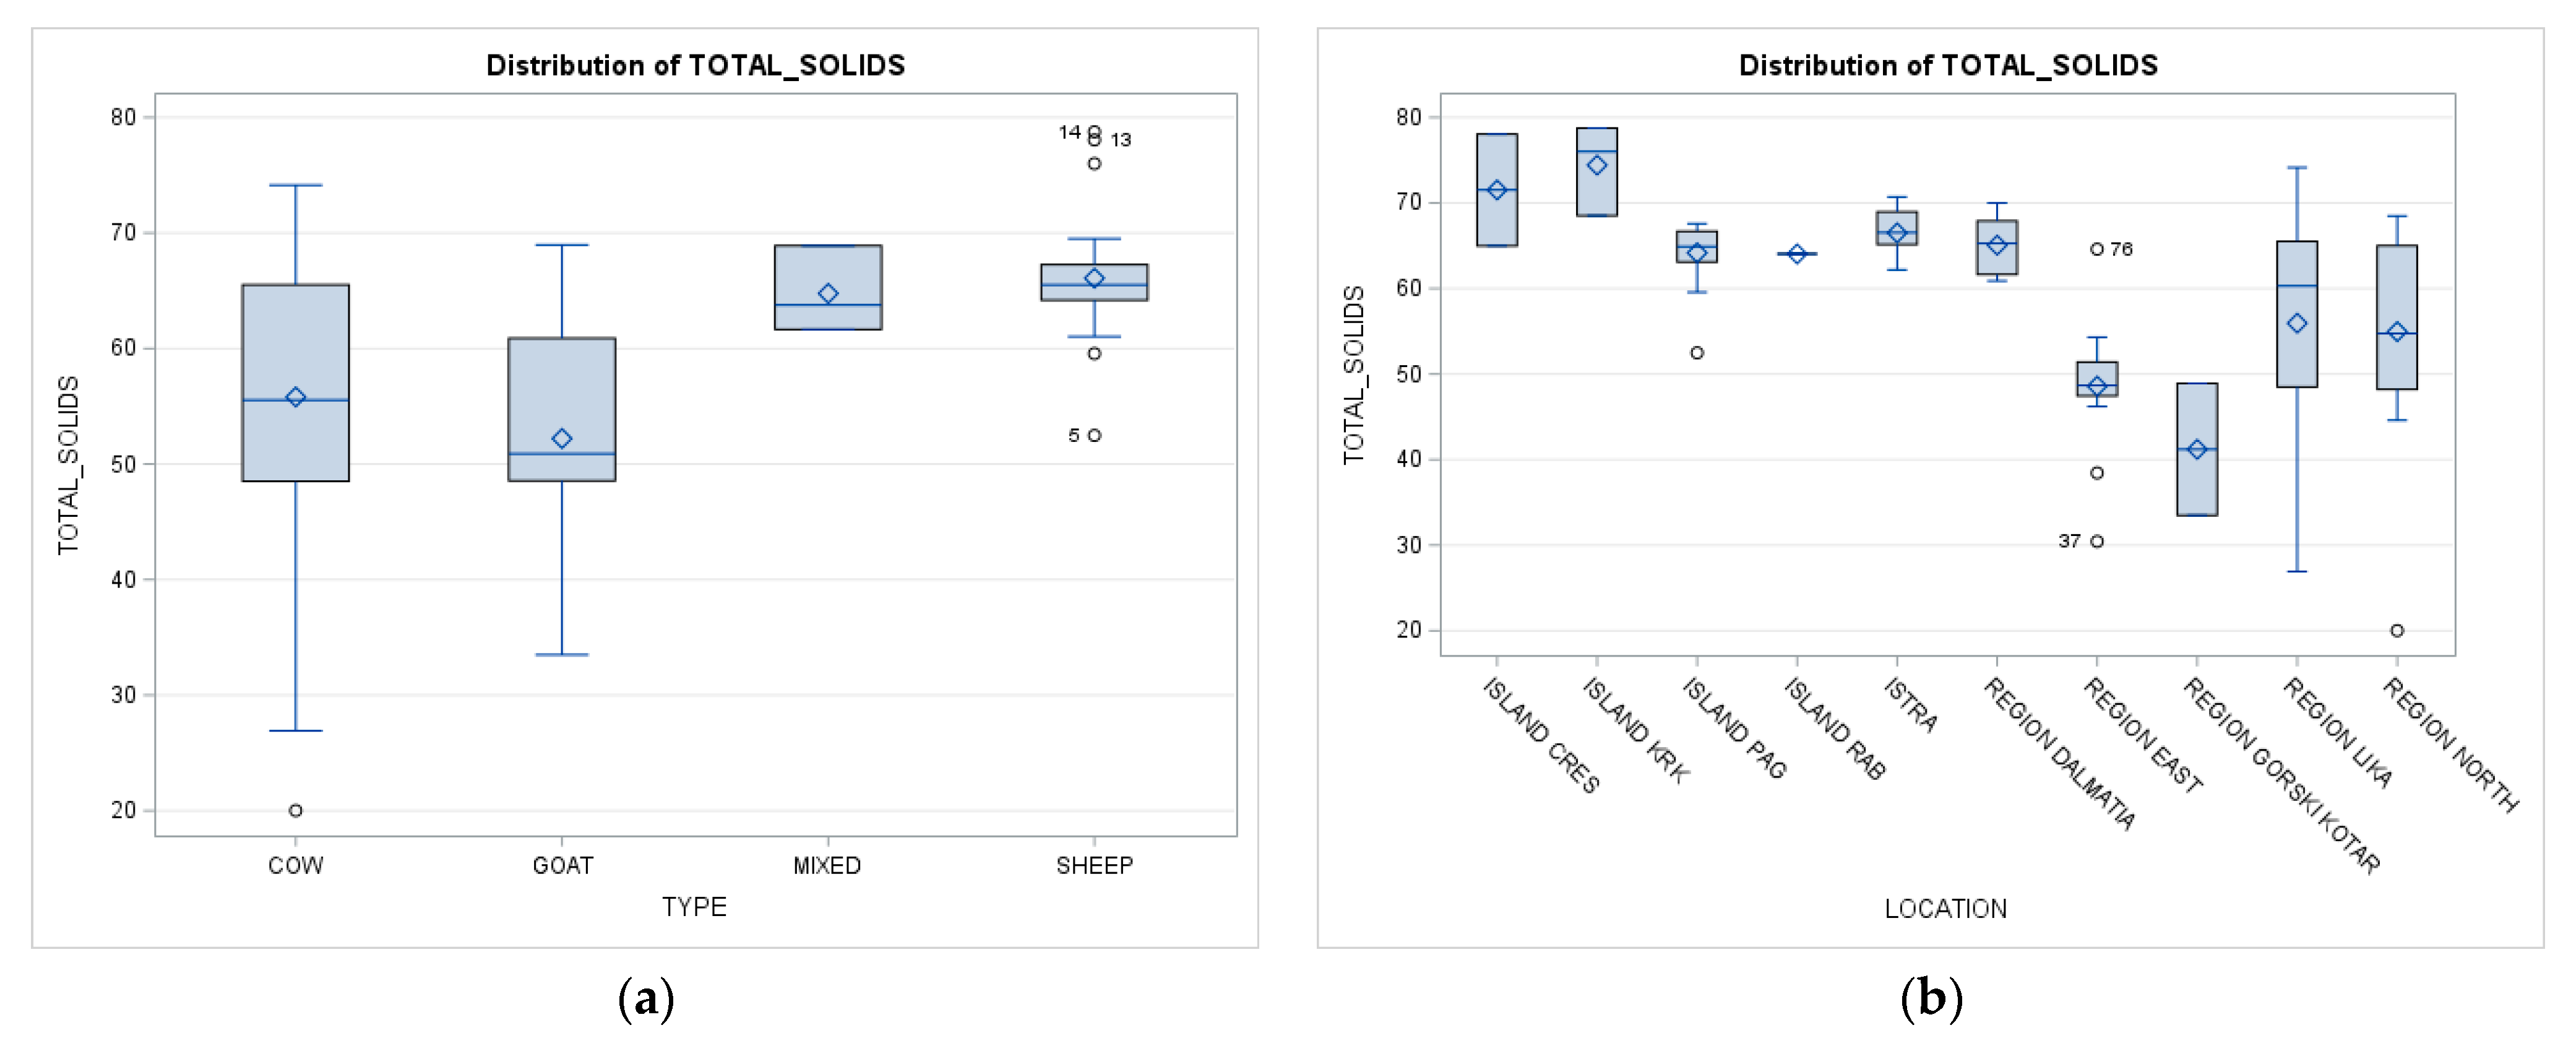
| Cow | 50.622 ± 4.635 ab | 39.173 ± 3.003 a | 55.805 ± 12.499 a | 1.220 ± 0.898 a | 5.312 ± 0.315 | 37 |
| Sheep | 55.201 ± 6.616 b | 38.214 ± 2.543 a | 66.087 ± 5.098 b | 1.353 ± 0.568 a | 5.130 ± 0.193 | 29 |
| Goat | 49.913 ± 5.643 ab | 40.437 ± 4.804 ab | 52.211 ± 11.113 a | 1.302 ± 0.706 a | 5.261 ± 0.451 | 10 |
| Mixed | 46.894 ± 7.614 a | 42.589 ± 6.114 b | 64.767 ± 3.723 b | 2.147 ± 0.653 b | 5.103 ± 0.125 | 3 |
| Region Code | Fat [g 100 g−1] | Protein [g 100 g−1] | Total Solids [g 100 g−1] | NaCl [g 100 g−1] | pH Value | N |
|---|---|---|---|---|---|---|
| Island Pag (1) | 56.131 ± 7.902 | 38.103 ± 2.318 ab | 64.174 ± 3.556 ab | 1.329 ± 0.301 abc | 5.070 ± 0.180 ab | 19 |
| Region North (2) | 51.019 ± 4.937 | 39.415 ± 3.047 ab | 54.958 ± 12.531 acd | 1.195 ± 0.958 abc | 5.326 ± 0.399 ab | 16 |
| Region East (3) | 49.636 ± 4.543 | 39.136 ± 4.761 ab | 48.586 ± 7.934 cd | 1.268 ± 0.723 abc | 5.482 ± 0.224 b | 13 |
| Istra | 51.416 ± 4.203 | 39.628 ± 2.056 ab | 66.502 ± 3.011 ab | 0.908 ± 0.241 ac | 5.113 ± 0.161 ab | 9 |
| Region (4) Dalmatia | 49.172 ± 5.330 | 41.453 ± 3.841 b | 65.064 ± 3.542 ab | 1.908 ± 0.924 ab | 5.203 ± 0.128 ab | 8 |
| Region (5) Lika (6) | 48.836 ± 4.714 | 39.991 ± 1.899 ab | 55.945 ± 16.755 ac | 1.297 ± 1.094 abc | 5.287 ± 0.139 ab | 6 |
| Island Krk (7) | 54.156 ± 2.089 | 35.921 ± 4.537 ab | 74.423 ± 5.294 b | 1.570 ± 0.243 abc | 5.173 ± 0.038 ab | 3 |
| Region Gorski Kotar (8) | 59.506 ± 0.302 | 35.342 ± 4.291 a | 41.200 ± 10.904 d | 0.815 ± 0.247 ac | 4.955 ± 1.110 a | 2 |
| Island Cres (9) | 51.720 ± 5.195 | 40.111 ± 3.195 ab | 71.520 ± 9.235 b | 2.490 ± 1.655 b | 5.310 ± 0.141 ab | 2 |
| Island Rab (10) | 51.530 ± 0.000 | 39.444 ± 0.000 ab | 64.040 ± 0.000 ab | 0.440 ± 0.000 c | 5.000 ± 0.000 ab | 1 |
| Cd | Cr | Mn | Ni | Pb | Fat | Protein | TS | NaCl | pH Value | |
|---|---|---|---|---|---|---|---|---|---|---|
| Cd p | 1.000 | |||||||||
| Cr p | −0.07 0.56 | 1.000 | ||||||||
| Mn p | −0.05 0.67 | 0.14 0.23 | 1.000 | |||||||
| Ni p | −0.09 0.42 | 0.45 <0.001 | 0.58 <0.001 | 1.000 | ||||||
| Pb p | 0.01 0.89 | 0.43 <0.001 | 0.47 <0.001 | 0.55 <0.001 | 1.000 | |||||
| Fat p | −0.06 0.61 | −0.13 0.24 | 0.18 0.10 | −0.02 0.82 | 0.10 0.37 | 1.000 | ||||
| Protein p | 0.08 0.46 | 0.14 0.20 | −0.01 0.90 | 0.04 0.72 | −0.03 0.79 | −0.49 <0.001 | 1.000 | |||
| TS p | −0.11 0.33 | −0.05 0.65 | 0.47 <0.001 | 0.36 <0.01 | 0.09 0.38 | 0.24 0.02 | −0.01 0.88 | 1.000 | ||
| NaCl p | −0.05 0.60 | 0.08 0.48 | 0.14 0.22 | 0.16 0.17 | 0.006 0.95 | −0.15 0.18 | 0.09 0.43 | 0.26 0.02 | 1.000 | |
| pH p | 0.10 0.35 | 0.12 0.29 | −0.09 0.42 | −0.07 0.52 | −0.003 0.97 | −0.09 0.39 | 0.05 0.64 | −0.20 0.07 | 0.06 0.54 | 1.000 |
Disclaimer/Publisher’s Note: The statements, opinions and data contained in all publications are solely those of the individual author(s) and contributor(s) and not of MDPI and/or the editor(s). MDPI and/or the editor(s) disclaim responsibility for any injury to people or property resulting from any ideas, methods, instructions or products referred to in the content. |
© 2024 by the authors. Licensee MDPI, Basel, Switzerland. This article is an open access article distributed under the terms and conditions of the Creative Commons Attribution (CC BY) license (https://creativecommons.org/licenses/by/4.0/).
Share and Cite
Krivohlavek, A.; Palac Bešlić, I.; Jurak, G.; Gavran, M.; Mandić Andačić, I.; Ivešić, M.; Šikić, S.; Vitale, K.; Štefančić, M.; Žuntar, I.; et al. Heavy Metals and Pesticide Residues in Small Farm Cheese Production in Croatia—Challenge between Quality and Quantity. Sustainability 2024, 16, 1356. https://doi.org/10.3390/su16041356
Krivohlavek A, Palac Bešlić I, Jurak G, Gavran M, Mandić Andačić I, Ivešić M, Šikić S, Vitale K, Štefančić M, Žuntar I, et al. Heavy Metals and Pesticide Residues in Small Farm Cheese Production in Croatia—Challenge between Quality and Quantity. Sustainability. 2024; 16(4):1356. https://doi.org/10.3390/su16041356
Chicago/Turabian StyleKrivohlavek, Adela, Iva Palac Bešlić, Gordana Jurak, Magdalena Gavran, Ivana Mandić Andačić, Martina Ivešić, Sandra Šikić, Ksenija Vitale, Marko Štefančić, Irena Žuntar, and et al. 2024. "Heavy Metals and Pesticide Residues in Small Farm Cheese Production in Croatia—Challenge between Quality and Quantity" Sustainability 16, no. 4: 1356. https://doi.org/10.3390/su16041356