

Assessing Hydropower Potential under Shared Socioeconomic Pathways Scenarios Using Integrated Assessment Modelling
 , , , , , and
Abstract
:1. Introduction
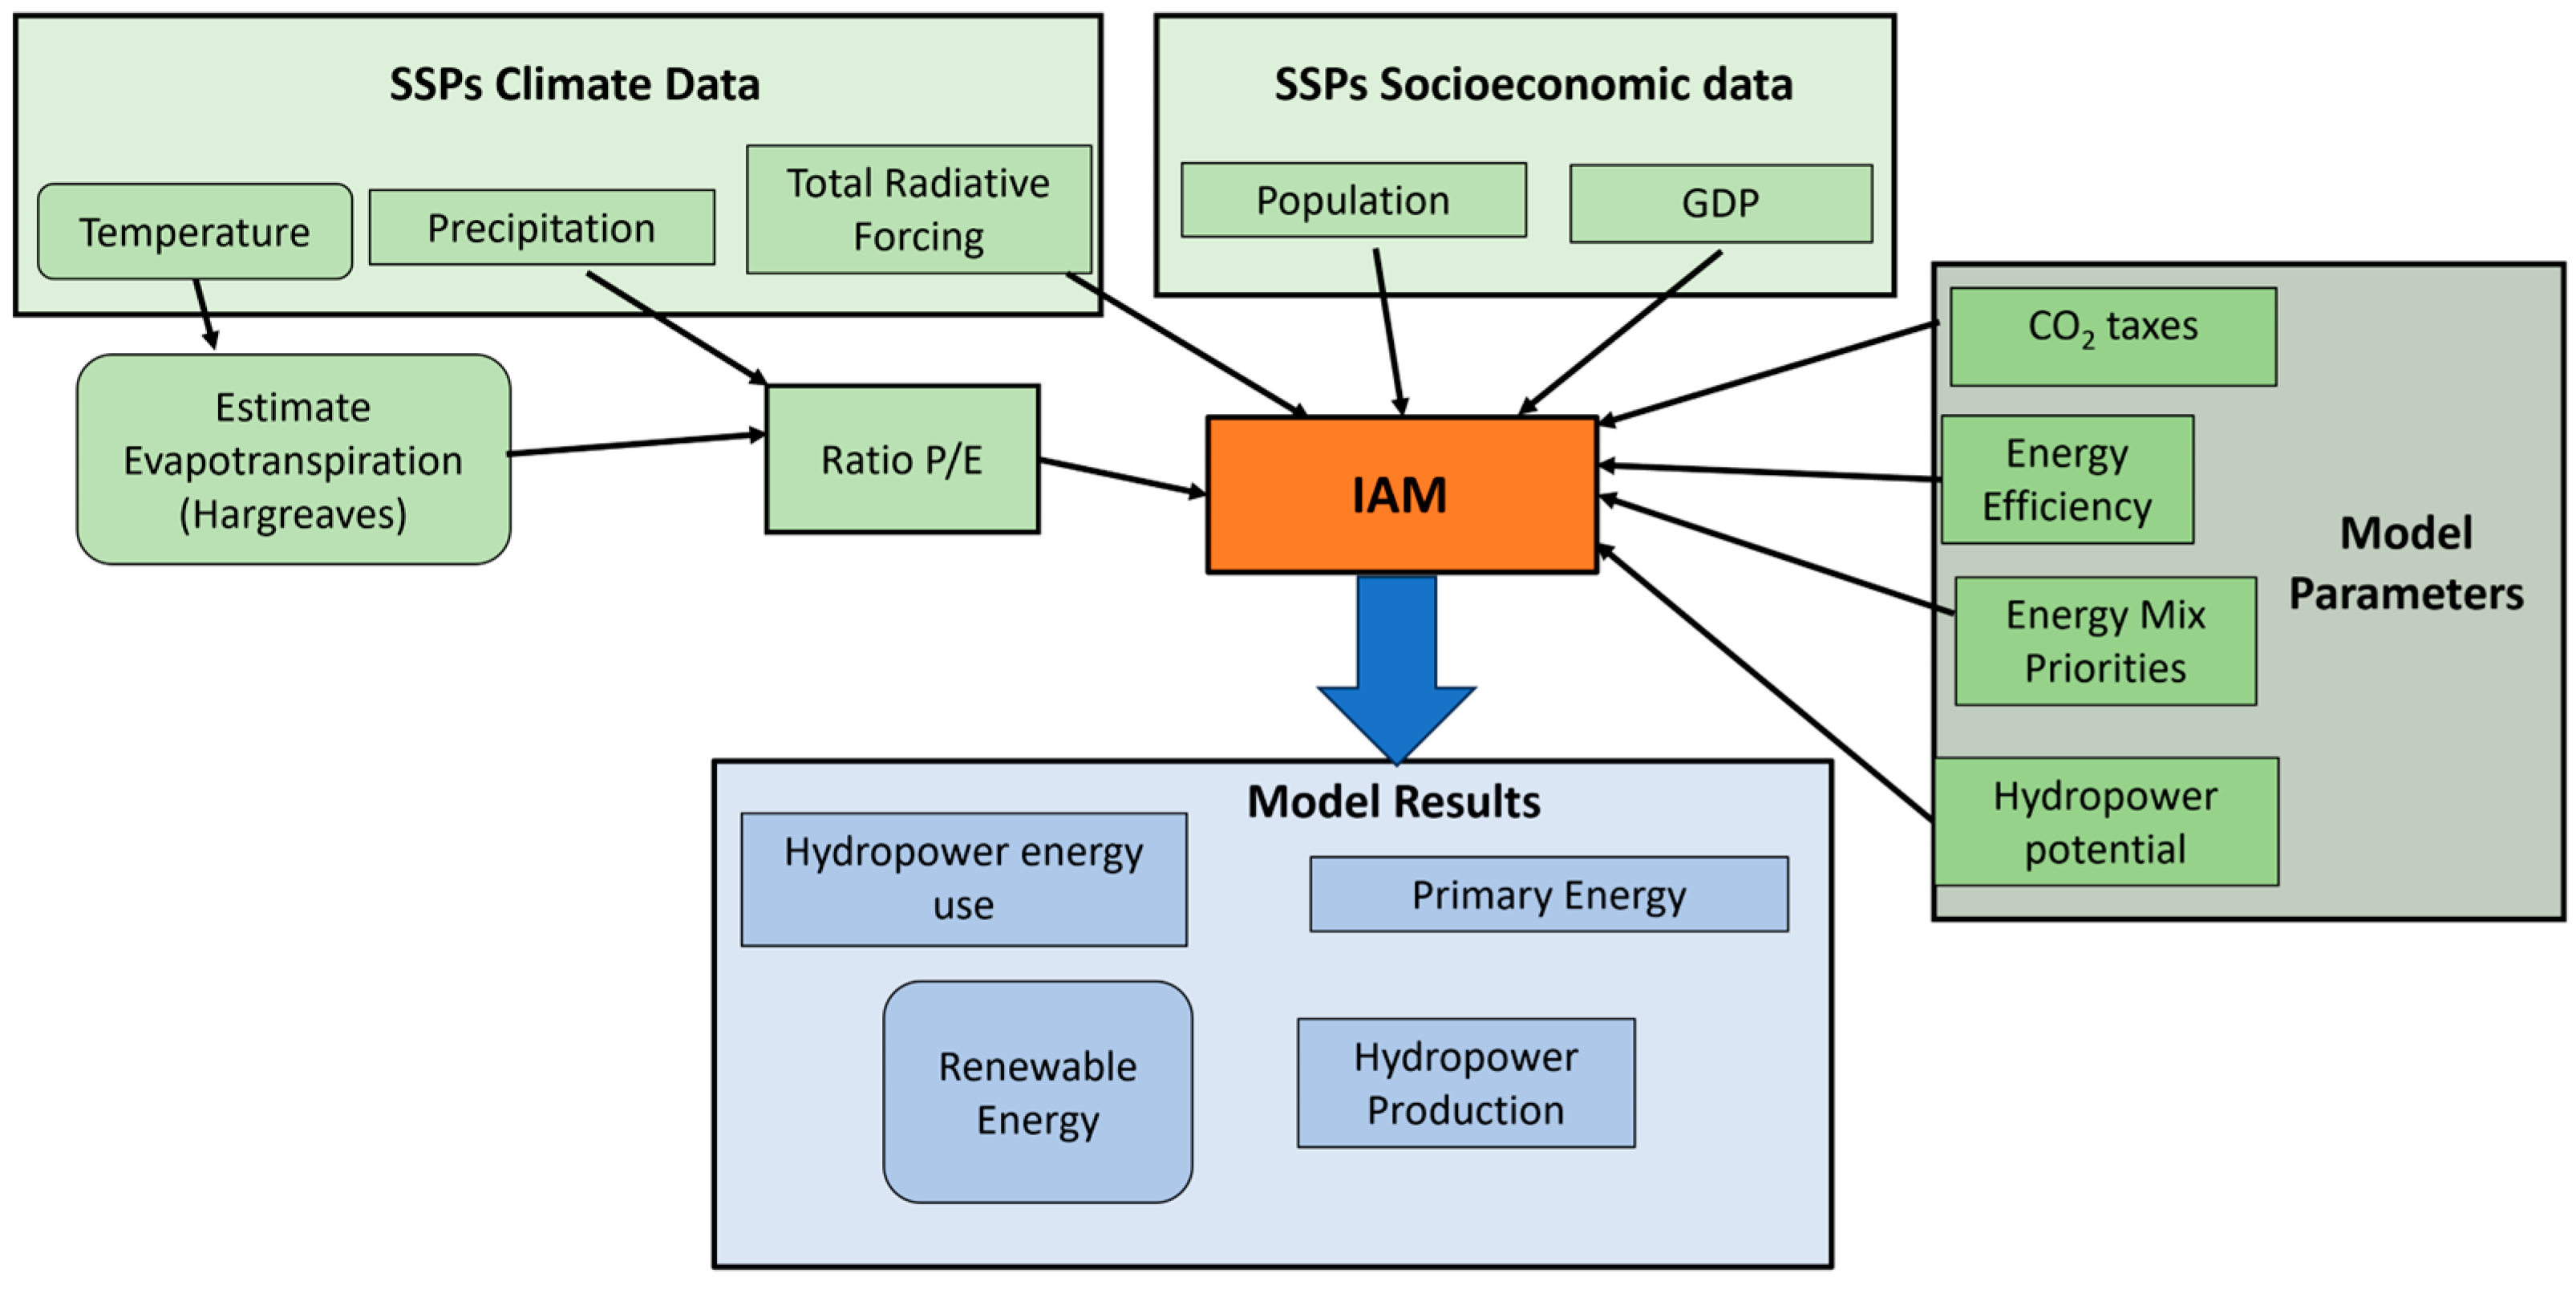
2. Materials and Methods
3. Results
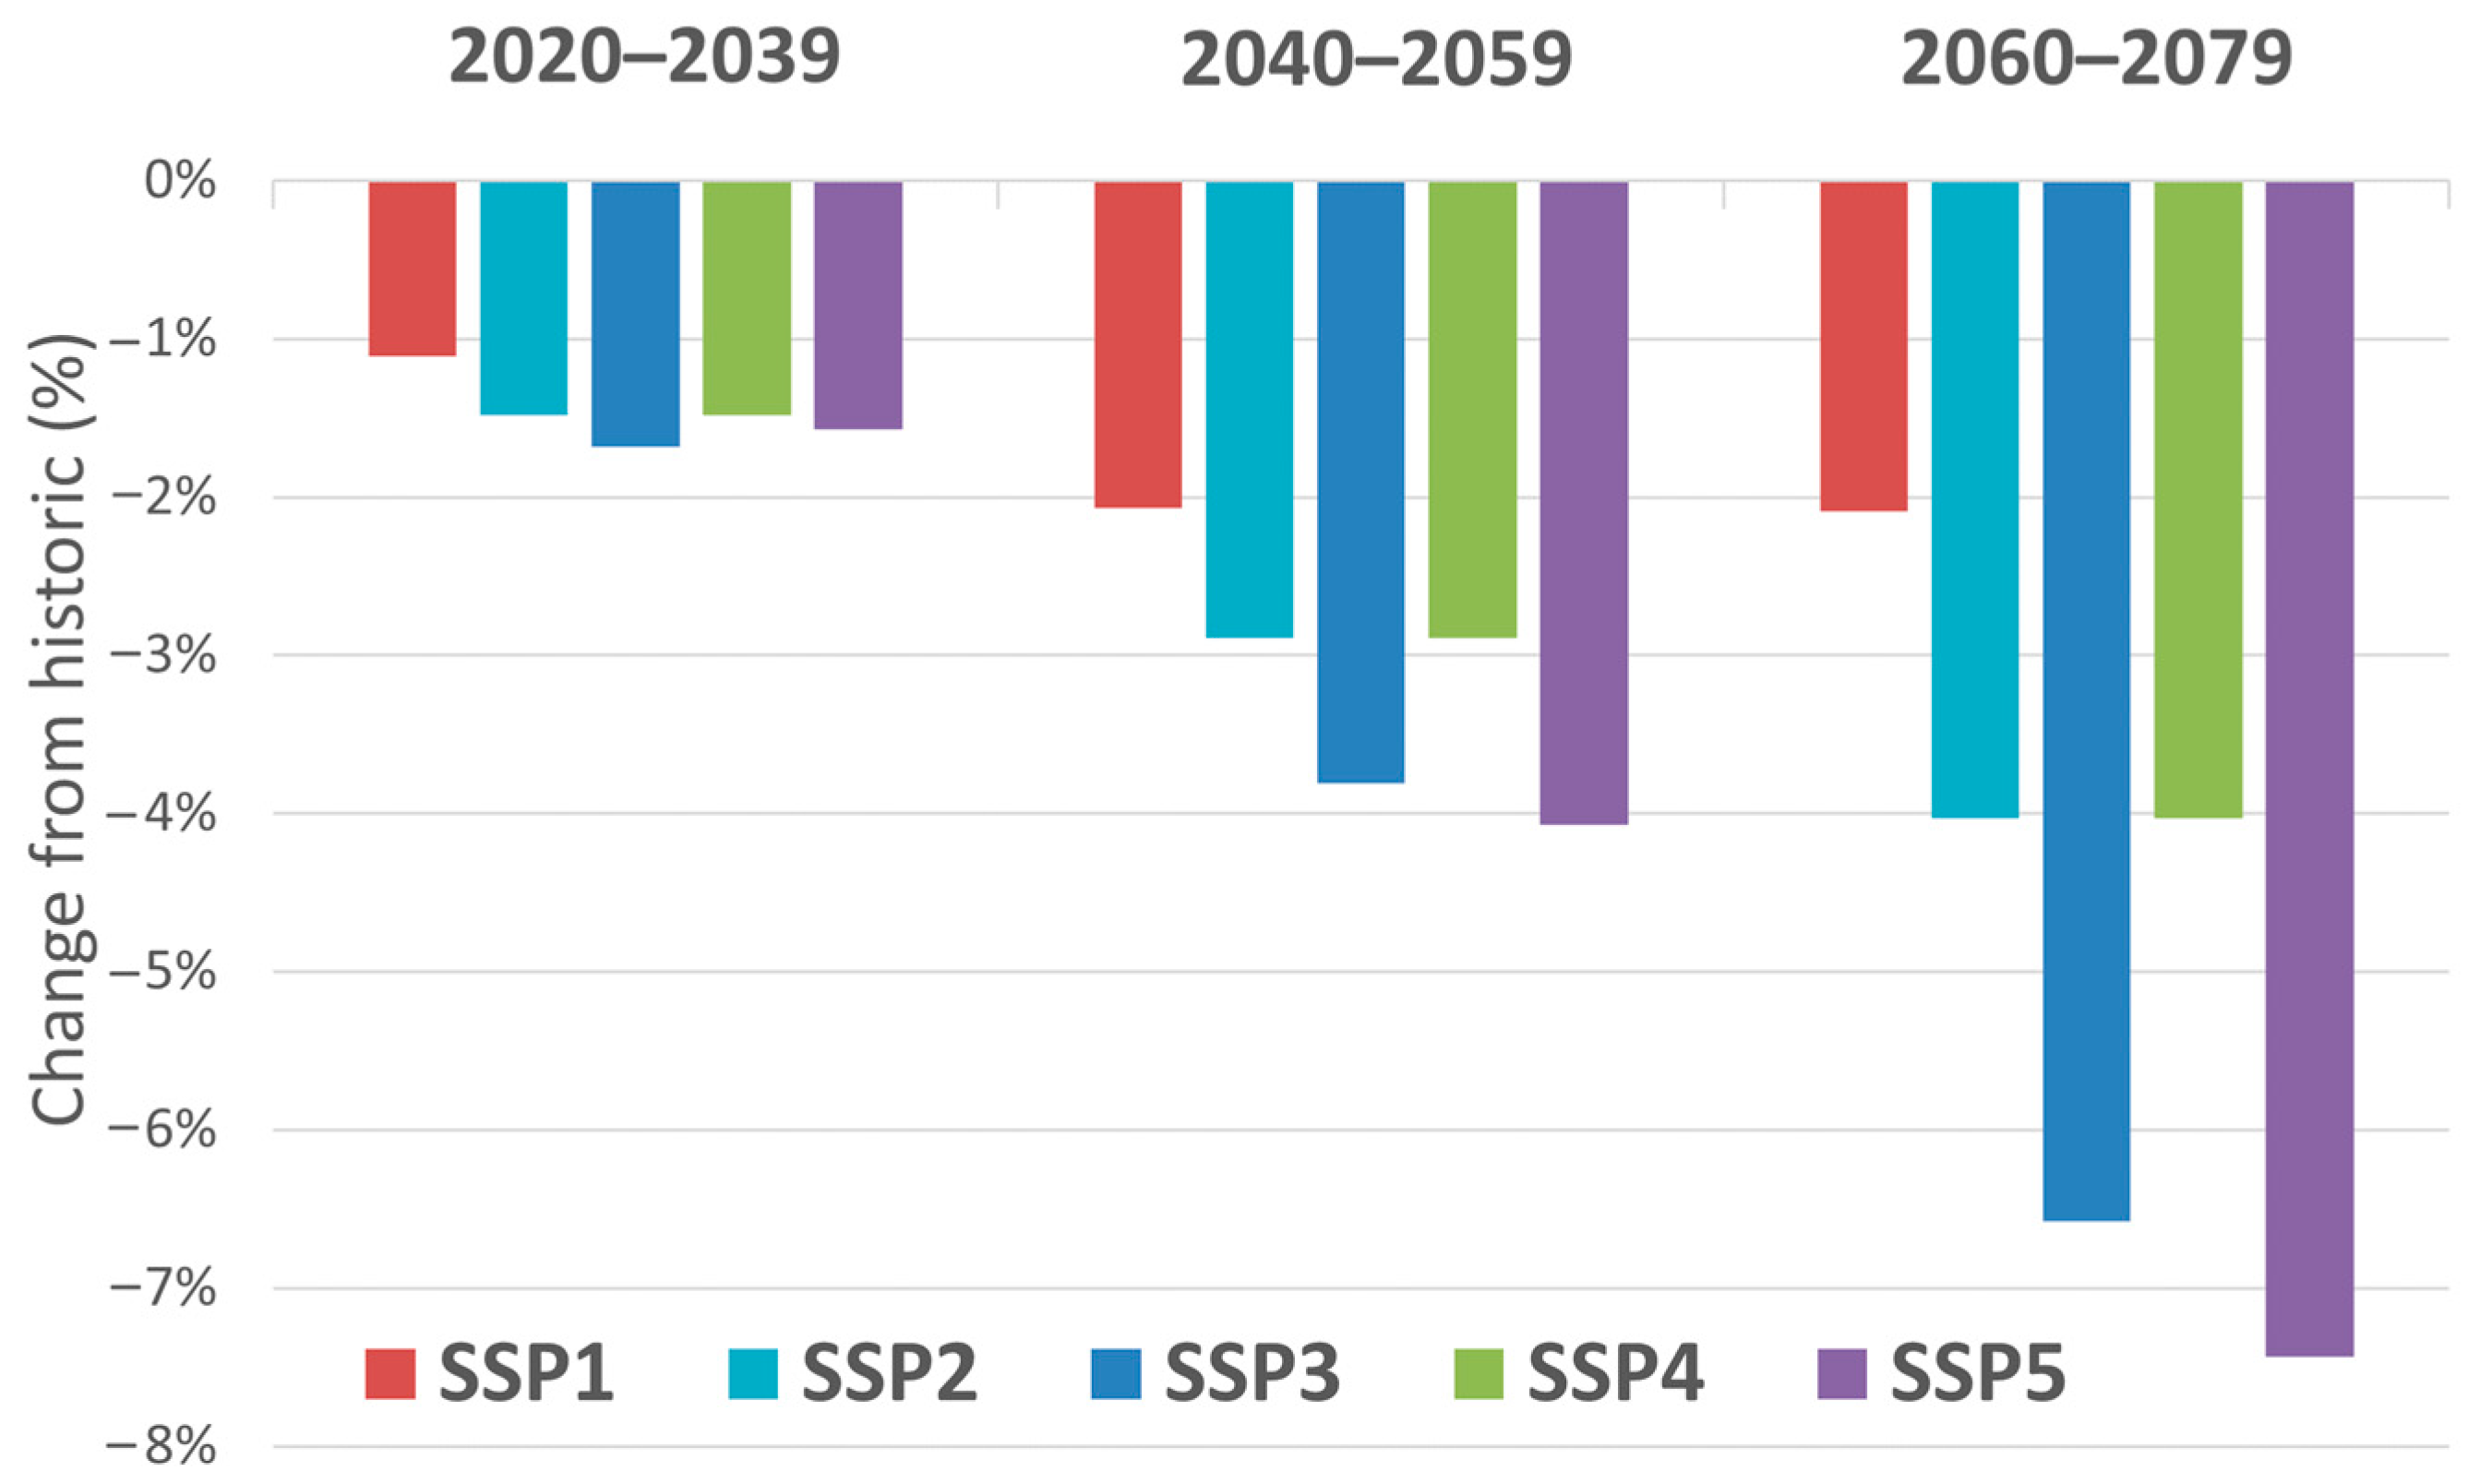
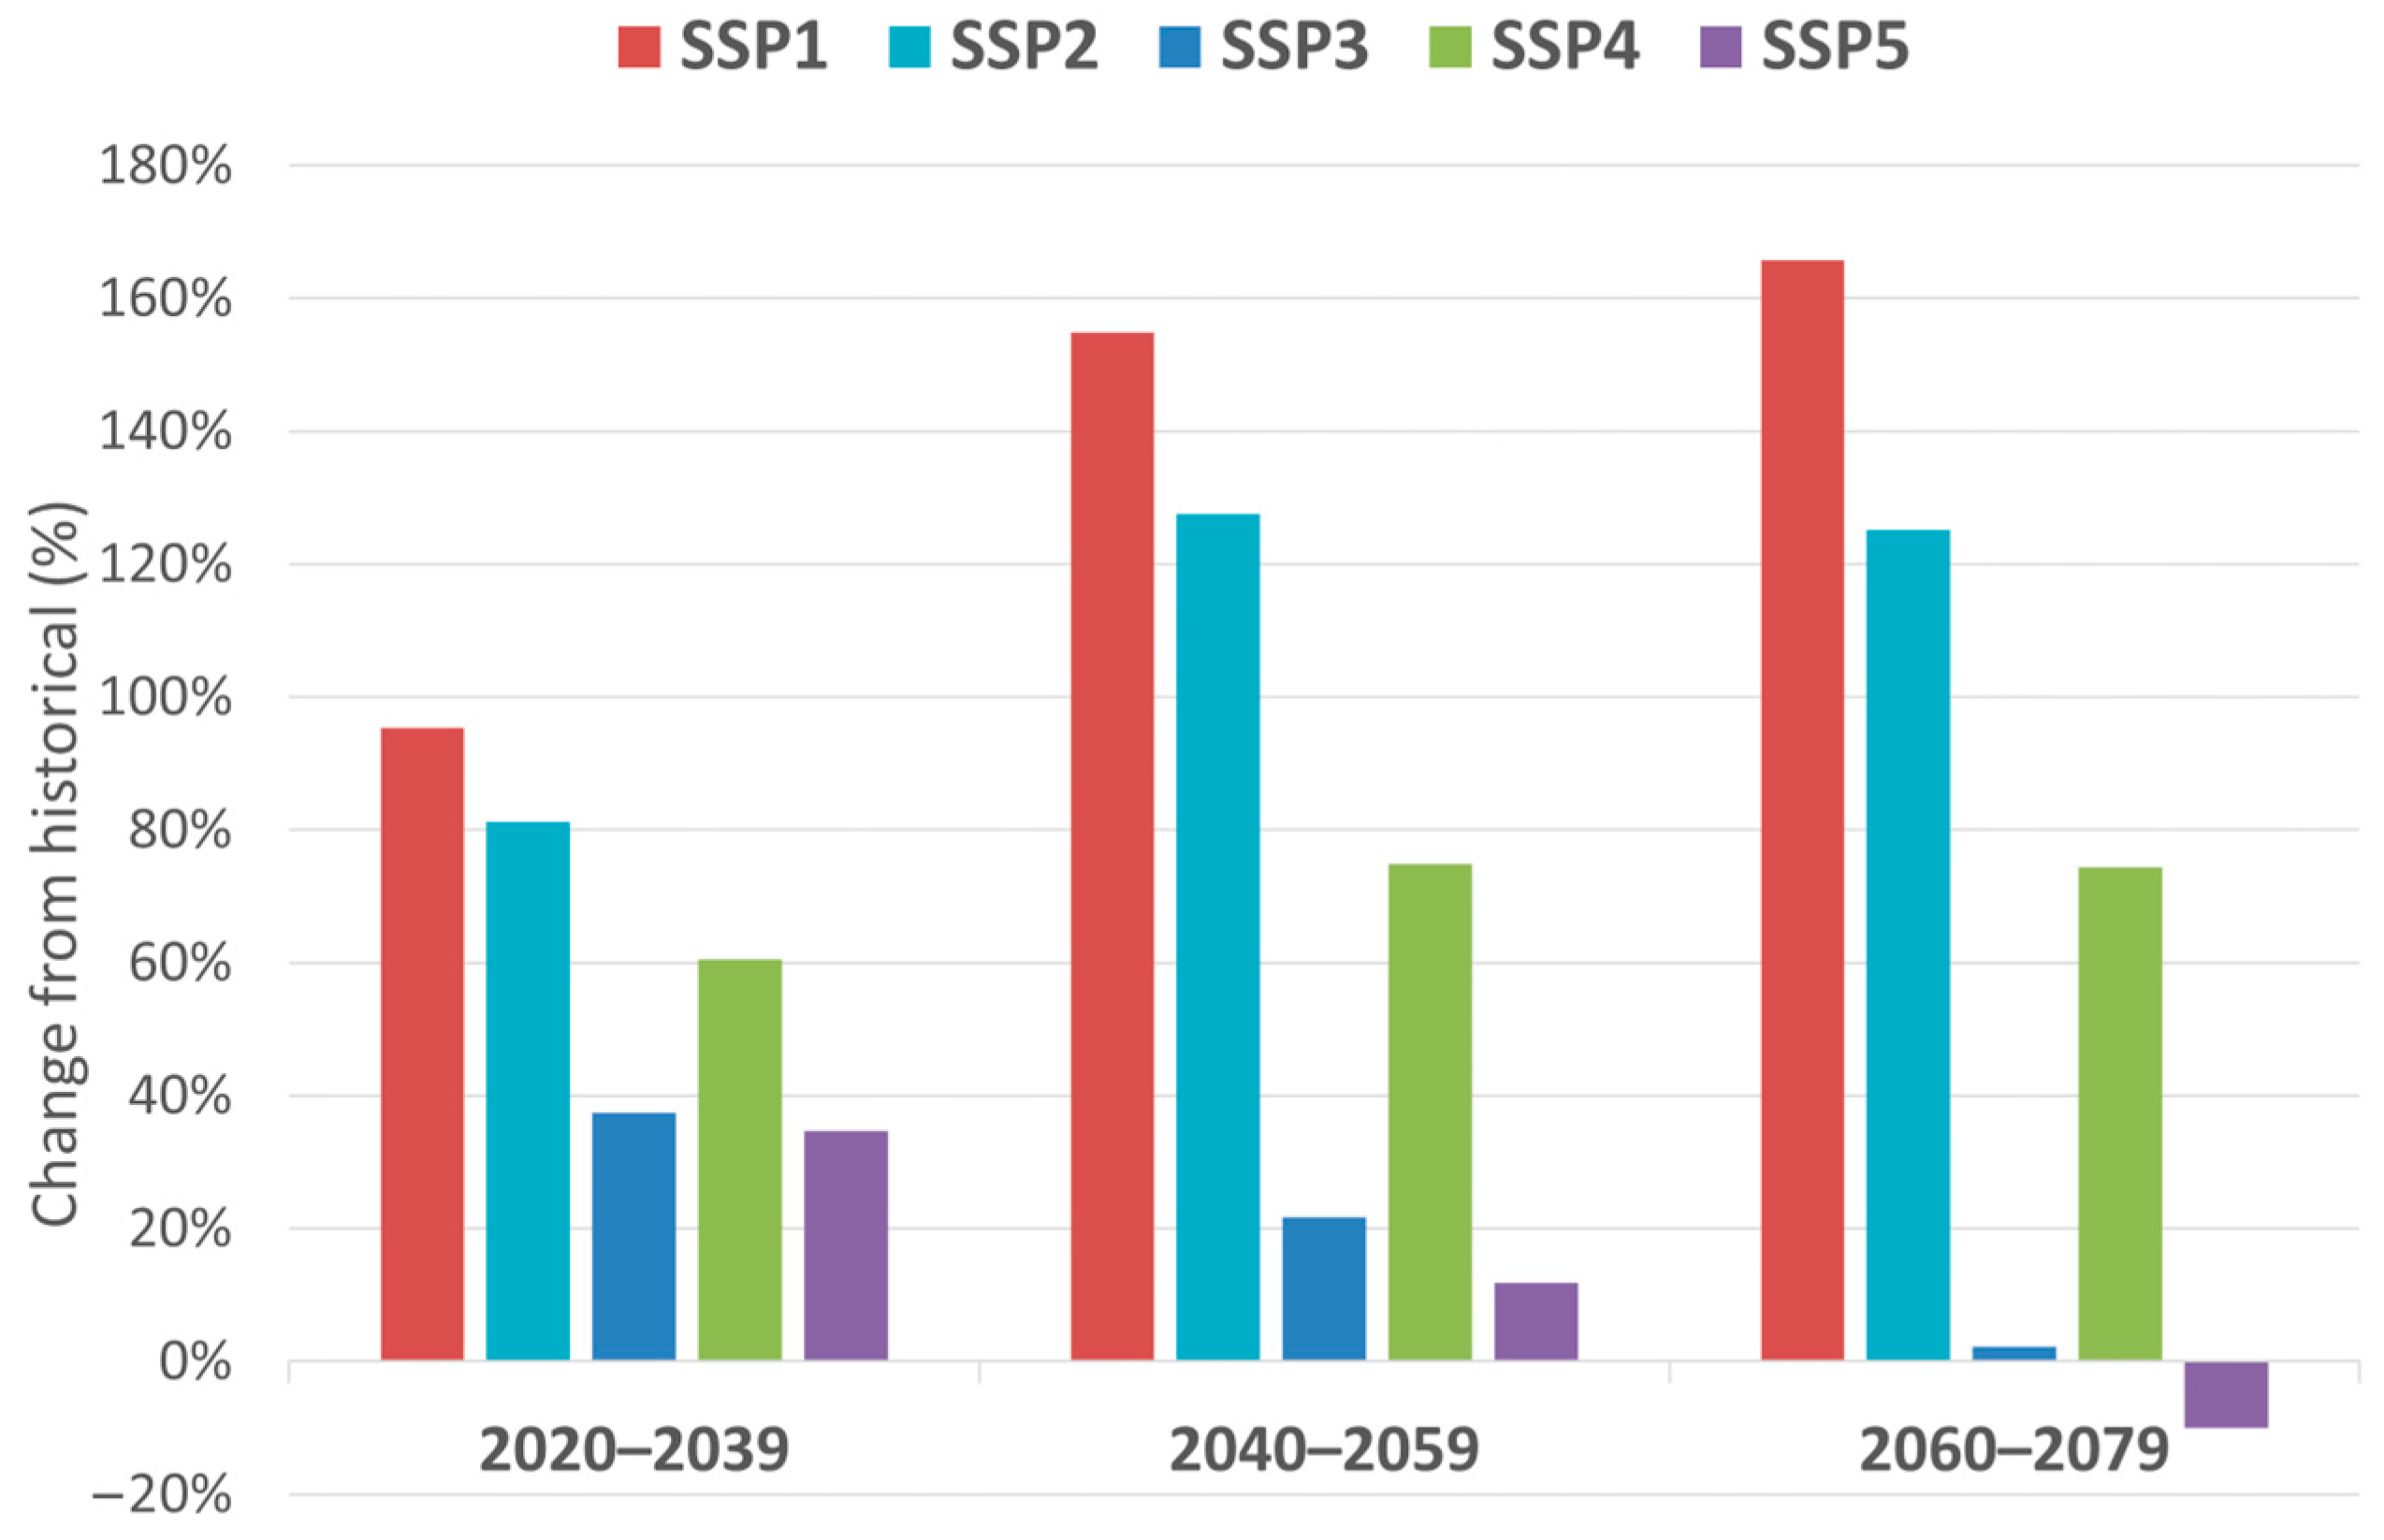
Climate Change
4. Discussion
5. Conclusions
Supplementary Materials
Author Contributions
Funding
Institutional Review Board Statement
Informed Consent Statement
Data Availability Statement
Acknowledgments
Conflicts of Interest
References
- International Energy Agency. Hydropower Special Market Report; OECD: Paris, France, 2021. [Google Scholar] [CrossRef]
- Wasti, A.; Ray, P.; Wi, S.; Folch, C.; Ubierna, M.; Karki, P. Climate Change and the Hydropower Sector: A Global Review. WIREs Clim. Chang. 2022, 13, e757. [Google Scholar] [CrossRef]
- Hoes, O.A.C.; Meijer, L.J.J.; Van Der Ent, R.J.; Van De Giesen, N.C. Systematic High-Resolution Assessment of Global Hydropower Potential. PLoS ONE 2017, 12, e0171844. [Google Scholar] [CrossRef] [PubMed]
- Engeland, K.; Borga, M.; Creutin, J.-D.; François, B.; Ramos, M.-H.; Vidal, J.-P. Space-Time Variability of Climate Variables and Intermittent Renewable Electricity Production—A Review. Renew. Sustain. Energy Rev. 2017, 79, 600–617. [Google Scholar] [CrossRef]
- François, B.; Hingray, B.; Raynaud, D.; Borga, M.; Creutin, J.D. Increasing Climate-Related-Energy Penetration by Integrating Run-of-the River Hydropower to Wind/Solar Mix. Renew Energy 2016, 87, 686–696. [Google Scholar] [CrossRef]
- IHA. The World’s Water Battery: Pumped Hydropower Storage and the Clean Energy Transition. Int. Hydropower Assoc. Work. Pap. 2018, 1, 1–15. [Google Scholar]
- Pérez-Díaz, J.I.; Chazarra, M.; García-González, J.; Cavazzini, G.; Stoppato, A. Trends and Challenges in the Operation of Pumped-Storage Hydropower Plants. Sustain. Energy Rev. 2015, 44, 767–784. [Google Scholar] [CrossRef]
- Xu, B.; Chen, D.; Venkateshkumar, M.; Xiao, Y.; Yue, Y.; Xing, Y.; Li, P. Modeling a Pumped Storage Hydropower Integrated to a Hybrid Power System with Solar-Wind Power and Its Stability Analysis. Appl. Energy 2019, 248, 446–462. [Google Scholar] [CrossRef]
- Moran, E.F.; Lopez, M.C.; Moore, N.; Müller, N.; Hyndman, D.W. Sustainable Hydropower in the 21st Century. Proc. Natl. Acad. Sci. USA 2018, 115, 11891–11898. [Google Scholar] [CrossRef]
- Zhang, Y.; Ma, H.; Zhao, S. Assessment of Hydropower Sustainability: Review and Modeling. J. Clean Prod. 2021, 321, 128898. [Google Scholar] [CrossRef]
- van Soest, H.L.; van Vuuren, D.P.; Hilaire, J.; Minx, J.C.; Harmsen, M.J.H.M.; Krey, V.; Popp, A.; Riahi, K.; Luderer, G. Analysing Interactions among Sustainable Development Goals with Integrated Assessment Models. Glob. Transit. 2019, 1, 210–225. [Google Scholar] [CrossRef]
- van Beek, L.; Hajer, M.; Pelzer, P.; van Vuuren, D.; Cassen, C. Anticipating Futures through Models: The Rise of Integrated Assessment Modelling in the Climate Science-Policy Interface since 1970. Glob. Environ. Chang. 2020, 65, 102191. [Google Scholar] [CrossRef]
- Keppo, I.; Butnar, I.; Bauer, N.; Caspani, M.; Edelenbosch, O.; Emmerling, J.; Fragkos, P.; Guivarch, C.; Harmsen, M.; Lefevre, J.; et al. Exploring the Possibility Space: Taking Stock of the Diverse Capabilities and Gaps in Integrated Assessment Models. Environ. Res. Lett. 2021, 16, 053006. [Google Scholar] [CrossRef]
- Parker, P.; Letcher, R.; Jakeman, A.; Beck, M.; Harris, G.; Argent, R.; Hare, M.; Pahl-Wostl, C.; Voinov, A.; Janssen, M.; et al. Progress in Integrated Assessment and Modelling 1. Environ. Model. Softw. 2002, 17, 209–217. [Google Scholar] [CrossRef]
- Stanton, E.A.; Ackerman, F.; Kartha, S. Inside the Integrated Assessment Models: Four Issues in Climate Economics. Clim. Dev. 2009, 1, 166–184. [Google Scholar] [CrossRef]
- van Vliet, M.T.H.; van Beek, L.P.H.; Eisner, S.; Flörke, M.; Wada, Y.; Bierkens, M.F.P. Multi-Model Assessment of Global Hydropower and Cooling Water Discharge Potential under Climate Change. Glob. Environ. Chang. 2016, 40, 156–170. [Google Scholar] [CrossRef]
- Ando, N.; Yoshikawa, S.; Fujimori, S.; Kanae, S. Long-Term Projections of Global Water Use for Electricity Generation under The Shared Socioeconomic Pathways and Climate Mitigation Scenarios. Hydrol. Earth Syst. Sci. Discuss. 2017, 1–25. [Google Scholar] [CrossRef]
- Riahi, K.; van Vuuren, D.P.; Kriegler, E.; Edmonds, J.; O’Neill, B.C.; Fujimori, S.; Bauer, N.; Calvin, K.; Dellink, R.; Fricko, O.; et al. The Shared Socioeconomic Pathways and Their Energy, Land Use, and Greenhouse Gas Emissions Implications: An Overview. Glob. Environ. Chang. 2017, 42, 153–168. [Google Scholar] [CrossRef]
- Llamosas, C.; Sovacool, B.K. The Future of Hydropower? A Systematic Review of the Drivers, Benefits and Governance Dynamics of Transboundary Dams. Renew. Sustain. Energy Rev. 2021, 137, 110495. [Google Scholar] [CrossRef]
- Kougias, I.; Aggidis, G.; Avellan, F.; Deniz, S.; Lundin, U.; Moro, A.; Muntean, S.; Novara, D.; Pérez-Díaz, J.I.; Quaranta, E.; et al. Analysis of Emerging Technologies in the Hydropower Sector. Renew. Sustain. Energy Rev. 2019, 113, 109257. [Google Scholar] [CrossRef]
- Alsaleh, M.; Abdul-Rahim, A.S. The Nexus Between Worldwide Governance Indicators and Hydropower Sustainable Growth in EU 28 Region. Int. J. Environ. Res. 2021, 15, 1001–1015. [Google Scholar] [CrossRef]
- Lehner, B.; Czisch, G.; Vassolo, S. The Impact of Global Change on the Hydropower Potential of Europe: A Model-Based Analysis. Energy Policy 2005, 33, 839–855. [Google Scholar] [CrossRef]
- Hamududu, B.; Killingtveit, A. Assessing Climate Change Impacts on Global Hydropower. Energies 2012, 5, 305–322. [Google Scholar] [CrossRef]
- O’Neill, B.C.; Kriegler, E.; Riahi, K.; Ebi, K.L.; Hallegatte, S.; Carter, T.R.; Mathur, R.; van Vuuren, D.P. A New Scenario Framework for Climate Change Research: The Concept of Shared Socioeconomic Pathways. Clim. Chang. 2014, 122, 387–400. [Google Scholar] [CrossRef]
- O’Neill, B.C.; Kriegler, E.; Ebi, K.L.; Kemp-Benedict, E.; Riahi, K.; Rothman, D.S.; van Ruijven, B.J.; van Vuuren, D.P.; Birkmann, J.; Kok, K.; et al. The Roads Ahead: Narratives for Shared Socioeconomic Pathways Describing World Futures in the 21st Century. Glob. Environ. Chang. 2017, 42, 169–180. [Google Scholar] [CrossRef]
- Calheiros, T.; Beça, P.; Lourenço, T.C.; Mediavilla, M.; Ferreras-Alonso, N.; Ramos-Diez, I.; Distefano, T.; Eggler, L.; Pastor, A. Assessing Hydropower Potential under Green Economy Scenarios Using WILIAM Model. In Proceedings of the 18th SDEWES Conference, SDEWES2023.0869, Dubrovnik, Croatia, 24–29 September 2023. [Google Scholar]
- Capellán-Pérez, I.; De Blas, I.; Nieto, J.; De Castro, C.; Miguel, L.J.; Carpintero, Ó.; Mediavilla, M.; Lobejón, L.F.; Ferreras-Alonso, N.; Rodrigo, P.; et al. MEDEAS: A New Modeling Framework Integrating Global Biophysical and Socioeconomic Constraints. Energy Environ. Sci. 2020, 13, 986–1017. [Google Scholar] [CrossRef]
- Fujimori, S.; Hasegawa, T.; Masui, T.; Takahashi, K.; Herran, D.S.; Dai, H.; Hijioka, Y.; Kainuma, M. SSP3: AIM Implementation of Shared Socioeconomic Pathways. Glob. Environ. Chang. 2017, 42, 268–283. [Google Scholar] [CrossRef]
- Fricko, O.; Havlik, P.; Rogelj, J.; Klimont, Z.; Gusti, M.; Johnson, N.; Kolp, P.; Strubegger, M.; Valin, H.; Amann, M.; et al. The Marker Quantification of the Shared Socioeconomic Pathway 2: A Middle-of-the-Road Scenario for the 21st Century. Glob. Environ. Chang. 2017, 42, 251–267. [Google Scholar] [CrossRef]
- Bauer, N.; Calvin, K.; Emmerling, J.; Fricko, O.; Fujimori, S.; Hilaire, J.; Eom, J.; Krey, V.; Kriegler, E.; Mouratiadou, I.; et al. Shared Socio-Economic Pathways of the Energy Sector—Quantifying the Narratives. Glob. Environ. Chang. 2017, 42, 316–330. [Google Scholar] [CrossRef]
- Calvin, K.; Bond-Lamberty, B.; Clarke, L.; Edmonds, J.; Eom, J.; Hartin, C.; Kim, S.; Kyle, P.; Link, R.; Moss, R.; et al. The SSP4: A World of Deepening Inequality. Glob. Environ. Chang. 2017, 42, 284–296. [Google Scholar] [CrossRef]
- Hargreaves, G.H. Estimation of Potential and Crop Evapotranspiration. Trans. ASAE 1973, 17, 0701–0704. [Google Scholar] [CrossRef]
- World Bank Group. Climate Change Knowledge Portal. Available online: https://climateknowledgeportal.worldbank.org/ (accessed on 7 December 2023).
- Martin-Martinez, E.; Samsó, R.; Houghton, J.; Solé, J. PySD: System Dynamics Modeling in Python. J. Open Source Softw. 2022, 7, 4329. [Google Scholar] [CrossRef]
- Intergovernmental Panel on Climate Change. Technical Summary. In Climate Change 2021—The Physical Science Basis; Cambridge University Press: Cambridge, UK, 2023; pp. 35–144. [Google Scholar] [CrossRef]
- Worku, M.Y. Recent Advances in Energy Storage Systems for Renewable Source Grid Integration: A Comprehensive Review. Sustainability 2022, 14, 5985. [Google Scholar] [CrossRef]
- Berga, L. The Role of Hydropower in Climate Change Mitigation and Adaptation: A Review. Engineering 2016, 2, 313–318. [Google Scholar] [CrossRef]
- Turner, S.W.D.; Hejazi, M.; Kim, S.H.; Clarke, L.; Edmonds, J. Climate Impacts on Hydropower and Consequences for Global Electricity Supply Investment Needs. Energy 2017, 141, 2081–2090. [Google Scholar] [CrossRef]
- Ng, J.Y.; Turner, S.W.D.; Galelli, S. Influence of El Niño Southern Oscillation on Global Hydropower Production. Environ. Res. Lett. 2017, 12, 034010. [Google Scholar] [CrossRef]
- Teotónio, C.; Fortes, P.; Roebeling, P.; Rodriguez, M.; Robaina-Alves, M. Assessing the Impacts of Climate Change on Hydropower Generation and the Power Sector in Portugal: A Partial Equilibrium Approach. Renew. Sustain. Energy Rev. 2017, 74, 788–799. [Google Scholar] [CrossRef]
- Naranjo-Silva, S.; Punina-Guerrero, D.; Rivera-Gonzalez, L.; Escobar-Segovia, K.; Barros-Enriquez, J.D.; Almeida-Dominguez, J.A.; Alvarez del Castillo, J. Hydropower Scenarios in the Face of Climate Change in Ecuador. Sustainability 2023, 15, 160. [Google Scholar] [CrossRef]
- Hidalgo, I.G.; Paredes-Arquiola, J.; Andreu, J.; Lerma-Elvira, N.; Lopes, J.E.G.; Cioffi, F. Hydropower Generation in Future Climate Scenarios. Energy Sustain. Dev. 2020, 59, 180–188. [Google Scholar] [CrossRef]
- Morris, J.; Reilly, J.; Paltsev, S.; Sokolov, A.; Cox, K. Representing Socio-Economic Uncertainty in Human System Models. Earths Future 2022, 10, e2021EF002239. [Google Scholar] [CrossRef]
- Zaharia, A.; Diaconeasa, M.C.; Brad, L.; Lădaru, G.R.; Ioanăs, C. Factors Influencing Energy Consumption in the Context of Sustainable Development. Sustainability 2019, 11, 4147. [Google Scholar] [CrossRef]
- Beça, P.; Rodrigues, A.C.; Nunes, J.P.; Diogo, P.; Mujtaba, B. Optimizing Reservoir Water Management in a Changing Climate. Water Resour. Manag. 2023, 37, 3423–3437. [Google Scholar] [CrossRef]
- Garrote, L.; Granados, A.; Spiliotis, M.; Martin-Carrasco, F. Effectiveness of Adaptive Operating Rules for Reservoirs. Water Resour. Manag. 2023, 37, 2527–2542. [Google Scholar] [CrossRef]
- Diogo, P.A.; Beça, P.; Simões, S.; Amorim, F.; Mujtaba, B. Seasonal Forecast Climate Data and Hydropower Production in the Douro Basin, in Portugal. Environ. Sci. Proc. 2020, 2, 71. [Google Scholar] [CrossRef]


| SSP1 | SSP2 | SSP3 | SSP4 | SSP5 | |||||||||||
|---|---|---|---|---|---|---|---|---|---|---|---|---|---|---|---|
| 2020–2039 | 2040–2059 | 2060–2079 | 2020–2039 | 2040–2059 | 2060–2079 | 2020–2039 | 2040–2059 | 2060–2079 | 2020–2039 | 2040–2059 | 2060–2079 | 2020–2039 | 2040–2059 | 2060–2079 | |
| EU27 | 58% | 47% | 43% | 40% | 41% | 34% | −8% | −26% | −42% | 55% | 45% | 39% | −10% | −29% | −46% |
| UK | 11% | −12% | −17% | 11% | −11% | −19% | 11% | −11% | −22% | 11% | −12% | −18% | 11% | −12% | −29% |
| CHINA | 188% | 193% | 175% | 179% | 175% | 163% | 168% | 157% | 123% | 182% | 184% | 176% | 163% | 130% | 91% |
| EASOC | 65% | 292% | 272% | 18% | −3% | −20% | 17% | −4% | −24% | 42% | 98% | 101% | 18% | −5% | −24% |
| INDIA | 40% | 47% | 24% | 36% | 16% | −2% | 36% | 15% | −5% | 37% | 26% | 6% | 38% | 17% | −2% |
| LATAM | 63% | 143% | 254% | 55% | 89% | 111% | 43% | 41% | 29% | 63% | 127% | 194% | 31% | 8% | −13% |
| RUSSIA | 51% | 46% | 42% | 5% | −9% | −17% | 2% | −17% | −34% | 47% | 43% | 38% | 2% | −18% | −37% |
| USMCA | 64% | 64% | 62% | 19% | 41% | 35% | −2% | −20% | −37% | 64% | 63% | 59% | −2% | −21% | −38% |
| LROW | 133% | 301% | 307% | 29% | 41% | 41% | 14% | −8% | −26% | 93% | 258% | 271% | 13% | −9% | −28% |
Disclaimer/Publisher’s Note: The statements, opinions and data contained in all publications are solely those of the individual author(s) and contributor(s) and not of MDPI and/or the editor(s). MDPI and/or the editor(s) disclaim responsibility for any injury to people or property resulting from any ideas, methods, instructions or products referred to in the content. |
© 2024 by the authors. Licensee MDPI, Basel, Switzerland. This article is an open access article distributed under the terms and conditions of the Creative Commons Attribution (CC BY) license (https://creativecommons.org/licenses/by/4.0/).
Share and Cite
Calheiros, T.; Beça, P.; Capela Lourenço, T.; Eggler, L.; Mediavilla, M.; Ferreras-Alonso, N.; Ramos-Diez, I.; Samsó, R.; Distefano, T.; Pastor, A. Assessing Hydropower Potential under Shared Socioeconomic Pathways Scenarios Using Integrated Assessment Modelling. Sustainability 2024, 16, 1548. https://doi.org/10.3390/su16041548
Calheiros T, Beça P, Capela Lourenço T, Eggler L, Mediavilla M, Ferreras-Alonso N, Ramos-Diez I, Samsó R, Distefano T, Pastor A. Assessing Hydropower Potential under Shared Socioeconomic Pathways Scenarios Using Integrated Assessment Modelling. Sustainability. 2024; 16(4):1548. https://doi.org/10.3390/su16041548
Chicago/Turabian StyleCalheiros, Tomás, Pedro Beça, Tiago Capela Lourenço, Lukas Eggler, Margarita Mediavilla, Noelia Ferreras-Alonso, Iván Ramos-Diez, Roger Samsó, Tiziano Distefano, and Amandine Pastor. 2024. "Assessing Hydropower Potential under Shared Socioeconomic Pathways Scenarios Using Integrated Assessment Modelling" Sustainability 16, no. 4: 1548. https://doi.org/10.3390/su16041548