Article

Energy, Exergy, Exergoeconomic Analysis, and Optimization in a Natural Gas Decompression Station with a Vortex Tube and Geothermal Preheating

by
Luis F. Villalón-López
1,
Víctor M. Ambriz-Díaz
2,*,
Carlos Rubio-Maya
1,
Oscar Chávez
2 and
Israel Y. Rosas
2
1
Faculty of Mechanical Engineering, “W” Building, Central Campus, Universidad Michoacana de San Nicolás de Hidalgo, Morelia 58030, Michoacán, Mexico
2
Tecnológico Nacional de México/I. T. Chihuahua, Av. Tecnológico, 2909, Chihuahua 31310, Chihuahua, Mexico
*
Author to whom correspondence should be addressed.
Sustainability 2024, 16(4), 1669; https://doi.org/10.3390/su16041669
Submission received: 23 January 2024 / Revised: 14 February 2024 / Accepted: 15 February 2024 / Published: 18 February 2024

Abstract

:
Natural gas stations require a preheating stage to prevent the formation of hydrates inside of them provoked by a sudden decompression process of the natural gas. The preheating process has been investigated to improve efficiency and to reduce costs as well. This work studies the behavior of a natural gas decompression station with a first-stage preheating process using a vortex tube and a geothermal heat exchanger, followed by a second stage involving a water bath heater (heating vat). An energetic, exergetic, and exergoeconomic study has been carried out based on a mathematical model and the theory of exergetic cost, obtaining key thermodynamic and thermoeconomic variables, including exergy flows and equipment costs. A heat flow of 26.41 kW was obtained in the geothermal preheating stage; meanwhile, a 60.43 kW heat flow was obtained in the heating vat. The results showed a saving in station fuel using only 2.046% of the natural gas in the system at the second preheating stage. Also, the system was optimized, obtaining a 15.73% reduction in the decompressed natural gas cost. These findings show the possibility of implementing these systems in zones with many geothermal resources to reach a constant, profitable natural gas supply in areas where a pipeline network does not exist.

1. Introduction

Natural gas is a mixture of hydrocarbons composed mainly of methane, ethane, propane, butane, and carbon dioxide and is primarily used as a fuel in industrial processes [1]. Its distribution still presents several challenges to be resolved. Compression and decompression to distribute it to places without a distribution network are some of these challenges. To compress the natural gas, reaching a pressure of between 200 and 250 bar and a volume of 1% of its original volume at atmospheric conditions is necessary. Once the compression has been carried out, to distribute the natural gas, it is required to deposit the gas in pressure tanks, which are distributed to the destination places [2]. This procedure is commonly carried out in compressor and decompressor stations and is effective for transporting natural gas over short distances [3]. Once the natural gas is in the decompression station, it must be decompressed to achieve pressure conditions for final use. However, small crystalline structures known as hydrates are formed within the natural gas stream when the gas temperature is severely reduced due to the Joule–Thomson effect in this decompression process [4]. These hydrates are highly harmful to decompression systems since they can damage equipment, instruments, and pipes, generating unnecessary expenses for companies that provide natural gas transportation and distribution services [5].
One of the possible solutions to counteract the Joule–Thomson effect is to preheat the natural gas [6]. Various resources are used to achieve preheating, including the combustion of the same gas; however, this procedure reduces the economic and energy profitability of the process. Due to the above, geothermal energy, being a renewable energy, is presented as a potential alternative as an auxiliary heat source in natural gas decompression processes [7,8]. Furthermore, due to the geothermal potential of 60 MW/m2 of the globe, geothermal energy in decompression stations can be very favorable [9]. Geothermal energy can be used in various ways depending on its temperature [10,11,12]. However, the most appropriate resources to be implemented in natural gas decompression stations because the gas must not leak (closed-loop operation) are medium-temperature geothermal resources (80–150 °C), using devices commonly referred to as borehole heat exchangers. These heat exchangers are constructed with one or several U-tubes in geothermal wells [13]. In this way, the U-tube geothermal arrangement can be incorporated as a strategy for using geothermal heat and implemented in decompression stations [14,15]. In these arrangements, natural gas can be circulated inside the U-shaped pipe buried in the geothermal reservoir [16]. On the other hand, equipment known as a vortex tube is a technology that can benefit the preheating of natural gas and the reduction in geothermal heat input, contributing to reducing the depth of a geothermal well. The vortex tube can divide a gaseous fluid into two streams: cold and hot. Therefore, the vortex tube can be installed in decompression stations to split natural gas into cold and hot streams [17]. The cold stream can be preheated with the addition of geothermal heat, and once the cold stream is preheated, it is mixed with the hot stream coming from the vortex tube. One of the advantages of implementing the vortex tube in natural gas decompression stations is that a vortex tube does not need external energy to operate but instead operates with the same kinetic energy of the high-pressure gas. With this equipment, it is possible to reduce the operating costs of natural gas decompression stations while counteracting the Joule–Thomson effect due to using gas energy to raise its temperature [18].
The scientific community has investigated various options to reduce the Joule–Thomson effect produced by the sudden expansion of natural gas in decompression stations, developing different configurations and integrating different technologies in decompression stations. The research has been focused on and developed from different thermodynamic perspectives, such as analyzing energy, exergy, and exergoeconomics. Each investigation has provided results that help to make these systems more feasible for the natural gas industry. In order to reduce the consumption of natural gas in conventional decompression stations, Ghezelbash et al. [19] carried out an energy and economic evaluation of a natural gas decompression station using a heating vat. The results indicated a reduced energy consumption of up to 88% and a favorable payback period. Bianchi et al. [20] conducted an energy and economic analysis of a natural gas compressor station to determine the techno-economic potential of implementing an organic Rankine cycle. The results show a saving of 182 GWh of fuel per year and an energy generation of 66 GWh/year. Rahman [21] presented an energy analysis of a decompression station implementing a natural gas expansion system with a turbine. The results show that the energy produced by the turbine (between 150 kW and 5 MW) can compensate for the natural gas used for the preheating process. Ashouri et al. [22] analyzed an indirect preheating system by heating water from an energy point of view. The results indicate the minimum temperature values to avoid the formation of hydrates. Furthermore, the results reveal that, by designing preheating systems using heating vats in the natural gas decompression process, gas consumption is reduced by up to 43%.
Arabkoohsar et al. [23] performed an energy, exergy, and economics analysis for a design proposal for a decompression station integrating solar energy and a turboexpander. Preheating was carried out using solar energy to prevent the formation of hydrates and reduce natural gas consumption. At the same time, the turboexpander was used to take advantage of the energy of natural gas. The results show that the turboexpander could produce about 1000 kW and that the system could achieve an exergy efficiency greater than 60% and favorable economic profitability. Kostowski and Usón [24] presented an energetic, exergetic, and thermoeconomic analysis of a natural gas decompression system in combination with a cogeneration unit. Due to the use of natural gas in energy generation, the results indicate adequate exergetic costs due to decreased system operation costs. Ghorbani et al. [25] performed an exergy and exergoeconomics analysis of an integrated production process of liquefied natural gas and condensing natural gas. They analyzed exergoeconomic parameters such as the exergoeconomic factor and the relative cost difference of process components. The results show that the most significant exergy destruction is related to the system’s compressors and expansion valves. Barone [26] et al. presented an energetic, exergetic, and exergoeconomic model to increase the performance of a natural gas turboexpander by adding solar collectors. For the analysis method, thermodynamic and economic parameters were considered, such as the temperature of natural gas, flow rate, and the cost of electricity. The results showed an energy saving of 1.36 TWh/year, an exergy destruction in the turboexpander of 12 TWh/year, and a favorable payback period. Deymi-Dashtebayaz et al. [27] presented an energetic, exergetic, and exergoeconomic analysis of a natural gas decompression station, implementing a cogeneration system of electricity and water to take advantage of the energy produced by the decompression system. The results showed decreased product costs and favorable energy and exergetic efficiency.
On the other hand, to improve the thermodynamic performance of the decompression stations, various optimization methods have been implemented to determine the optimal operating conditions and increase the energetic, exergetic, and exergoeconomic performance. Generally, energy analyses seek to increase energy efficiency through these optimization methods, while exergy analyses seek to increase exergy efficiency and reduce thermodynamic irreversibilities due to exergy destruction. At the same time, if the scope of the work includes an exergoeconomic optimization, the parameters intended to be optimized are the cost of the products and the costs of exergy destruction. An example is the optimization carried out by Sanaye and Nasab [28], where they thermally modeled and optimized a natural gas decompressor station. They defined an objective function based on economic parameters such as station incomes and expenses. The results show optimal parameters for energy consumption and the payback period of the investment. Kagiri et al. [29] carried out an energy and economic optimization of a natural gas decompression station to reduce operating costs. The results show benefits from optimizing equipment parameters and ideal operating ranges, as well as potential savings of 59.28% in system operating costs after optimization. Deymi-Dashtebayaz et al. [30] presented the optimization of fuel consumption of a natural gas decompression station. They calculated the minimum temperature required in the preheating stage and obtained a reduction in fuel consumption of up to 35%. Furthermore, their results show that temperature optimization in natural gas systems significantly reduces natural gas costs at the station. Mohammad E. et al. [31] simulated the transportation and decompression of natural gas through multi-variable optimization. In optimization, the objective is to explore the system’s potential by adjusting the values of some input variables (pressure, temperature, and flow). With the optimization, a lower fuel consumption was obtained than the initial one. The results show that by optimizing two or more variables in the natural gas transportation and decompression systems, a lower fuel consumption can be obtained, achieving a lower operating cost.
Most studies focus on innovating natural gas preheating methods and increasing the system’s energy, exergetic, and exergoeconomic efficiencies. The disadvantage of these systems is that natural gas consumption is high, generating high counterproductive costs. Some authors have looked for other options for preheating, such as cogeneration and solar energy. However, geothermal energy is a renewable resource with a high potential for being explored. The above has motivated the authors of this work to contribute to filling this gap in the literature and to analyze a theoretical proposal for a natural gas decompression station to avoid freezing due to the Joule–Thomson effect, implementing geothermal energy as an alternative preheating and a vortex tube as a complementary technology. The scope of the work includes an energy, exergy, exergoeconomics, and optimization analysis for a decompression station, using a U-tube vertical heat exchanger and implementing real data obtained experimentally for the vortex tube analysis. In this way, to achieve the scope of this work, the following specific objectives have been established:
  • Perform the energy analysis to obtain the energy performance, energy flow rates, and energy interactions of the equipment that makes up the decompression station. This analysis is to evaluate the energy feasibility and obtain the nominal capacities of the equipment, and in this way, establish the thermal design of some components, such as the geothermal heat exchanger;
  • Perform the exergy analysis to determine the maximum theoretical potential of the decompression station and evaluate the magnitude of the thermodynamic inefficiencies that occurred in the equipment during the natural gas decompression process. The above is to identify the critical components that have the most significant influence on the thermodynamic performance of the decompression station;
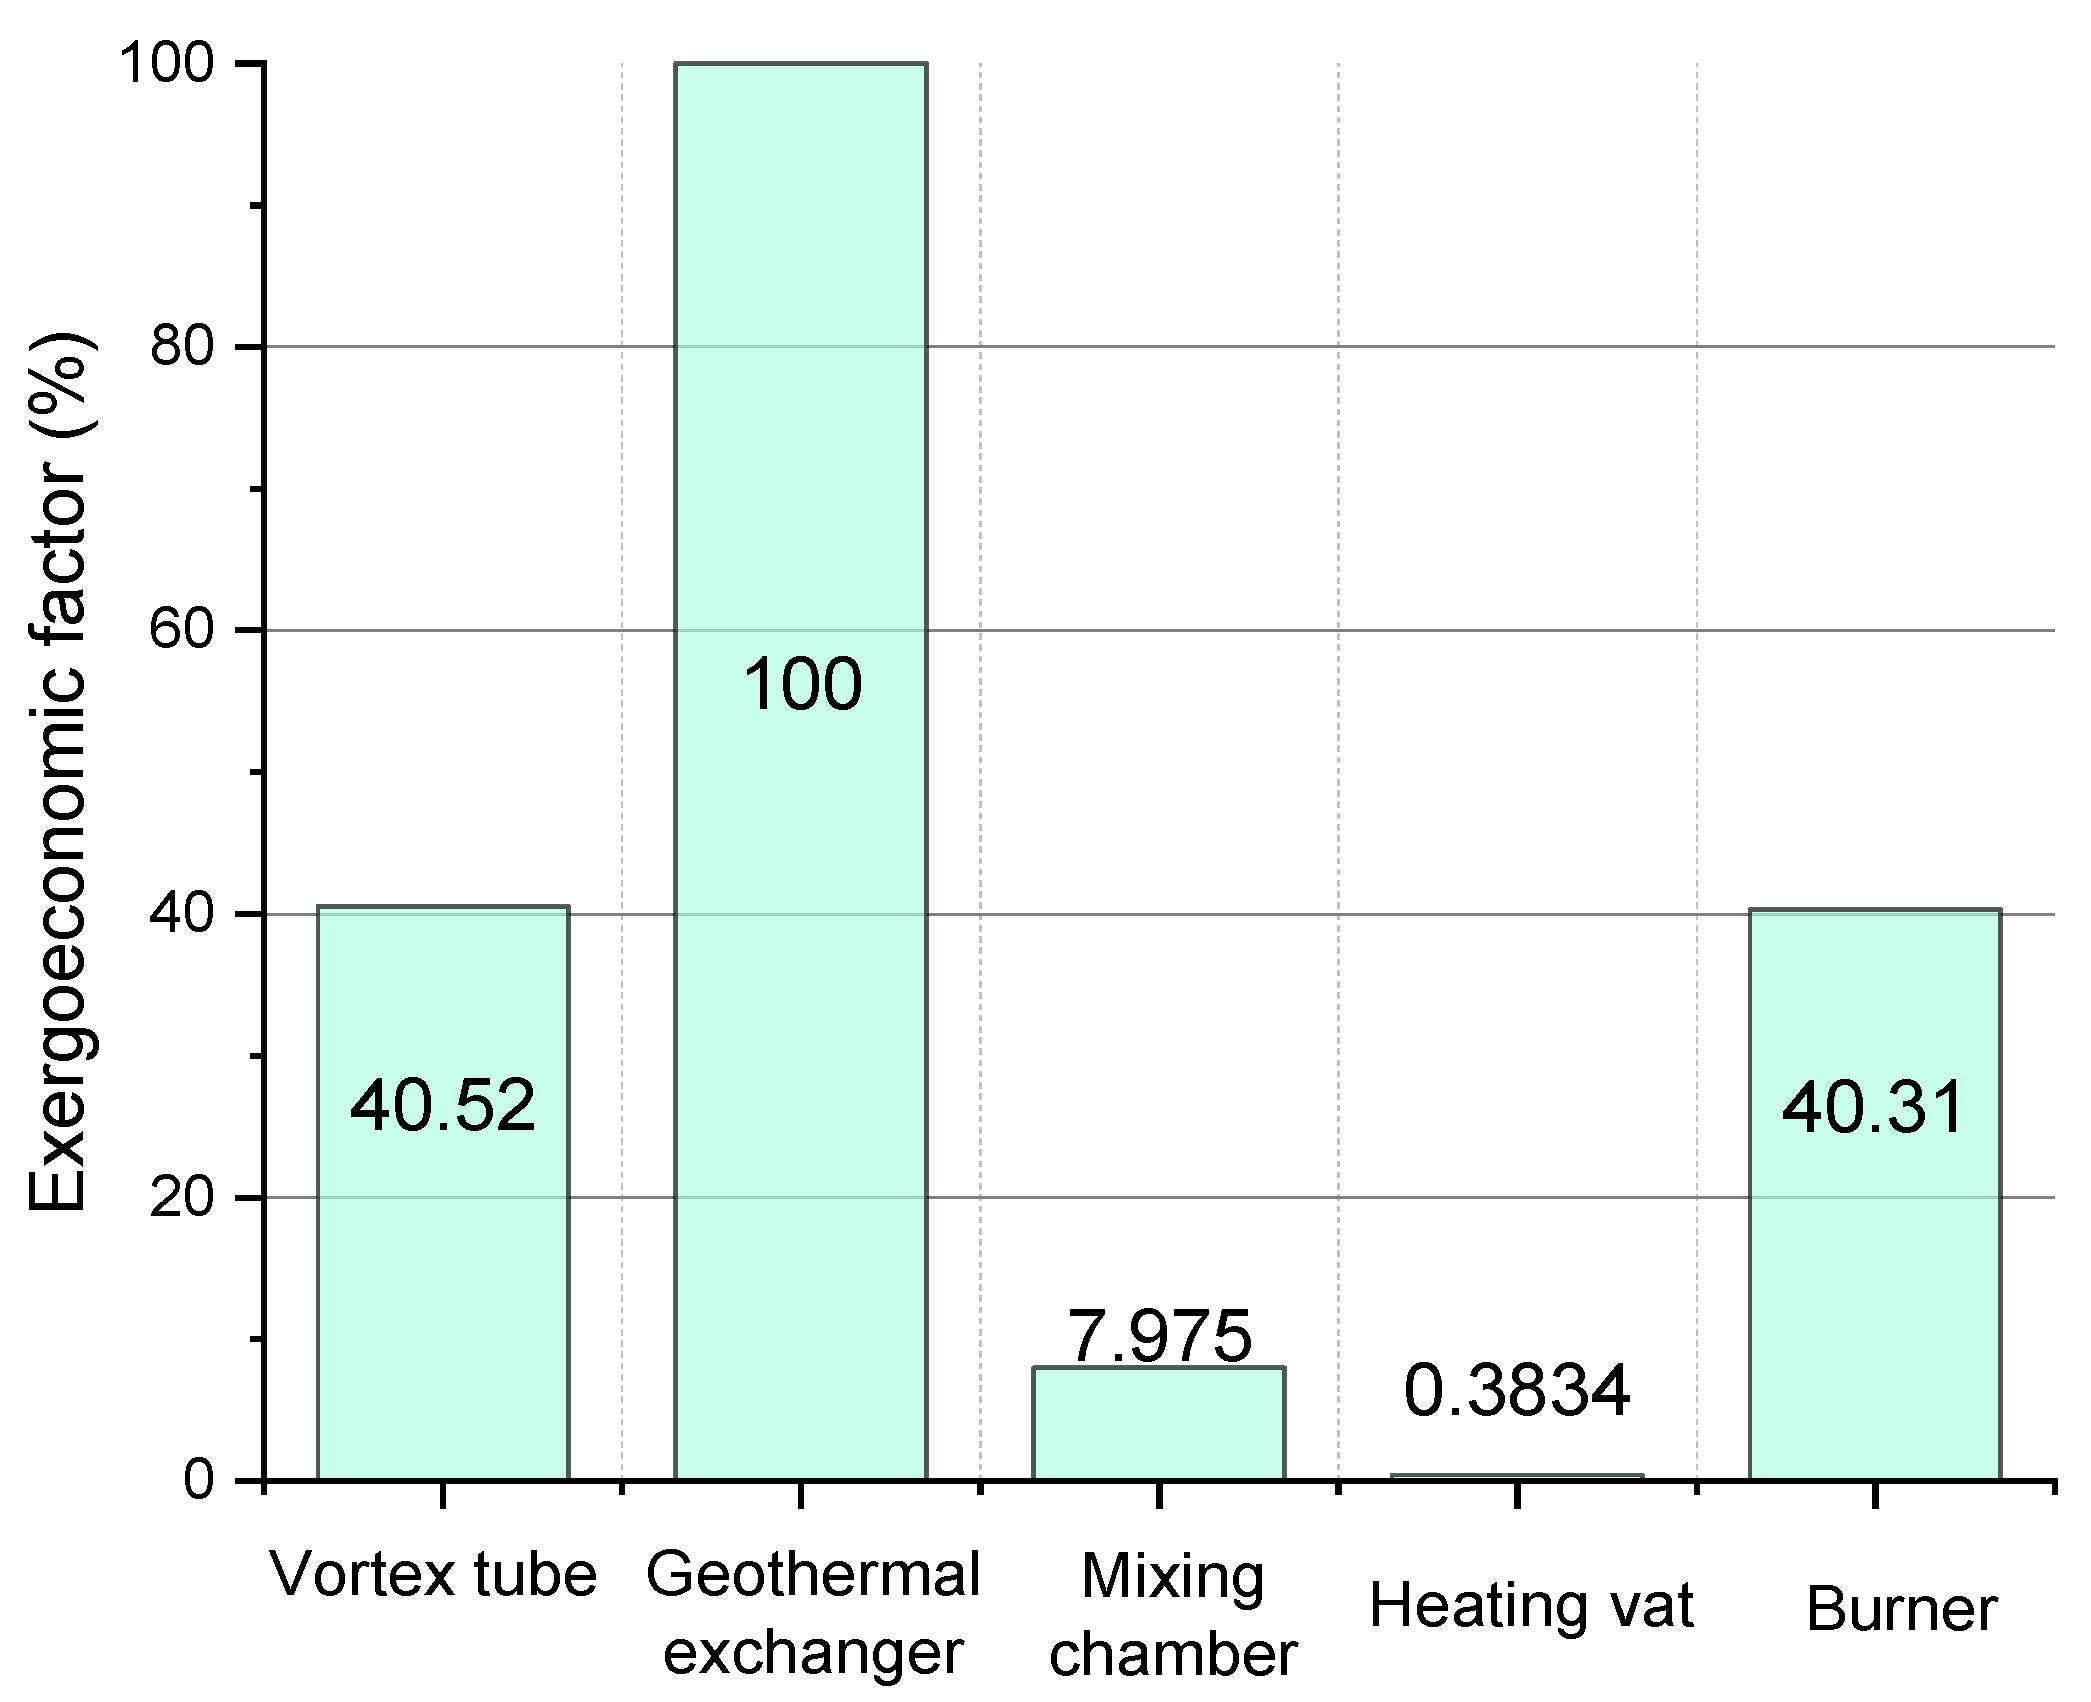
  • Perform the exergoeconomic analysis to estimate the station’s operating costs and, through thermoeconomic indicators, determine the equipment with the most significant area of opportunity for the reduction in operating costs and costs related to the thermodynamic inefficiencies of the components;
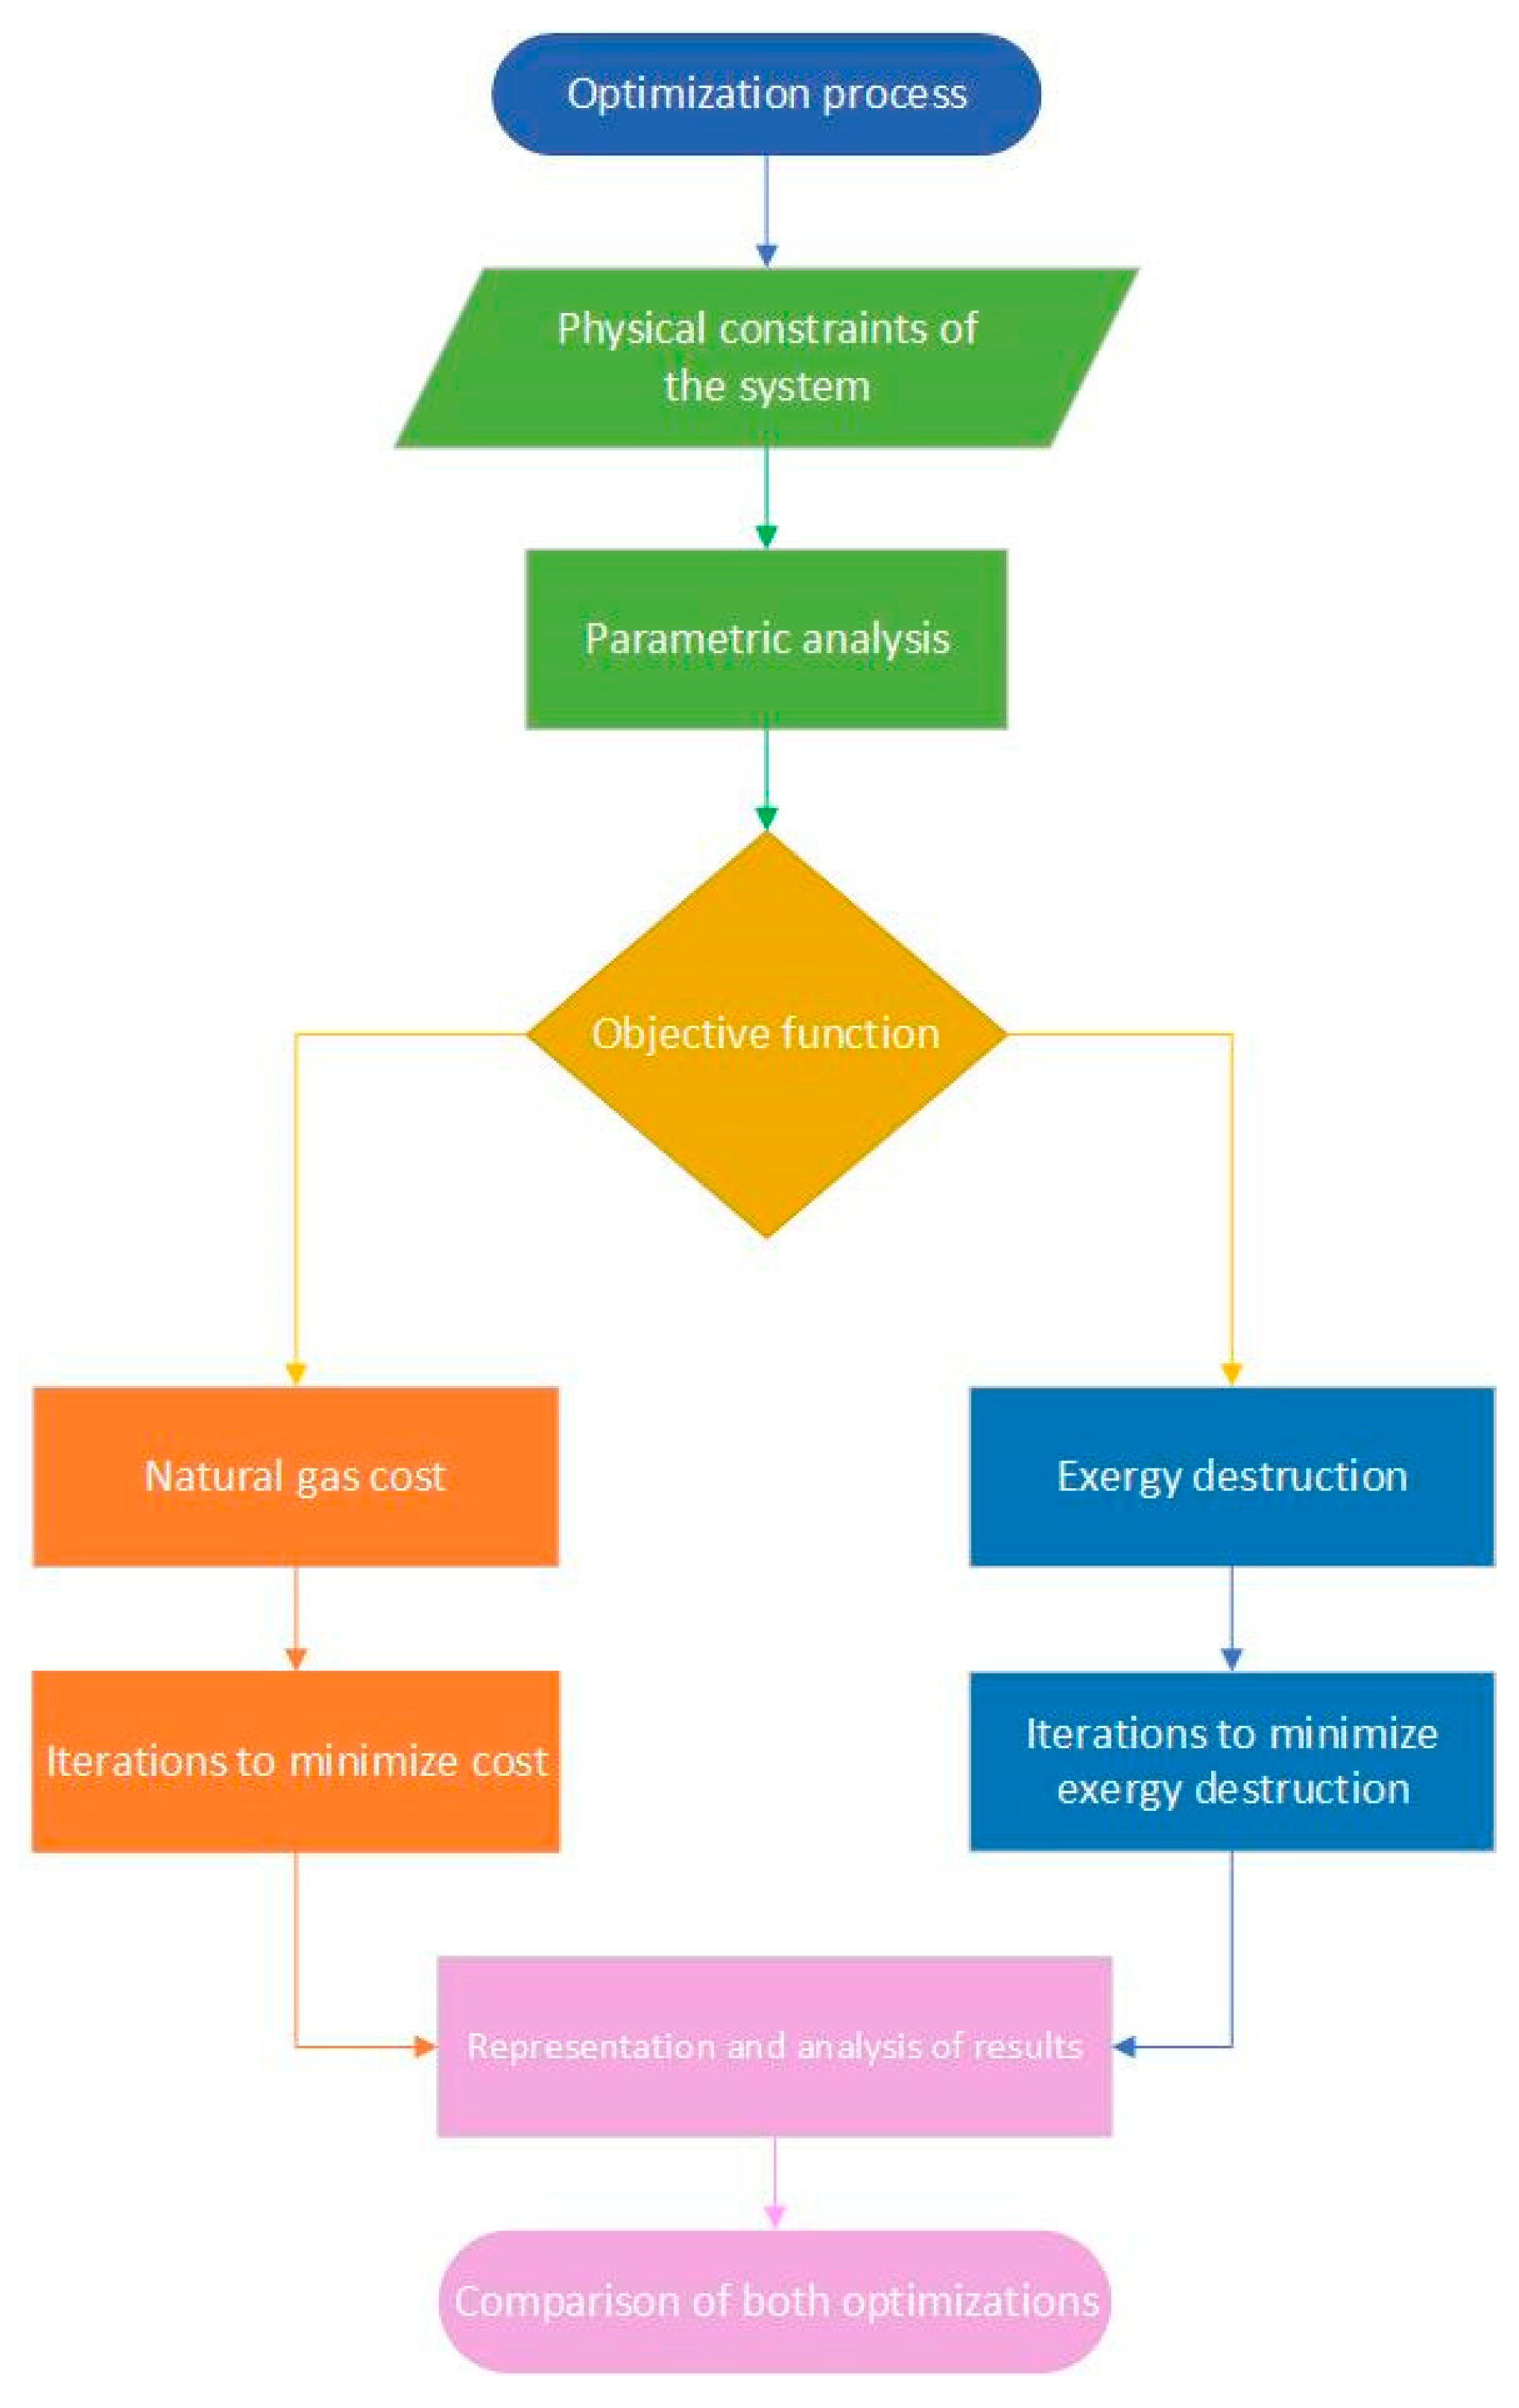
  • Carry out a parametric optimization of the decompression station to reduce natural gas costs and reduce exergy destruction, modifying some variables and input parameters of the station through a process of iterations, simulating different operating conditions and their effect on the costs.

2. System Description

Figure 1 shows the natural gas decompression station scheme with a vortex tube and geothermal preheating. The natural gas enters the vortex tube (Thermodynamic State 1) and is divided into two streams, one hot (Thermodynamic State 2) and the other cold (Thermodynamic State 3). The cold stream exits the vortex tube through an air nozzle, while the hot stream exits through an adjustable cone valve on the opposite side of the tube. This valve regulates the percentage of cold and hot flow from each end of the vortex tube [32]. Subsequently, the cold stream of natural gas goes through the geothermal preheating stage (Thermodynamic Process 3–4), where the natural gas is preheated in a heat exchanger with a U-tube configuration inserted in a geothermal well. At the end of this stage, the natural gas leaves (Thermodynamic State 4) with a temperature similar to that of the hot stream coming from the vortex tube (Thermodynamic State 2) due to the contribution of geothermal heat. As a geothermal reservoir, it is considered a medium enthalpy reservoir, with temperatures between 100 and 150 °C and a depth of between 50 and 200 m [33]. After the geothermal preheating stage, the natural gas is mixed with the hot stream from the vortex tube in the mixing chamber (component C). Once the flows are combined, they pass to the heating vat (component D), where gas expansion occurs through an expansion valve. The Joule–Thomson effect occurs in this stage when natural gas is suddenly expanded. In this stage, natural gas requires heating again, coming from the burner (component E) that uses the same natural gas for combustion. Once the natural gas goes through the decompression process in a water bath heater or heating vat (Process 5–6), it is ready for final use.

3. Materials and Methods

For the complete analysis of the natural gas decompression, the implemented methodology divides the analysis into stages, considering diverse factors in each stage. This work adapts the methodology used by Afanaseva et al. [34], whereby in this work the following process is established:
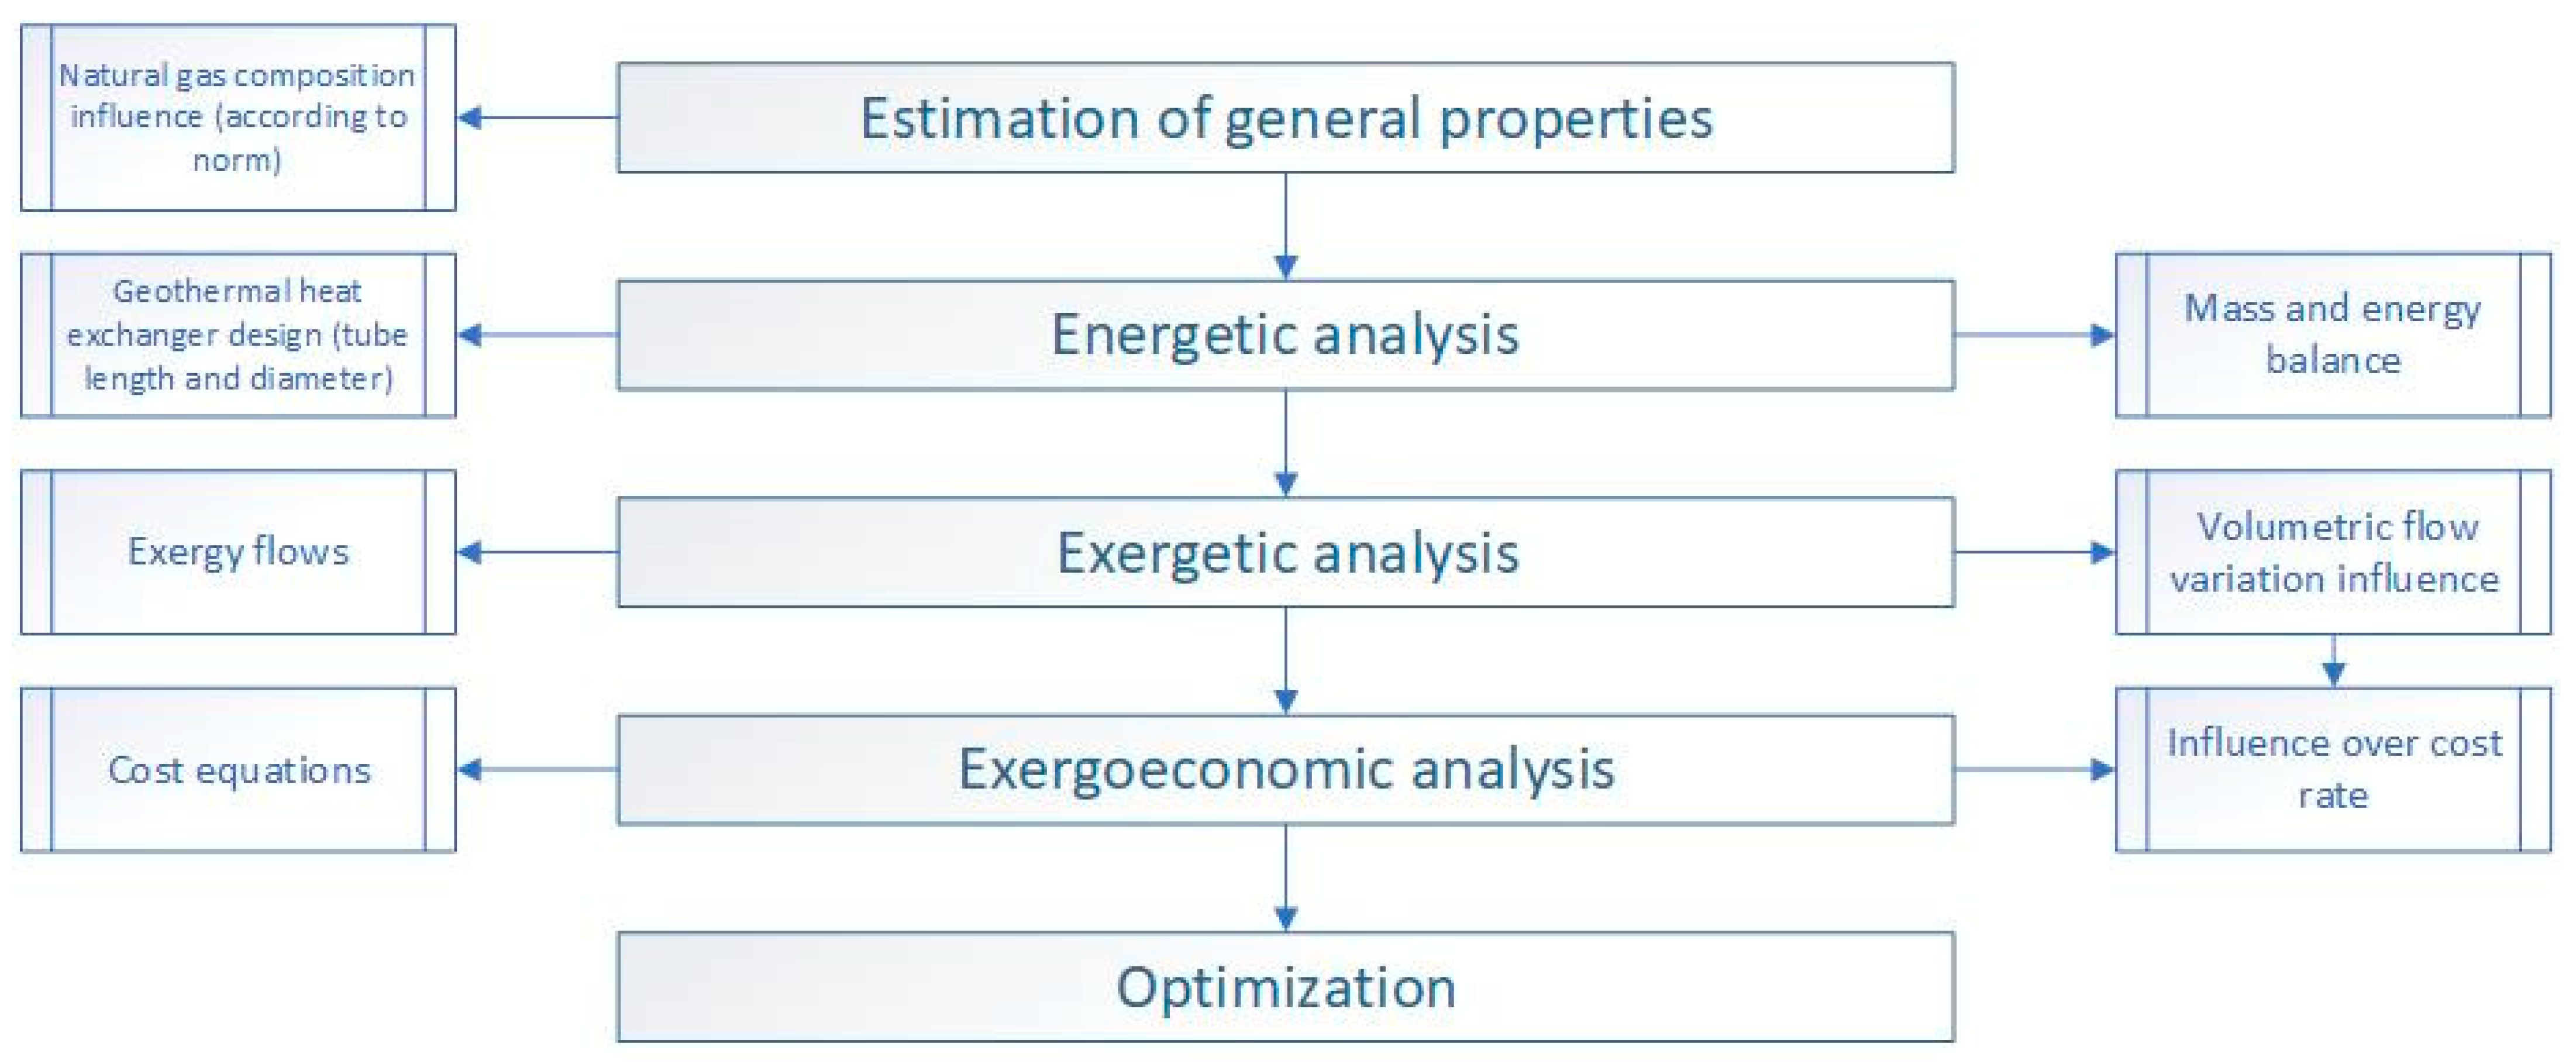
  • Estimation of general properties: This initial stage involves general property calculations taking into account the influence of natural gas composition. Also, the inlet and outlet pressure and temperature conditions of the station are selected;
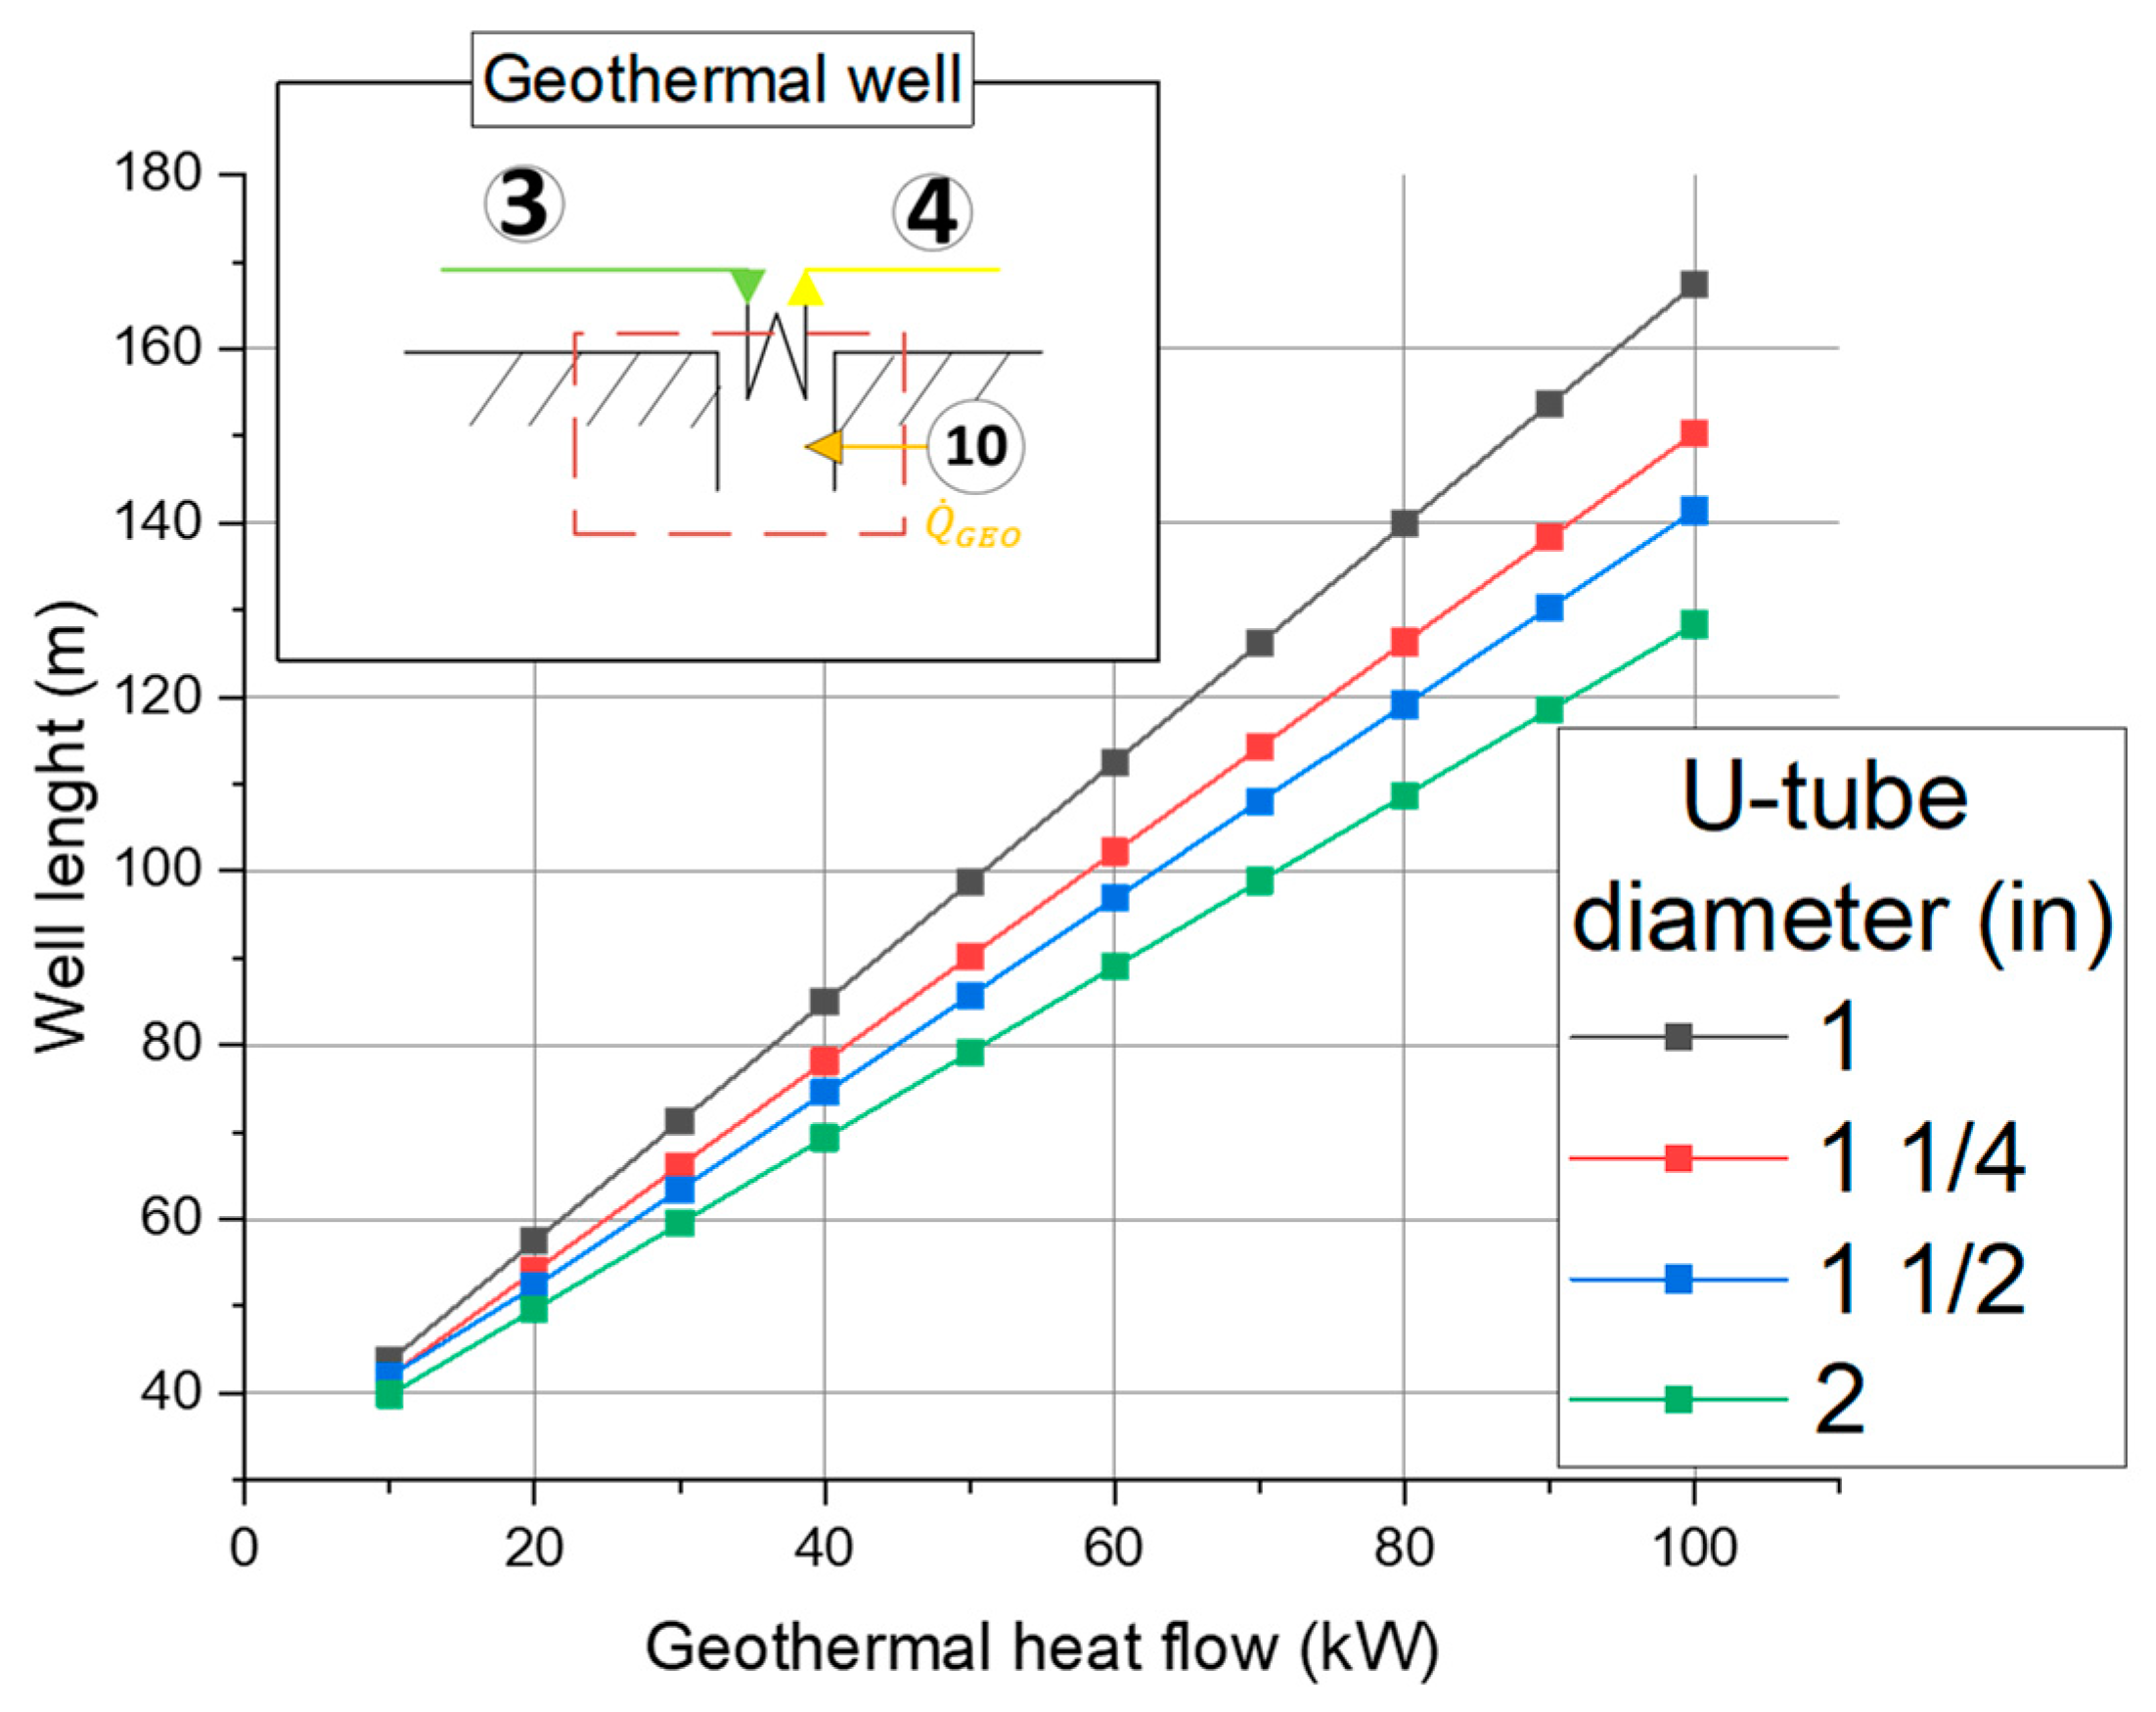
  • Energy analysis: In this stage, mass and energy balances are realized in the equipment to obtain the required heat flows in the heat exchangers. The importance of the geothermal exchanger design is highlighted particularly by analyzing the influence of the U-tube diameter relative to its length;
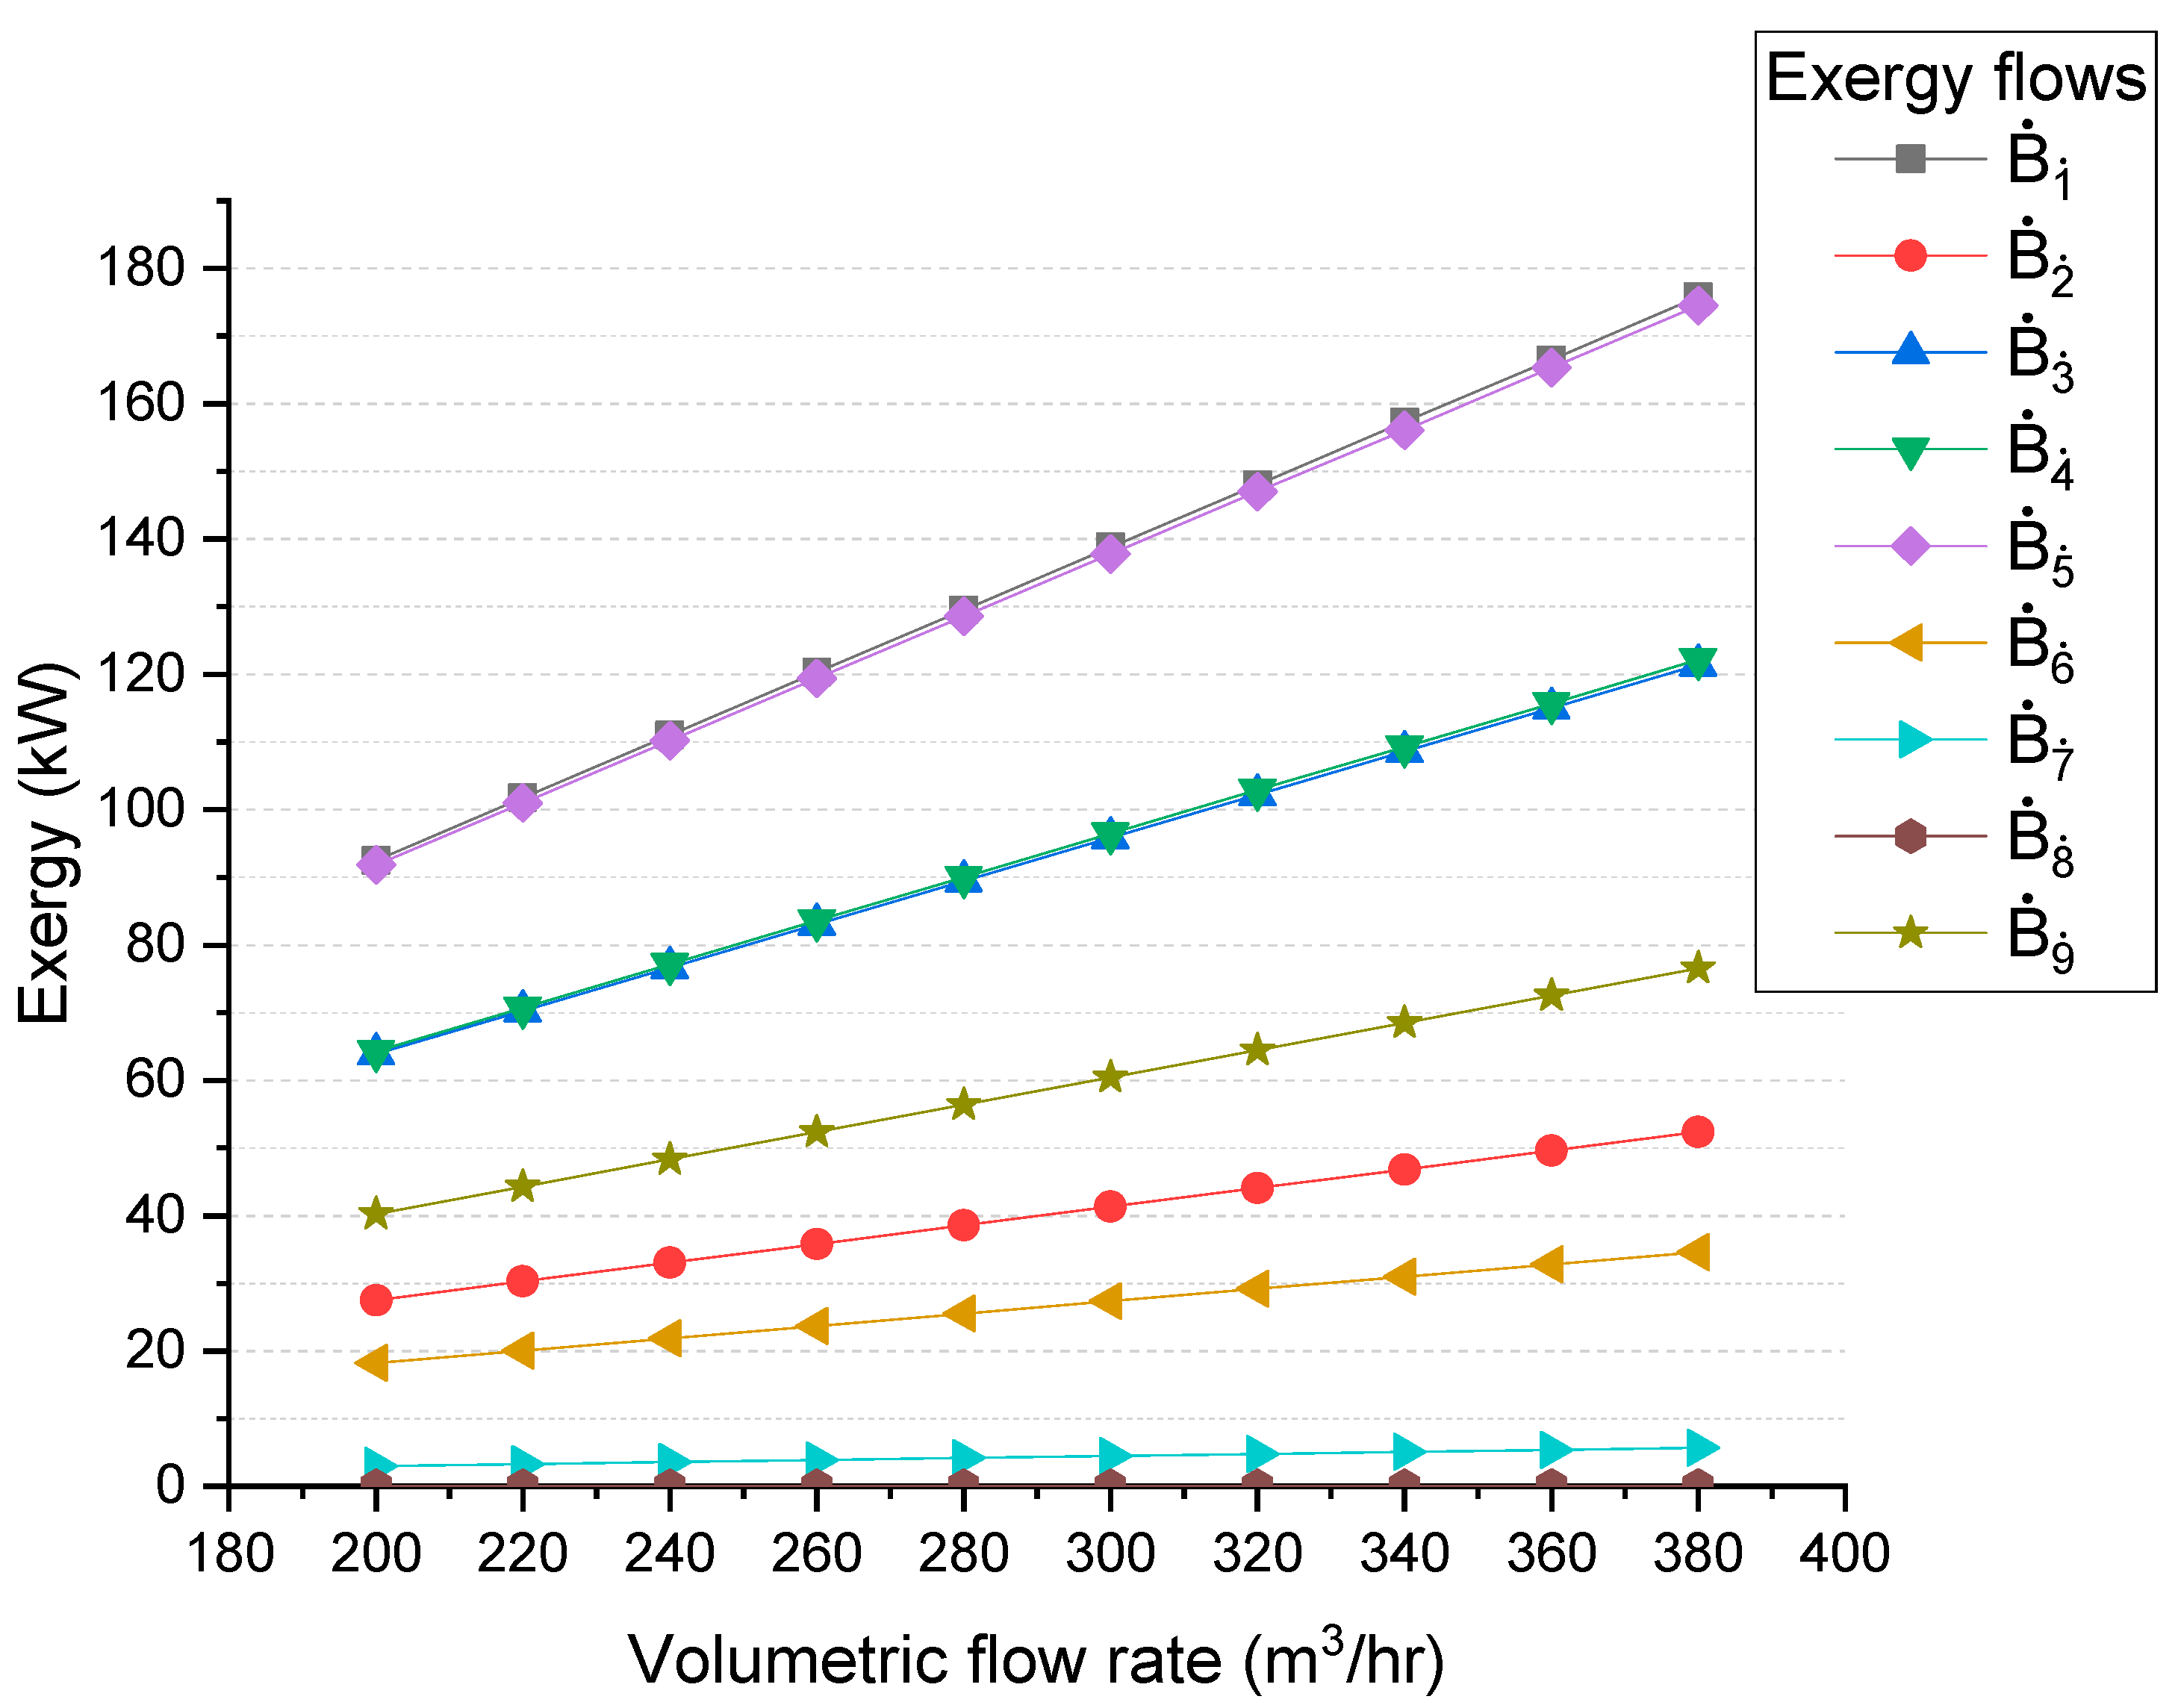
  • Exergetic analysis: For this stage, it is necessary to calculate all exergy flows of the system, as well as exergy destruction, and define the fuel and product of each equipment. Subsequently, changes in exergy flows are analyzed by varying the volumetric flow rate;
  • Exergoeconomic analysis: All equipment cost equations, considering inflation, as well as the cost rate of each one, are obtained. Similar to the previous stage, the influence of volumetric flow rate variation on costs is considered;
  • System optimization: This is the last stage of the analysis, where a parametric analysis is performed to obtain the most appropriate decision variables for carrying out two optimization processes of two single objective functions: natural gas cost and system exergy destruction.
A summary of the implemented methodology is shown in Figure 2.

3.1. Natural Gas Properties and Initial Considerations

The basic properties needed for calculations in the study should be obtained from initial suppositions and considerations for utilizing them in equations that allow the obtainment of the desired data.

3.1.1. Initial Considerations

General considerations of previous analysis in the decompression system are presented below:
  • Natural gas flow is considered stationary and stable;
  • Natural gas flow is compressible;
  • Kinetic energy changes (ΔKc) and potential energy (ΔEp) from all equipment are negligible;
  • System pipelines are considered adiabatic, so the heat losses are negligible;
  • The pressure in the system equipment is considered constant. The pressure only decreases in the expansion stage inside the heating vat [35];
  • Natural gas composition is considered with all the hydrocarbons that conform to it according to Table 1;
  • Natural gas is analyzed as a real gas mixture;
  • The natural gas arrives at the station with an ambient temperature (20 °C) and a 250 bar pressure [36];
  • The water in the heating vat remains constant at a temperature of 62 °C;
  • The natural gas output pressure is 3 bar, and the output temperature is 20 °C;
  • Natural gas flow output from the station is rated at 300 m3/h [37].
To compare the ideal conditions approach to a more real case, some efficiencies are considered to obtain the deviations in the principal parameters of the real system. Those conditions are:
  • A vortex tube cooling efficiency of 40% [38];
  • An effectivity for heating vat and geothermal heat exchanger of 90% and 95%, respectively [39,40];
  • A burner heat transfer efficiency of 60% [41].

3.1.2. Natural Gas Composition

Maximum and minimum permitted values are used as references for the natural gas composition, according to the norm (NOM-001-SECRE-2010) and its subsequent resolution (RES/596/2014) [42,43]. That composition is entered in percentage, equivalent to its mass fraction, as shown in Table 1. It is essential to mention that natural gas may contain other elements at lower rates; these are negligible because they do not significantly affect the general properties of natural gas as a mixture.

3.1.3. Estimation of General Properties

Knowing the mass and molar fractions of every hydrocarbon and element that makes up natural gas is necessary to obtain its general properties. There are two different ways to calculate the mass and molar fractions according to the percentage type of composition in natural gas: mass or volume percentages [44]. Once these data are obtained, the rest of the properties, such as the gas mixture constant, density, specific heat capacity, viscosity, and thermal conductivity, are obtained. Table 2 summarizes the properties and equations that characterize the system. With molar fraction, the natural gas constant is obtained. The density and mass flow are calculated using the compressibility factor equation. The viscosity is determined by the equation shown in Table 2, which considers natural gas density, molar mass, and temperature [45]. The thermal conductivity is obtained using Gambill’s correlation [46]. Thermodynamic modeling (energetic, exergetic, and exergoeconomic) is performed once all system properties are determined.

3.2. Energetic Modeling

Energy modeling is realized by applying a mass and energy balance using the law of conservation of mass and thermodynamic first law, Equations (1) and (2), where m ˙ (kg/s) is the mass flow, h is the enthalpy (kJ/kg), Q ˙   is the heat flow (KW), and W ˙ is the work (kW). All of the derivate balance equations have the same units [47]:
m ˙ I N · h I N m ˙ O U T · h O U T + Q ˙ I N Q ˙ O U T + W ˙ = 0
m ˙ I N m ˙ O U T = 0  

3.2.1. Vortex Tube

In the vortex tube, natural gas exits in one hot and one cold flow. By making a mass and energy balance, the exit mass flows can be substituted by inlet natural gas flow multiplying a coefficient that represents the hot and cold flow percentage [40].
Equation (3) is obtained by substituting the mass flows with their respective coefficient in the vortex tube balance equation, then replacing enthalpy using the specific heat definition and finally reordering the terms and eliminating the specific heat from both sides of the equation (see Appendix A.1). This equation describes the vortex tube behavior depending on the hot and cold flow percentages. The outlet hot natural gas temperature is evaluated by setting hot and cold ratios and a limit in the outlet cold temperature above 0 °C due to hydrate formation.
μ C · T 1 T 3 = μ H · T 2 T 1

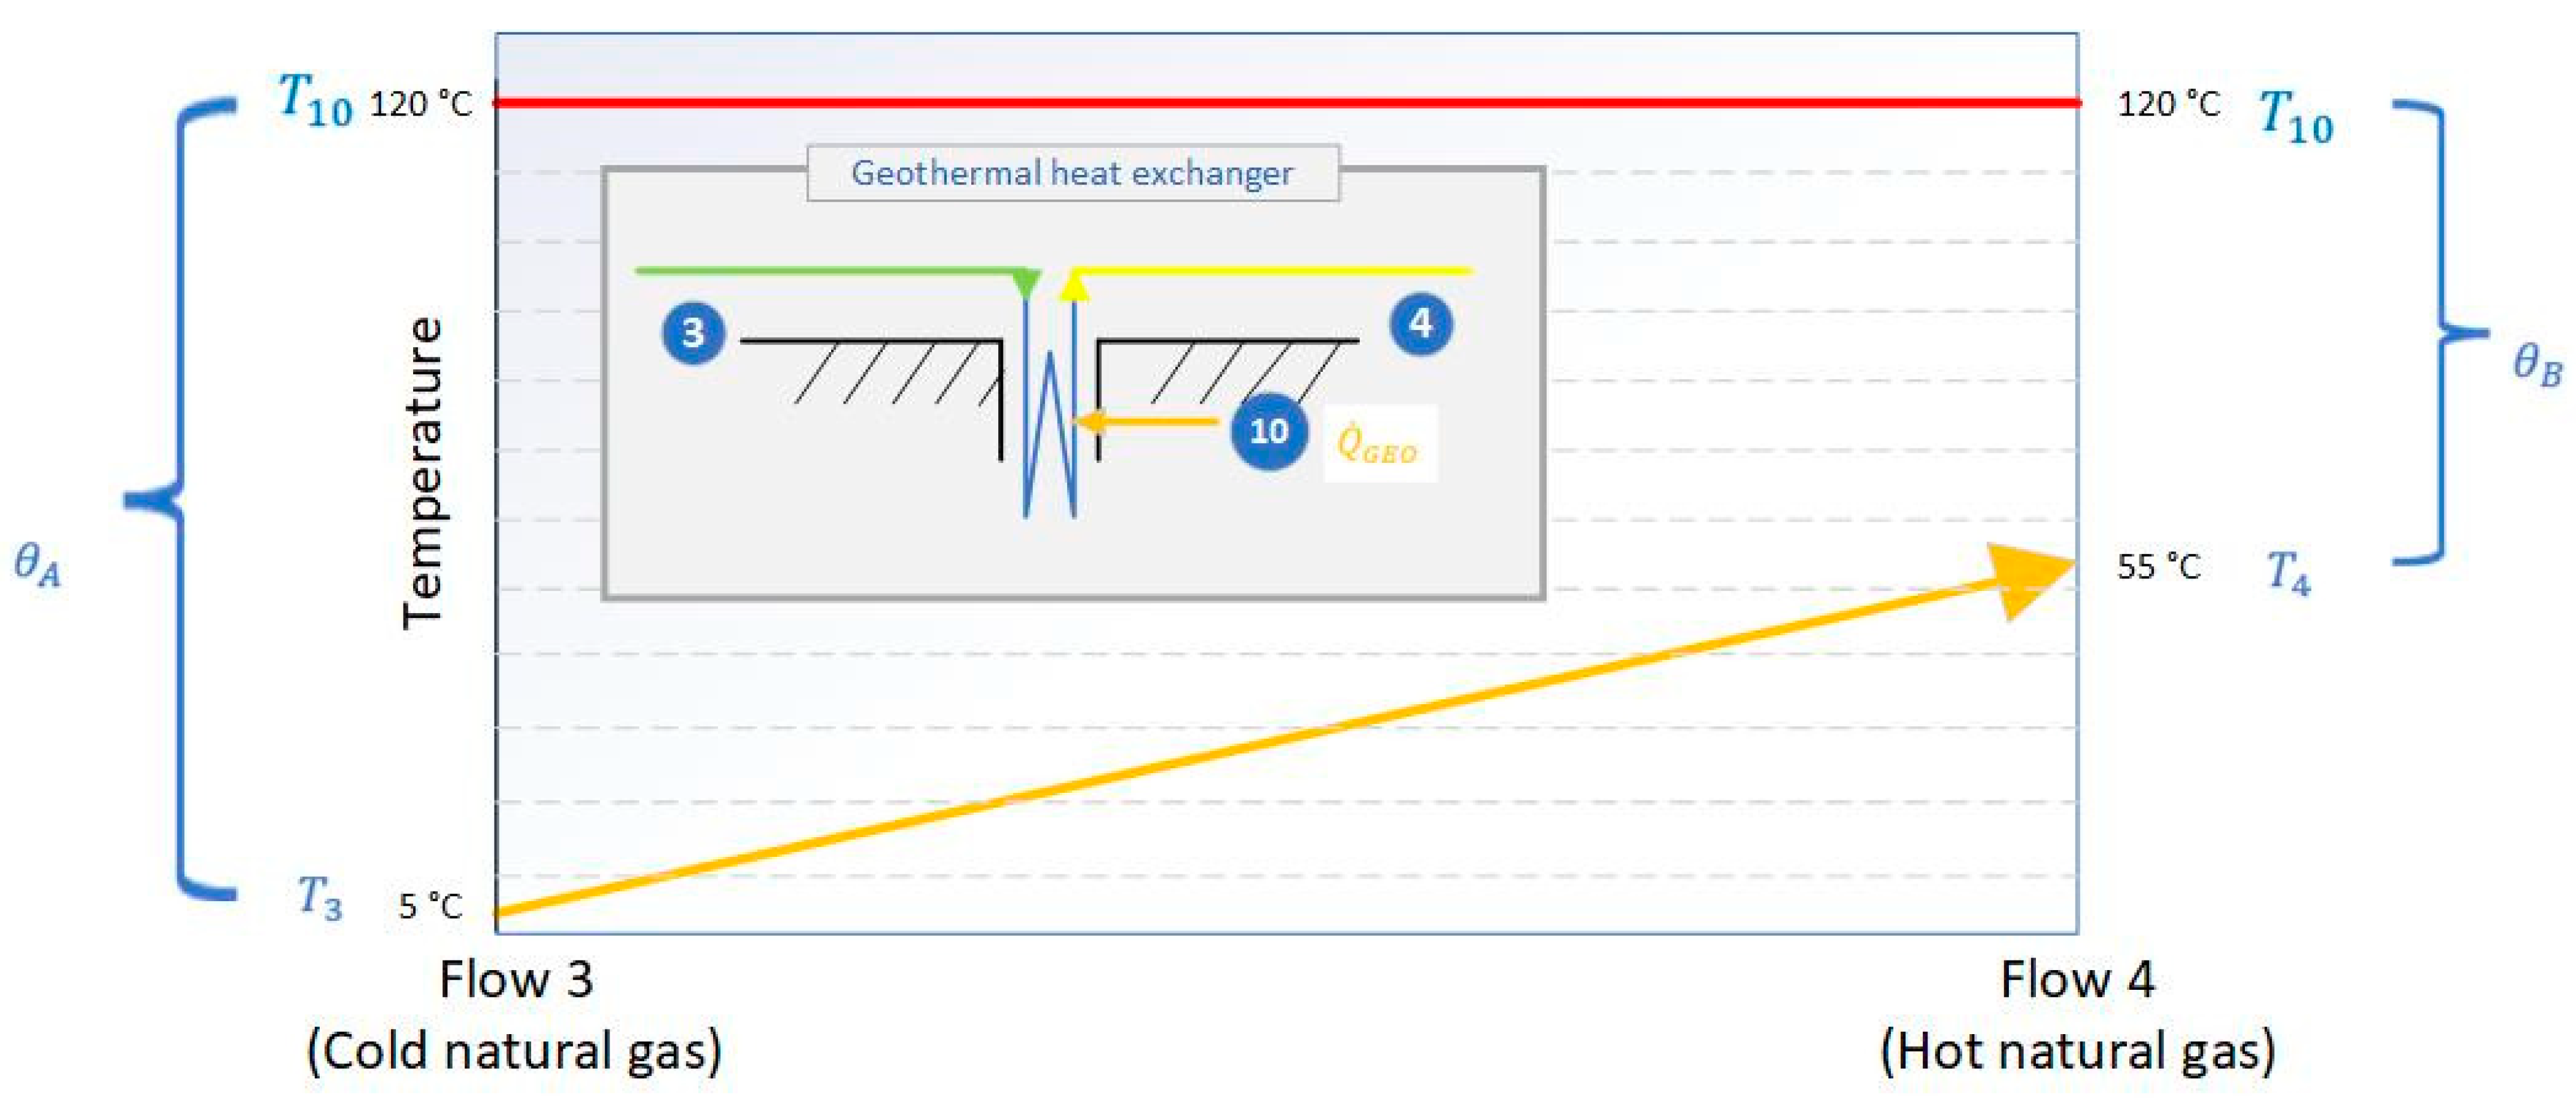
3.2.2. Geothermal Heat Input

The outlet cold flow from the vortex tube goes to a U-tube, where the preheating geothermal process is conducted. The U-tube works as a heat exchanger between the ground and the natural gas. The energy balance is shown in Equation (4) utilizing a specific heat definition [48]:
Q ˙ N G 1 = m ˙ 3 · C p , N G · T 4 T 3
A 25% safety margin is added to the obtained heat flow due to possible losses or malfunctioning of the system [49]:
Q ˙ G E O = 1.25 Q ˙ N G 1

3.2.3. Geothermal Heat Exchanger Design

The U-tube dimensions to raise the natural gas temperature to the required temperature are obtained from the logarithmic mean temperature difference (LMTD in °C) method, Equation (6), where U is the overall heat transfer coefficient ( k W / m 2 · K ) and A is the total heat transfer area ( m 2 ) [50].
Q ˙ G E O = U · A · L M T D
LMTD obtention requires establishing the heat exchanger temperature–length (T-L) diagram. The value of T L M T D is obtained, as shown in Figure 3.
Once the heat exchanger’s ending temperature differences are obtained ( θ A and θ B in °C), the LMTD is defined from Equation (7) [51]:
L M T D = θ A θ B ln θ A θ B
The overall heat transfer coefficient is defined by the inside and outside pipe diameter relation (m), the convective heat transfer coefficient ( k W / m 2 · K ) , and the thermal conductivity of the pipe ( W / m · K ) [52]. A term that considers the U form from the exchanger tube and the well filling ( W / m · K ) is implemented, Equation (8):
U = 1 R 2 R 1 1 h N G + R 2 ln R 2 R 1 k T U B E + 2 π R 2 β 0 R 2 R W E L L β 1 · k F I L L
In Equation (8), the variables β 0 and β 1 are form factors. These coefficients vary depending on the position of the tube inside the geothermal well. The BWG caliber and radio of the pipe are chosen from the available diameters of commercial pipes. The radio/diameter of the well depends on the diameter of the augers. The thermal conductivity of the tube depends on the type of material. Due to high pressures, a stainless steel pipe is considered in this work.
The convective heat transfer coefficient of the natural gas can be known from the Nusselt number, defined in Equation (9) [53]:
N u = h N G · R 1 K N G
The Gnielinski equation is used to obtain the Nusselt number [54]; the Nusselt number is a function of the Reynolds number, Prandtl number, and Darcy factor (see Appendix A.2) [55,56].
Once the overall heat transfer coefficient is calculated, the total heat transfer area of the exchanger is obtained. Two passes are considered in the pipe area, where L 1 is the length of the U-tube in meters:
A = 4 π · L 1 · R 2
due to the geothermal well’s temperature of 120 °C not being obtained on the surface, an additional length of the pipe L 2 in m (meters) is considered for reaching the depth where the ground temperature is constant. Therefore, the total length of the U-tube exchanger is:
L = L 1 + L 2

3.2.4. Water Bath Heater (Heating Vat)

The heating vat acts as a heat exchanger in the system. In this system component, the Joule–Thomson effect causes a decrease in the temperature due to the expansion of natural gas. This temperature decrease (°C) is evaluated by Equation (12) multiplying the Joule–Thomson coefficient μ J T in °C/kPa and the pressure change (kPa):
T J T = μ J T · P
Equation (13) determines the heat flow release from the natural gas due to the Joule–Thomson effect:
Q ˙ J T = m ˙ N G · C p , N G · T J T
The required heat flow needed in the heating vat, considering the Joule–Thomson effect, is evaluated with Equation (14):
Q ˙ J T = m ˙ N G · C p , N G · T J T
The same as was performed with the geothermal heat flow, a 25% security factor is added to the heating vat heat flow, considering heat losses [49]:
Q ˙ V A T = 1.25 · Q ˙ N G 2
The required water flow in the heating vat for satisfying the heat flow conditions is determined with Equation (16):
Q ˙ V A T = m ˙ H 2 O · C p , H 2 O · T 7 T 8
The fuel amount (natural gas from the station) that is required to heat the water in the heating vat is determined from Equation (17), where CV is the calorific value of the natural gas (kJ/kg):
Q ˙ V A T = C V · ( m ˙ F U E L )
Finally, by Equation (18), the natural gas percentage that is consumed to realize the preheating process in the vat is obtained:
N G % = m ˙ F U E L m ˙ N G

3.3. Exergetic Modeling

Subsequently, an exergetic analysis of the natural gas decompressing station is presented, implementing a vortex tube and geothermal preheating.

3.3.1. Exergy Flows

The exergy flow is defined as the available energy in a system. The exergy can be transferred from or to a system in different ways: by heat, work, or mass flow [57]. Table 3 shows the equations for exergy flow calculations, depending on the flow type. For Thermodynamic State 9, the exergy flow is the multiplication of the natural gas calorific value and the supplied fuel flow. Every exergy flow has kW units.

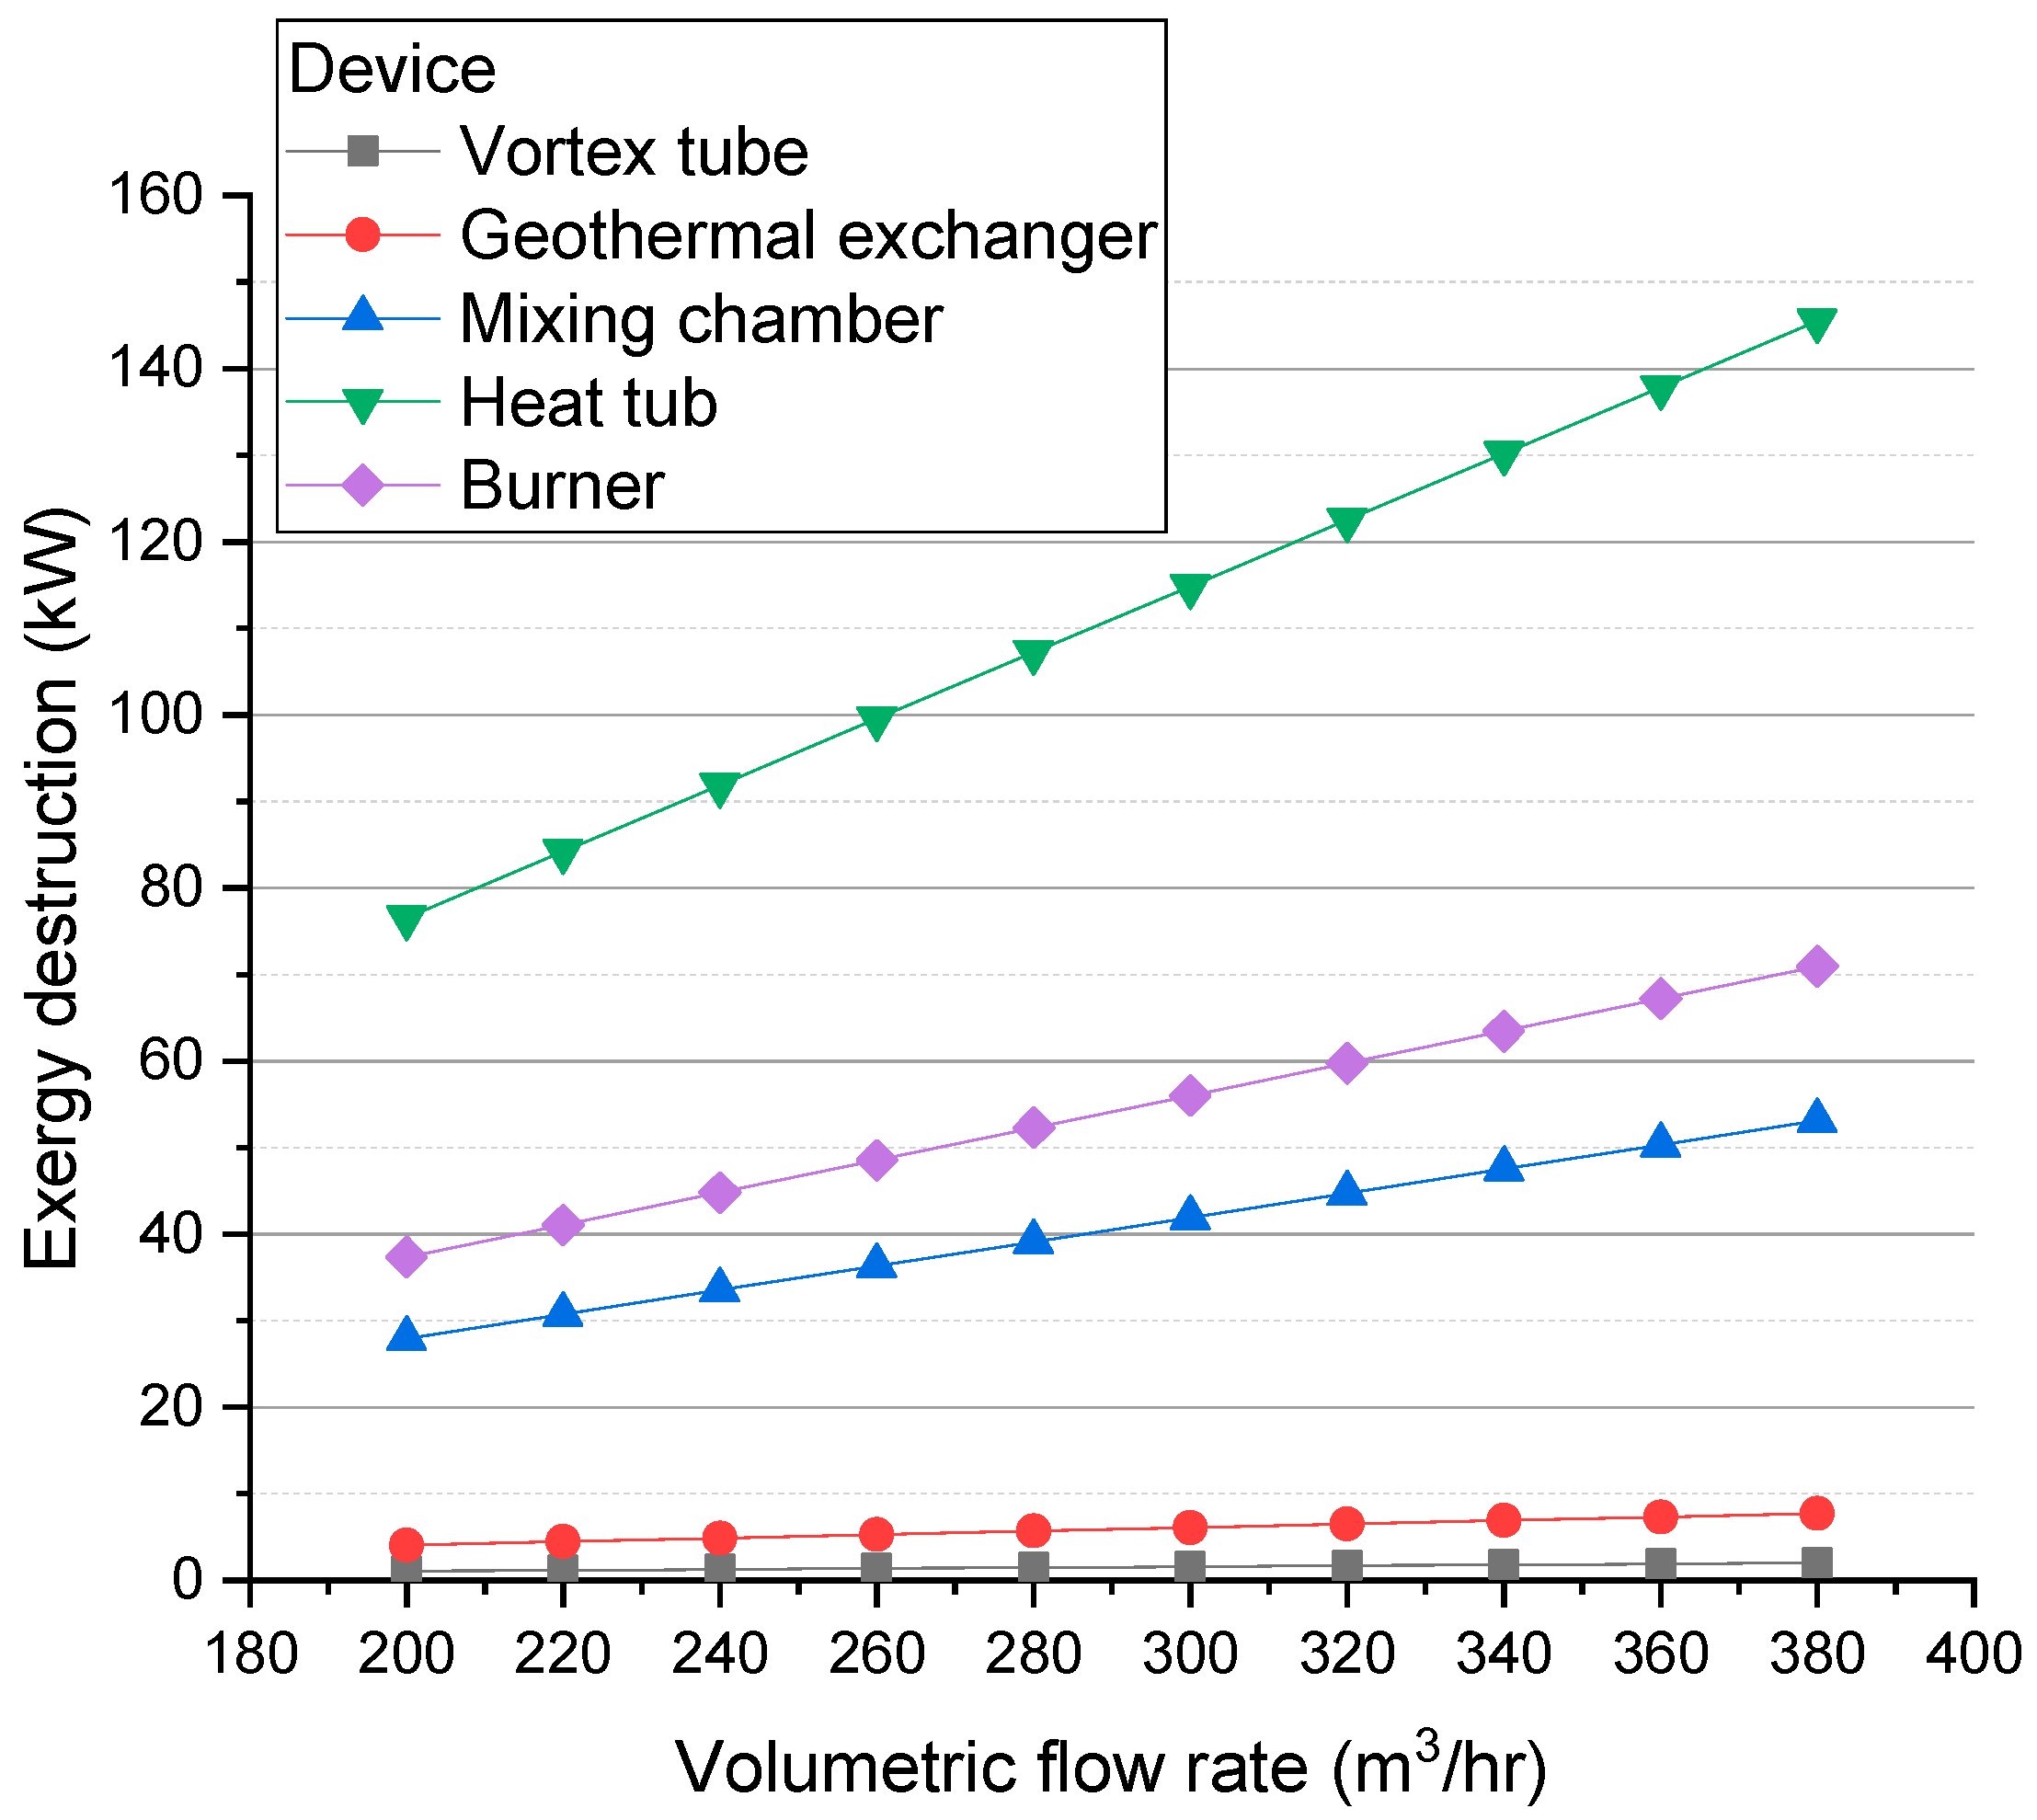
3.3.2. Exergy Destruction

The exergy destruction is defined as the fuel exergy minus the product exergy, Equation (19) [58].
E ˙ D , k = E ˙ F , k E ˙ P , k
The exergy destruction on the equipment in the decompression station is shown in Table 4. The values are based on the input and output exergy flows of every piece of station equipment. In the case of the heating vat, B ˙ 5 was considered as part of the fuel. Normally, B5 would be taken as a product, given by B ˙ 6 minus B ˙ 7 . The reason for considering B ˙ 5 as part of the fuel is because this equipment represents a special case. In a typical approach, when acting as a heat exchanger, the fuel is the flow that gives off heat (the water in the heating tank), while the product is the flow that absorbs heat (natural gas for this case), but, within the heating vat, there are several heat flows: the one in which the water gives off heat to the gas and the one in which the gas loses heat due to the Joule–Thomson effect, so this typical approach is not entirely correct. Given that the tank was analyzed without considering the internal process, the fuel for it is reconsidered. The objective of the tank is to absorb heat in order to keep the gas at the environmental temperature even after a decrease due to the Joule–Thomson effect. That is why the incoming flow, which has previously raised its temperature with geothermal preheating and the vortex tube, is also considered as fuel.

3.4. Exergoeconomic Modeling

The exergoeconomic analysis includes analyzing all equipment costs and the cost balance in the system according to the productive structure [59]. The data that translate the meaning of the system’s energy units to economic terms, showing the system’s feasibility of working under specific parameters, are obtained through this analysis.

3.4.1. System Equipment Costs

For calculating the equipment cost, various methods and equations were used. The geothermal well cost is based on the depth according to the correlation proposed by GeothermEX Inc. [60], and the burner cost is obtained based on the required heat flow. The vortex tube evaluation cost is implemented utilizing the method of Acar et al. [61], which involves the capital cost C C , V T , the operation and maintenance cost C O M , V T , and the residual value C R V , V T . Different commercial vortex tube prices were considered, according to the cooling capacity, for vortex tube capital cost. The cost of the U-tube and the heating vat are calculated based on the total heat transfer area, the type of exchanger, the design pressure, and the construction material [62,63]. The cost as a percentage of the geothermal heat exchanger cost is assumed for the mixing chamber. The burner investment cost is calculated using the method developed by PEDCo Environmental Inc. [64]. Table 5 shows a summary of all equations determined by the mentioned methods.
Since all given cost equations were elaborated for past years, updating the costs according to inflation is necessary. This update is made using Equation (20), using CEPCI indexes:
Z i = C 0 I A I 0

3.4.2. Capital Recovery Factor

The capital recovery factor (CRF) determines the initial investment recovery, Equation (21). The CRF is the ratio of a constant annuity to the present value of receiving that annuity for a given time. The present value uses an interest rate (i) and a period (n) that is the useful life of the system equipment. This work assumes a 10% interest rate and a 20-year useful life of the equipment based on other studies conducted in similar station systems [65].
C R F = i 1 + i n 1 + i n 1

3.4.3. System Equipment Cost Rate

The cost rate indicates the cost per time unit (USD/s) of equipment, according to the number of hours in operation in a year (N) and a maintenance factor. This work establishes the maintenance factor with a value of 1.06 and 6650 total work hours per year [66]. The cost rate is calculated with Equation (22):
Z ˙ i = Z i C R F ϕ N · 3600

3.4.4. Costs Balance

The exergy cost of a flow is defined as the initial fuel exergy amount to produce a product or the amount per time unit required to produce that flow. Equation (31) is used to realize the cost balance of the system equipment:
O U T C ˙ O U T , k + C ˙ W , k = C ˙ Q , k + I N C ˙ I N , k + Z ˙ k
where the cost flows C ˙ (USD/s) are the product of the unitary cost (USD/KJ) multiplied by the exergy of that flow:
C ˙ j = c j B ˙ i , j
The productive structure of the principal devices on the natural gas decompressing station and the auxiliary equations allow the establishment of the incoming and outgoing costs according to the exergy cost theory. The unitary cost of natural gas is obtained from the reference index prices of natural gas from the Mexican official institution “Comisión Reguladora de Energía” [67]. The cost balances, with all auxiliary equations, are shown in Table 6.

3.4.5. Thermoeconomics Evaluation

Several variables are essential in evaluating the decompressing station from a thermoeconomic point of view. Those thermoeconomics variables are the unitary fuel cost c F , k (USD/GJ), unitary product cost c P , k (USD/GJ), exergy destruction cost rate C ˙ D , k (USD/GJ), relative cost difference r k (%), and the exergoeconomic factor f k (%), obtained with Equations (25)–(29) [59].
c F , k = C ˙ F , k B ˙ F , k
c P , k = C ˙ P , k B ˙ P , k
r k = c p , k c F , k c F , k
f k = Z k ˙ Z k ˙ + C ˙ D , k + C ˙ L , k

3.5. System Optimization

An optimization is proposed to improve the decompressing station performance. The objective related to parametric optimization was not carried out in a traditional way. However, this paper addresses and describes an optimization of two objective functions; therefore, the objective is to obtain the decompressed natural gas with the lowest possible cost. Hence, the objective function of optimization is the unitary cost at the exit of the heating vat of the natural gas. A second optimization case is analyzed to minimize the irreversibilities due to exergy destruction in the system.
To achieve this, a parametric analysis is conducted to determine the decision variables that will form the constraint system. In this case, it was found that the key variables in the study are the temperature of the heating vat, the percentage of cold flow at the vortex tube, the temperature of the geothermal well, and the volumetric flow rate of the station. The constraints in the system appear due to physical limitations, and they have to respect the principle of energy conservation. Those restrictions are subject, for example, to the system dimensions, the material properties, and the maximum pressure and temperature allowed by the established standards [68].
The variables that remain fixed are known as preassigned parameters. The optimization process raised in this work is realized using the Engineering Equation Solver (EES) software, using its built-in optimization algorithm, which allows the maximization or minimization of the objective function to obtain ideal values for decision variables. The optimization process is shown in the block diagram from Figure 4.

3.5.1. Parametric Analysis

The parametric analysis independently determines the influence of every possible decision variable on the objective function. The possible decision variables for parametric analysis and their respective constraints are shown in Table 7. In the case of heat and cold percentages in the vortex tube, only one variable is included since when one percentage varies, so does the other percentage. A simulation of the station’s behavior with the independent variation in every chosen variable in a specific range and its influence over the objective function is performed. The output natural gas unit cost will increase or decrease depending on the variable value. The parametric tables function of EES is used, which tabulates the results for the subsequent study and compression of the system behavior. The parametric analysis is performed for both objective functions proposed: the natural gas unitary cost c 6 and the total exergy destruction of the system E ˙ D , T .

3.5.2. Objective Function Optimization

Optimization of the natural gas cost at the heating vat exit in the decompressing natural gas station is performed. The aim is to minimize the objective function, c 6 :
c 6 , M I N = c 6 T 7 , μ C ,   T G E O ,   V ˙ I N
EES provides two methods to minimize the objective function: the direct and metric variable methods. The optimization is performed by minimizing the objective function with the direct method. This method is used due to the problems caused by the metric variable method if the optimal value of a variable is found in the limit of its range despite this method having a better performance. The direct optimization method implements the software optimization algorithm [69]. When the necessary iterations are performed, the software determines the best configuration to minimize the unitary cost of the natural gas at the heating vat exit, establishing the optimum values for the decision variables. Finally, with the same method, the optimization of the total exergy destruction in the natural gas decompressing station is conducted, aiming to minimize the objective function E ˙ D , T .
E ˙ D T , M I N = E ˙ D , T T 7 , μ C ,   T G E O ,   V ˙ I N

4. Results and Discussion

The main results and discussion for the energy, exergy, and exergoeconomic analysis for the decompressing natural gas station that implements a vortex tube and geothermal energy as an auxiliary heat input are described below.

4.1. Energy Analysis Results
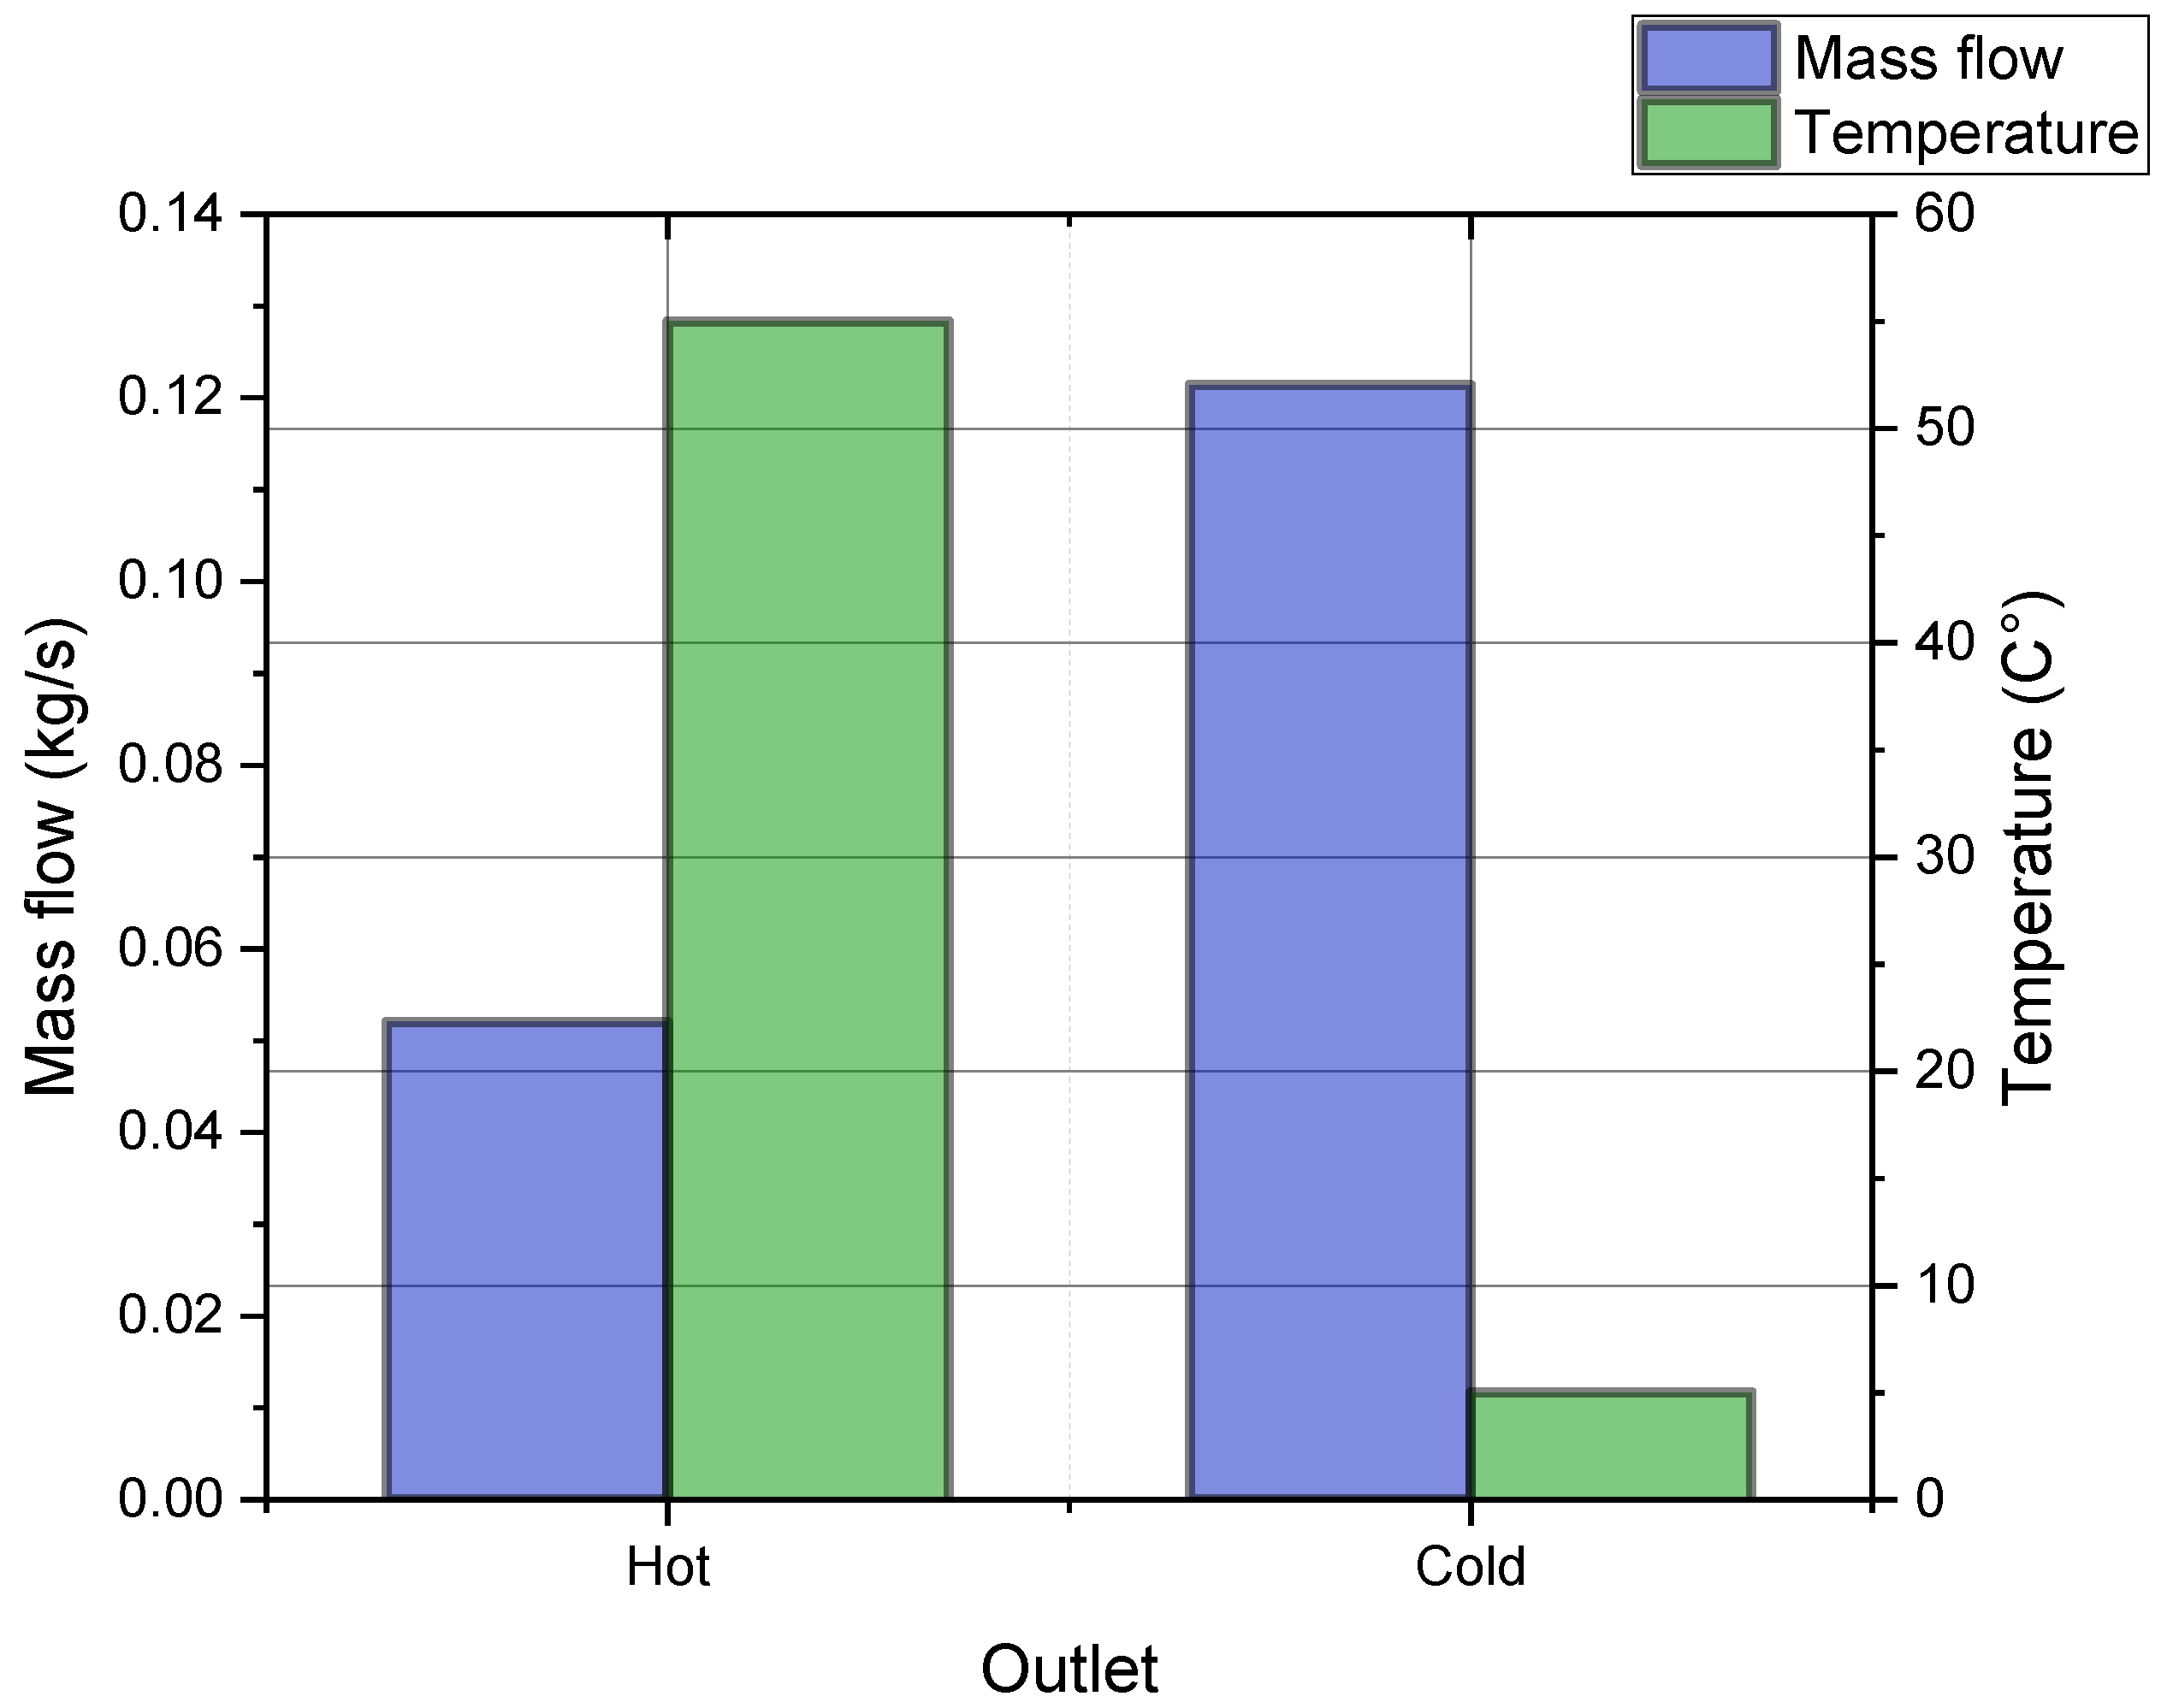
4.1.1. Vortex Tube

From the described model, the value of the mass flows at the cold and hot exit of the vortex tube, as well as the hot exit temperature, are obtained. For this, it is necessary to establish a minimum temperature at the cold fraction exit. This temperature is limited by the hydrate formation temperature in the system (0 °C), so a slightly higher temperature of 5 °C is chosen as a safety margin. The lower the cold temperature, the higher the hot fraction exit temperature will be. Figure 5 shows the amount of cold and hot mass flows and the exit temperatures at the vortex tube.

4.1.2. Geothermal Heat Input

With the geothermal heat exchanger energy balance, the heat flow needed in the cold flow to reach the same temperature as the hot flow from the vortex tube is obtained. The analysis from geothermal input shows a heat flow value of 26.41 kW ( Q ˙ G E O ). This value is small compared to other geothermal systems’ capacity, with typical values of 100 kW, but depending on the geothermal well, they can reach up to 2 MW. The relation of the geothermal heat flow with the geothermal well depth, with different tube diameters, is shown in Figure 6. From this figure, it is determined that for heat flows less than 40 kW, increasing the tube diameter does not represent a significant decrease in the necessary length in the geothermal heat exchanger tube, thus for the decompressing station, a 1-inch tube diameter is appropriate.

4.1.3. Geothermal Heat Exchanger Design
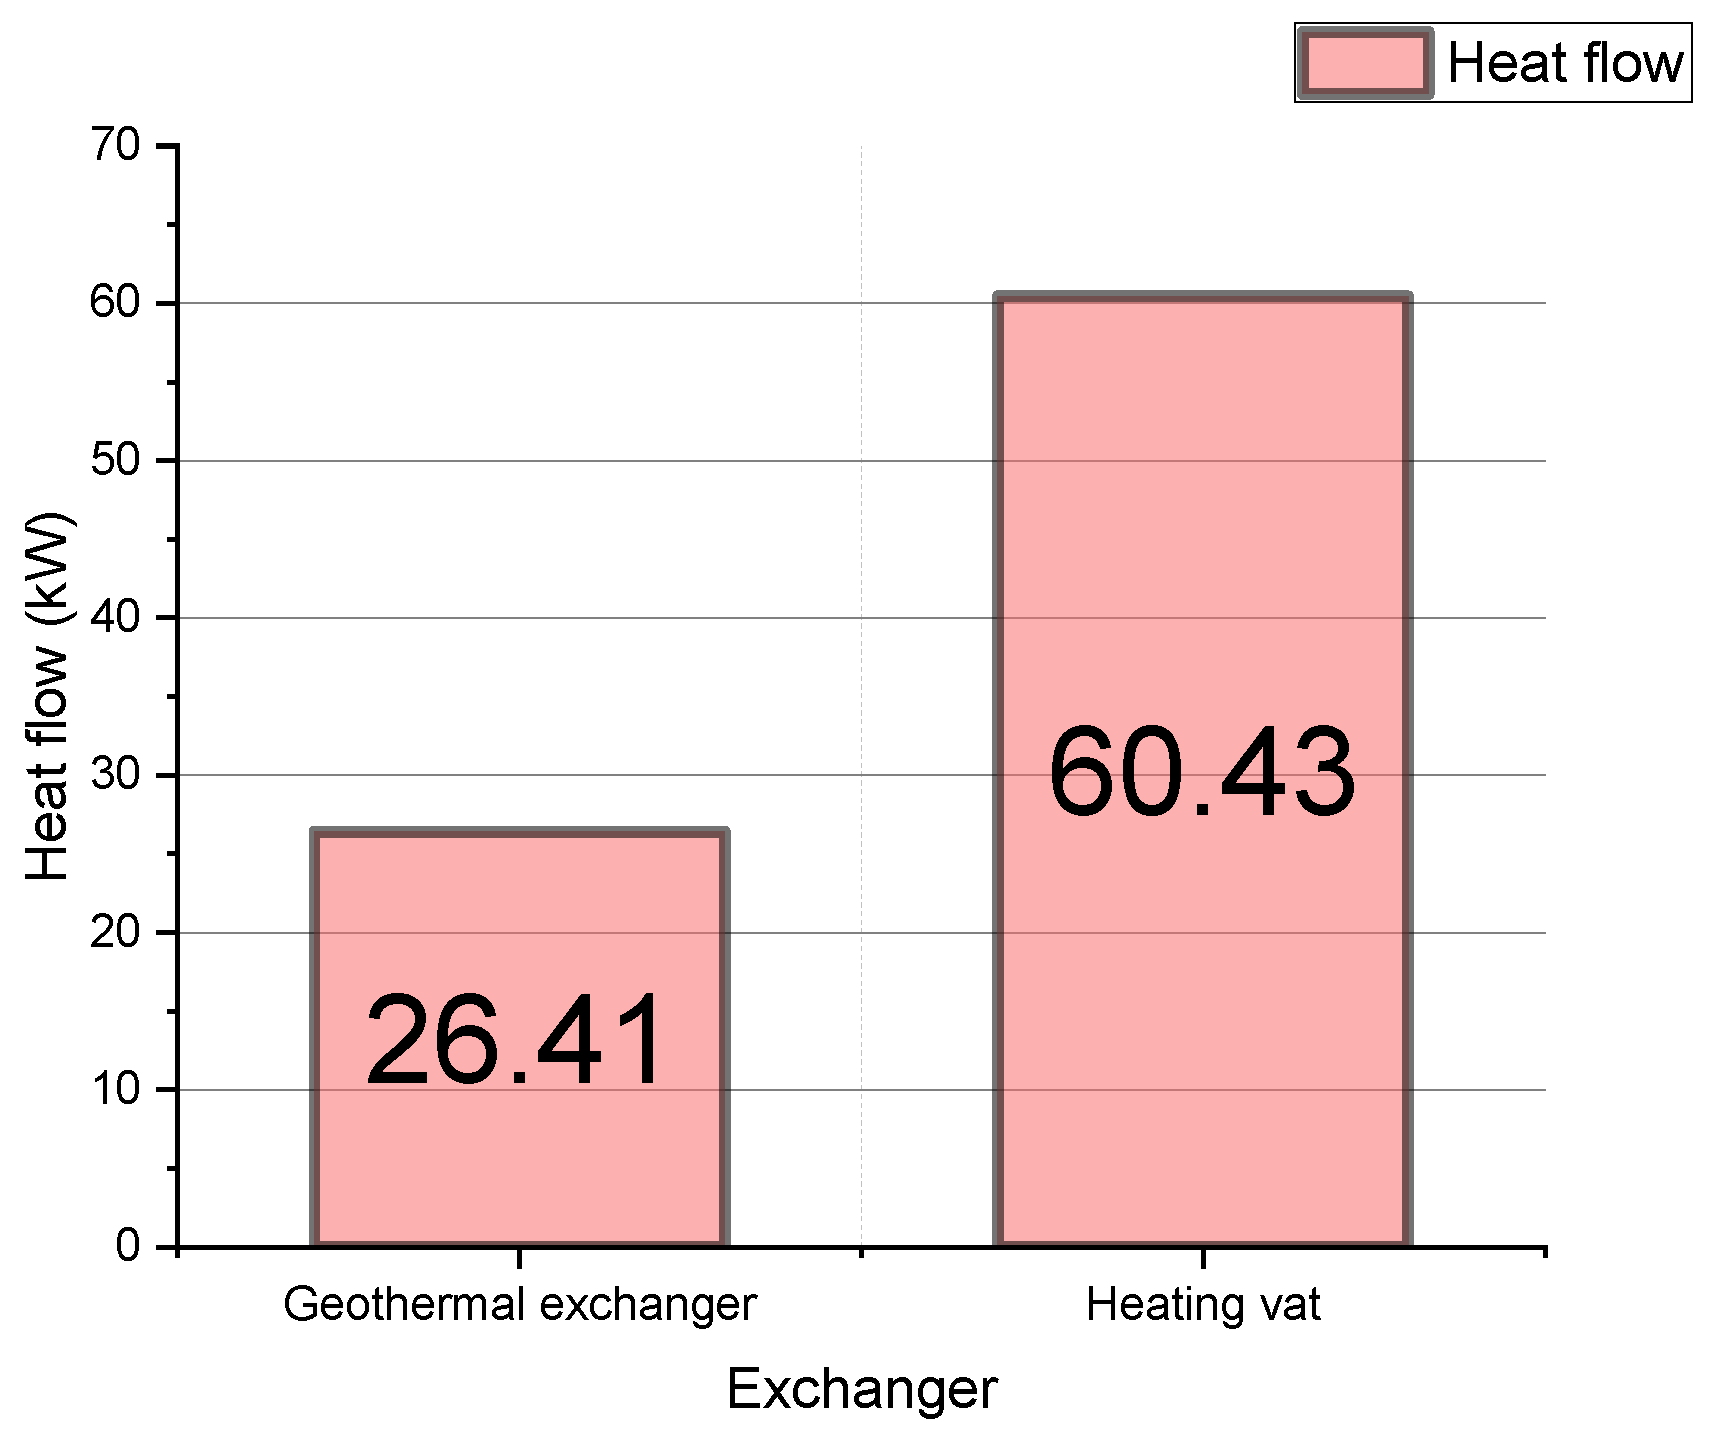
The LMTD method obtains the heat transfer area for the heat exchanger design. When the pipe diameter is selected, the total length needed in the exchanger tube is known. The design and analysis results of the geothermal heat exchanger are shown in Table 8. The Reynolds number determines that the type of flow inside the exchanger is turbulent because it is above 10,000 and, together with the Prandtl number value (0.8496), they are within the acceptable range to apply the Gnielinski equation to obtain the Nusselt number. The heat transfer area of the exchanger turns out to be only 6.773 m2 due to the small magnitude of the heat flow; this translates to the length L being 72.44 m for the 1-inch U-tube. In medium enthalpy geothermal wells, the typical length values are from 50 to 150 depth meters; therefore, this result is between these typical values [70].

4.1.4. Heating Vat

The heat flow required in the heating vat, Q ˙ T U B , resulted in a value of 60.43 kW. The value was obtained from a 127.1 °C temperature change, with a 5.6 °C/MPa Joule–Thomson coefficient [71]. This value is higher than required in geothermal preheating because this is the stage where the Joule–Thomson effect occurs. That is how much heat is needed to maintain the natural gas temperature to avoid freezing. The percentage of gas used as fuel to warm the heating vat water is obtained with the heating vat heat flow. The result shows that only 2.046% of the total station flow is required to counter the Joule–Thomson effect. This value reflects a significant saving because other traditional systems use up to 5% of the stations’ fuel [21]. Figure 7 shows both obtained heat flows; it is observed that the heating vat heat flow is 228% larger than the geothermal heat exchanger heat flow. This proportion is kept this way due to the high drilling costs of geothermal wells and is better illustrated in exergoeconomics results.

4.2. Exergetic Analysis Results

Table 9 shows the results of all system mass flows and exergy flows. In the natural gas output mass flows from the vortex tube, it is appreciated that the hot mass flow is equivalent to 42.78% of the cold gas flow. According to the configuration of the vortex tube and the operating parameters, the natural gas reaches a cold flow temperature of 5 °C and a hot flow temperature of 55 °C. At the heating vat, the outlet temperature of the natural gas is lower than the inlet temperature, even though there is heat transfer in the exchanger to the natural gas; this is due to the decrease in the temperature caused by the natural gas expansion. Hence, the objective of the heat flow in the vat is not to increase the outlet temperature but to keep the natural gas temperature at a constant value of 20 °C. There is a temperature difference of 37 °C between the water inlet and outlet in the heating vat, with a water mass flow equivalent to 225.2% of the total natural gas flow in the station.
On the other hand, it is observed that the value of the exergy flow is higher at the entrance of the system in the vortex tube due to the high pressure of the natural gas. The second flow with the most exergy is the outlet flow from the mixing chamber towards the heating vat. This result indicates that a good quantity of exergy is available to produce work in this phase. The lowest exergy flow of the natural gas is obtained in the heating vat entrance, equivalent to 3.23% of the exergy flow at the system entrance.
Additionally, if a variation in the volumetric flow from 200 m 3 / h to 380 m 3 / h r at the station entrance is considered, there will be a variation in the exergy flows. Considering this variation, the exergy flows at Thermodynamic States 7 and 8 will vary from 1 to 2 kW. The exergy flows at the Thermodynamic States 2, 6, and 9 will have a wider variation of 10 to 20 kW. Flows 1, 3, 4, and 5 will be the ones that have the most changes in their value due to volumetric flow variation, with changes up to 85 kW. The exergy flows at the station input and heating vat input are highlighted because both use the station’s total natural gas volumetric flow at their respective stages. Figure 8 shows all exergy flows in the station and their variation due to volumetric flow variation at the entrance of the decompressing station.
The magnitude of the exergy destruction in each piece of system equipment and the total exergy destruction are shown in Table 10. It is observed that the equipment with the most exergy destruction is the heating vat (114.8 kW), followed by the burner (56.01 kW) and the mixing chamber (41.93 kW). These systems represent the most opportunities to reduce irreversibilities due to exergy destruction in the station. Oppositely, the vortex tube and the geothermal heat exchanger represent only 3.4% of the total exergy destruction in the station.
Moreover, the exergy destruction of the system equipment varies when the natural gas volumetric flow changes. This variation is due to the changes in the exergetic flows. The piece of equipment where a more significant change is observed is in the heating vat, with an increase of 70 kW. The exergy destruction augmentation is minor but considerable in the burner and the mixing chamber, with an exergy destruction variation of 32 kW. The exergy destruction in the vortex tube and the geothermal heat exchanger slightly increases, with a maximum variation in exergy destruction in these systems of just under 3 kW. Figure 9 shows the behavior of exergy destruction in all systems when the volumetric flow of natural gas increases or decreases.

4.3. Exergoeconomic Analysis Results

With the cost balance and the auxiliary equations, all the decompressing station flows’ unitary cost and cost rates are obtained in USD/GJ and USD/h, respectively. Figure 10 shows the unitary cost of every flow compared to its cost rate. These results show that the higher unitary cost is at the hot water flow in the heating vat (Thermodynamic State 7) with a 263.9 USD/GJ cost; it is higher because the heat transfer process is expensive due to all the processes it goes through to increase the natural gas temperature above the hydrate formation point. The highest cost rate is observed at the gas outlet in the heating vat, with a 20.96 USD/h cost. The heat flow from the ground to the system does not have a cost due to energy already being presented naturally; this shows a value of zero for both the unitary cost and the cost rate for Thermodynamic State 10.
Once all the unitary costs and cost rates are obtained, a thermoeconomic assessment is performed for each piece of equipment to develop the complete station analysis. These results describe how efficient the equipment is, in exergoeconomics terms, measure the unitary cost of fuels and products, and quantify their difference and performance. A similar unitary fuel and product cost is obtained for the vortex tube, 7.796 and 7.948 USD/GJ, respectively. This value similarity indicates an appropriate fuel/product transformation process in this system. The equipment with the higher unitary product cost is the geothermal heat exchanger, with a 5490 USD/GJ cost; this is due to the drilling costs. Its fuel cost is zero. The fuel and product costs of the mixing chamber are 38.9 USD/GJ and 31.7 USD/GJ, respectively, with only a 24% difference between both costs. The heating vat is the equipment that has the highest unitary fuel cost, with a value of 39.9 USD/GJ; meanwhile, it has the third highest unitary product cost. These results show that the product cost is 5.33 times the fuel cost. The burner is the system with a more considerable difference between the fuel cost (264 USD/GJ) and the product cost (7.8 USD/GJ), with a product cost 33.84 times bigger than its fuel cost. The results of all unitary costs are shown in Figure 11 and Figure 12.
Regarding the cost rates, the cost per hour of geothermal preheating is very high compared to the rest of the equipment due to the drilling of the geothermal well being the most expensive process of the system, costing 11.7 USD/h. The second piece of equipment with the highest cost rate is the burner. However, that cost is vastly lower than the geothermal well cost, with a cost rate of 2.5 USD/h. Thanks to the geothermal preheating, the cost rate at the heating vat is 1.06 USD/h, which is 11.03 times lower than the geothermal heat exchanger. Also, the heating vat’s cost rate is 42.4% lower than the cost rate of the burner, being the third equipment with the lowest cost rate. Lastly, the vortex tube and the mixing chamber cost less than 0.03 USD/h. Both pieces of equipment represent only 0.601% of the total cost rate of the system equipment. These results are observed in Figure 13.
Moreover, the components with the most significant cost rates derived from exergy destruction are the heating vat, the mixing chamber, and the burner (see Table 11). In all three cases, searching for new alternatives to reduce the exergy destruction costs is possible. The high cost of the exergy destruction at the heating vat (16.07 USD/h) can be attributed to the expansion of the natural gas. Thus, given that decompressed natural gas is the objective of the decompressing station, the cost rate associated with exergy destruction in this component is the highest because this is the equipment with the output of the main product of the system. Some authors have implemented a turbine at this stage and take advantage of the energy release in the expansion process [21]. This option has some problems since the turbine would need to be immersed in the vat and, depending on dimensions, may require a bigger one. This alternative is not covered further in this work, but the possibility of exploring it in the future is a recommendation from the authors. Also, the mixing chamber is another component with a high cost derived from exergy destruction, 4.759 USD/h. This cost rate is principally due to the combination of the mass flows from the vortex tube hot outlet and the geothermal preheating outlets in the mixing chamber. Table 11 also shows the relative cost difference. The equipment with the most significant relative cost difference is the burner. In this equipment, the cost difference between the fuel and the product is vast; consequently, it represents the most prominent improvement area to reduce the transformation cost between the fuel and the product. Moreover, the heating vat is another component that shows a high relative cost difference (447%). In this direction, the heating vat is also a component where it is necessary to focus on improving the thermoeconomic performance of the decompressing station. Both the vortex tube and the mixing chamber have a low relative cost difference of 1.955% and 0.3955%, respectively, owing to both components having similar values between their fuel and product.
If the destroyed exergy varies with the volumetric flow, the cost of the exergy destruction also varies. In the vortex tube, the cost remains almost equal with a variation of less than 0.2 USD/h. The burner’s and mixing chamber’s destruction exergy costs slightly increase as the volumetric flow increases, with an augmentation of up to 1 USD/h. In the heating vat, the cost increases noticeably up to 4 USD/h, representing an increase of 28.77%. This increase in one year of operation means a rise of approximately USD 26,600 in the exergy destruction cost (considering the 6650 operation hours per year described in Section 4) of the station. The results also show that the component with the highest increase in its exergy destruction cost is the heating vat, representing 64.51% of the total increase in the exergy destruction cost. By contrast, the exergy destruction cost increment in the vortex tube represents only 3.22% of the station’s total exergy destruction cost. Figure 14 shows the change in the exergy destruction cost in the system depending on the volumetric flow that enters the decompressing station.
Figure 15 shows the exergoeconomic factor for all decompression station systems. It is observed that the geothermal heat exchanger exergoeconomic factor is 100%. This value indicates that the exchanger is efficient because there is no cost implication due to thermodynamic irreversibilities. The vortex tube and the burner have an exergoeconomic factor of 40.52% and 40.31%, respectively; therefore, there is some space for improving the resource usage in these components. A 7.875% exergoeconomic factor is obtained in the mixing chamber; hence, there is a field to increase its performance due to its value being five times lower than the vortex tube and burner factor. The objectives of this work do not focus on this specific component, but its exergoeconomic factor can be raised with a deeper study. In the heating vat, the exergoeconomic factor is only 0.383%. This value confirms that the heating vat is the decompressing station component with a considerable improvement area to raise its thermoeconomic performance.

Deviations Considering Real Conditions

Using the efficiencies presented in Section 3.1.1, the deviation of the principal parameters of the stations is obtained. The most significant variation is the exergy destruction, with an increase of 18.68% with the real conditions; this is expected due to entropy generation on the system. The natural gas cost increases by 3.29% which does not seem a large change, but it still reflects an increase in the cost. The exergy efficiency drops by 1.45%, which is expected using real conditions. These results are shown in Table 12.

4.4. System Optimization Results

The optimization process results show the optimized value of the decision variables: the natural gas exit cost ( c 6 ) and the total exergy destruction ( E ˙ D , T ). By varying the exergy flows in the system, besides the total exergy destruction cost changes, there are also changes in all flow costs; that is why separated optimizations are conducted. The values for both the heating vat entrance and geothermal well temperatures are presented in Figure 16. From the figure, it is observed that when natural gas cost optimization is performed, both temperatures increase from their original values of 62 °C and 120 °C, respectively, to an 80 °C temperature for the water at the heating vat and a 150 °C temperature for the geothermal well, which represent an increase of 29.03% in the heating vat water temperature and an increase of 25% in the geothermal well temperature. Due to this temperature rise, more energy will be available; therefore, the exchangers will require less heating transfer area and the equipment cost will decrease. By contrast, the temperature value for the geothermal well decreases to 80 °C in the exergy destruction optimization, which translates to a 33.33% temperature reduction. The vat temperature is not a relevant variable for the exergy destruction optimization, so it is not modified, maintaining its original value (120 °C).
Table 13 shows the value of the cold and hot flow percentages in the vortex tube for both optimization cases, as well as the volumetric flow of the station. For the natural gas cost optimization, the lower the flow at the geothermal heat exchanger, the lower the component cost will be; hence, the value of the cold flow outlet at the vortex tube decreases from 70% to 65% of the total flow. Also, it is determined that in the exergy destruction optimization case, the cold flow in the vortex tube rises to 73%. The volumetric flow, initially established at 300 m 3 / h , increases by 26.66% to a value of 380 m 3 / h in the natural gas cost optimization process; this is due to the station working with a higher volumetric flow having a better profitability, obtaining a large amount of decompressed natural gas with a lower cost per unit. On the other hand, for the exergy destruction optimization process, the volumetric flow decreases one-third of the original value to 200 m 3 / h .
When the proper value of the variables is established, an optimized value of 179.4 USD/GJ for the natural gas cost at the heating vat exit is obtained, in comparison with the 212.9 USD/GJ cost of the original configuration, achieving an optimization of 15.73% of the final cost. The results are shown in Figure 17.
By contrast, when the exergy destruction is optimized, a decrease of 79.7 kW is achieved, going from 220.5 kW to only 140.8 kW, which represents a reduction of 36.14% in the exergy destruction of the system. Also, all of the system components present a decrease in their exergy destruction mainly due to the lower flow amount in the system. The component that has the highest exergy destruction percentage reduction is the geothermal heat exchanger due to its increase in thermal load, utilizing more available energy. The exergy destruction changes in the system are shown in Figure 18.

5. Conclusions

With the implemented analyses, it was determined that it is possible to counteract the Joule–Thomson effect in the natural gas decompressing station by implementing a geothermal preheating phase and a vortex tube. The main results are listed below:
  • From the energy analysis: A 69.07 kW heat flow in the heating vat and 26.28 kW heat flow in the geothermal heat exchanger are obtained. Also, the water flow needed in the heating vat is 0.3905 kg/s, meaning that 2.046% of the station’s natural gas is used for the preheating process compared to other systems that use up to 5%;
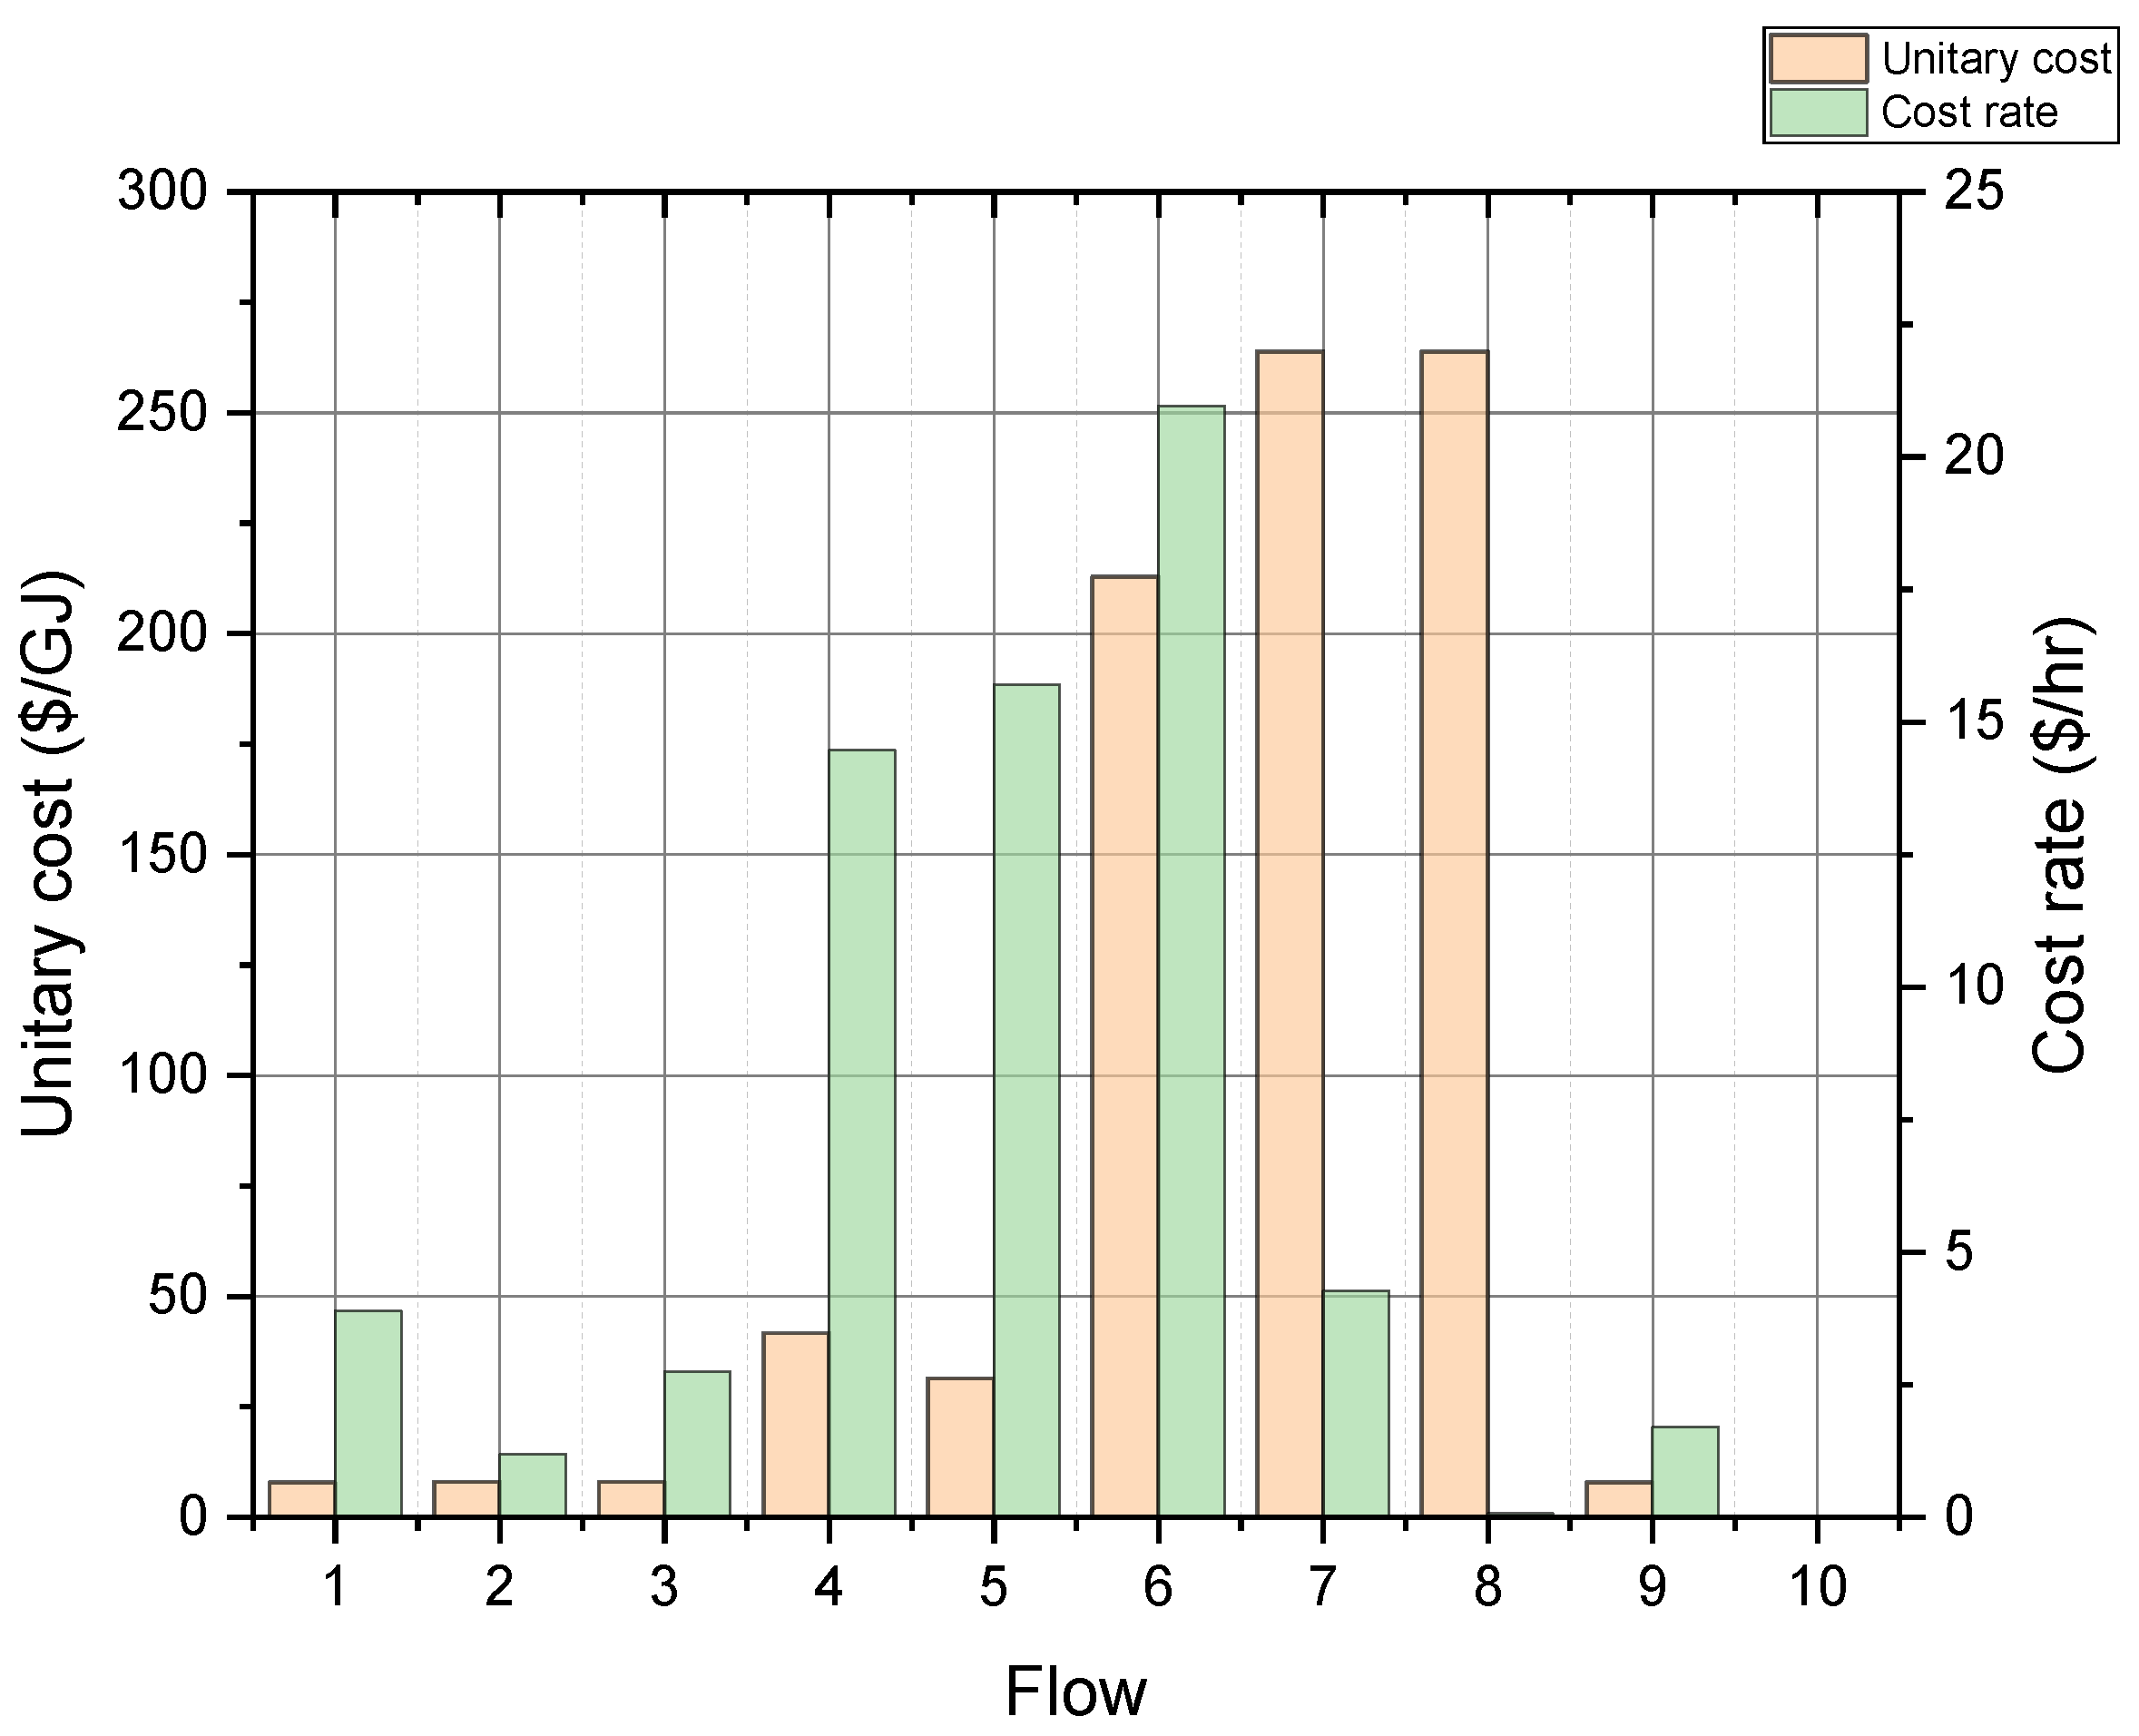
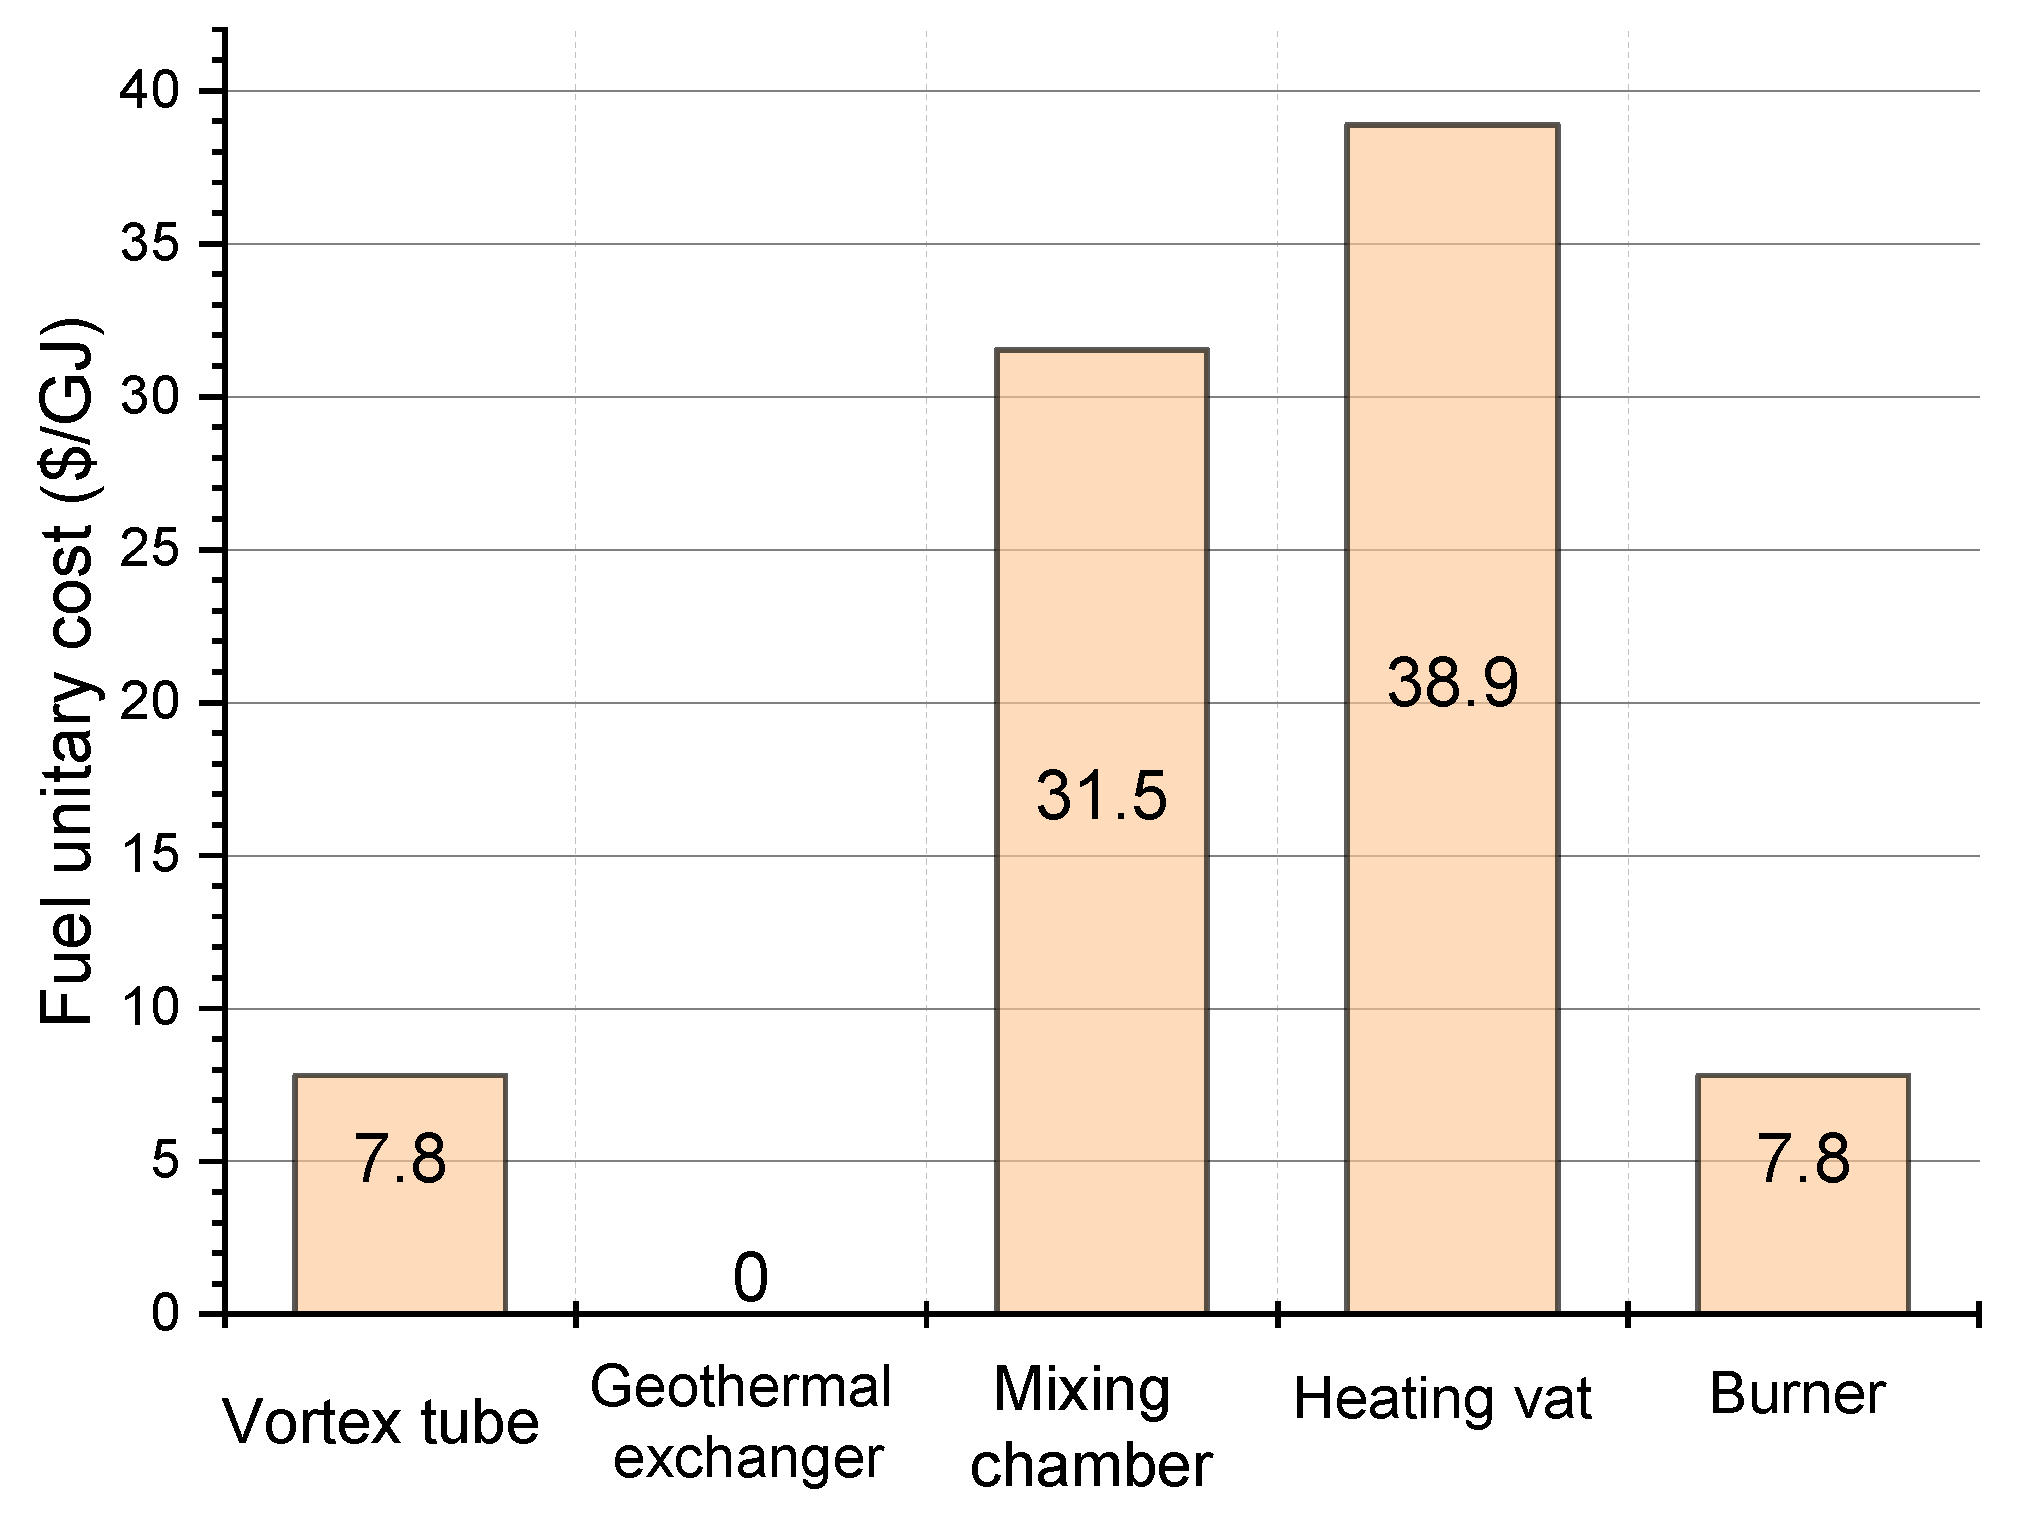
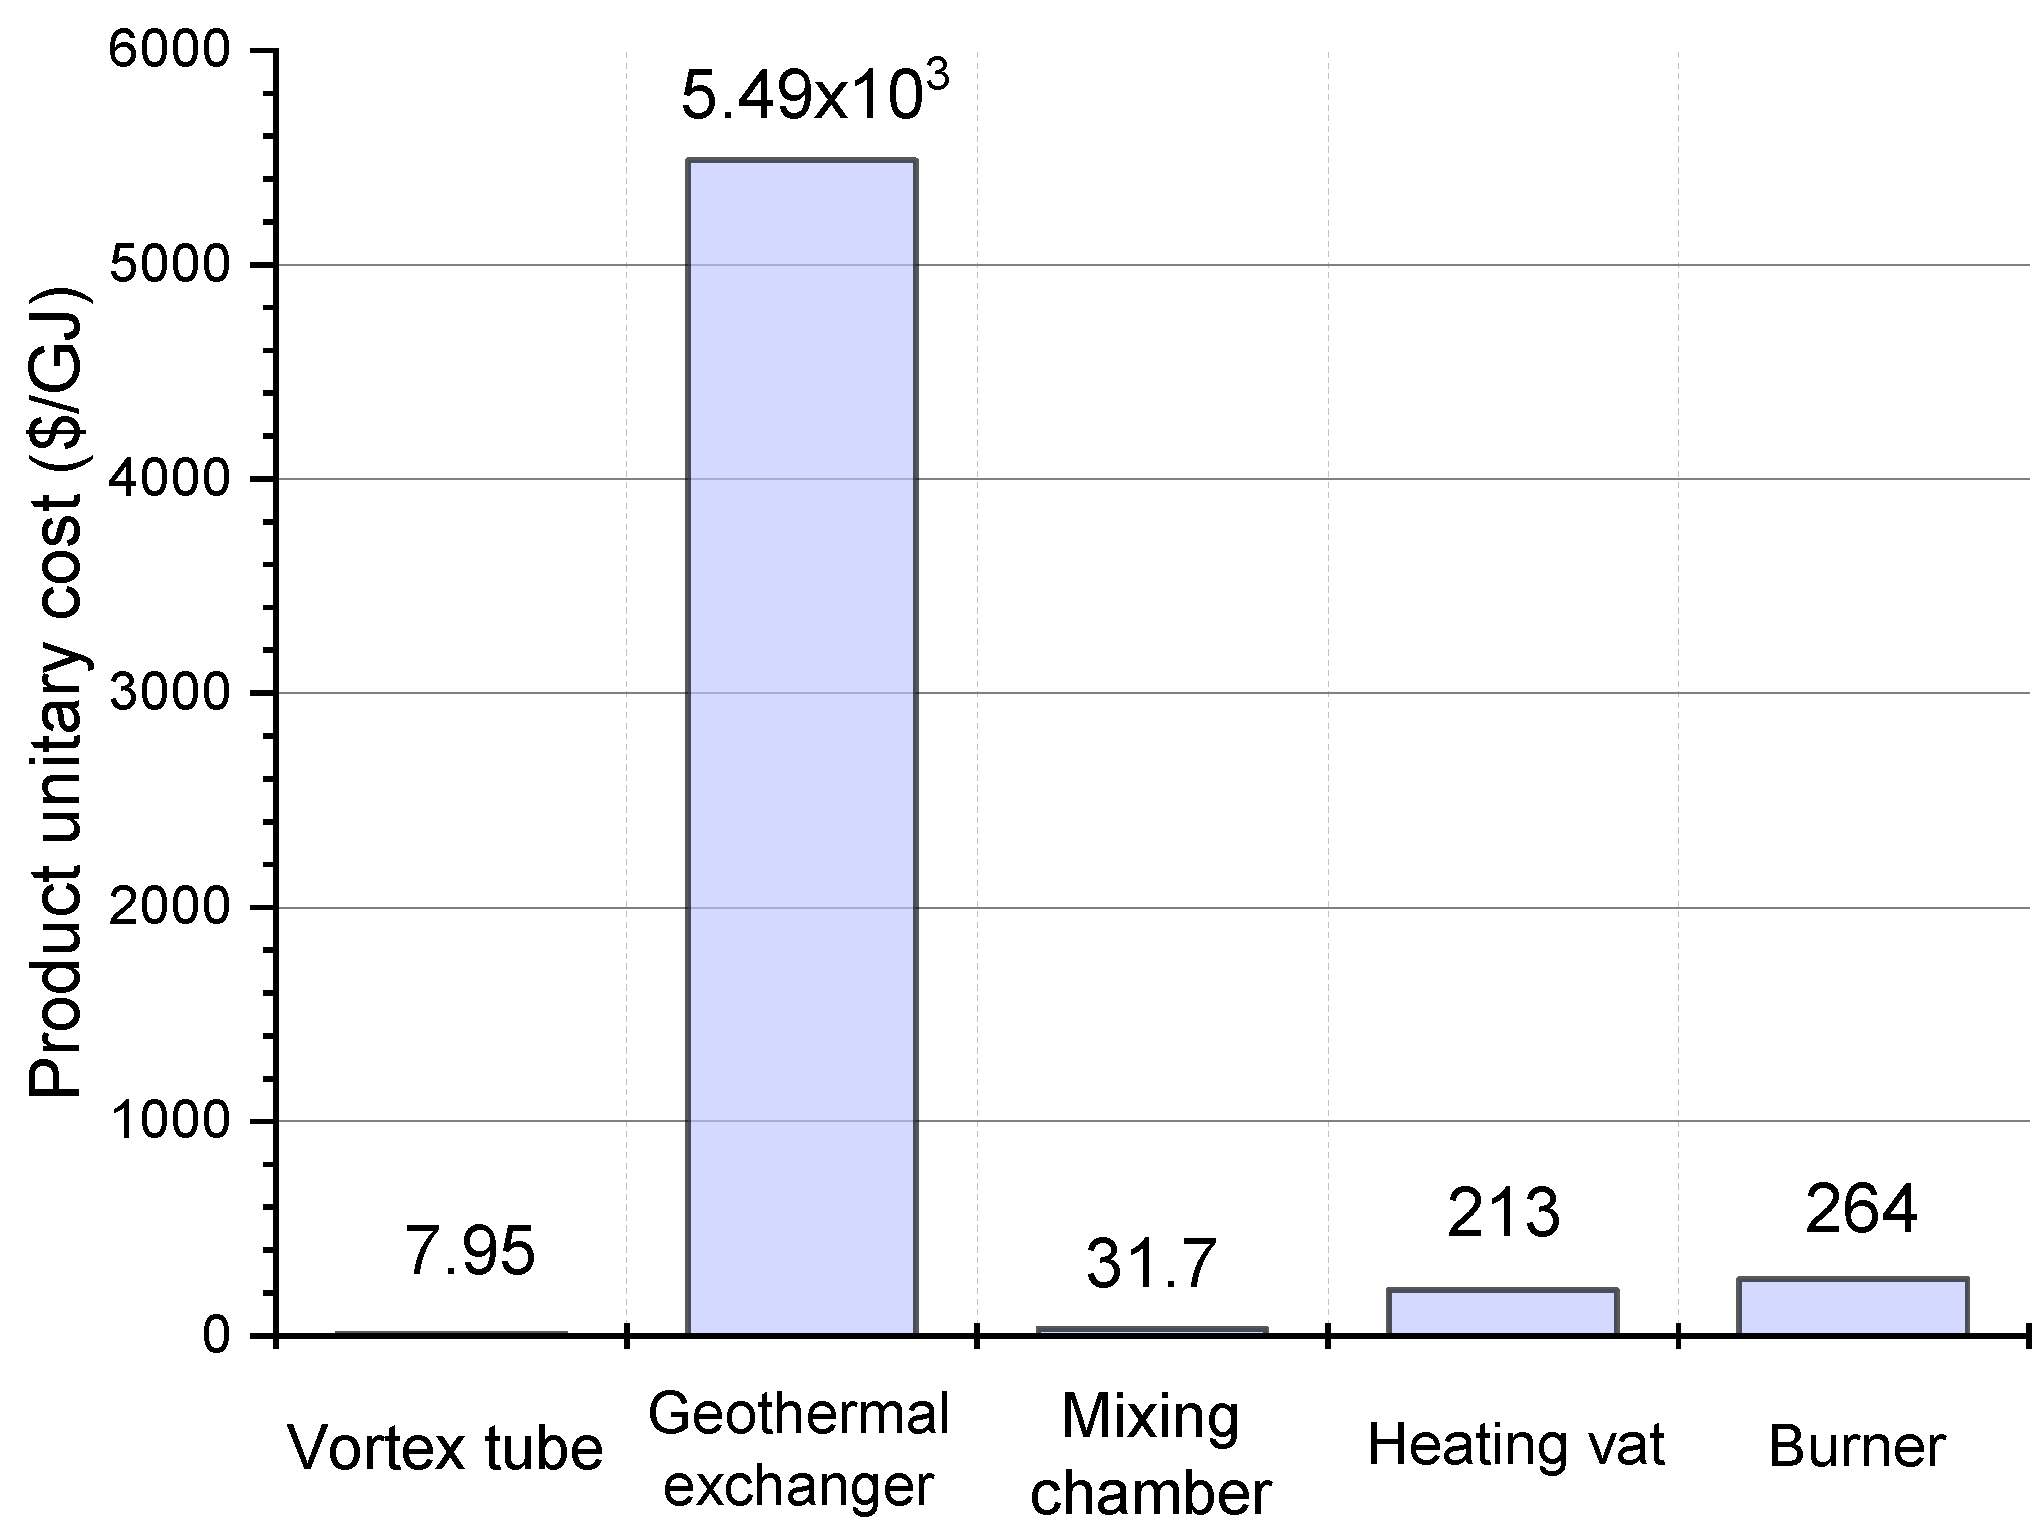
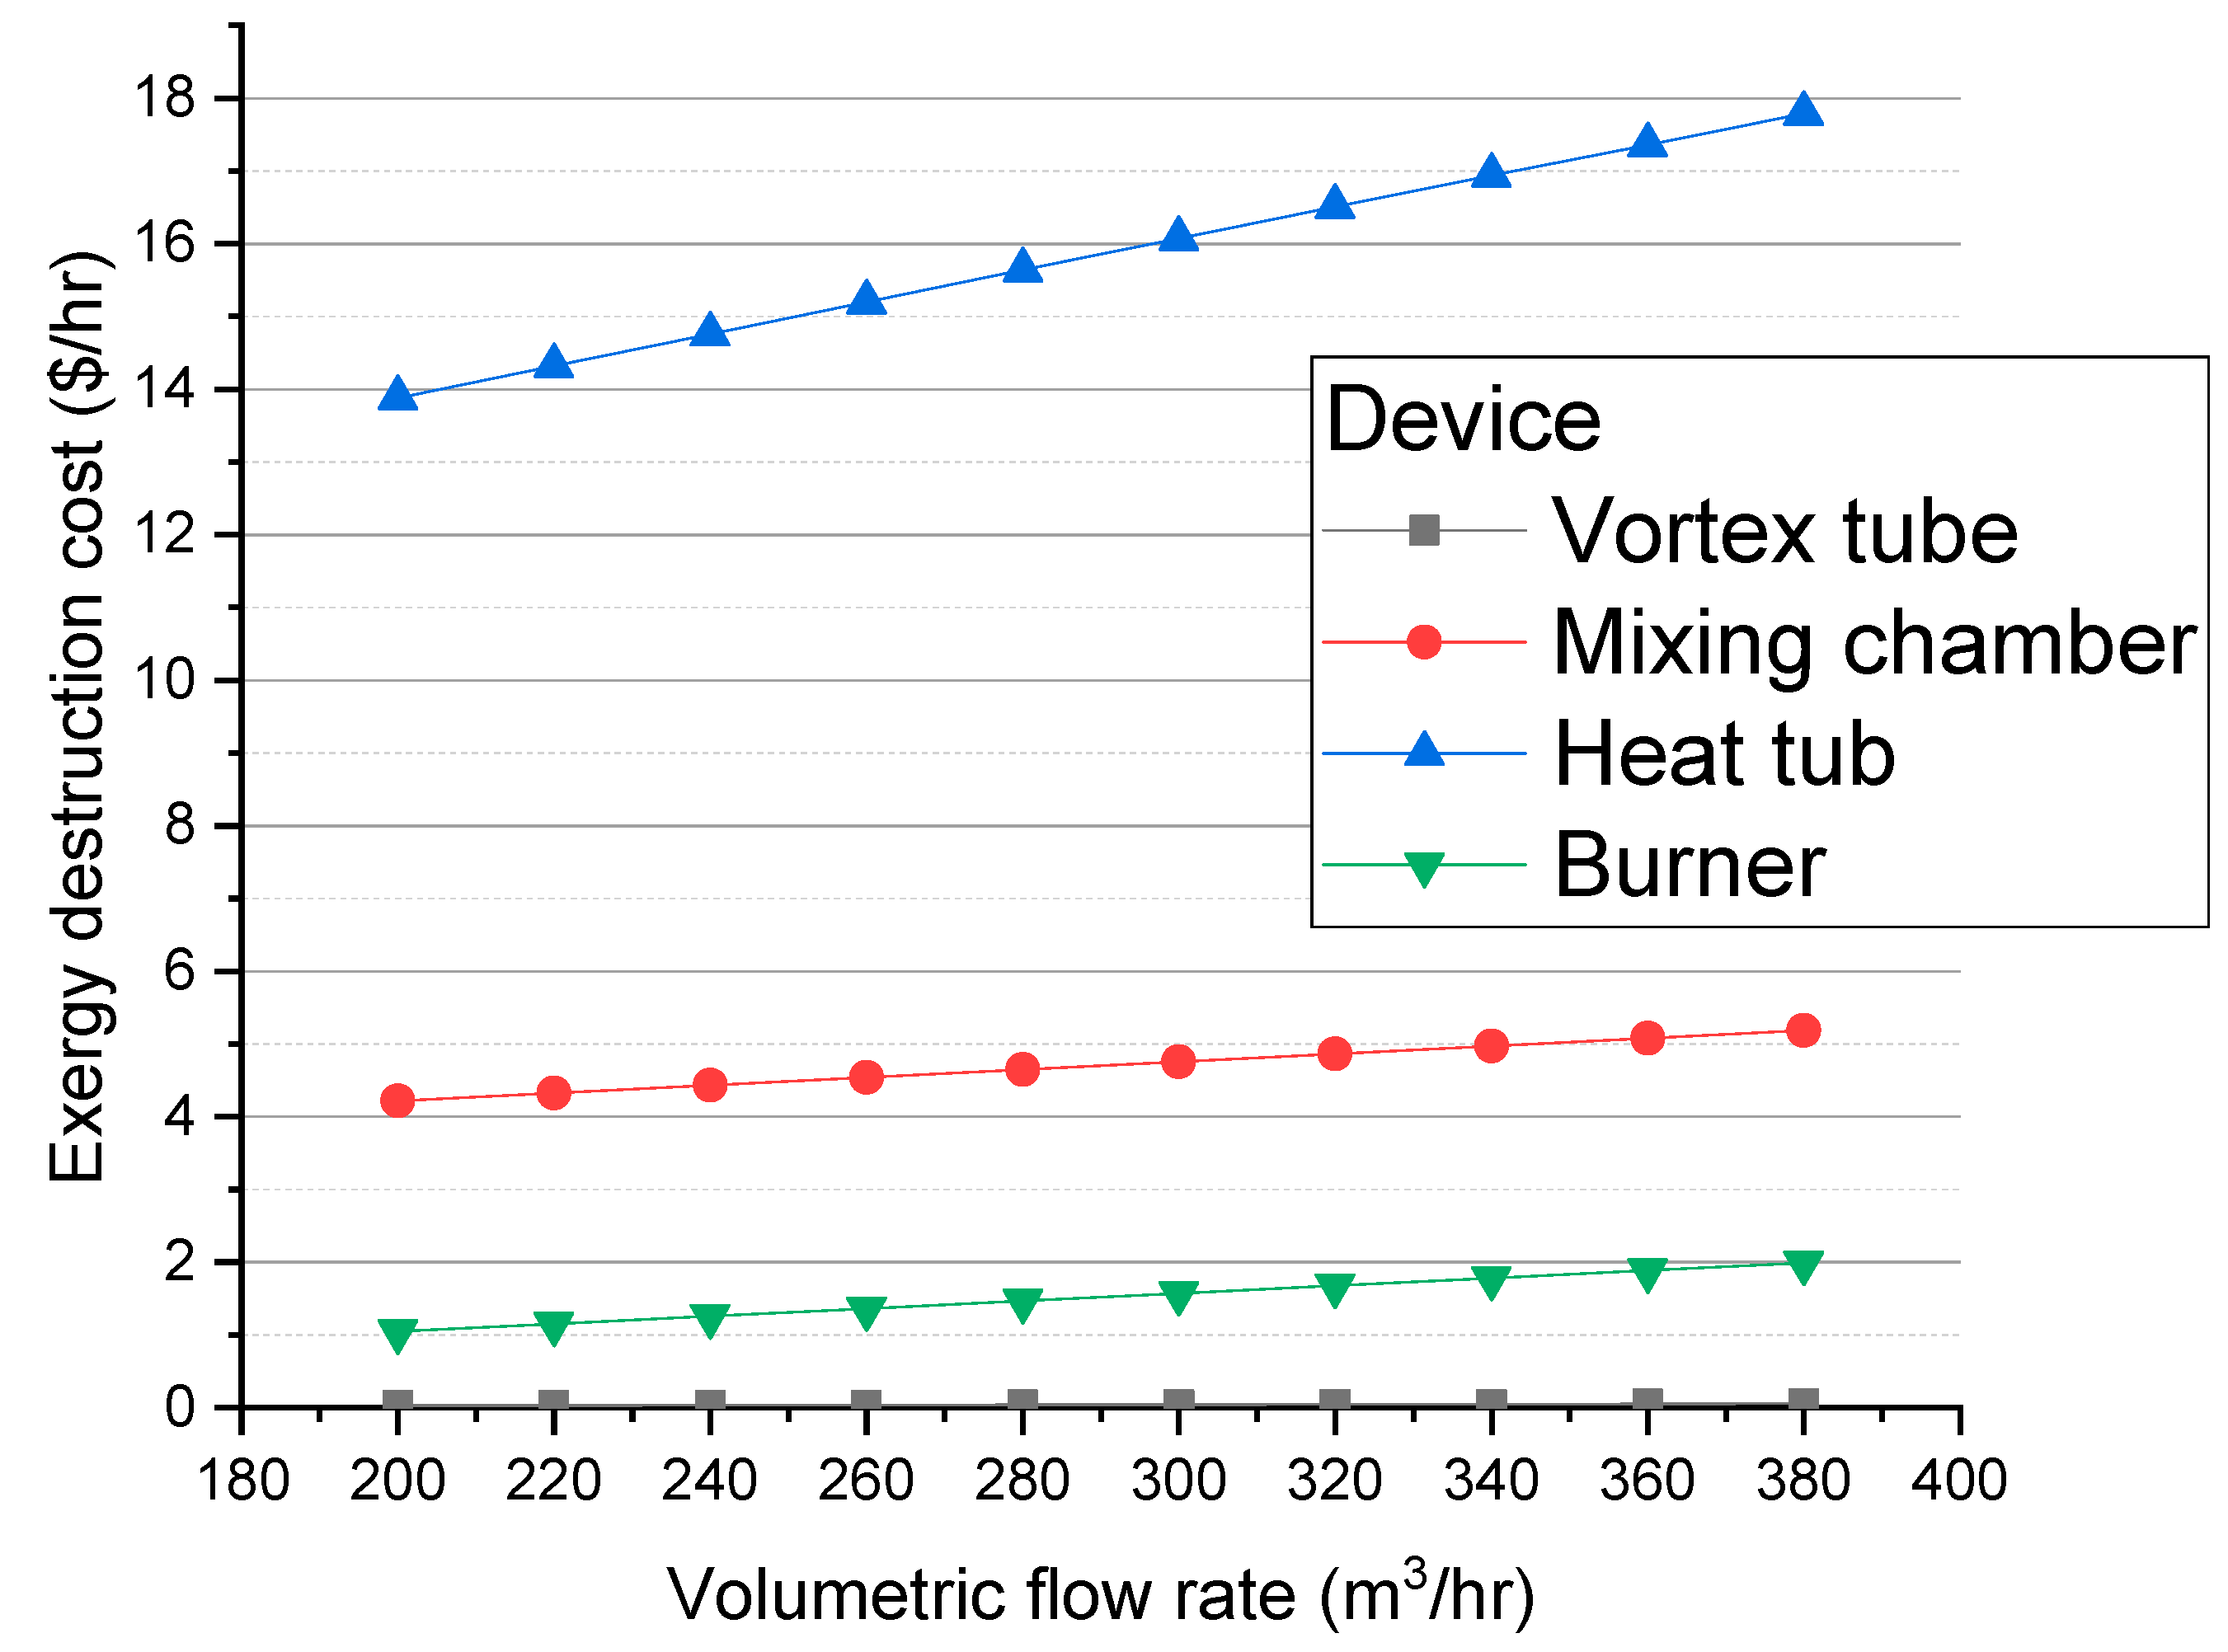
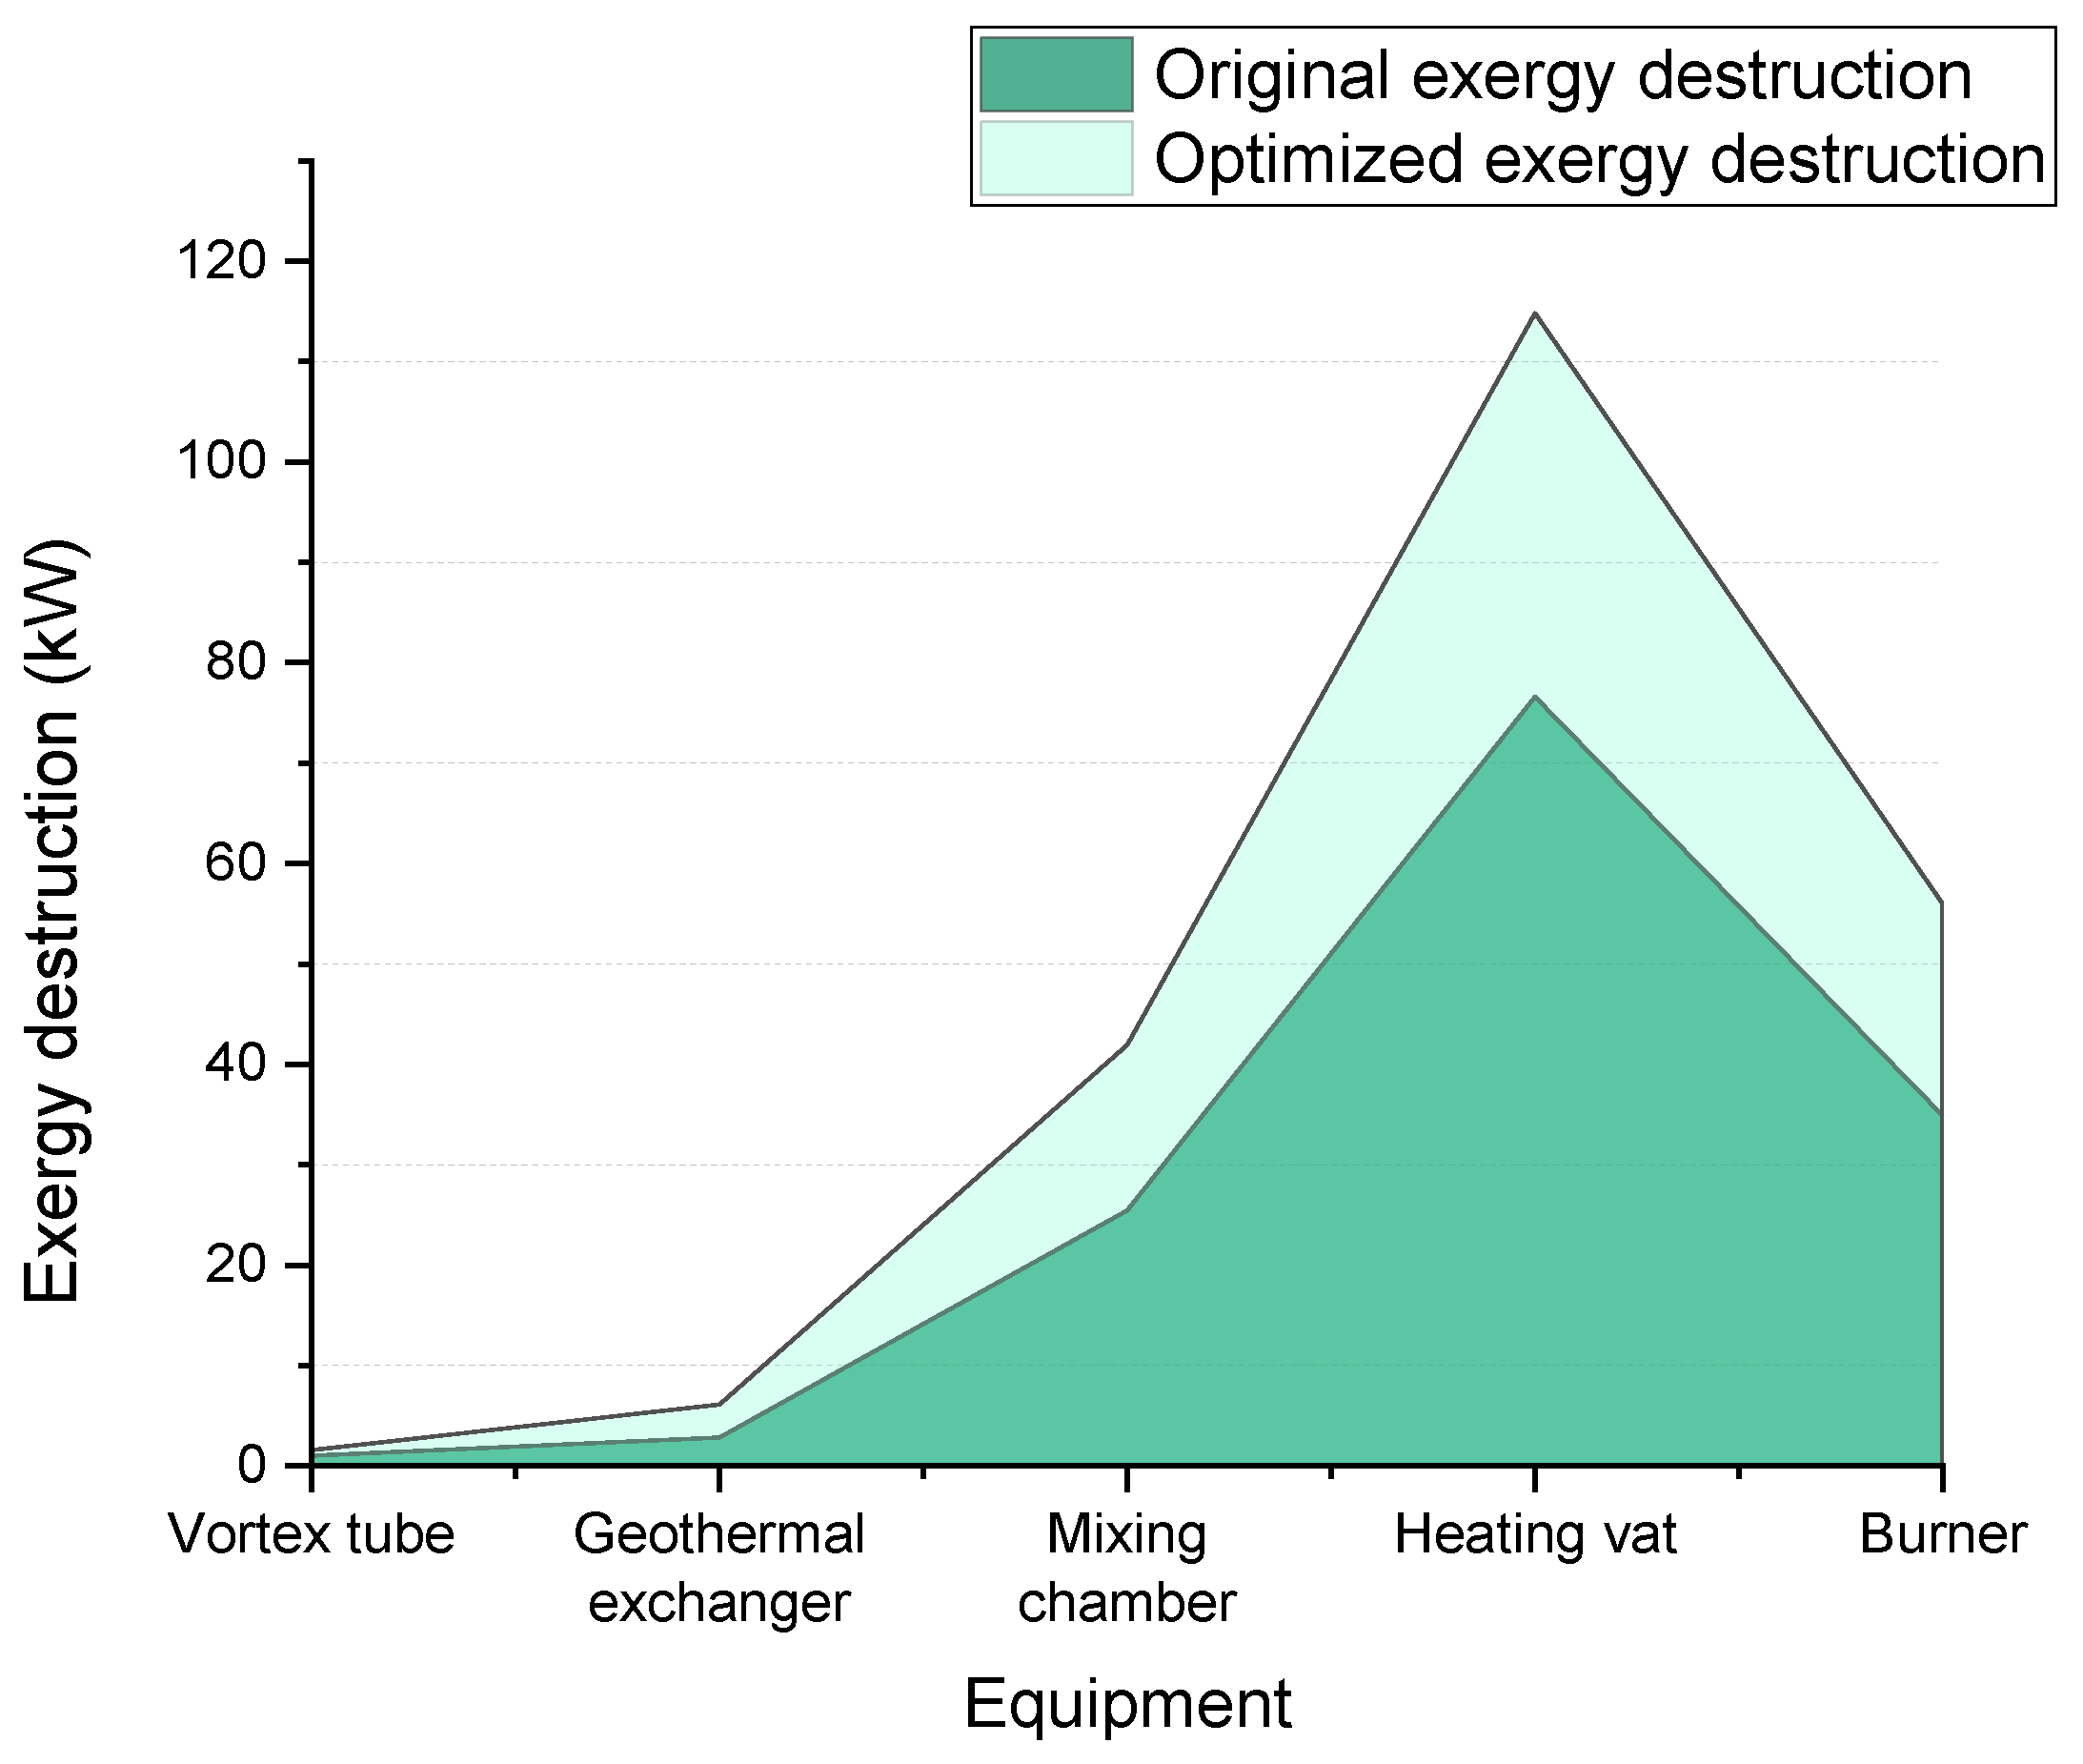
  • From the exergy and exergoeconomic analysis: All component and flow costs in the system, as well as the exergoeconomics performance and the exergy destruction, are obtained, highlighting that the component with the most fuel cost is the heating vat (39.9 USD/GJ), and a natural gas exit cost of 212.9 USD/GJ. The component with the highest cost rate is the geothermal exchanger (11.7 USD/h). The vortex tube is the equipment with the lowest cost rate (0.03 USD/h). The heating vat is the equipment with the most significant amount of exergy destruction, with a cost of 16.7 USD/h which increases to USD 17.85 when the volumetric flow of the station augments from 300 m 3 / h   to 380 m 3 / h . Also, it is remarked that the heating vat and the mixing chamber are the components with the smaller exergoeconomic factor, with a value of 0.3834% and 7.976%, respectively;
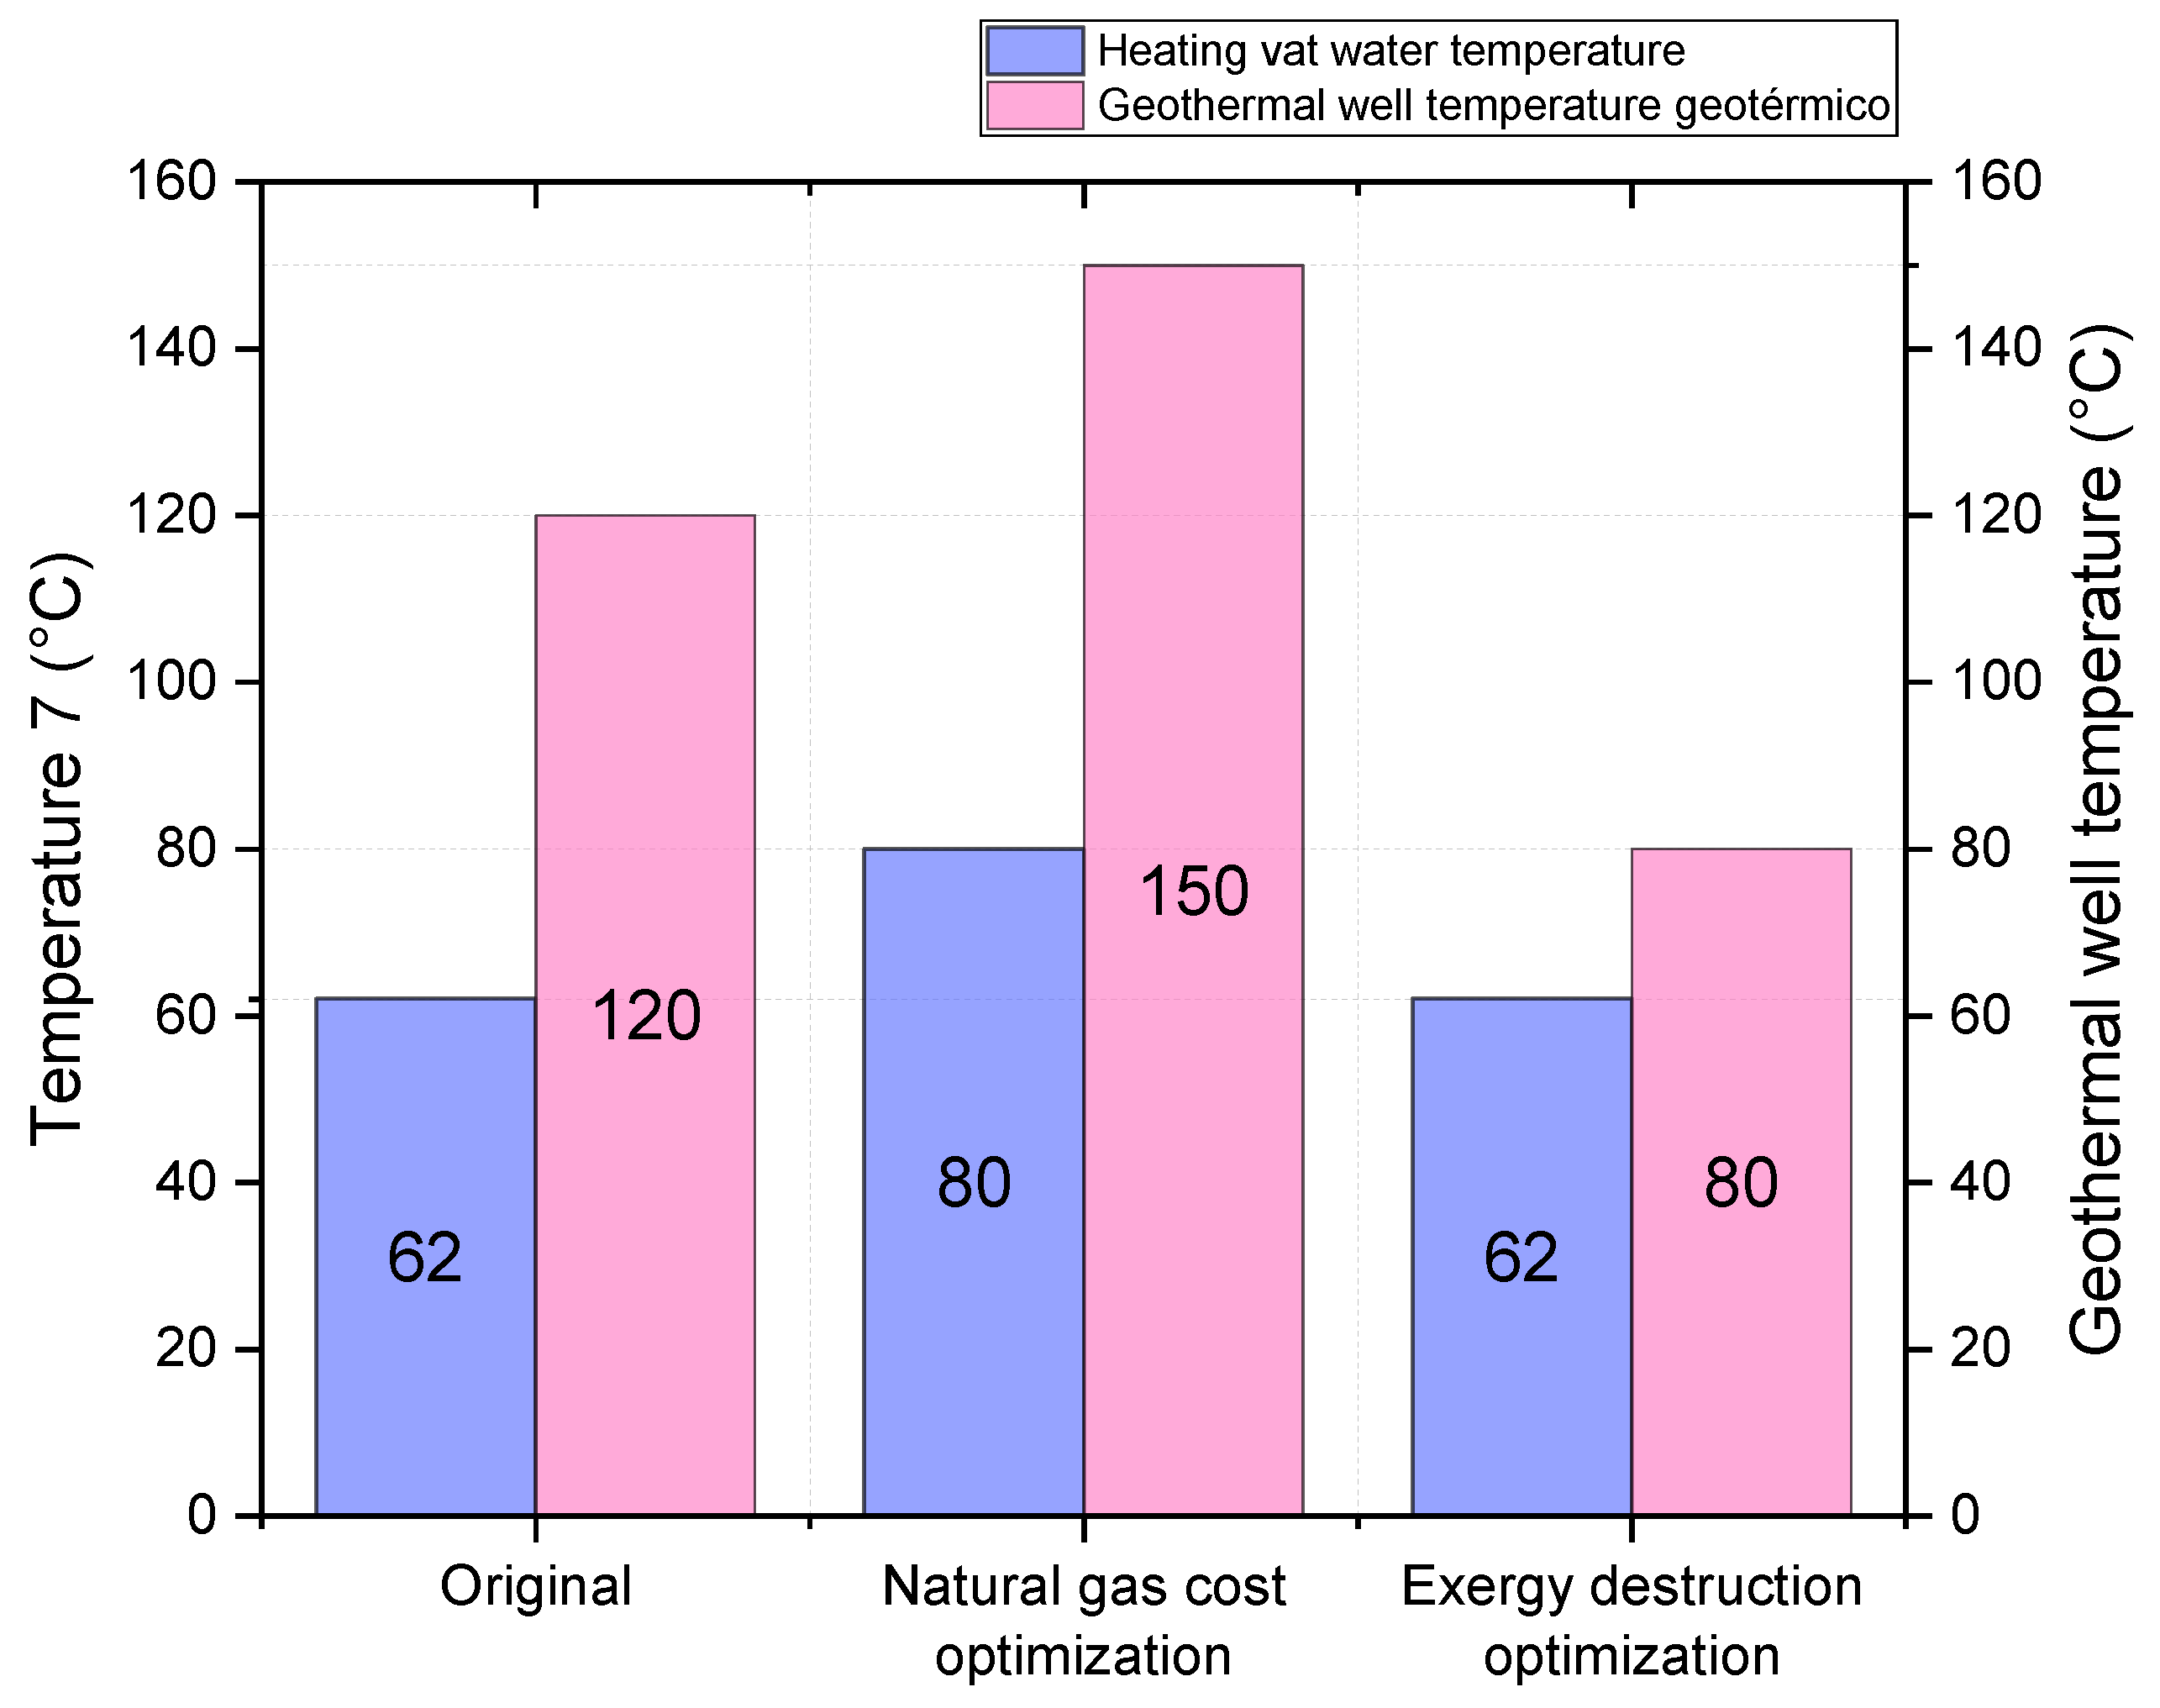
  • From the optimization: It is possible to reduce natural gas costs by raising the heating vat water temperature by 29.03% and the volumetric flow of natural gas at the entrance by 26.66% and modifying the hot and cold flow percentage at the vortex tube outlets from a 70/30 relation to a 65/25 relation. A final cost of 179.4 USD/GJ for the natural gas was obtained, which means a cost reduction of 15.73%.
The fuel savings due to the vortex tube and the geothermal preheating stage show optimistic results about reducing fuel consumption in the preheating process of natural gas, generating economic savings for users of natural gas decompressing stations.

Author Contributions

Conceptualization, L.F.V.-L., V.M.A.-D. and C.R.-M.; methodology, L.F.V.-L. and V.M.A.-D.; software, L.F.V.-L. and C.R.-M.; validation, C.R.-M., O.C. and I.Y.R.; formal analysis, L.F.V.-L. and V.M.A.-D.; investigation, L.F.V.-L.; resources, O.C. and I.Y.R.; data curation, V.M.A.-D. and C.R.-M.; writing—original draft preparation, L.F.V.-L.; writing—review and editing, V.M.A.-D., C.R.-M., O.C. and I.Y.R.; visualization, C.R.-M.; supervision, V.M.A.-D. and O.C. All authors have read and agreed to the published version of the manuscript.

Funding

This research received no external funding.

Institutional Review Board Statement

Not applicable.

Informed Consent Statement

Not applicable.

Data Availability Statement

The raw data supporting the conclusions of this article will be made available by the authors on request.

Acknowledgments

The authors appreciate the support provided by the Consejo Nacional de Humanidades, Ciencias y Tecnologías (CONAHCYT), the University Michoacana de San Nicolás de Hidalgo (UMSNH), and the National Technological Institute of México (TecNM Campus Chihuahua) for the realization of this research.

Conflicts of Interest

The authors declare no conflicts of interest.

Nomenclature

A Area ( m 2 )
B ˙ Exergy (kW)
C Cost (USD)
C ˙ Exergy cost (USD/s, USD/h)
c Specific exergy (USD/kJ, USD/GJ)
C p Specific heat ( k J / k g · K )
C M Maintenance cost (USD)
C R F Capital recovery factor
C V Calorific value (kJ/kg)
D Diameter ( m )
E D Exergy destruction (kW),
F d Design factor
F p Pressure factor
F m Material factor
f Darcy factor
f k Exergoeconomic factor (%)
g Specific material factor
h Convection heat transfer coefficient ( k W / m 2 · K ) , enthalpy ( k J / k g )
i Interest rate
I A Actual cost index
I 0 Base cost index
K Thermal conductivity ( k W / m · K )
L Length ( m )
L M T D Logarithmic mean temperature difference ( ° C )
M Molar mass ( g / m o l e )
m Mass (kg)
m ˙ Mass Flow rate ( g / s )
m f Mass fraction
N Number of moles (mole)
n Period
N u Nusselt number
P Pressure ( k P a ) , power (kW)
P r Prandtl number
Q ˙ Heat flow ( k W )
R Radius ( m , i n )
r Relative cost difference (%)
R Gas constant ( k J / k g · k ) , radius (m, in)
R u Universal gas constant ( k J / k m o l · k )
R e Reynolds number
T Temperature ° C , K
U Overall heat transfer coefficient ( k W / m 2 · K )
V Volume ( m 3 )
V Specific volume ( m 3 / k g )
V ˙ Volumetric flow ( m 3 / h )
y Molar fraction
Z Compressibility factor
Z ˙ Cost rate (USD/s, USD/h)
% G N Natural gas percentage ( % )
Greek letters
β Form factor
θ Temperature change ( ° C , K )
ϕ Maintenance factor
T Temperature difference ( ° C , K )
P Pressure difference ( k P a )
μ Viscosity ( c P )
μ H Hot fraction
μ C Cold fraction
μ J T Joule–Thomson coefficient ( ° C / M P a )
ρ Density ( k g / m 3 , g / c m 3 )
Subscripts
H Hot
D Exergy destruction
F Fuel
C Cold
G E O Geothermal preheating
N G Natural gas
H 2 O Water
i Iteration
J T Joule–Thomson
k Component
mMixture
P Product
P E R F Perforation
V T Vortex tube
0 Reference condition
1 , , 9 Flow

Appendix A

Appendix A.1

Vortex tube mass and energy balance:
m ˙ 1 = m ˙ 2 + m ˙ 3  
m 1 ˙ h 1 = m ˙ 2 h 2 + m ˙ 3 h 3
Substituting mass balance into energy balance:
( m ˙ 2 + m ˙ 3 ) h 1 = m ˙ 2 h 2 + m ˙ 3 h 3
Hot and cold flow change for the inlet mass flow multiplied a coefficient:
m ˙ 2 = μ H · m ˙ 1  
m ˙ 3 = μ C · m ˙ 1
Substituting Equations (A4) and (A5) in Equation (A3):
( μ H · m ˙ 1 + μ C · m 1 ˙ ) h 1 = ( μ H · m ˙ 1 ) h 2 + ( μ C · m ˙ 1 ) ( h 3 )
Eliminating mass flow and reordering the terms:
μ C ( h 1 h 3 ) = μ H h 2 h 1
Using the specific heat definition and eliminating from both sides the specific heat:
μ C ( T 1 T 3 ) = μ H T 2 T 1

Appendix A.2

The Gnielinski, Reynolds number, Prandtl, and Darcy equations:
N u = f 8 · R e 1000 P r 1 + 12.7 · f 8 0.5 · ( P r 2 3 1 )  
R e = 4 · m ˙ N G π · D · μ N G
P r = μ N G · C p , N G K N G
f = 0.790 ln R e 1.64 2

References

  1. Riva, P.J.; Atwater, G.I.; Solomon, L.H.; Carruthers, J.E.; Waddams, A.L. Natural Gas Types, discovery, Reserves, & Facts. Encyclopedia Britannica. 2023. Available online: https://www.britannica.com/science/natural-gas/Composition-and-properties-of-natural-gas (accessed on 15 November 2023).
  2. Alternative Fuels Data Center: Natural Gas Fuel Basics. Office of Energy Efficiency and Renewable Energy, U.S. Department of Energy. Available online: https://afdc.energy.gov/fuels/natural_gas_basics.html (accessed on 13 October 2023).
  3. Mokhatab, S.; Poe, W.A.; Speight, J.G. Handbook of Natural Gas Transmission and Processing; Gulf Professional Publishing: Burlington, VT, USA, 2006; pp. 1–26. ISBN 0128158174. [Google Scholar]
  4. Wang, X.; Economides, M.J. Advanced Natural Gas Engineering; Gulf Professional Publishing: Houston, TX, USA, 2009; ISBN 9781933762388. [Google Scholar]
  5. Aroussi, A.; Benyahia, F. Proceedings of the 3rd International Gas Processing Symposium: Qatar, March 2012, 2nd ed.; Elsevier: Oxford, UK, 2012; ISBN 9780444594969. [Google Scholar]
  6. Olfati, M.; Bahiraei, M.; Veysi, F. A novel modification on preheating process of natural gas in pressure reduction stations to improve energy consumption, exergy destruction and CO2 emission: Preheating based on real demand. Energy 2019, 173, 598–609. [Google Scholar] [CrossRef]
  7. Romanov, D.; Leiss, B. Geothermal energy at different depths for district heating and cooling of existing and future building stock. Renew. Sustain. Energy Rev. 2022, 167, 112727. [Google Scholar] [CrossRef]
  8. DiPippo, R. Geothermal Power Plants, 4th ed.; Butterworth-Heinemann: Oxford, UK, 2015; ISBN 9780081008799. [Google Scholar]
  9. Llopis Trillo, G.; Angulo, V. Guía de la Energía Geotérmica, Fundación de la Energía de la Comunidad de Madrid. 2008. Available online: https://www.fenercom.com/publicacion/guia-de-la-energia-geotermica-2008/ (accessed on 14 June 2023).
  10. Ma, Y. Deep geothermal resources in China: Potential, distribution, exploitation, and utilization. Energy Geosci. 2023, 4, 100209. [Google Scholar] [CrossRef]
  11. Bamisile, O.; Cai, D.; Adun, H.; Taiwo, M.; Li, J.; Hu, Y.; Huang, Q. Geothermal energy prospect for decarbonization, EWF nexus and energy poverty mitigation in East Africa; the role of hydrogen production. Energy Strategy Rev. 2023, 49, 101157. [Google Scholar] [CrossRef]
  12. Diaz Molina, O.P. Valoración del Potencial Energético Basado en el Recurso Geotérmico de Baja Entalpía en la Isla de Gran Canaria. Master’s Thesis, Universidad de las Palmas de Gran Canaria, Las Palmas de Gran Canaria, Gran Canaria, 2017. [Google Scholar]
  13. Ouyangm, T.; Xie, S.; Tan, J.; Wu, W.; Zhang, M. Optimization of energy-exergy efficiencies of an advanced cold energy utilization system in liquefied natural gas filling station. J. Nat. Gas Sci. Eng. 2021, 95, 104235. [Google Scholar] [CrossRef]
  14. Gajanayake, S.M.; Gamage, R.P.; Li, X.S.; Huppert, H. Natural gas hydrates—Insights into a paradigm-shifting energy resource. Energy Rev. 2023, 2, 100013. [Google Scholar] [CrossRef]
  15. Esmaeilpour, M.; Korzani, M.G.; Kohl, T. Stochastic performance assessment on long-term behavior of multilateral closed deep geothermal systems. Renew. Energy 2023, 208, 26–35. [Google Scholar] [CrossRef]
  16. McClean, A.; Pedersen, O.W. The role of regulation in geothermal energy in the UK. Energy Policy 2023, 173, 113378. [Google Scholar] [CrossRef]
  17. García Contreras, O.; Muñoz Bravo, J.E.; Fajardo, F. Construcción y caracterización de un tubo Ranque-Hilsch. Bras. Ensino Física 2008, 30, 4305.1–4305.5. [Google Scholar] [CrossRef]
  18. Sungur, M.; Elnajjar, E.; Hamdan, M.O.; Al-Omari, S.A.B. A numerical analysis investigation to optimize the performance of the Ranque–Hilsch Vortex tube by changing the internal tapering angle. Int. J. Thermofluids 2023, 20, 100467. [Google Scholar] [CrossRef]
  19. Ghezelbash, R.; Farzaneh-Gord, M.; Sadi, M. Performance assessment of vortex tube and vertical ground heat exchanger in reducing fuel consumption of conventional pressure drop stations. Appl. Therm. Eng. 2016, 102, 213–226. [Google Scholar] [CrossRef]
  20. Bianchi, M.; Branchini, L.; De Pascale, A.; Melino, F.; Orlandini, V.; Peretto, A.; Archetti, D.; Campana, F.; Ferrari, T.; Rossetti, N. Techno-Economic Analysis of ORC in Gas Compression Stations Taking Into Account Actual Operating Conditions. Energy Procedia 2017, 129, 543–550. [Google Scholar] [CrossRef]
  21. Rahman, M.M. Power generation from pressure reduction in the natural. J. Mech. Eng. 2011, 41, 89–95. [Google Scholar] [CrossRef]
  22. Ashouri, E.; Veysi, F.; Schojaeizadeh, E.; Asadi, M. The minimum gas temperature at the inlet of regulators in natural gas pressure reduction stations (CGS) for energy saving in water bath heaters. J. Nat. Gas Sci. Eng. 2014, 21, 230–240. [Google Scholar] [CrossRef]
  23. Arabkoohsar, A.; Farzaneh-Gord, M.; Deymi-Dashtebayaz, M.; Machado, L.; Koury, R.N.N. A new design for natural gas pressure reduction points by employing a turbo expander and a solar heating set. Renew. Energy 2015, 81, 239–250. [Google Scholar] [CrossRef]
  24. Kostowski, W.J.; Usón, S. Thermoeconomic assessment of a natural gas expansion system integrated with a cogeneration unit. Appl. Energy 2013, 101, 58–66. [Google Scholar] [CrossRef]
  25. Ghorbani, B.; Mehrpooya, M.; Hamedi, M.; Amidpour, M. Exergoeconomic analysis of integrated natural gas liquids (NGL) and liquefied natural gas (LNG) processes. Appl. Therm. Eng. 2017, 113, 1483–1495. [Google Scholar] [CrossRef]
  26. Barone, G.; Buonomano, A.; Calise, F.; Forzano, C.; Palombo, A. Energy recovery through natural gas turboexpander and solar collectors: Modelling and thermoeconomic optimization. Energy 2019, 183, 1211–1232. [Google Scholar] [CrossRef]
  27. Deymi-Dashtebayaz, M.; Dadpour, D.; Khadem, J. Using the potential of energy losses in gas pressure reduction stations for producing power and fresh water. Desalination 2021, 497, 114763. [Google Scholar] [CrossRef]
  28. Sanaye, S.; Nasab, A.M. Modeling and optimizing a CHP system for natural gas pressure reduction plant. Energy 2012, 40, 358–369. [Google Scholar] [CrossRef]
  29. Kagiri, C.; Zhang, L.; Xia, X. Optimization of a compressed natural gas station operation to minimize energy cost. Energy Procedia 2017, 142, 2003–2008. [Google Scholar] [CrossRef]
  30. Deymi-Dashtebayaz, M.; Khorsand, M.; Rahbari, H. Optimization of fuel consumption in natural gas city gate station based on gas hydrate temperature (Case study: Abbas Abad station). Energy Environ. 2018, 30, 408–426. [Google Scholar] [CrossRef]
  31. Mohammad, N.E.; Aly, S.; Hussein, M.H. A Multi objective Optimization Method for Simulating the Operation of Natural gas Transport System. Korean J. Chem. Eng 2023.
  32. Cervantes Garcia, A.; Velázquez Aguilar, J.G.; Montejo Alvaro, F.; Rubio Maya, C.; Solorio Díaz, G.; Gutiérrez Sánchez, H.C. Estudio experimental del fenómeno ranque-hilsch en un tubo vórtice. In Proceedings of the XVI Congreso Internacional Anual De La Somim, Monterrey, Mexico, 22–24 September 2010; ISBN 9786079530938. [Google Scholar]
  33. Okolie, S.T.A.; Ozuor, O.; Fakehinde, O.; Ongbali, S.O.; Fayomi, O.S.I.; Agu, F.A. Study of Nigeria Geothermal Energy resources Viability, Brief Production Techniques and Transportation. Energy Procedia 2019, 157, 1475–1485. [Google Scholar] [CrossRef]
  34. Afanaseva, O.; Bezyukov, O.; Pervukhin, D.; Tukeev, D. Experimental Study Results Processing Method for the Marine Diesel Engines Vibration Activity Caused by the Cylinder-Piston Group Operations. Inventions 2023, 8, 71. [Google Scholar] [CrossRef]
  35. Li, C.; Zheng, S.; Li, J.; Zeng, Z. Optimal design and thermo-economic analysis of an integrated power generation system in natural gas pressure reduction stations. Energy Convers. Manag. 2019, 200, 112079. [Google Scholar] [CrossRef]
  36. Saryazdi, S.M.E.; Rezaei, F.; Saboohi, Y. Optimal detailed design and performance assessment of natural gas pressure reduction stations system equipped with variable inlet guide vane radial turboexpander for energy recovery. J. Nat. Gas Sci. Eng. 2021, 96, 104222. [Google Scholar] [CrossRef]
  37. Khoshvaght-Aliabadi, M.; Soleimani, P.; Rehman, S.; Alimoradi, A. Employing enhanced geometries in water bath heating system of natural gas pressure drop stations: Comparative study. J. Nat. Gas Sci. Eng. 2021, 87, 103775. [Google Scholar] [CrossRef]
  38. Waraporn, R.; Krairin, T. Improvement Vortex Cooling Capacity by Reducing Hot Tube Surface Temperature: Experiment. Energy Procedia 2014, 52, 1–9. [Google Scholar] [CrossRef]
  39. Ganjehsarabi, H.; Gungor, A.; Dincer, I. Exergoeconomic evaluation of a geothermal power plant. Int. J. Exergy 2014, 14, 303–319. [Google Scholar] [CrossRef]
  40. Maestre-Cambronel, D.; Guzmán Barros, J.; Gonzalez-Quiroga, A.; Bula, A.; Duarte-Forero, J. Thermoeconomic analysis of improved exhaust waste heat recovery system for natural gas engine based on Vortex Tube heat booster and supercritical CO2 Brayton cycle. Sustain. Energy Technol. Assess. 2021, 47, 101355. [Google Scholar] [CrossRef]
  41. Islam, A.; Roy, H.; Rahman, M. Energy efficiency study of household natural gas burner using pot-bottom shield and modified pot arrangement. Energy Rep. 2022, 8, 12871–12885. [Google Scholar] [CrossRef]
  42. NOM-001-SECRE-2010; Especificaciones Del Gas Natural. Comisión Reguladora de Energía, Diario Oficial de la Federación: Mexico City, Mexico, 2010. Available online: https://www.dof.gob.mx/normasOficiales/3997/sener/sener.htm (accessed on 3 October 2023).
  43. RES/596/2014; Resolución por la que la Comisión Reguladora de Energía Determina las Medidas que Deberán Implementar los Suministradores y Permisionarios de Sistemas de Transporte, Distribución y Almacenamiento de Gas Natural para dar Cumplimiento a lo Dispuesto en la Norma Oficial Mexicana NOM-001-SECRE-2010, Especificaciones del Gas Natural, así como el Sistema de Alertas para Informar oportunamente a sus Usuarios Sobre la Entrega de Gas Natural Fuera de Especificaciones. Comisión Reguladora de Energía, Diario Oficial de la Federación: Mexico City, Mexico, 2014. Available online: https://www.dof.gob.mx/nota_detalle.php?codigo=5383381&fecha=25/02/2015 (accessed on 8 February 2024).
  44. Çengel, Y.A.; Boles, M.A. Thermodynamics: An Engineering Approach, 7th ed.; McGraw-Hill: Boston, MA, USA, 2010; ISBN 007352932x. [Google Scholar]
  45. Xiong, W.; Zhang, L.; Zhao, Y.; Hu, Q.; Tian, T.; He, X.; Zhang, R.; Zhang, T. Prediction of the viscosity of natural gas at high temperature and high pressure using free-volume theory and entropy scaling. Pet. Sci. 2023, 20, 3210–3222. [Google Scholar] [CrossRef]
  46. Alvarado, D.A.; Bánzer, S.C. Recuperación Térmica de Petróleo, Caracas, Venezuela, 2002. Available online: https://1library.co/document/zwre527y-alvarado-d-and-banzer-c-recuperacion-termica-petroleo.html(accessed on 6 January 2024).
  47. Samuel, O.D.; Aigba, P.A.; Tran, T.K.; Fayaz, H.; Pastore, C.; Der, O.; Erçetin, A.; Enweremadu, C.C.; Mustafa, A. Comparison of the Techno-Economic and Environmental Assessment of Hydrodynamic Cavitation and Mechanical Stirring Reactors for the Production of Sustainable Hevea brasiliensis Ethyl Ester. Sustainability 2023, 15, 16287. [Google Scholar] [CrossRef]
  48. Cartlidge, J.; Chowdhury, N.; Povey, T. Performance characteristics of a divergent vortex tube. Int. J. Heat Mass Transf. 2022, 186, 122497. [Google Scholar] [CrossRef]
  49. Fuchs, S.; Norden, B.; Neumann, F.; Kaul, N.; Tanaka, A.; Kukkonen, I.T.; Pascal, C.; Christiansen, R.; Gola, G.; Šafanda, J.; et al. Quality-assurance of heat-flow data: The new structure and evaluation scheme of the IHFC Global Heat Flow Database. Tectonophysics 2023, 863, 229976. [Google Scholar] [CrossRef]
  50. Ham, J.; Kim, E.; You, N.; Cho, H. Comparison of thermal performance in solution heat exchangers with different chevron angles in absorption system. Case Stud. Therm. Eng. 2023, 51, 103598. [Google Scholar] [CrossRef]
  51. Gao, Q.; Zhao, S.; Zhang, Z.; Zhang, J.; Zhao, Y.; Sun, Y.; Li, D.; Yuan, H. Performance Analysis and Multi-Objective Optimization of a Cooling-Power-Desalination Combined Cycle for Shipboard Diesel Exhaust Heat Recovery. Sustainability 2023, 15, 16942. [Google Scholar] [CrossRef]
  52. Li, H.; Huang, H.; Xu, G.; Wen, J.; Wu, H. Performance analysis of a novel compact air-air heat exchanger for aircraft gas turbine engine using LMTD method. Appl. Therm. Eng. 2017, 116, 445–455. [Google Scholar] [CrossRef]
  53. Noori, N.R.; Saeed, A.F. A study of finding empirical correlation for the Nusselt number and the factors influencing it for perforated fin array of different shapes. Ain Shams Eng. J. 2024, 15, 102320. [Google Scholar] [CrossRef]
  54. Zhao, Q.; Mao, B.; Zhao, J.; Li, H.; Wei, S.; Bai, X.; Zhang, X.; Zhang, Y. Experimental study on the forced convection heat transfer characteristics of airflow with variable thermophysical parameters in a circular tube. Case Stud. Therm. Eng. 2022, 40, 102495. [Google Scholar] [CrossRef]
  55. Çengel, Y.A.; Ghajar, A.J. Heat and Mass Transfer. A Practical Approach, 3rd ed.; McGraw Hill: New York, NY, USA, 2009; ISBN 9780073250359. [Google Scholar]
  56. Liang, M.; Tu, J.; Zeng, L.; Zhang, Z.; Cheng, N.; Luo, Y. Thermal Performance Analysis and Multi-Factor Optimization of Middle–Deep Coaxial Borehole Heat Exchanger System for Low-Carbon Building Heating. Sustainability 2023, 15, 15215. [Google Scholar] [CrossRef]
  57. Lozano, M.A.; Valero, A. Theory of the exergetic cost. Energy 1993, 18, 939–960. [Google Scholar] [CrossRef]
  58. Wan, T.; Bai, B.; Zhou, W. Exergy destruction analysis of a power generation system utilizing the cold energy of LNG. Heliyon 2023, 9, e19393. [Google Scholar] [CrossRef] [PubMed]
  59. Ambriz-Díaz, V.M.; Rubio-Maya, C.; Ruiz-Casanova, E.; Martínez-Patiño, E.; Pastor-Martínez, E. Advanced exergy and exergoeconomic analysis for a polygeneration plant operating in geothermal cascade. Energy Convers. Manag. 2020, 203, 112227. [Google Scholar] [CrossRef]
  60. GeothermEX, Inc. New Geothermal Site Identification and Qualification [Technical Report]; Energy Commission: Sacramento, CA, USA, 2004. [Google Scholar]
  61. Acar, M.S.; Arslan, O. Exergo-economic Evaluation of a New Drying System Boosted by Ranque-Hilsch Vortex Tube. Appl. Therm. Eng. 2017, 124, 1–16. [Google Scholar] [CrossRef]
  62. Corripio, A.B.; Chrien, K.S.; Evans, L.B. Estimate costs of heat exchangers and storage tanks via correlations. Chem. Eng. 1995, 89, 125–127. [Google Scholar]
  63. Corripio, A.B.; Chrien, K.S.; Evans, L.B. Shell and tube Heat Exchanger Cost Estimation. Chem. Eng. 1982, 89, 125–127. [Google Scholar]
  64. PEDCo Environmental Inc. Cost Equations for Industrial Boilers; US Environmental Protection Agency: Washington, DC, USA, 1980.
  65. Fiaschi, D.; Manfrida, G.; Rogai, E.; Talluri, L. Exergoeconomic analysis and comparison between ORC and Kalina cycles to exploit low and medium-high temperature heat from two different geothermal sites. Energy Convers. Manag. 2017, 154, 503–516. [Google Scholar] [CrossRef]
  66. Mohammadkhani, F.; Shokati, N.; Mahmoudi, S.M.S.; Yari, M.; Rosen, M.A. Exergoeconomic assessment and parametric study of a Gas Turbine-Modular Helium Reactor combined with two Organic Rankine Cycles. Energy 2014, 65, 533–543. [Google Scholar] [CrossRef]
  67. Comisión Reguladora de Energía. Índices de Referencia de Precios de Gas Natural. 2023. Available online: https://www.cre.gob.mx/IPGN/ (accessed on 6 January 2024).
  68. NOM-002-SECRE-2010; Instalaciones de Aprovechamiento de Gas Natural. Comisión Reguladora de Energía, Diario Oficial de la Federación: Mexico City, Mexico, 2010. Available online: https://dof.gob.mx/normasOficiales/4290/sener/sener.htm (accessed on 15 October 2023).
  69. F-Chart Software. DIRECT Optimization Algorithm. Available online: https://www.fchart.com/ees/eeshelp/hs637.htm (accessed on 11 October 2023).
  70. Aviña, H.; Pérez, E. Deshidratador Geotérmico de Alimentos (DGA). Instituto de Ingeniería UNAM. Available online: https://www.iingen.unam.mx/es-mx/AlmacenDigital/Gaceta/GacetaMarzo-Abril2020/Paginas/dga-iidea.aspx (accessed on 23 October 2023).
  71. Saripudin; Ariadji, T.; Adisasmito, S.; Mucharam, L.; Abdassah, D. Improved Joule Thomson equation of supercritical CO2-rich natural gas in separation system. Nat. Gas Ind. B 2023, 10, 245–253. [Google Scholar] [CrossRef]
Figure 1. Decompression station sketch.
Sustainability 16 01669 g001
Figure 2. Implemented methodology.
Sustainability 16 01669 g002
Figure 3. Inlet and outlet heat exchanger’s temperature behavior.
Sustainability 16 01669 g003
Figure 4. Optimization process block diagram.
Sustainability 16 01669 g004
Figure 5. Vortex tube analysis results.
Sustainability 16 01669 g005
Figure 6. Geothermal heat flow vs. depth.
Sustainability 16 01669 g006
Figure 7. System heat flows.
Sustainability 16 01669 g007
Figure 8. Volumetric flow rate vs. exergy flow.
Sustainability 16 01669 g008
Figure 9. Exergy destruction vs. volumetric flow rate.
Sustainability 16 01669 g009
Figure 10. System flows unitary costs and cost rates.
Sustainability 16 01669 g010
Figure 11. Fuel unitary costs of system equipment.
Sustainability 16 01669 g011
Figure 12. Product unitary cost of system equipment.
Sustainability 16 01669 g012
Figure 13. System equipment cost rate.
Sustainability 16 01669 g013
Figure 14. Volumetric flow rate vs. exergy destruction cost.
Sustainability 16 01669 g014
Figure 15. Decompressing system equipment exergoeconomics factors.
Sustainability 16 01669 g015
Figure 16. Temperatures values.
Sustainability 16 01669 g016
Figure 17. Flow costs comparison.
Sustainability 16 01669 g017
Figure 18. Exergy destruction comparison.
Sustainability 16 01669 g018
Table 1. Natural gas composition.
ComponentChemical FormulaComposition (%)
Methane C H 4 92
Etane C 2 H 6 3.5
Propane C 3 H 8 2.5
Butane C 4 H 10 0.5
Nitrogen N 2 0.8
Carbon dioxide C O 2 0.5
Oxygen O 2 0.2
Table 2. Natural gas general properties obtention.
PropertyEquationsUnits
Mass fraction m f i = m i m G N --
Molar mass M N G = 1 i = 1 k m f i M i kg/kmol
Molar fraction y i = m f i M N G M i --
Gas constant R N G = R u M N G K J / k m o l · K
Compressibility factor Z N G = i = 1 k y i Z i
P N G V N G = Z N G R N G T N G
P [kPa]
V   [ m 3 / k g ]
T [K]
Z [--]
Density ρ N G = 1 V N G k g / m 3
Mass flow m ˙ N G = V ˙ N G ρ N G kg/s
Specific heat capacity c p , N G = i = 1 k f m i c p , i       K J / k g · K
Viscosity μ N G = K e X ( ρ G N Y )   10,000
K = 9.4 + 0.02 M N G T 1.5 209 + 19 M N G + T
X = 3.5 + 986 T + 0.01 M N G      
Y = 2.4 0.2 X
μ N G   [ P a · s ]      
Thermal conductivity K N G = μ N G C p , N G + 2.48 M N G K N G   [ k W / m · K ]
Table 3. Exergy flow equations in the natural gas decompression station.
FlowEquation
1–6 B ˙ i = m ˙ i C p , i T i T 0 T 0 ln T i T 0 + T 0 R G N l n P P 0
7,8 B ˙ i = m ˙ i C p , i T i T 0 T 0 ln T i T 0
9 (Burner) B ˙ 9 = m ˙ 9 · P C G N = Q ˙ V A T
10 (Geothermal well) B ˙ 10 = 1 T 0 T G e o Q ˙ G E O
11 (Heating vat) B ˙ 11 = 1 T 0 T T I N A Q ˙ V A T
Table 4. Exergy destruction in the system equipment.
EquipmentFuel (kW)Product (kW)Exergy Destruction (kW)
Vortex tube B ˙ 1 B ˙ 2 + B ˙ 3 E ˙ D , 1 = B ˙ 1 B ˙ 2 B ˙ 3
Geothermal heat exchanger B ˙ 10 B ˙ 4 B ˙ 3 E ˙ D , 2 = B ˙ 3 + B ˙ 10 B ˙ 4
Mixing chamber B ˙ 2 + B ˙ 4 B ˙ 5 E ˙ D , 3 = B ˙ 2 + B ˙ 4 B ˙ 3
Heating vat B ˙ 5 + B ˙ 7 B ˙ 8 B ˙ 6 E ˙ D , 4 = B ˙ 5 + B ˙ 7 B ˙ 6 B ˙ 8
Burner B ˙ 9 B ˙ 7 B ˙ 8 E ˙ D , 5 = B ˙ 9 + B ˙ 8 B ˙ 7
Table 5. System equipment costs.
EquipmentCost EquationsUnits
Vortex tube C C , V T = 0.04374 Q ˙ V T 0.227
C V T = C C , V T + C O M , V T + C V R , V T
Q ˙ T V [kW]
C C , V T [USD]
Geothermal heat exchanger C P E R F = 240,785 + 210 · L + 0.019069 · L 2
C G E = C b · F d · F p · F m
F d = e 0.9816 + 0.0830 ln A
F p = 1.0305 + 0.0714 ln A
F m = g 1 + g 2 · ln A
L [ft]
A [ m 2 ]
C P E R F   [USD]
C I G   [USD]
Mixing chamber C M C = 0.15 · C I G C M C [USD]
Heating vat C H T = C b · F d · F p · F m C H T   [USD]
Burner C B , E Q = 14,850 Q ˙ V A T 0.786
C B , I N S T = 54,620 Q ˙ V A T 0.361
C B = C B , E Q + C B , I N S T
Q ˙ T U B [ 3.41 × 10 6   W]
C B [USD]
Table 6. Decompressing station costs balance.
EquipmentBalanceAuxiliary Equations
Vortex tube C ˙ 1 + Z ˙ 1 = C ˙ 2 + C ˙ 3 C ˙ 1 = B ˙ 1 · c G N
c 2 = c 3
Geothermal heat exchanger C ˙ 3 + Z ˙ 2 + Z ˙ 3 + C ˙ 10 = C ˙ 4 C ˙ 10 = B ˙ 10 · c E G = 0
Mixing chamber C ˙ 2 + C ˙ 4 + Z ˙ 4 = C ˙ 5 --
Heating vat C ˙ 5 + C ˙ 7 + Z ˙ 5 = C ˙ 6 + C ˙ 8 C ˙ 5 + C ˙ 7 B ˙ 5 + B ˙ 7 = c 8  
Burner C ˙ 9 + Z ˙ 6 + C ˙ 8 = C ˙ 7 C ˙ 9 = B ˙ 9 · c G N
Table 7. Proposed variables for parametric analysis.
FlowEquation
Heating vat temperature 61   T 7 80   ° C
Vortex tube cold flow outlet percentage 65 μ C 73 %
Geothermal well temperature 100 T G E O   150   ° C
Station volumetric flow 200 V ˙ 380   m 3 / h
Table 8. Geothermal preheating analysis results.
PropertyVariableValueUnits
Logarithmic mean temperature difference L M T D 87.64K
Reynolds numberRe351,882--
Prandtl numberPr0.8496--
Darcy factorf0.01401--
Nusselt numberNuss552.2--
Convective heat transfer coefficient H N G 4.429 k W / m 2 · K
Overall heat transfer coefficientU0.04449 k W / m 2 · K
Heat exchange areaA6.773 m 2
Additional exchanger length L 2 30m
Total exchanger lengthL72.44m
Table 9. Exergetic analysis results.
FlowT (°C) m ˙ (kg/s) B ˙ (kW)
1200.1734138.8
2550.0520141.33
350.121495.85
4550.121496.44
5550.1734137.8
6200.173427.35
7620.39054.49
8250.39050.06886
9--0.00354760.43
10120--6.709
Table 10. Exergy destruction.
EquipmentExergy Destruction (kW)
Vortex tube1.595
Geothermal heat exchanger6.116
Mixing chamber41.93
Heating vat114.8
Burner56.01
Total220.5
Table 11. Thermoeconomics evaluation results.
Equipment C ˙ D ( U S D / h ) r ( % )
Vortex tube0.044781.955
Geothermal heat exchanger----
Mixing chamber4.7590.3955
Heating vat16.07447.7
Burner1.5723285
Table 12. Variations using real conditions.
VariableIdealRealVariation (%)
Exergy destruction (kW)220.5261.718.68
Natural gas cost (USD/GJ)212.9219.93.29
Exergy efficiency (%)21.4221.111.45
Table 13. Cold flow fraction and volumetric flow values optimization.
VariableOriginal ValueNatural Gas Cost OptimizationExergy Destruction Optimization
Cold flow fraction ( μ C )0.700.650.73
Volumetric flow ( V ˙ ) [ m 3 / h ]300380200
Disclaimer/Publisher’s Note: The statements, opinions and data contained in all publications are solely those of the individual author(s) and contributor(s) and not of MDPI and/or the editor(s). MDPI and/or the editor(s) disclaim responsibility for any injury to people or property resulting from any ideas, methods, instructions or products referred to in the content.

