
The Cobalt Supply Chain and Environmental Life Cycle Impacts of Lithium-Ion Battery Energy Storage Systems

1
Bureau of Economic Geology, Jackson School of Geosciences, The University of Texas at Austin, Austin, TX 78712, USA
2
Energy and Earth Resources Graduate Program, Jackson School of Geosciences, The University of Texas at Austin, Austin, TX 78712, USA
3
Fractal Business Analytics LLC, Austin, TX 78735, USA
*
Author to whom correspondence should be addressed.
Sustainability 2024, 16(5), 1910; https://doi.org/10.3390/su16051910
Submission received: 10 January 2024
/
Revised: 12 February 2024
/
Accepted: 21 February 2024
/
Published: 26 February 2024
Abstract
:Lithium-ion batteries (LIBs) deployed in battery energy storage systems (BESS) can reduce the carbon intensity of the electricity-generating sector and improve environmental sustainability. The aim of this study is to use life cycle assessment (LCA) modeling, using data from peer-reviewed literature and public and private sources, to quantify environmental impacts along the supply chain for cobalt, a crucial component in many types of LIBs. The study seeks to understand where in the life cycle stage the environmental impacts are highest, thus highlighting actions that can be taken to improve sustainability of the LIB supply chain. The system boundary for this LCA is cradle-to-gate. Impact assessment follows ReCiPe Midpoint (H) 2016. We assume a 30-year modeling period, with augmentation occurring at the end of the 3rd, 7th, and 14th years of operations, before a complete replacement in the 21st year. Three refinery locations (China, Canada, and Finland), a range of ore grades, and five battery chemistries (NMC111, NMC532, NMC622, NMC811, and NCA) are used in scenarios to better estimate their effect on the life cycle impacts. Insights from the study are that impacts along nearly all pathways increase according to an inverse power-law relationship with ore grade; refining outside of China can reduce global warming potential (GWP) by over 12%; and GWP impacts for cobalt used in NCA and other NMC battery chemistries are 63% and 45–74% lower than in NMC111, respectively. When analyzed on a single-score basis, marine and freshwater ecotoxicity are prominent. For an ore grade of 0.3%, the GWP values for the Canada route decrease at a rate of 58% to 65%, and those for Finland route decrease by 71% to 76% from the base case. Statistical analysis shows that cobalt content in the battery is the highest predictor (R2 = 0.988), followed by the ore grade (R2 = 0.966) and refining location (R2 = 0.766), when assessed for correlation individually. The results presented here point to areas where environmental burdens of LIBs can be reduced, and thus they are helpful to policy and investment decision makers.
1. Introduction
Cobalt is a key ingredient in lithium-ion batteries (LIBs). Demand for LIBs is expected to increase by 15 times by 2030 [1,2] due to increased wind and solar generation paired with battery energy storage systems (BESS). By 2025, the International Energy Agency (IEA) [3] predicts that a rise in LIB demand, to meet the goals outlined in the Paris Climate Accords, could increase the need for cobalt by 2500% (Supplementary Materials Figure S1). LIBs used in electric vehicles (EVs) represent the main catalyst for the increased demand of cobalt, rising with the increasing shift to low-carbon fuel technologies. Most of the cobalt supply chain is controlled by a few countries (Table S1). For example, in 2020, the Democratic Republic of the Congo (DRC) accounted for 69% of global mine production, 10 times greater than Russia, the next largest producer [4,5]. According to the United States Geological Survey [6], the DRC has the world’s largest reserves of cobalt ore, so its dominance in the production of mined cobalt will likely continue in the foreseeable future.
Like the market for mined cobalt, refined cobalt products are centralized in a single country, with China accounting for 67% of the world’s refined battery-grade cobalt sulfate (CoSO4) capacity in 2020 [7]. There is little possibility for substitution in the near term because, other than China, only Finland has significant refining capacity for cobalt materials needed for LIBs, accounting for only 10% of total supply in 2020 [7]. The United States recently has taken steps to increase domestic cobalt supplies with the announcement in February 2022 of a USD 3 billion investment toward increasing domestic supplies of refined battery metals, including cobalt [2,8]. Data and insights into the environmental impacts of the cobalt supply chain are necessary for policy makers as they consider choices in planning for at-scale energy systems by the middle of the 21st century.
Previous research has demonstrated human health impacts, water pollution, acid mine drainage, greenhouse gas (GHG) pollution, and agricultural contamination associated with cobalt mining in the DRC [9,10,11,12,13,14]. Others have found that cobalt-bearing LIB chemistries can impart greater impacts on the environment than cobalt-free chemistries [15]. As cobalt demand increases so too will the need to understand the environmental impacts more fully, so they can be managed effectively and potentially mitigated or avoided altogether.
Life cycle assessment (LCA) is an internationally standardized, analytical method used in evaluating the full scope of environmental impacts across an entire product life [16]. LCA studies of systems or processes can identify prospects of enhancements and/or highlight appropriate substitutions [17,18,19,20,21]. Recently, LCA has grown in popularity for comparing the direct and indirect environmental burdens of energy systems, especially for renewable technologies such as solar panels, wind turbines, battery energy storage systems (BESS), or LIBs [22]. LIBs consist of many significant materials, including metals. LCA studies of metals from mining to end of life have been reported in the literature. Arshad et al. (2022) [23] presented a critical review of noteworthy LCA studies on LIBs, some of which focus on metals and mainly on the extraction process. There are published LCA studies on different variants of LIBs (Table S2) [24,25,26,27,28,29,30,31,32,33,34,35,36]. Some relevant studies of metals essential to an LIB are cited in Table 1.
Even given the results of these studies, intercomparison is often difficult because of lack of transparency in data sources in LCAs, or lack of data themselves, including data on cobalt [42]. For example, in a frequently cited LCA on LIBs, Majeau-Bettez et al. (2011) [43] used data for the production of metallic cobalt, which is not used in LIBs, due to a lack of data availability for the refining of CoSO4. Their study did not disaggregate the results across the cobalt supply chain processes, so differentiating impacts between specific processes or identifying the sources contributing to the impacts is not possible. Other studies have since relied on the results from Majeau-Bettez et al. (2011) [43] when conducting additional LCAs [44,45], indicating that the results of these LCAs may not reflect the impacts of the real-world cobalt supply chain. Dai et al. (2019) [35] do include site-specific data from their earlier study of the cobalt supply chain [46], but the results are not disaggregated at a process level. Kelly et al. (2020) [47] analyzed CoSO4 refining in five countries (the United States, China, Japan, South Korea, and Europe) and showed that changing the refinery location will affect the environmental impacts of the cobalt supply chain. However, the results also are not disaggregated. Crenna et al. (2021) [48] noted that allocation method (i.e., how the impacts are apportioned when a process has multiple products) in LCA can vary the results attributed to cobalt. Because cobalt was worth five times more than copper at the time of the study, the impacts attributed to cobalt, when allocated based on economic value, were much higher than when they were allocated based on mass. Crenna et al. (2021) [48] also emphasized the value of disaggregating the supply chain because, for example, varying electricity mixes used for different industrial processes can change the results compared to an aggregated analysis.
LCAs specific to the cobalt supply chain often only include data from a single production route, limiting identification of how the impacts vary as new refineries come online [46,49,50,51]. Like other types of LCAs, studies pertaining to cobalt often rely on background databases as data sources, especially the Ecoinvent product [52], providing results that may not be representative of products and technologies used today [38,53]. Because data on cobalt refining in Ecoinvent (v 2.2) used for these studies were an approximation based on data gathered from nickel refining decades prior, Arvidsson et al. (2020) [54] have questioned the accuracy of the results. Arvidsson et al. (2022) [55] subsequently presented the health impacts of an LIB containing cobalt using an aggregated LCA approach. A detailed, cradle-to-gate LCA of CoSO4 production from a nickel–copper cobalt mine in China has been reported by Zhang et al. (2021) [51].
While the studies listed above provide important information on environmental impacts from LIBs containing cobalt, they tend to aggregate the results across the supply chain; attributing impacts to specific supply chain processes is not possible. To our knowledge, no studies have reported the environmental impacts of each process in the cobalt supply chain that begins in the DRC, the largest producer of cobalt in the world, only a total for the entire supply chain. Moreover, they do not consider how changes in ore grade will manifest in environmental impacts.
This research paper presents a comprehensive disintegrated life cycle assessment of the environmental impacts of cobalt production routes for LIBs, including a range of ore grades. We assume that cobalt is sourced only from copper–cobalt deposits in the DRC, although we assess different production routes. The goal of this research is to address the following questions:
- Q1. What physical pathways and processes does cobalt undergo from extraction until use in an LIB?
- Q2. What are the environmental (greenhouse gases (GHG), air, land, and water) impacts of each process and life-cycle phase?
- Q3. How will changes in ore quality impact the environmental sustainability of extraction?
- Q4. How will changes in refinery location impact the environmental sustainability of the cobalt supply chain for LIBs?
- Q5. How do the impacts of nickel manganese cobalt (NMC) and nickel cobalt aluminum (NCA) compare?
2. Materials and Methods
2.1. Life Cycle Assessment (LCA)
According to International Organization for Standardization (ISO) 14040—principles and framework [56] and ISO 14044—requirements and guidelines [57], the LCA approach consists of four main phases: (1) goal and scope definition, (2) life cycle inventory, (3) life cycle impact assessment, and (4) interpretation and inferences. These phases are described below. LCA model calculations used in this study were carried out using an OpenLCA software package (version 1.10.3, Green Delta, Berlin, Germany).
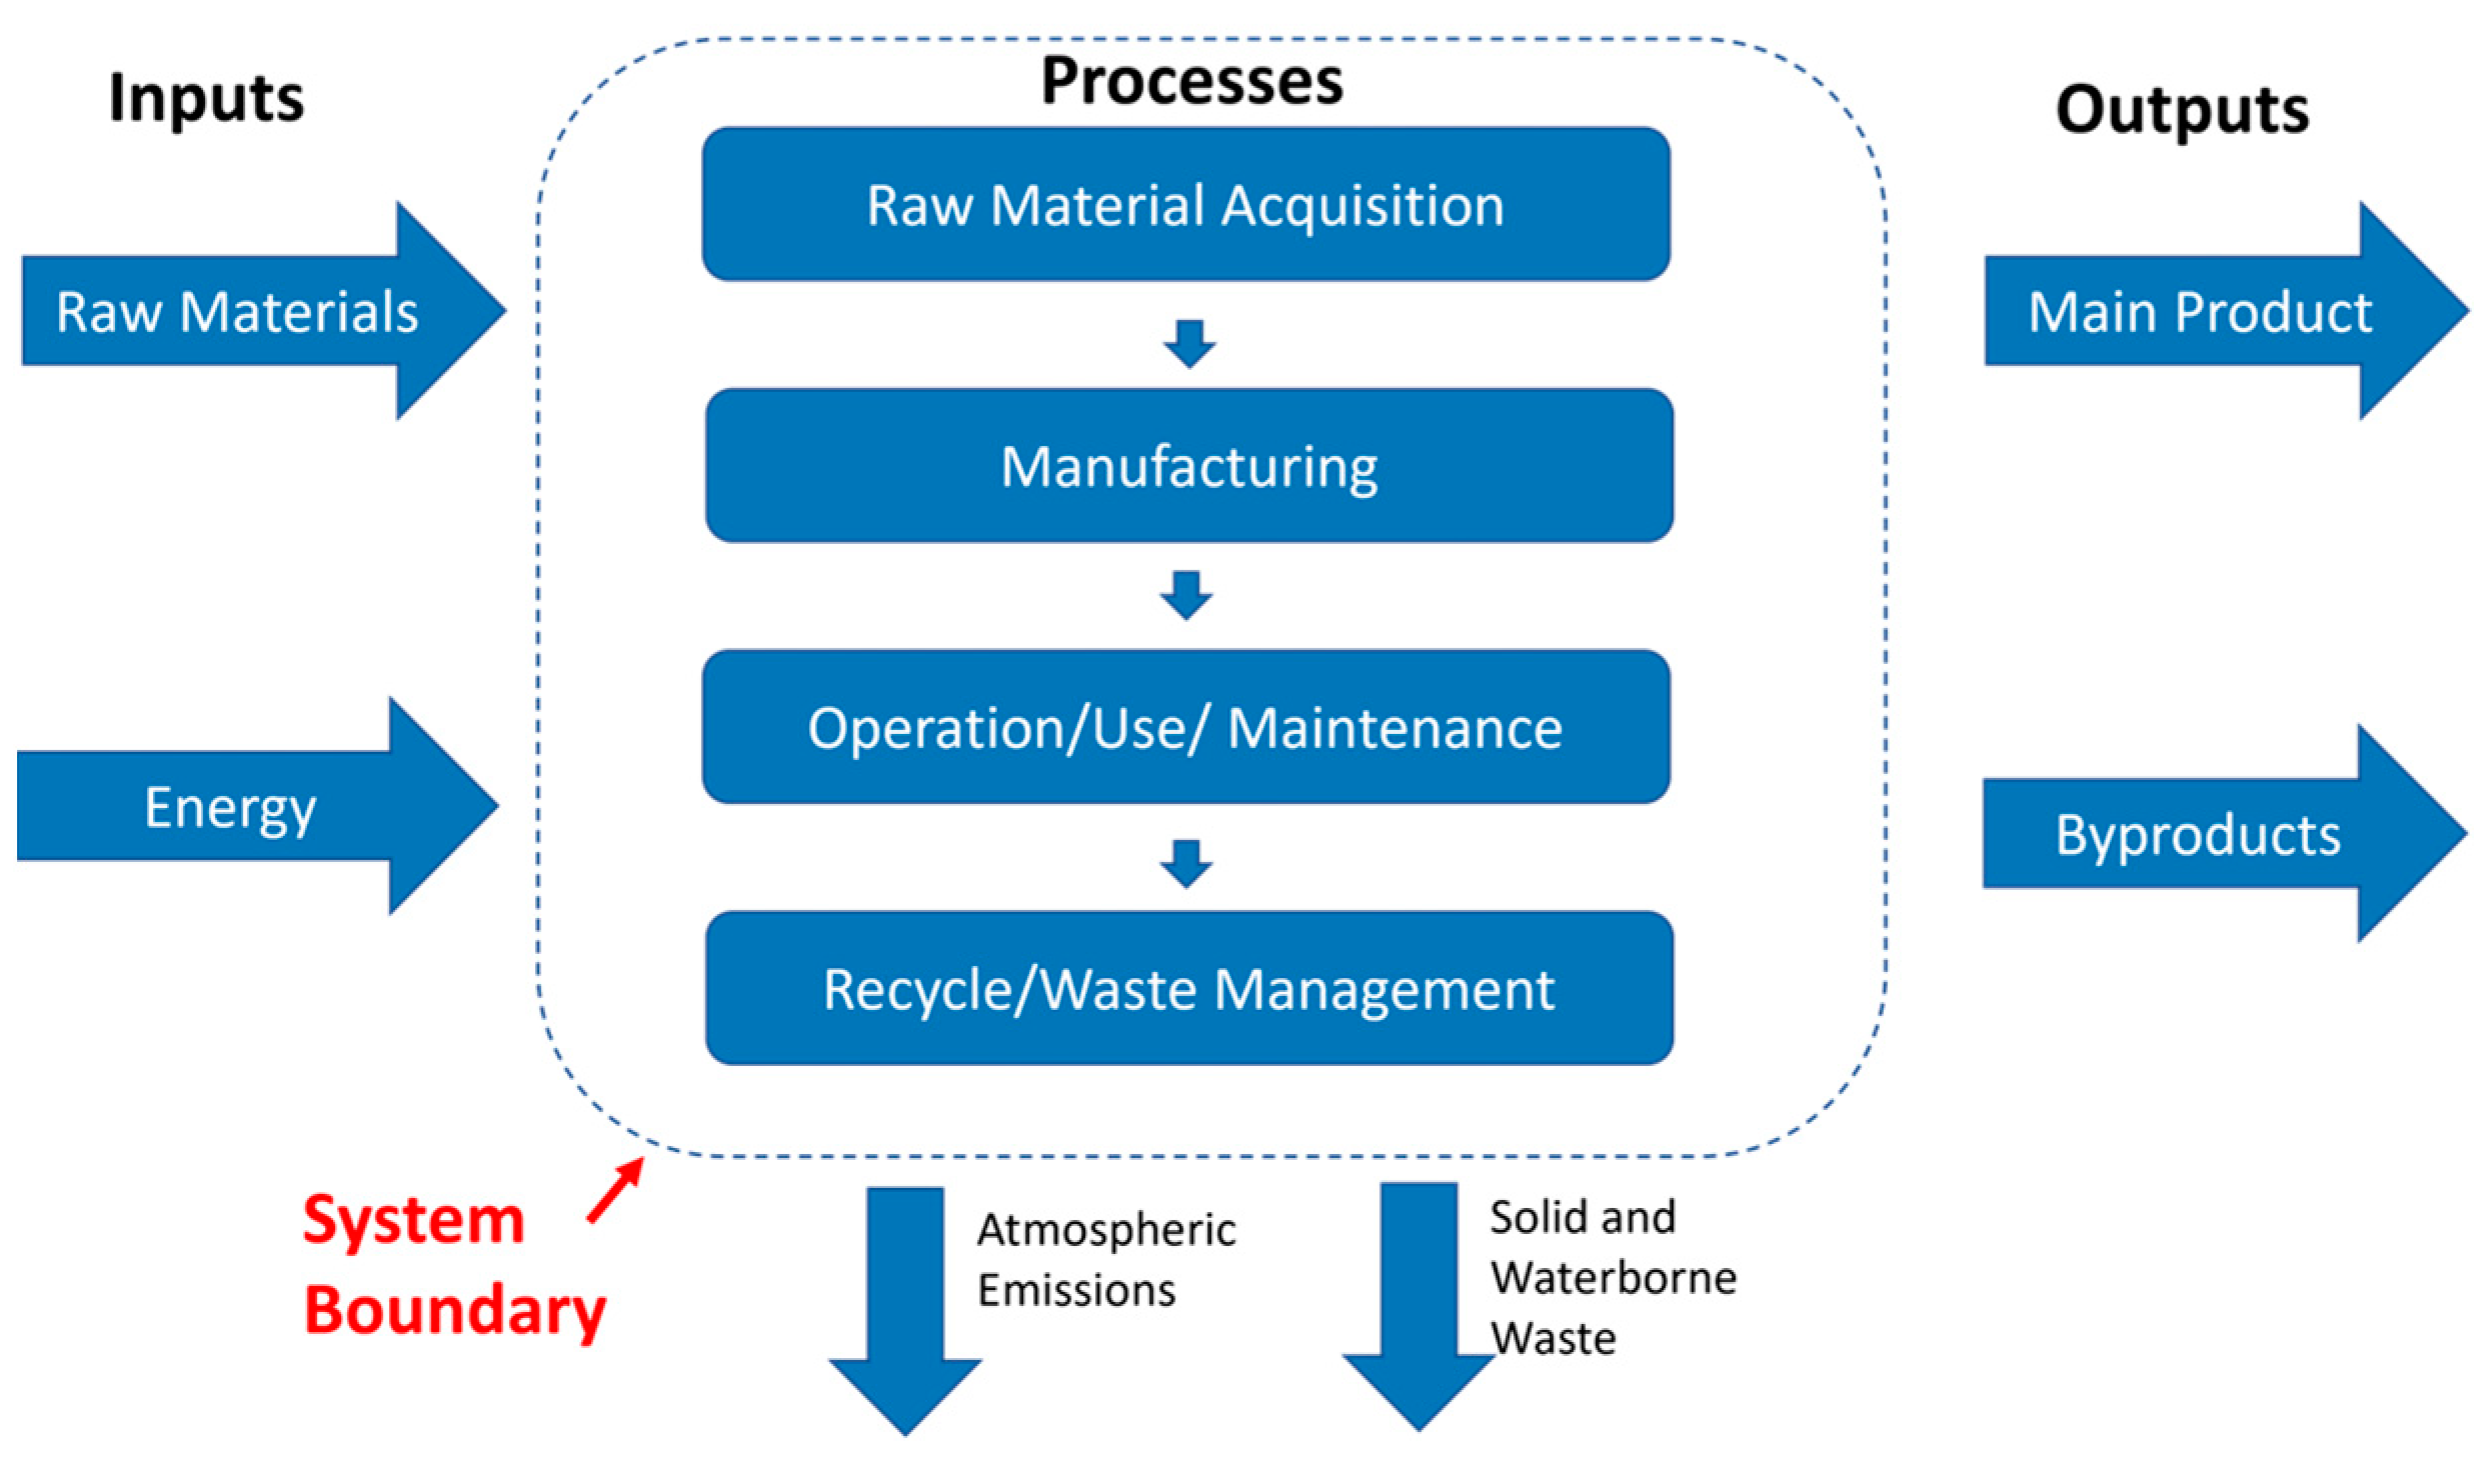
A pictorial representation of the material and energy flows of a general process is shown in Figure 1.
The cradle-to-gate burden vector for life cycle inventory {B} for unit production can be expressed as in Equation (1):
where ctg stands for cradle-to-gate, mp is the material production stage, mnf is the manufacturing stage, tr is transportation, and oper is operation. The material production energy of any process or product is expressed as PEj which is the sum of the input energy components (materials, fuel, and electricity) of the jth component. This can be mathematically expressed as in Equation (2):
where Emp is the material production energy; j is the number of components in the process or system; PEj is the production energy of the jth component; mj is the number of components; and Cj is the production efficiency of putting material j into the unit in the amount mj.
2.1.1. Goal and Scope Definition
The goal of this study is to analyze the cradle-to-gate environmental impact of cobalt when used as raw material for LIB production. The functional unit is 1 MWh of LIB storage capacity.
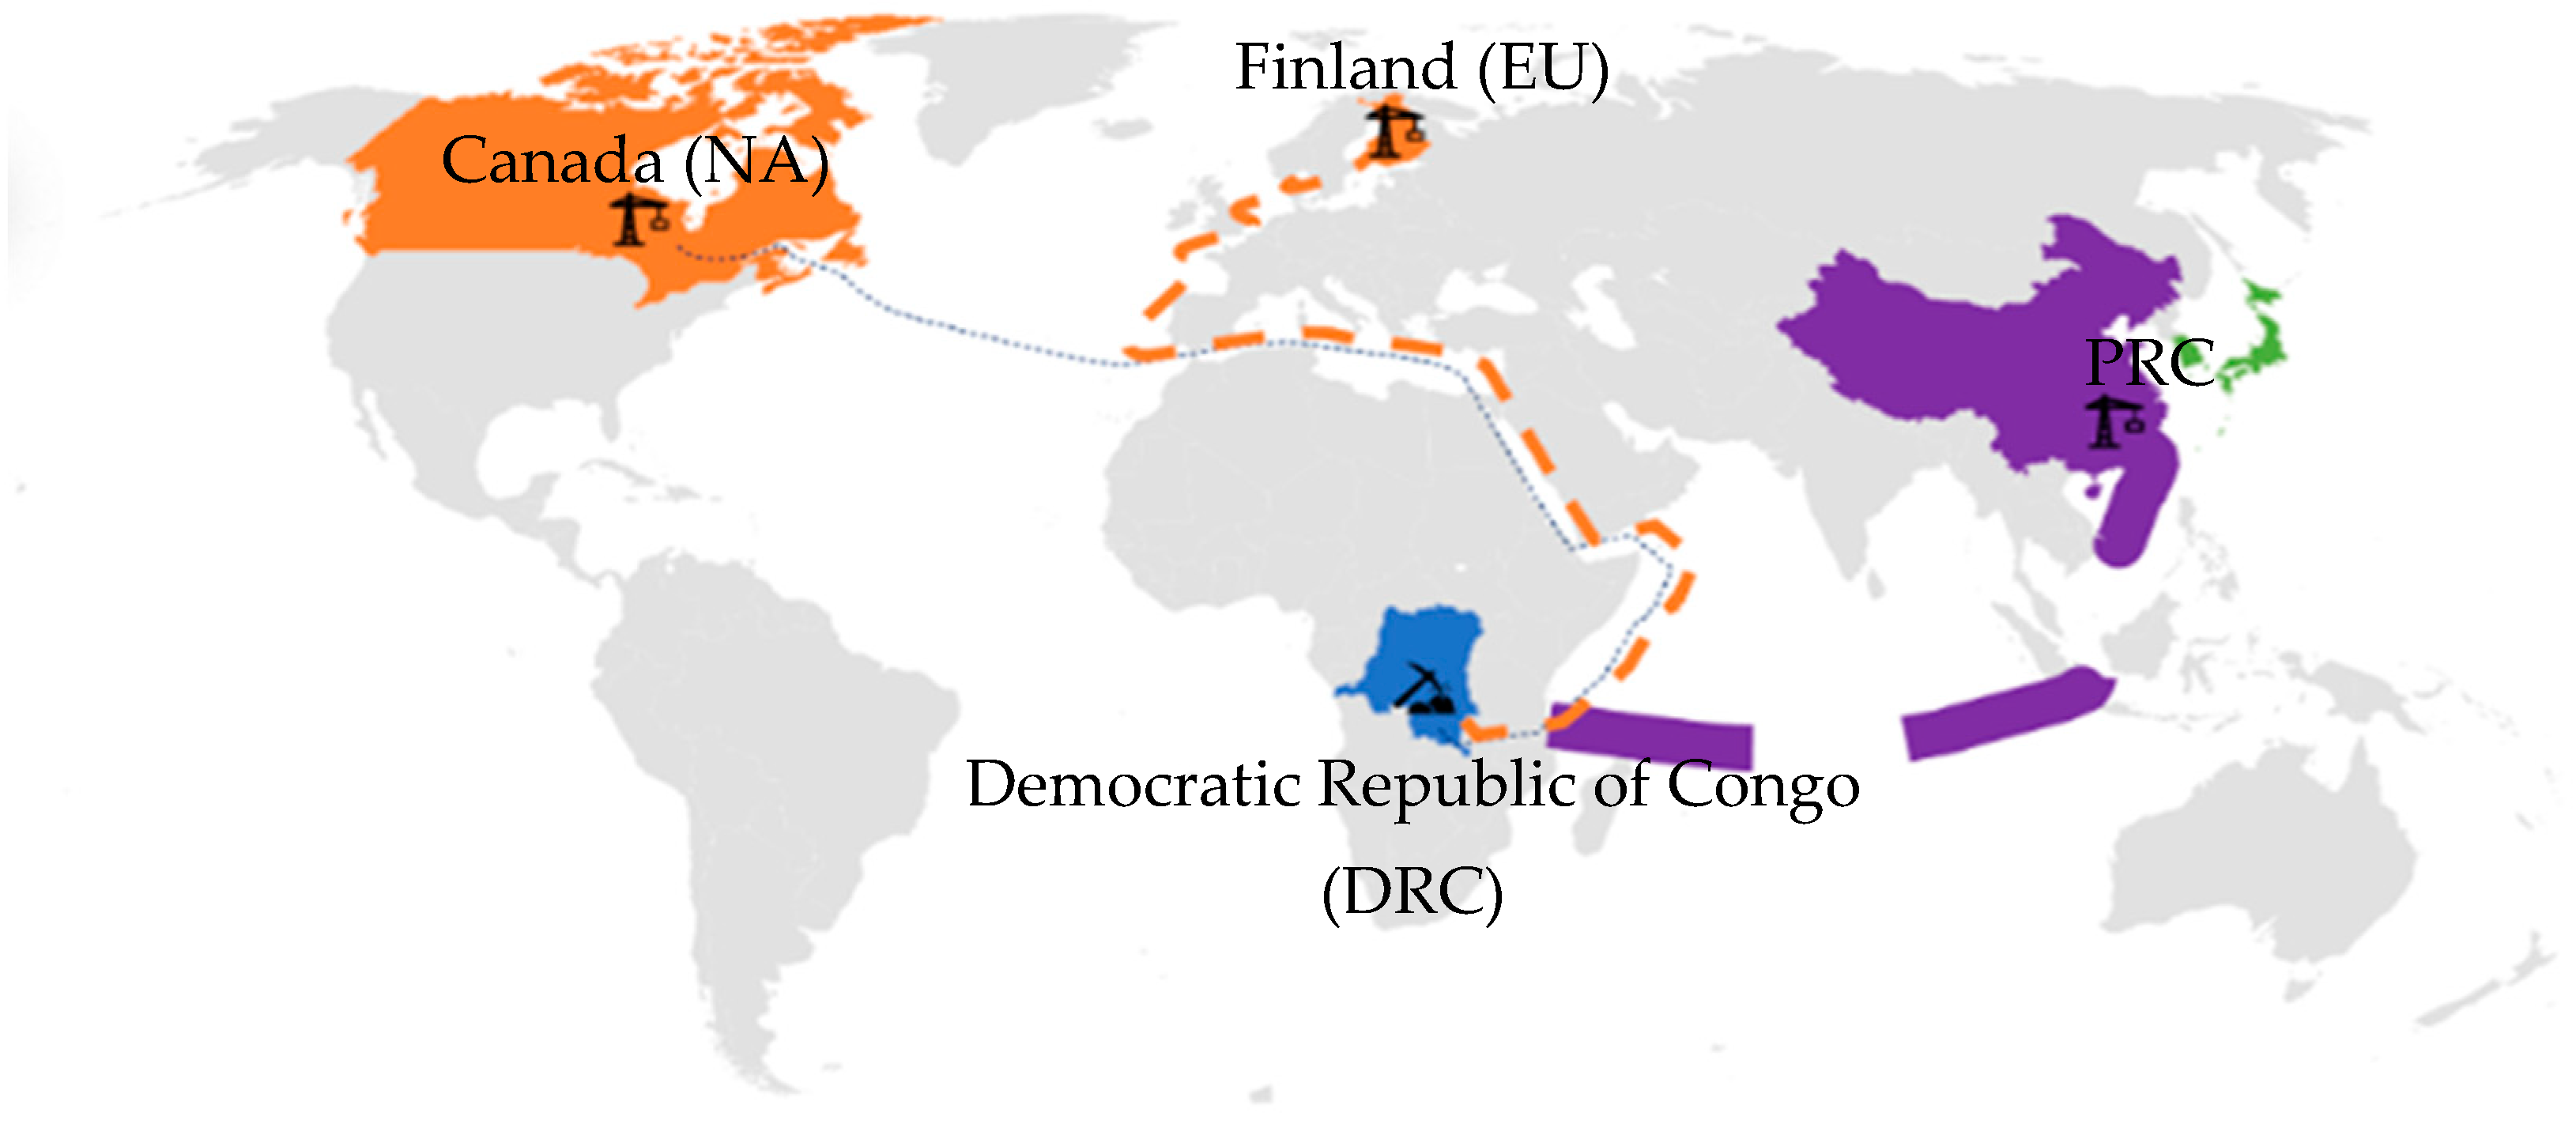
The multiple geographic regions under study (Figure 2) represent prevailing conditions or those expected in the future. In all scenarios, mining and processing are assumed to be in the DRC. Three different geographic locations—China, Canada (North America), and Finland (Europe)—are used for refining cobalt hydroxide (Co(OH)2) into battery-grade cobalt sulfate (CoSO4). These locations were chosen given China and Finland’s dominance in global refining capacity (67% and 10%, respectively) and the reported construction of a new refinery in Canada. The different locations on three continents provided enough spatial separation to show the significance of transportation distances. Cobalt supply chain and inventory data are largely sourced from Dai et al. (2018) [46], other literature sources, and the Ecoinvent database (version 3.8, [52]). We considered five battery technologies for this study: NMC111, NMC532, NMC622, NMC811, and NCA. The cycle life, cobalt content, and energy density of these different chemistries were gathered from literature sources (Table 2). System boundaries for this analysis are shown in Figure 3.
To ensure that environmental impacts are properly attributed to cobalt when a process produces multiple coproducts, the material inputs and emissions are allocated based on the mass of the coproducts. For cobalt chemicals, the impacts are allocated based on the ratio of the molecular mass of cobalt to the molecular mass of the entire chemical, so that the impacts are attributed only to cobalt rather than to other components [58].

Table 2.
Battery Specifications †.
| Battery | Cathode | Formula | Anode | Cycle Life (@80% DoD) | Life (Years) ‡ | Specific Energy (Wh/kg) [25] | Round Trip Efficiency (%) |
|---|---|---|---|---|---|---|---|
| NMC111 | Nickel manganese cobalt (in the ratio 1:1:1) | LiNi1/3Mn1/3Co1/3O2 | Graphite | 7000–7300 | 20 | 143 | 90 |
| NMC532 | Nickel manganese cobalt (in the ratio 0.5:0.3:0.2) | LiNi0.5Mn0.3Co0.2O2 | 259.26 | ||||
| NMC622 | Nickel manganese cobalt (in the ratio 0.6:0.2:0.2) | LiNi0.6Mn0.2Co0.2O2 | 269.17 | ||||
| NMC811 | Nickel manganese cobalt (in the ratio 0.8:0.1:0.1) | LiNi0.8Mn0.1Co0.1O2 | 278.75 | ||||
| NCA | Nickel cobalt aluminum | LiNi0.8Co0.15Al0.05O2 | 279.12 |
†—Data from [59]; ‡—assuming 1 cycle/day.
The cradle-to-gate environmental impact of the system considered for analysis is given by Equation (3):
where EI stands for environmental impact and ctg stands for cradle-to-gate. In our study, the total environmental impact of the system within the boundary is the sum of the impacts during mining of the ore, ore processing, transportation, and ore refining to be used in the battery.
Referring to the general methodology in Section 2.1, material production in our study is the sum of all the materials that go into the mining, processing, and refining stages. Manufacturing refers to all the processes that contribute to the above stages.
2.1.2. Life Cycle Inventory
Individual processes and inventories used in the cobalt supply chain for LIBs are identified from different geographic locations to assess how the impacts vary among China, Canada, and Finland. Cobalt is incorporated into five types of LIBs: nickel cobalt aluminum (NCA) and four types of nickel manganese cobalt, NMC111, NMC532, NMC622, and NMC811, to show how the life cycle impacts vary across battery types.
The life cycle inventory (LCI) includes numerous processes and inputs that are fully described in Section II of the Supplementary Materials section. We note that the analyses assume an initial battery rating of 500 MW capacity and battery replenishment, due to degradation, according to a specific schedule (Table 3).
2.1.3. Life Cycle Impact Assessment
The life cycle impact assessment (LCIA) method converts the material inputs, outputs, and emissions of the LCI into quantifiable impacts on land, air, and water resources [60]. The ReCiPe 2016 midpoint H (hierarchist) LCIA method [61], used in this study is based on a scientific consensus of the time frame and likelihood of impact mechanisms. Because impacts can persist after the 30-year useful life of the electricity generating option, the time horizon for the impacts included in this LCIA method is 100 years, which is the same standard used by the EIA (2021) [62]. Impact categories included in the analysis are given in Table 4.
2.1.4. Experimental Design and Data Analysis
To study the influence of input parameters on the LCA impact pathways, 150 scenarios were generated that include 10 variations in ore grade, 3 refinery locations, and 5 battery types (Table 5). The base case considers an ore grade of 0.3% [63] and NMC111 battery chemistry. The mining and processing location is in the DRC, and the refining is performed in China for the base case. The details are taken from Golder Associates, 2007 [64]. The transportation details were from [65,66].
The output from each scenario includes results for each impact category (listed in Table 4). Stepwise regression analysis is used to identify statistically relevant variables [67,68] when determining environmental burden. The method analyzes the sensitivity of the dependent variable to different independent variables. This method is performed to rule out potentially insignificant independent parameters.
where x1, x2, …, xn are the n independent variables, a1,a2…, an are their coefficients, and their powers are given by ε1,ε2…, εn. y is the dependent variable, and y0 is the constant.
In this analysis, ore grade, refining location, and battery type are the independent variables, and GWP is the dependent variable (Table 6).
The regression equation for the present study is given as:
where GWP is the global warming potential in kg CO2eq; g is the ore grade (percentage); loc is the percentage of fossil fuel generation at the refining location; and cob is the cobalt content in the battery (kg/MWh). Categorical variables were converted to nominal values, where refining location was expressed as the percentage of the grid mix sourced from fossil fuel generation at the location, and battery type was quantified based on the mass of cobalt required for 1 MWh of energy storage (Table 6).
3. Results
3.1. Base Case Scenario-Analysis of Impact Factors
The base-case scenario is an NMC111 battery with refining in China and an ore grade of 0.3%. The major environmental impacts are shown in Figure 4. Of the total GWP of 8568 kg CO2eq, refining contributed the most, relative to other life cycle phases (47.3% of total), within which the contributions of sodium hydroxide (15.5%) and the emissions associated with the electricity used during the refining process (14.1%) are substantial. The burning of diesel in machinery used to mine, haul, and grind the copper–cobalt ore was the largest single source of GWP (22.64%) (Figure 4a). The use of sulfur during processing in its solid state and as sulfur dioxide gas contributed 16% and 15.6%, respectively. Sulfuric acid use during refining contributed 10.8% of the total release of 70.1 kg of SO2eq of the terrestrial acidification potential (TAP). The sodium hydroxide (8.7%) and electricity (7.3%) used during refining also contribute to acidification (Figure 4b). Impacts from the treatment and disposal of tailings during the processing phase dominated the freshwater eutrophication potential (FEP) (6.19 kg Peq) along the supply chain (73.4%). For the total marine eutrophication potential (MEP) along the supply chain (2.56 kg Neq), refining is the largest contributor (38.7%), stemming mostly from the use of sodium hydroxide (15.2%). Mining was the second largest contributor to marine eutrophication (36.6%) from the burning of diesel fuel in mining machinery. Processing accounted for 18.1% of the total impact, stemming mostly from the embodied impacts of the magnesia (11.89%) (Figure 4c). The mineral resource scarcity (SOP) of 29.18 kg Cueq was dominated by refining processes that contributed 87.8% (Figure 4d). Mining was the largest contributor to fine particulate matter formation (PMFP), primarily from machinery exhaust and emissions from the crushing, mining, and drilling of ore, road entrainment, and wind erosion (73.6% of 90.2 kg of PM2.5eq, Figure 4e).
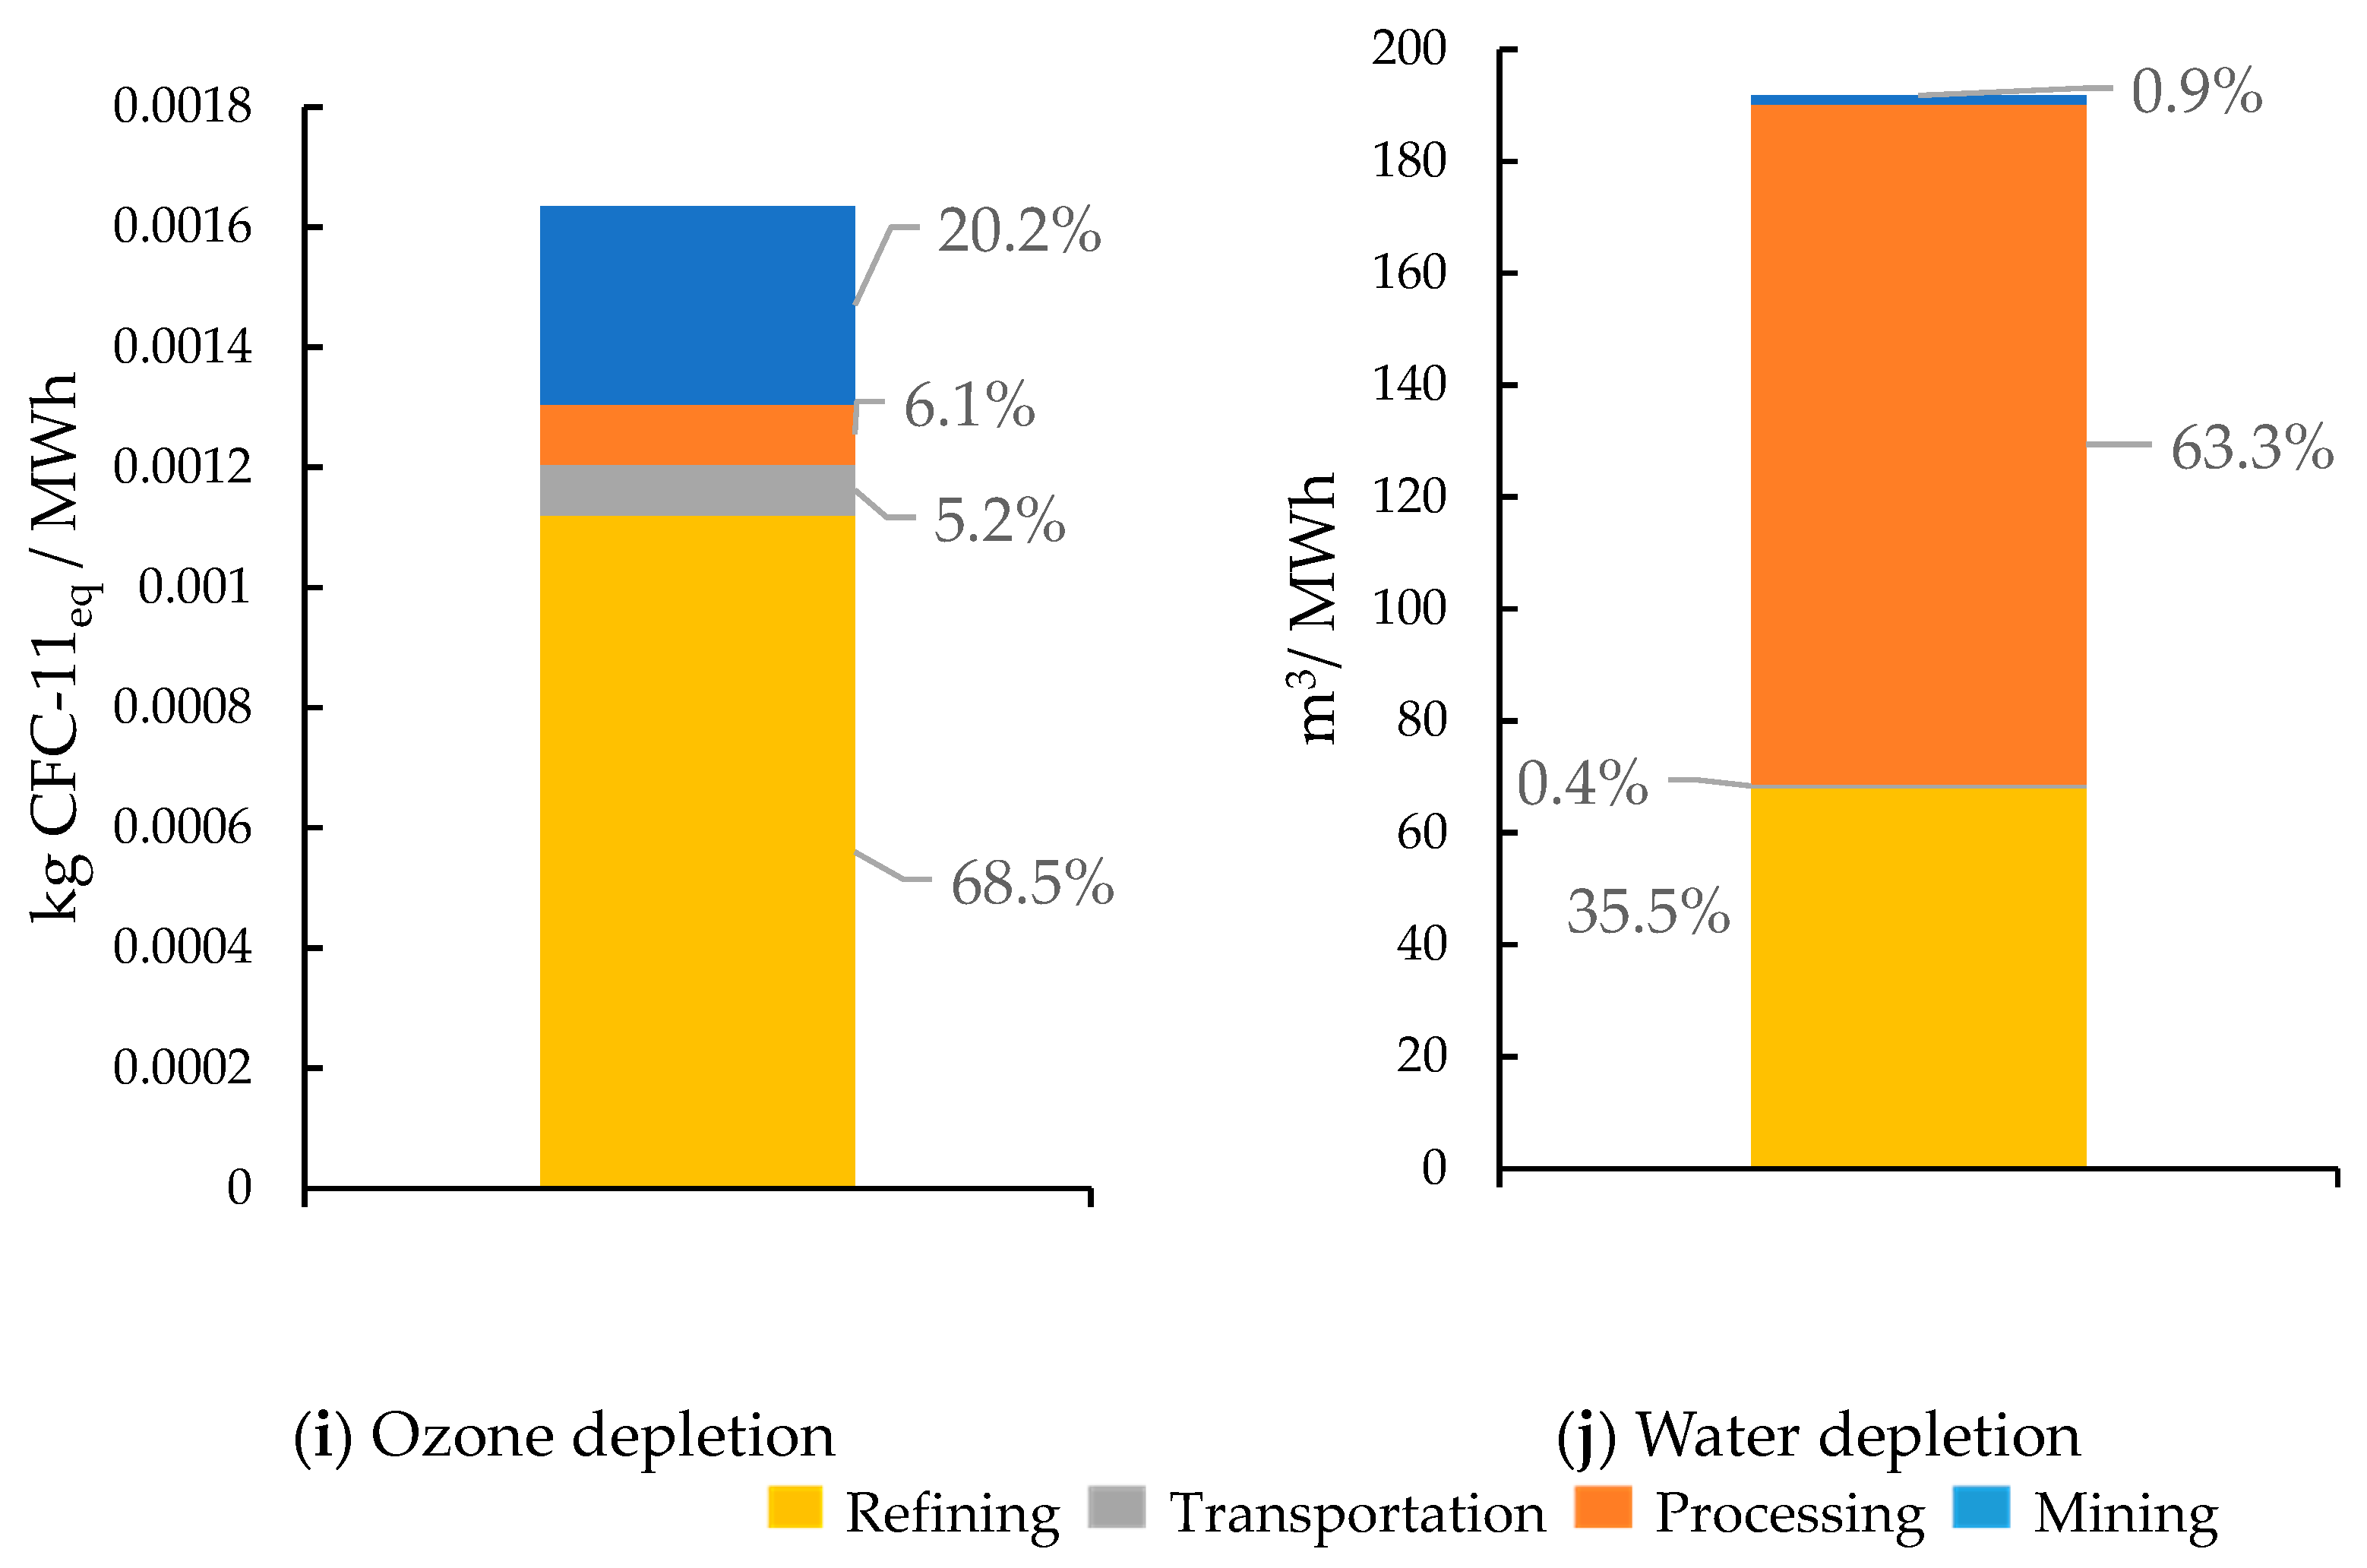
The treatment and disposal of tailings from the processing of Co(OH)2 accounted for the vast majority of both freshwater (FETP) (Figure 4f) and marine ecotoxicity (METP) (Figure 4g) (87.8% of 1989 kg 1,4-DCB and 87.1% of 1727 kg 1,4-DCB, respectively). The terrestrial ecotoxicity (TETP) impacts are spread across the supply chain processes (Figure 4h), where the total release was calculated as 1.1 kg of 1.4-DCB. Refining was the largest contributor to TETP (61.4%) from hydrochloric acid (25.7%), sulfuric acid (17.2%), and sodium hydroxide (9.7%). TETP was influenced by processing of Co(OH)2 (12.1%), stemming from MgO (6.5%) and sulfur (3.7%). Mining accounted for 7.1% of the total TETP impacts. Transportation contributed a higher percentage to terrestrial ecotoxicity than any other impact category (19.0%). These impacts originated from non-exhaust emissions, such as tire, road, and brake wear from the trucks used to transport cobalt products. Refining contributed the largest impact to ozone depletion (ODP) (68.5% of 0.0016 kg CFC-11eq), mostly from the methane tetrachloride emitted during the manufacturing of sodium hydroxide (Figure 4i). Ozone depletion from mining (20.2%) was due to the emissions from the combustion of diesel fuel used in the mining equipment. Processing was the most water-intensive step in the supply chain (63.3% of the total of 192 m3), which was mainly attributed to the loss of water from evaporation at the hydropower facilities used to generate electricity for processing plant operations (60.3%). Although not as water-intensive as processing, refining still accounted for 35.5% of the total water depletion potential (WDP) (Figure 4j). Other major environmental impacts with detailed classification are tabulated in Table S3.
Knowing the relative proportion of environmental impacts per MWh of NMC111 storage across all life cycle stages considered in the base case (Figure S2) helps in visualizing the environmental intensity of each life cycle stage, which provides the opportunity to assess relative risk to local communities and natural bodies, and to identify processes in the supply chain that can be modified. For example, electrifying the mine equipment would significantly reduce the PMFP rate (over 66% of total inventory), thus improving conditions for workers and potentially for local communities. Likewise, improving industrial practices during refining could reduce kg 1,4-DCB release rates to freshwater and marine water bodies, which in this base case represent almost 90% of the total inventory.
3.2. Scenario Analysis
3.2.1. Impact of Ore Grade
The life cycle impacts of mining and processing copper–cobalt ore to produce 1 ton of Co(OH)2 were analyzed across a range of ore grades from 0.05% to 1% for NMC111. While processing lower-grade ore may become economically infeasible, the low-grade scenario was considered for analytical purposes. The results show that as ore grade decreased, the GWP of mining and processing increased according to a power-law relationship, with the GWP increasing substantially for cobalt ore grades of less than 0.3% (Figure 5). With a cobalt grade of 0.05%, the GWP of mining and processing the same amount of Co(OH)2, using base-case assumptions except for ore grade, resulted in a 230% increase in GWP compared to the base-case value (0.3%) (13,606 kg CO2eq versus 4139 kg CO2eq). In the high-ore-grade scenario of 1%, or more than 3 times the base case, the GWP was reduced by 40% compared to the base case (2482 kg CO2eq), illustrating how increasing the ore grade led to reduced mining and processing needs (per kg of cobalt) and, hence, a lower total GWP. Detailed results for varying the ore grade are tabulated in Table S4. The results show that the power-law relationship with decreasing ore grade holds true for all impact categories, though it is less pronounced for water depletion (Figure S3), which is most likely because water consumption was mostly through hydropower and less through hydrometallurgy or other processing routes. This power-law relationship is consistent with observations reported by Eckelman (2010) [69], who noted that energy consumption for mining and beneficiation for nickel, scaled non-linearly with ore grade. Others have noted this as well for copper (e.g., [70,71]), especially for pyrometallurgy routes that use significant fossil-fueled thermal processes. In our case, we fitted the power-law curve to the modeled data. The impact becomes less pronounced as the ore grade increases above 0.5%.
3.2.2. Refining Location
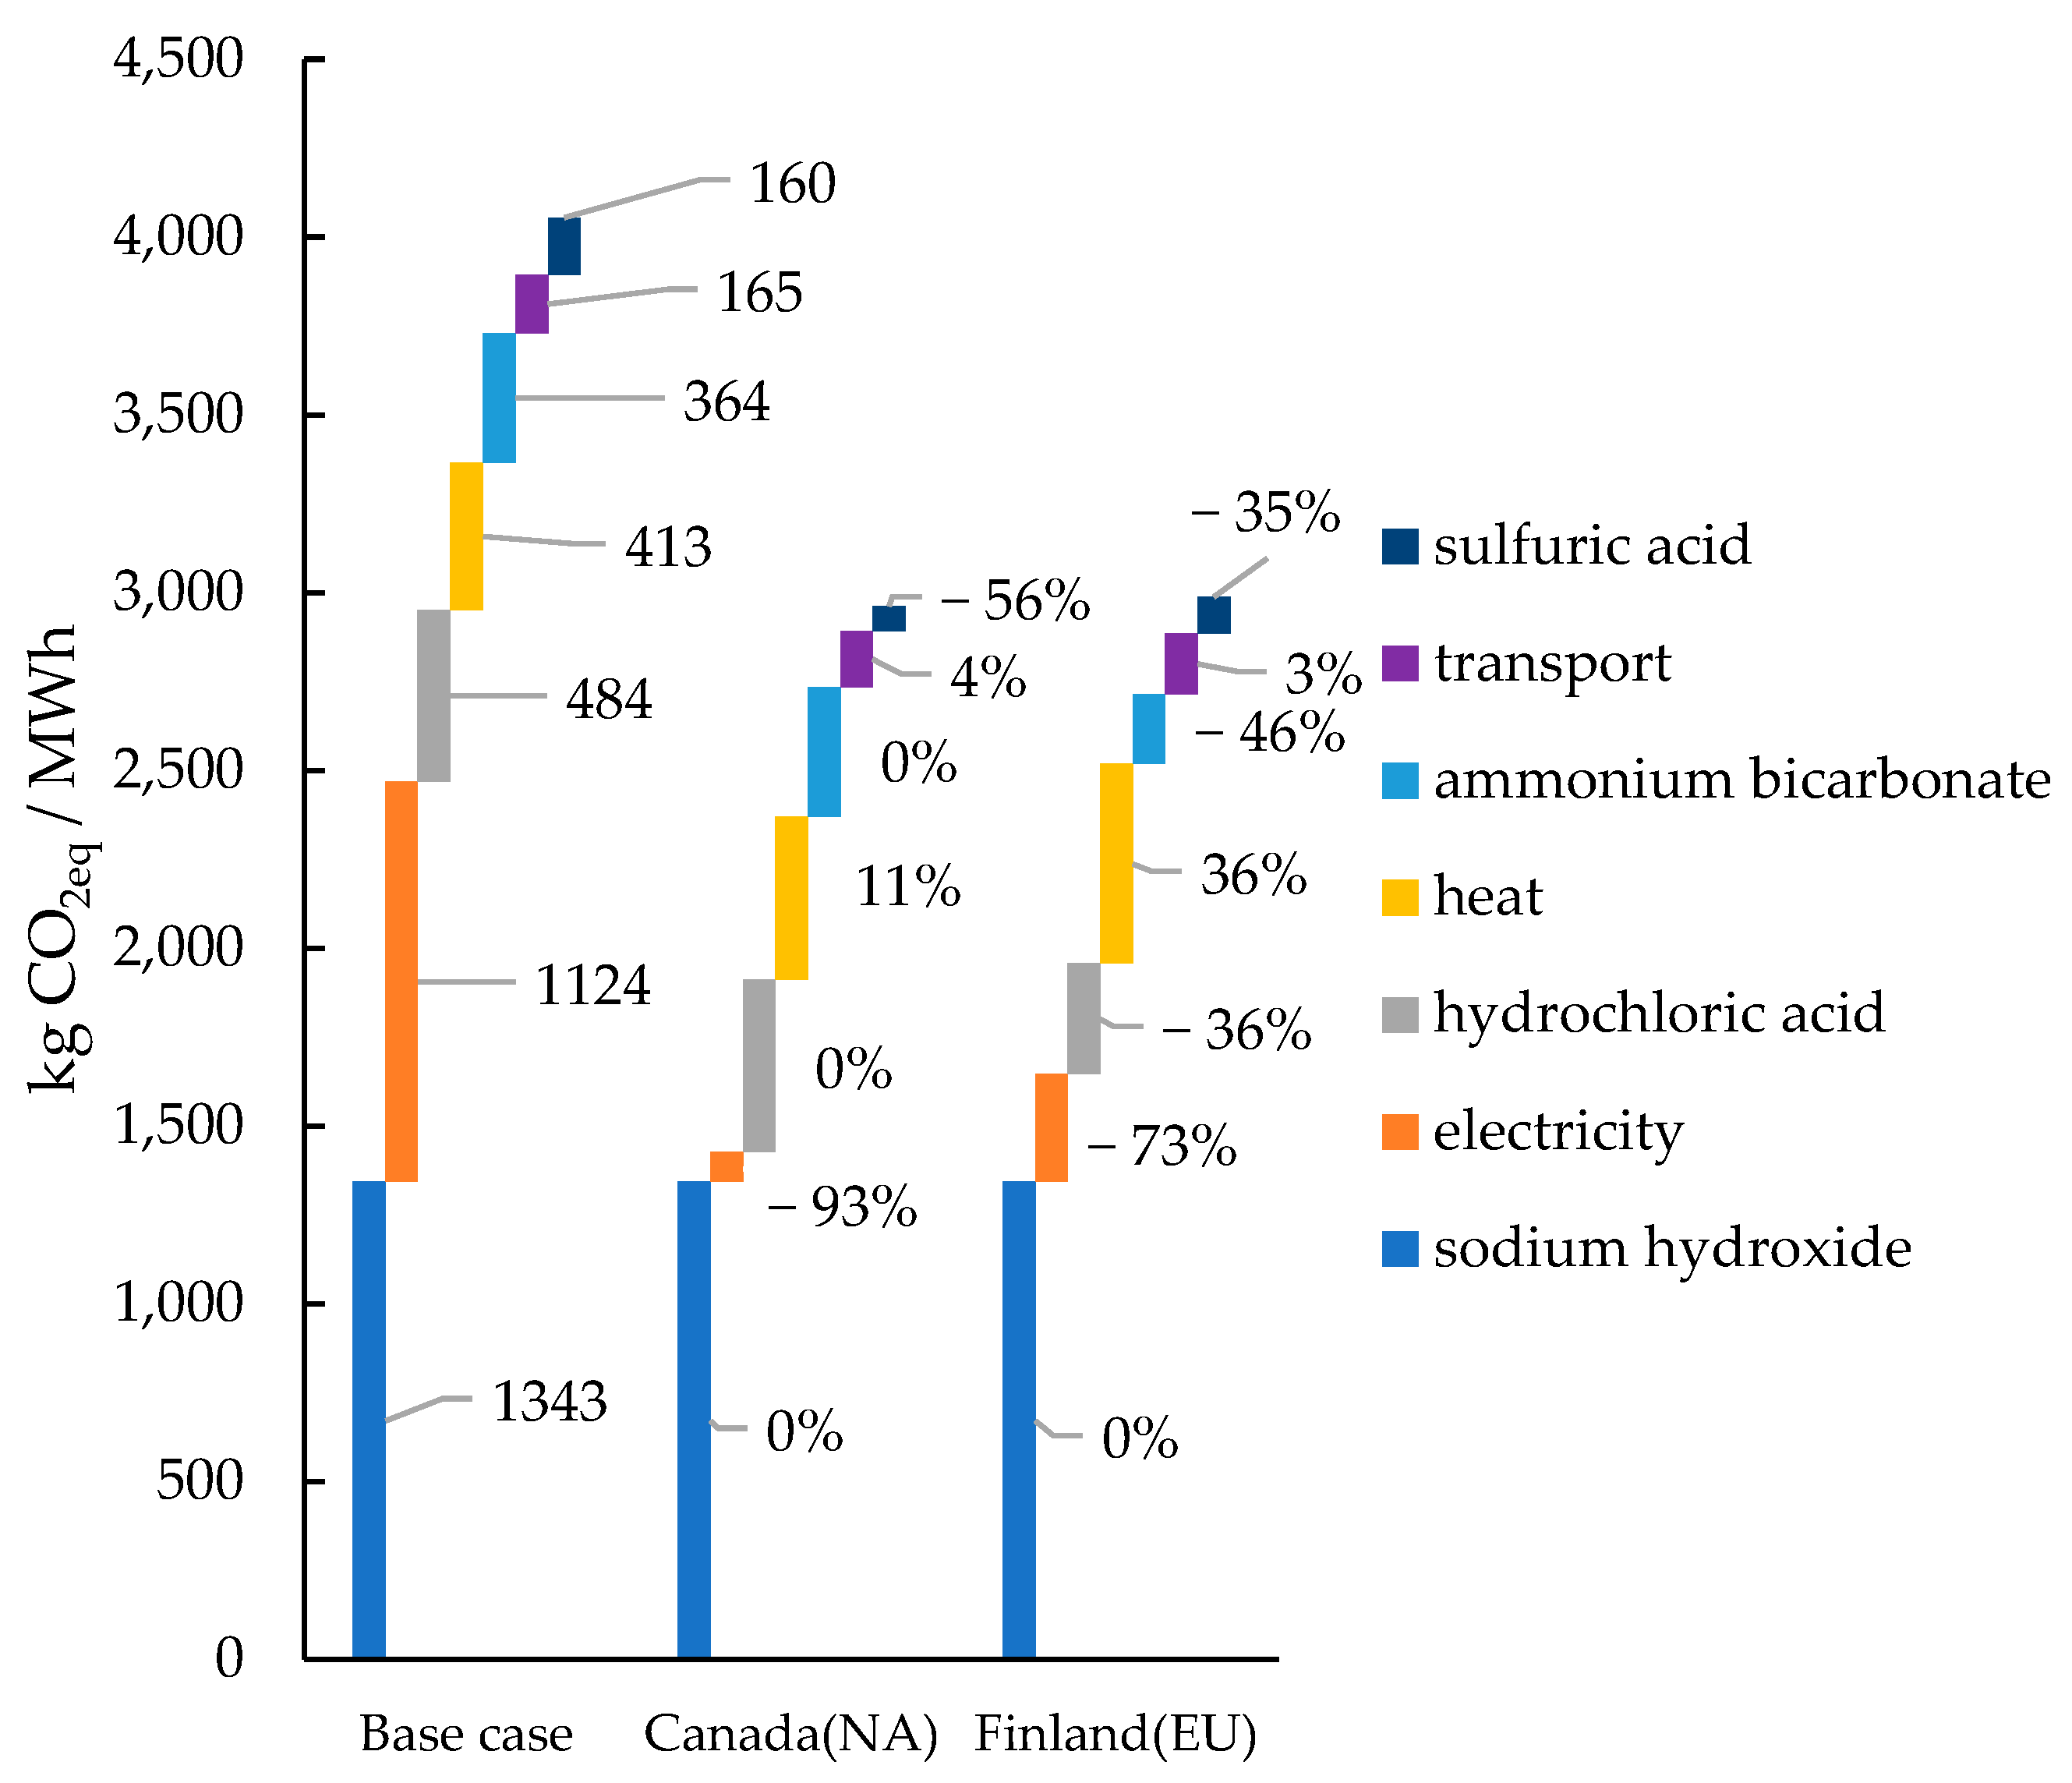
Three locations were chosen for refining cobalt hydroxide to cobalt sulfate (China, Canada, and Finland), each assuming a 0.3% ore grade. Figure 6 shows that the GWP for the base case (8568 kg CO2eq) can be reduced by 11.7% using Canadian routes and 12.4% using the Finland route (to 7568 and 7507 kg CO2eq, respectively) for the NMC111 battery (base case). The largest factor contributing to reduced GWP stems from the electricity mix for the Canada and Finland scenarios. The electricity generated in Ontario, Canada, is dominated by low-carbon generation sources, with hydropower and nuclear being the two largest sources (75%) of regional electricity generation and only 18% coming from carbon-intensive sources [72]. In Finland, the electricity grid mix is composed mostly of low-carbon generation from nuclear, wind, and hydropower sources, with only 29% of electricity production from the high-carbon-footprint sources of coal, natural gas, and biofuels [72].
Freshwater and marine eutrophication and ecotoxicity are almost same for the base case (China) and the Canada scenario, while the Finland scenario yields lesser impacts. Other impacts also show similar trends. Water consumption is highest for the Canada scenario, followed by the Finland and China scenarios.
These less carbon-intensive sources in Canada and Finland contrast with the grid mix in the State Grid Corporation of China (i.e., base case), which is dominated by coal-fired electricity production (>75%) (Ecoinvent v 3.8, [40]). The GWP attributed to transportation to Canada and Finland is 4% and 3% greater, respectively, compared to the base case, while transportation only accounts for a relatively small proportion of the total GWP for the base case (4.8%), Canada (6.7%), and Finland (5.6%). The material and energy components that contribute to the GWP, with percentage changes for Canada (NA) and Finland (EU) (Figure 7), show that the electricity generation mix is the main component impacting the GWP, with a 93% decrease in footprint for Canada and a 73% decrease in Finland.
Water depletion is the only impact category where the impacts for the base case (191.7 m3) are lower than those for Canada (223.83 m3) and Finland (201.2 m3). This difference can be attributed to the higher use of nuclear electricity generation, which is water-intensive, in the Canadian and Finland grid mixes.
3.2.3. Battery Chemistry
Impacts for each category scale linearly and are directly related to the cobalt intensity for NMC111, NMC532, NMC622, NMC811, and NCA LIBs (battery characteristics are given in Table 2 in Section 2.1.1). The process-wise GWP impacts of cobalt for 1 MWh of the five battery chemistries (Figure 8) show that, relative to the base case (location based in China and an ore grade of 0.3%), refining contributes the highest percentage of GWP, followed by processing and mining. Though NCA battery chemistry requires less cobalt per MWh compared to NMC111, NMC532, and NMC622 due to its higher energy density, the larger mass of cobalt required in the NCA battery itself offsets the higher energy density, still leading to a higher environmental load than for a less-cobalt-intensive NMC811 battery. Other impacts of the different processes, calculated from the ReCiPe 2016 Midpoint H analysis, also show similar trends, owing to the environmentally intensive refining procedures in China.
3.2.4. Use
As mentioned in Section 2.1.2, the GWP footprint due to battery augmentation is included as part of this research. Using original cobalt contents for the five different batteries, the results show that the GWP is highest for NMC111 (8647 kg CO2eq/MWh), followed by NMC622 (4287 kgCO2eq/MWh), NMC532 (3630 kg CO2eq/MWh), NCA (3211 kg CO2eq/MWh), and NMC811 (2230 kg CO2eq/MWh), assuming other base-case conditions. In all cases, for a battery capacity of 500 MWh and a 30-year use phase, the original battery would need to be augmented with additional storage capacity at the end of the 3rd, 7th, and 14th years, before a complete replacement in the 21st year. The yearly GWP emissions, due to the original battery manufacturing and subsequent augmentation of the five battery chemistries with 500 MWh capacity, are compared in Figure 9.
3.2.5. Combined Scenario Analysis
We combined the results of all 150 scenarios, in which the ore grade, refinery location, and battery chemistry are varied (see Table 5). The comparative analyses for each environmental impact listed in the ReCiPe 2016 Midpoint H [61] analysis for these scenarios are shown in Figure 10. The importance of battery chemistry (Figure 10), especially for the most-cobalt-intensive NMC111 chemistry, exceeds those of the ore grade and location, even given the noted importance of the former. We note, however, that, as battery chemistries vary away from NMC111, there is still a substantial difference in GWP emission rates by chemistry. For example, the GWP for the NCA battery chemistry and Finland route (2111 kg CO2eq) is nearly half the GWP modeled for the NMC622 and China route (3908 kg CO2eq), assuming a 0.3% ore grade.
For GWP and carcinogenic toxicity, in particular, the dependency of environmental pathways on the ore grade is apparent, and this manifests in a lower (more negative) exponent on the power-law relationship, as shown in Table 7. For the other impact pathways, the dependency on the ore grade is subdued (i.e., a nearly straight-line relationship indicates an exponent close to zero). The results also highlight the highest dependency of the NMC111 chemistry on ore grade amongst all the battery chemistries studied. Production routes with the highest impacts follow the order of China, Canada (NA), and Finland (EU). For all five batteries, the results suggest an 8 to 12% decrease in the GWP in the Canada route and a 12 to 18% decrease in the GWP in the Finland route. The enhanced thermal combustion or chemical processing needed for low-quality ore will lead to impacts on some impact pathways that are higher than others. Variations of the different environmental parameters with ore grade, refining location, and battery chemistry are included in Table S6.
The LCA results were normalized to a common reference using factors introduced by Sleeswijk et al. (2008) [73] for different environmental impacts. Normalized values of all 150 scenarios were analyzed. The comparison of major normalized impacts for an ore grade of 0.3% (Figure 11) shows that freshwater and marine ecotoxicity dominate the environmental impacts. When compared using the actual absolute values, although the magnitudes are less, the environmental impact of FETP and METP are more prominent in comparison to other numbers, owing to the emissions to the marine ecosystem from the life cycle routes. The detailed values are given in SI (Table S7).
The cumulative single score (Pt) for different battery chemistries is highest for NMC111 and lowest for NMC811 for the base case (where the refining location is in China and the ore grade is 0.3%). For the Canada refining location, the highest impact was noted for the NMC622 chemistry and the lowest impact for the NMC811 chemistry. The same trend also is seen in the Finland scenario. Other environmental impacts, when represented using a single-score scale, follow the same pattern as GWP. The results show the range of environmental impacts for the Canada route are between 58% and 65% of the base case, and impacts for the Finland route are between 71% and 76% of base case. This analysis gives an insight into the sensitivity to battery chemistry and refining location for the single-score environmental impacts. Single-score calculations provide a first-order comparison of overall sustainability of different LIB chemistries and cobalt supply chains.
3.3. Statistical Analysis
From the scenario analysis results (Table S6) focusing on GWP, the results ranged from a high of 13,200 kg CO2eq (0.05% ore grade, Chinese refining route, and NMC111 battery) to a low of 1700 kg CO2eq (1% ore grade, Finland refining route, and NMC811 battery). The median was found to be 3040 kg CO2eq.
We have already discussed that GWP varies with ore grade according to an inverse power law (Figure 5); thus, to assess the relative importance of ore grade, relative to other variables, the negative power coefficient was used as the independent variable term (Table 7). The percentage of fossil fuel used in the electricity grid mix (used as a surrogate for location) and cobalt content in the battery were other variables. Correlation coefficients for each relationship are also shown on the right-hand side of the table. The results show that cobalt content in the battery is the highest predictor (R2 = 0.988) of GWP, followed by ore grade (R2 = 0.966) and refining location (R2 = 0.766), when paramaters are assessed for correlation individually.
General factorial regression was also used to analyze the impact of the independent variables. The results showed that ore grade and cobalt content in the battery contributed equally to the GWP footprint. Refining location had a comparatively lesser contribution when compared with the other two parameters.
4. Discussion
The results of this research provide several insights regarding the cobalt supply chain. Addressing Q1 and Q2, no single process accounts for most of the contributions in all impact categories. Impacts from mining varied substantially, depending on which impact pathways were analyzed. Mining contributes significant levels of particulate matter formation potential but has lesser impacts on freshwater eutrophication, freshwater ecotoxicity, marine ecotoxicity, and water depletion. The refining processes led to the highest GWP, ozone depletion, and terrestrial ecotoxicity emissions, while refining contributed less to freshwater eutrophication, freshwater ecotoxicity, marine ecotoxicity, and particulate matter formation. Transportation contributed less than 10% of impacts to most categories compared to other life cycle phases, except for terrestrial ecotoxicity, to which its contribution was nearly 20%.
Addressing Q3, as ore grades decline over time below 0.3% cobalt by weight, the environmental impacts of mining and processing could begin to increase substantially. This finding is noteworthy because with cobalt demand expected to grow, higher ore grades could eventually become depleted below the 0.3% level used in the DRC base case. Alternative sources of cobalt (e.g., reprocessing of tailings or improved value chain) or recycling of batteries may extend the time that higher ore grades are available.
Addressing Q4, additional refinery locations outside of China could reduce the environmental impacts of the cobalt supply chain, but only to a certain degree. We found that altering location to Canada in North America and to Finland in Europe reduced the overall GWP, even given the offset from the longer travel distances. In these cases, the lower carbon intensiveness of the grid mix was the decisive factor. Addressing Q5, environmental impacts from the cobalt supply chain are directly proportional to the cobalt intensity of the battery. Reducing the cobalt intensity lowered the GWP by nearly half, as well as reducing other environmental pathway impacts.
The impacts in the presented study have been compared with values already available in the published literature (Table 8). The numbers shown for this study are for the base case with a refining location in China and an ore grade of 0.3%. However, the studies differ in several crucial aspects: battery chemistry, data sourcing and modeling—especially regarding the energy and material requirements along the supply chain—refining location, and the adopted LCIA method. As a result, we observe large differences among the reported impacts. For example, GWP is the lowest in this study, while TETP is the highest by an order of magnitude. Interestingly, the same study (Jiang et al. (2023) [74]) that reports the lowest TETP reports an METP that is 10,000 times larger than that found in this study (for the same battery chemistry). Peters et al. (2017) [42], in their review of the literature at the time, reported a range of 40 to 250 kg CO2eq per kWh. The HTP in this study is roughly in the middle of the range in the literature presented in Table 8. Overall, these differences highlight the importance of system boundaries and input assumptions as well as the influence of updated data sets when comparing results from different studies. Moreover, the presented studies deal with complete-battery LCA, with some including the manufacturing of all the components, and do not allocate environmental impacts only to the cobalt portion. We could not find any publications which investigate the environmental impacts of only the cobalt supply chain on batteries; therefore, direct comparison can lead to incorrect conclusions. At the same time, a careful analysis of these systems and assumptions can help identify opportunities to reduce impacts if, for example, lower impacts in a study can be explained by switching energy sources or certain processes that use less water or energy.
Our results show that electricity used during the refining process is the major contributor to global warming potential, freshwater ecotoxicity, and carcinogenic and non-carcinogenic emissions. This stems from the diesel fuel used in refining processes that also contributes to ozone depletion. Transportation of refined products to battery manufacturing sites also depends on liquid fuels and can contribute to terrestrial ecotoxicity. Other mining and material separation processes such as blasting of the ore can have direct impact as well. It has already been reported that when the ore grade decreases, there is an increase in or no effect on environmental impacts.
Lastly, because battery storage systems will need to be augmented to maintain capacity and dispatch electricity more readily from intermittent generation sources, we can expect ongoing demand for cobalt. The extent of the battery augmentation needed for future deployments depends, in part, on how batteries are used in BESSs (e.g., for dispatching electricity when wind and solar are inactive, for maintaining frequency from variability of wind and solar resources, etc.). As battery technology and grid management improve with time, the upper limit of lifetime charge/discharge cycles might improve as well, also reducing the need for augmentation.
5. Conclusions
The results from this study offer many opportunities for reducing the environmental impacts of the cobalt supply chain for LIBs used in BESSs and improving environmental sustainability. The results indicate that the largest influence on the environmental sustainability of the cobalt supply chain was that of battery type selection; therefore, reducing cobalt levels in future battery chemistries will lead to lower impacts from the cobalt, though it is unknown whether metals replacing cobalt are more or less environmentally sustainable. There may be additional impacts from other materials and processes, such as the refining of nickel or graphite, that could offset any environmental gains from reduced cobalt requirements. Each of the critical materials found in these batteries should be assessed in an integrated LCA, which was not possible in this study.
Such an integrated LCA could also include alternatives to diesel-powered mining equipment, which contributes most of the environmental impacts. The potential to substitute equipment powered by diesel fuel with equipment (even partially) powered by batteries could be one strategy for reducing these impacts. A recent case study highlights the potential to reduce the GWP of mining operations through the electrification of mining equipment [80]. Earl et al. (2022) [81] suggest that current mining practices are unsustainable and that responsible sourcing of ores, especially in the largest producer in the world, the DRC, is needed. In addition, a circular cobalt economy is needed via recycling and reuse. However, they observe that advances in identifying primary and secondary sources of cobalt, mining methods, and recycling are yet to be fully optimized. The lack of standardization of LIB chemistries and designs is offered as a particular handicap to improving cobalt sustainability.
As also observed by Earl et al. (2022) [81], LIB recycling is a nascent industry, and no recycling technologies are currently used at scale; the potential for environmental impact reduction from using recycled versus virgin cobalt could be substantial. However, as demand for cobalt continues to scale, efforts should be made to quantify the impacts of recycling, as its share of cobalt production will likely grow in the future.
Bamana et al. (2021) [82] offer important content on the responsible mining idea by focusing on human health and quality of life associated with cobalt mining in Lualaba, DRC. The authors focus on artisanal mining and gather data on social impacts such as health, safety, migration, child labor, and others to inform a social LCA approach Social LCA can also be conducted to understand the impact on human well-being from emerging technologies. Environmental sustainability thus should be measured not only in terms of technical benefits, but also in terms of quality of life. They suggest that the joint use of social and environmental LCAs will help better inform the choice of mining technologies and practices to minimize impacts [82].
Finally, although this study focuses on cobalt, it expands on the environmental impact pathways that are typically reported. We include results on all ReCiPe 2016 (Midpoint H) categories that are included in the database. This choice was made to highlight the global (CO2eq) versus local impacts (all other categories) that are manifested through acquisition of cobalt. Our study also includes the element of time through the augmentation of the BESS, which will be necessary to maintain usable capacity when paired with intermittent energy generation. This more-comprehensive treatment of the supply chain and environmental impacts could provide other opportunities for understanding where and when impacts might occur, and how to mitigate them.
Supplementary Materials
The following supporting information can be downloaded at: https://www.mdpi.com/article/10.3390/su16051910/s1, Figure S1: Projected cobalt demand, 2020–2040; Figure S2: Relative proportion of environmental impacts per MWh of NMC111 storage, across all life cycle stages considered in the base case; Figure S3: Impact of ore grade on water depletion of mining and processing of Co(OH)2; Figure S4: Single-score results for environmental impacts comparison of different battery chemistries (ore grade—0.3%); Table S1: Top five global producers of cobalt; Table S2: LCA studies of LIBs published in the literature; Table S3: Base case contribution analysis results; Table S4: LCA results for mining and processing with varying ore grades; Table S5: LCA results for three different battery chemistries for an ore grade of 0.3% and a refining location in China; Table S6: LCA results for the combined scenarios; Table S7: Single-score results for battery chemistries and locations for an ore grade of 0.3%.
Author Contributions
J.D.—writing: original draft preparation, visualization, conceptualization, and formal analysis; A.K.—writing: original draft preparation and formal analysis; A.U.R.—formal analysis; R.V.—formal analysis; M.H.Y.—writing: review and editing, supervision, project administration, and funding acquisition. All authors have read and agreed to the published version of the manuscript.
Funding
This research was sponsored by the “Comparing Electricity Options”, Industrial Affiliates Program of the Bureau of Economic Geology and the Jackson School of Geosciences, The University of Texas at Austin.
Institutional Review Board Statement
Not Applicable.
Informed Consent Statement
Not Applicable.
Data Availability Statement
Data are contained within the article.
Conflicts of Interest
Author Rahul Verma was employed by the company Fractal Business Analytics LLC. The remaining authors declare that the research was conducted in the absence of any commercial or financial relationships that could be construed as a potential conflict of interest. The funders had no role in the design of the study; in the collection, analyses, or interpretation of data; in the writing of the manuscript; or in the decision to publish the results.
References
- Pellow, M.A.; Ambrose, H.; Mulvaney, D.; Betita, R.; Shaw, S. Research gaps in environmental life cycle assessments of lithium ion batteries for grid-scale stationary energy storage systems: End-of-life options and other issues. Sustain. Mater. Technol. 2020, 23, e00120. [Google Scholar] [CrossRef]
- U.S. Department of Energy. Energy Storage Grand Challenge: Energy Storage Market Report; U.S Department of Energy: Washington, DC, USA, 2020. Available online: https://www.energy.gov/sites/prod/files/2020/12/f81/Energy%20Storage%20Market%20Report%202020_0.pdf (accessed on 25 May 2023).
- International Energy Agency (IEA). The Role of Critical Minerals in Clean Energy Transitions; IEA: Paris, France, 2021; Available online: https://www.iea.org/reports/the-role-of-critical-minerals-in-clean-energy-transitions (accessed on 25 May 2023).
- The Organisation for Economic Co-operation and Development (OECD). Interconnected Supply Chains: A Comprehensive Look at due Diligence Challenges and Opportunities Sourcing Cobalt and Copper from the Democratic Republic of the Congo. Responsible Business Conduct. 2019. Available online: https://delvedatabase.org/resources/interconnected-supply-chains-a-comprehensive-look-at-due-diligence-challenges-and-opportunities-sourcing-cobalt-and-copper-from-the-democratic-republic-of-the-congo (accessed on 25 May 2023).
- U.S. Geological Survey (USGS). Mineral Commodity Summaries 2022—Cobalt; U.S. Geological Survey: Reston, VA, USA, 2022. Available online: https://pubs.usgs.gov/periodicals/mcs2022/mcs2022-cobalt.pdf (accessed on 25 May 2023).
- U.S. Geological Survey (USGS). Mineral Commodity Summaries 2023; U.S. Geological Survey: Reston, VA, USA, 2023; 210p. Available online: https://pubs.usgs.gov/periodicals/mcs2023/mcs2023.pdf (accessed on 25 May 2023).
- Cobalt Institute. State of Cobalt Market Report. 2021. Available online: https://www.cobaltinstitute.org/wp-content/uploads/2021/09/Cobalt-Institute-State-of-the-Cobalt-Market-Report_2020.pdf (accessed on 25 May 2023).
- The White House. FACT SHEET: Securing a Made in America Supply Chain for Critical Minerals. 2022. Available online: https://www.whitehouse.gov/briefing-room/statements-releases/2022/02/22/fact-sheet-securing-a-made-in-america-supply-chain-for-critical-minerals/ (accessed on 25 May 2023).
- Nriagu, J.O. Toxic metal pollution in Africa. Sci. Total. Environ. 1992, 121, 1–37. [Google Scholar] [CrossRef]
- Banza, C.L.N.; Nawrot, T.S.; Haufroid, V.; Decrée, S.; De Putter, T.; Smolders, E.; Kabyla, B.I.; Luboya, O.N.; Ilunga, A.N.; Mutombo, A.M.; et al. High human exposure to cobalt and other metals in Katanga, a mining area of the Democratic Republic of Congo. Environ. Res. 2009, 109, 745–752. [Google Scholar] [CrossRef] [PubMed]
- United Nations Environment Programme (UNEP). Water Issues in the Democratic Republic of Congo: Challenges and Opportunities—Technical Report. 2011. Available online: https://reliefweb.int/report/democratic-republic-congo/water-issues-democratic-republic-congo-challenges-and-opportunities (accessed on 25 May 2023).
- Slack, J.F.; Kimball, B.E.; Shedd, K.B. Cobalt. Report 1802F. Professional Paper; USGS Publications Warehouse: Reston, VA, USA, 2017. Available online: https://pubs.er.usgs.gov/publication/pp1802F (accessed on 25 May 2023).
- Shengo, M.; Kime, M.-B.; Mambwe, M.; Nyembo, T. A review of the beneficiation of copper-cobalt-bearing minerals in the Democratic Republic of Congo. J. Sustain. Min. 2019, 18, 226–246. [Google Scholar] [CrossRef]
- Muimba-Kankolongo, A.; Nkulu, C.B.L.; Mwitwa, J.; Kampemba, F.M.; Nabuyanda, M.M.; Haufroid, V.; Smolders, E.; Nemery, B. Contamination of water and food crops by trace elements in the African Copperbelt: A collaborative cross-border study in Zambia and the Democratic Republic of Congo. Environ. Adv. 2021, 6, 100103. [Google Scholar] [CrossRef]
- Schmidt, T.; Buchert, M.; Schebek, L. Investigation of the primary production routes of nickel and cobalt products used for Li-ion batteries. Resour. Conserv. Recycl. 2016, 112, 107–122. [Google Scholar] [CrossRef]
- Finnveden, G.; Hauschild, M.Z.; Ekvall, T.; Guinée, J.B.; Heijungs, R.; Hellweg, S.; Koehler, A.; Pennington, D.; Suh, S. Recent developments in Life Cycle Assessment. J. Environ. Manag. 2009, 91, 1–21. [Google Scholar] [CrossRef]
- Kim, B.; Azzaro-Pantel, C.; Pietrzak-David, M.; Maussion, P. Life cycle assessment for a solar energy system based on reuse components for developing countries. J. Clean. Prod. 2018, 208, 1459–1468. [Google Scholar] [CrossRef]
- Das, J. Comparative life cycle GHG emission analysis of conventional and electric vehicles in India. Environ. Dev. Sustain. 2022, 24, 13294–13333. [Google Scholar] [CrossRef]
- Xia, X.; Li, P. A review of the life cycle assessment of electric vehicles: Considering the influence of batteries. Sci. Total. Environ. 2021, 814, 152870. [Google Scholar] [CrossRef]
- Li, P.; Xia, X.; Guo, J. A review of the life cycle carbon footprint of electric vehicle batteries. Sep. Purif. Technol. 2022, 296, 121389. [Google Scholar] [CrossRef]
- Chen, Q.; Lai, X.; Gu, H.; Tang, X.; Gao, F.; Han, X.; Zheng, Y. Investigating carbon footprint and carbon reduction potential using a cradle-to-cradle LCA approach on lithium-ion batteries for electric vehicles in China. J. Clean. Prod. 2022, 369, 133342. [Google Scholar] [CrossRef]
- Hsu, D.D.; O’donoughue, P.; Fthenakis, V.; Heath, G.A.; Kim, H.C.; Sawyer, P.; Choi, J.; Turney, D.E. Life Cycle Greenhouse Gas Emissions of Crystalline Silicon Photovoltaic Electricity Generation. J. Ind. Ecol. 2012, 16, S122–S135. [Google Scholar] [CrossRef]
- Arshad, F.; Lin, J.; Manurkar, N.; Fan, E.; Ahmad, A.; Tariq, M.-U.; Wu, F.; Chen, R.; Li, L. Life Cycle Assessment of Lithium-ion Batteries: A Critical Review. Resour. Conserv. Recycl. 2022, 180, 106164. [Google Scholar] [CrossRef]
- Tao, Y.; Wang, Z.; Wu, B.; Tang, Y.; Evans, S. Environmental life cycle assessment of recycling technologies for ternary lithium-ion batteries. J. Clean. Prod. 2023, 389, 136008. [Google Scholar] [CrossRef]
- Guven, D.; Kayalica, M.O. Life-cycle assessment and life-cycle cost assessment of lithium-ion batteries for passenger ferry. Transp. Res. Part D Transp. Environ. 2023, 115, 103586. [Google Scholar] [CrossRef]
- Jiang, S.; Hua, H.; Zhang, L.; Liu, X.; Wu, H.; Yuan, Z. Environmental impacts of hydrometallurgical recycling and reusing for manufacturing of lithium-ion traction batteries in China. Sci. Total. Environ. 2022, 811, 152224. [Google Scholar] [CrossRef]
- Yudhistira, R.; Khatiwada, D.; Sanchez, F. A comparative life cycle assessment of lithium-ion and lead-acid batteries for grid energy storage. J. Clean. Prod. 2022, 358, 131999. [Google Scholar] [CrossRef]
- Chordia, M.; Nordelöf, A.; Ellingsen, L.A.-W. Environmental life cycle implications of upscaling lithium-ion battery production. Int. J. Life Cycle Assess. 2021, 26, 2024–2039. [Google Scholar] [CrossRef]
- Le Varlet, T.; Schmidt, O.; Gambhir, A.; Few, S.; Staffell, I. Comparative life cycle assessment of lithium-ion battery chemistries for residential storage. J. Energy Storage 2020, 28, 101230. [Google Scholar] [CrossRef]
- Sun, X.; Luo, X.; Zhang, Z.; Meng, F.; Yang, J. Life cycle assessment of lithium nickel cobalt manganese oxide (NCM) batteries for electric passenger vehicles. J. Clean. Prod. 2020, 273, 123006. [Google Scholar] [CrossRef]
- Wang, F.; Deng, Y.; Yuan, C. Life cycle assessment of lithium oxygen battery for electric vehicles. J. Clean. Prod. 2020, 264, 121339. [Google Scholar] [CrossRef]
- Cusenza, M.A.; Bobba, S.; Ardente, F.; Cellura, M.; Di Persio, F. Energy and environmental assessment of a traction lithium-ion battery pack for plug-in hybrid electric vehicles. J. Clean. Prod. 2019, 215, 634–649. [Google Scholar] [CrossRef]
- Vandepaer, L.; Cloutier, J.; Bauer, C.; Amor, B. Integrating Batteries in the Future Swiss Electricity Supply System: A Consequential Environmental Assessment. J. Ind. Ecol. 2019, 23, 709–725. [Google Scholar] [CrossRef]
- Delgado, M.A.S.; Usai, L.; Ellingsen, L.A.-W.; Pan, Q.; Strømman, A.H. Comparative Life Cycle Assessment of a Novel Al-Ion and a Li-Ion Battery for Stationary Applications. Materials 2019, 12, 3270. [Google Scholar] [CrossRef] [PubMed]
- Dai, Q.; Kelly, J.C.; Gaines, L.; Wang, M. Life Cycle Analysis of Lithium-Ion Batteries for Automotive Applications. Batteries 2019, 5, 48. [Google Scholar] [CrossRef]
- Ryan, N.A.; Lin, Y.; Mitchell-Ward, N.; Mathieu, J.L.; Johnson, J.X. Use-Phase Drives Lithium-Ion Battery Life Cycle Environmental Impacts When Used for Frequency Regulation. Environ. Sci. Technol. 2018, 52, 10163–10174. [Google Scholar] [CrossRef] [PubMed]
- Schenker, V.; Oberschelp, C.; Pfister, S. Regionalized life cycle assessment of present and future lithium production for Li-ion batteries. Resour. Conserv. Recycl. 2022, 187, 106611. [Google Scholar] [CrossRef]
- Farjana, S.H.; Huda, N.; Mahmud, M.P. Life cycle assessment of cobalt extraction process. J. Sustain. Min. 2019, 18, 150–161. [Google Scholar] [CrossRef]
- Mistry, M.; Gediga, J.; Boonzaier, S. Life cycle assessment of nickel products. Int. J. Life Cycle Assess. 2016, 21, 1559–1572. [Google Scholar] [CrossRef]
- Engels, P.; Cerdas, F.; Dettmer, T.; Frey, C.; Hentschel, J.; Herrmann, C.; Mirfabrikikar, T.; Schueler, M. Life cycle assessment of natural graphite production for lithium-ion battery anodes based on industrial primary data. J. Clean. Prod. 2022, 336, 130474. [Google Scholar] [CrossRef]
- Farjana, S.H.; Huda, N.; Mahmud, M.P. Impacts of aluminum production: A cradle to gate investigation using life-cycle assessment. Sci. Total. Environ. 2019, 663, 958–970. [Google Scholar] [CrossRef]
- Peters, J.F.; Baumann, M.; Zimmermann, B.; Braun, J.; Weil, M. The environmental impact of Li-Ion batteries and the role of key parameters—A review. Renew. Sustain. Energy Rev. 2017, 67, 491–506. [Google Scholar] [CrossRef]
- Majeau-Bettez, G.; Hawkins, T.R.; Strømman, A.H. Life Cycle Environmental Assessment of Lithium-Ion and Nickel Metal Hydride Batteries for Plug-In Hybrid and Battery Electric Vehicles. Environ. Sci. Technol. 2011, 45, 4548–4554. [Google Scholar] [CrossRef] [PubMed]
- Ellingsen, L.A.; Majeau-Bettez, G.; Singh, B.; Srivastava, A.K.; Valøen, L.O.; Strømman, A.H. Life Cycle Assessment of a Lithium-Ion Battery Vehicle Pack. J. Ind. Ecol. 2013, 18, 113–124. [Google Scholar] [CrossRef]
- Kallitsis, E.; Korre, A.; Kelsall, G.; Kupfersberger, M.; Nie, Z. Environmental life cycle assessment of the production in China of lithium-ion batteries with nickel-cobalt-manganese cathodes utilising novel electrode chemistries. J. Clean. Prod. 2020, 254, 120067. [Google Scholar] [CrossRef]
- Dai, Q.; Kelly, J.C.; Elgowainy, A. Cobalt Life Cycle Analysis Update for the GREET® Model. Argonne National Lab. 2018. Available online: https://greet.es.anl.gov/publication-update_cobalt (accessed on 12 November 2023).
- Kelly, J.C.; Dai, Q.; Wang, M. Globally regional life cycle analysis of automotive lithium-ion nickel manganese cobalt batteries. Mitig. Adapt. Strat. Glob. Chang. 2020, 25, 371–396. [Google Scholar] [CrossRef]
- Crenna, E.; Gauch, M.; Widmer, R.; Wäger, P.; Hischier, R. Towards more flexibility and transparency in life cycle inventories for Lithium-ion batteries. Resour. Conserv. Recycl. 2021, 170, 105619. [Google Scholar] [CrossRef]
- Farjana, S.H.; Huda, N.; Mahmud, M.A.P. Life-Cycle environmental impact assessment of mineral industries. IOP Conf. Ser. Mater. Sci. Eng. 2018, 351, 012016. [Google Scholar] [CrossRef]
- Rinne, M.; Elomaa, H.; Porvali, A.; Lundström, M. Simulation-based life cycle assessment for hydrometallurgical recycling of mixed LIB and NiMH waste. Resour. Conserv. Recycl. 2021, 170, 105586. [Google Scholar] [CrossRef]
- Zhang, T.; Bai, Y.; Shen, X.; Zhai, Y.; Ji, C.; Ma, X.; Hong, J. Cradle-to-gate life cycle assessment of cobalt sulfate production derived from a nickel–copper–cobalt mine in China. Int. J. Life Cycle Assess. 2021, 26, 1198–1210. [Google Scholar] [CrossRef]
- Wernet, G.; Bauer, C.; Steubing, B.; Reinhard, J.; Moreno-Ruiz, E.; Weidema, B. The ecoinvent database version 3 (part I): Overview and methodology. Int. J. Life Cycle Assess. 2016, 21, 1218–1230. [Google Scholar] [CrossRef]
- Nuss, P.; Eckelman, M.J. Life Cycle Assessment of Metals: A Scientific Synthesis. PLoS ONE 2014, 9, e101298. [Google Scholar] [CrossRef]
- Arvidsson, R.; Chordia, M.; Nordelöf, A. Comments on “Life cycle assessment of cobalt extraction process” by Farjana et al. (2019). J. Sustain. Min. 2020, 19, 3–21. [Google Scholar] [CrossRef]
- Arvidsson, R.; Chordia, M.; Nordelöf, A. Quantifying the life-cycle health impacts of a cobalt-containing lithium-ion battery. Int. J. Life Cycle Assess. 2022, 27, 1106–1118. [Google Scholar] [CrossRef]
- ISO 14040:2006; Environmental Management—Life Cycle Assessment—Principles and Framework, 2nd ed. International Organization of Standardization: Geneva, Switzerland, 2006.
- ISO 14044:2006; Environmental management—Life Cycle Assessment—Requirements and Guidelines. International Organization of Standardization: Geneva, Switzerland, 2006.
- PE International. Harmonization of LCA Methodologies for Metals. PE International. 2014. Available online: http://www.euromines.org/files/publications/harmonization-lca-methodologies-metals.pdf (accessed on 25 May 2023).
- Da Silva Lima, L.; Quartier, M.; Buchmayr, A.; Sanjuan-Delmás, D.; Laget, H.; Corbisier, D.; Mertens, J.; Dewulf, J. Life cycle assessment of lithium-ion batteries and vanadium redox flow batteries-based renewable energy storage systems. Sustain. Energy Technol. Assess. 2021, 46, 101286. [Google Scholar] [CrossRef]
- Althaus, H.-J.; Classen, M. Life Cycle Inventories of Metals and Methodological Aspects of Inventorying Material Resources in ecoinvent (7 pp). Int. J. Life Cycle Assess. 2004, 10, 43–49. [Google Scholar] [CrossRef]
- Huijbregts, M.A.J.; Steinmann, Z.J.N.; Elshout, P.M.F.; Stam, G.; Verones, F.; Vieira, M.; Zijp, M.; Hollander, A.; van Zelm, R. ReCiPe2016: A harmonised life cycle impact assessment method at midpoint and endpoint level. Int. J. Life Cycle Assess. 2017, 22, 138–147. [Google Scholar] [CrossRef]
- U.S. Energy Information Administration (EIA). Energy and the Environment Explained: Where Greenhouse Gases Come from. U.S. Energy Information Administration. 2021. Available online: https://www.eia.gov/energyexplained/energy-and-the-environment/where-greenhouse-gases-come-from.php (accessed on 10 April 2023).
- China Molybdenum. Annual Report. China Molybdenum Co., Ltd. 2018. Available online: https://www.miningnewsfeed.com/reports/annual/ChinaMolybdenumCoLtd_Annual_Report_2018.pdf (accessed on 25 May 2023).
- Golder Associates. Environmental Impact Assessment Tenke Fungurume Project. Golder Associates. 2007. Available online: https://www.afdb.org/fileadmin/uploads/afdb/Documents/Environmental-and-Social-Assessments/adb-bd-if-2007-158-en-drc-tenke-rap-and-executive-summary.pdf (accessed on 25 May 2023).
- Sanders, M. Lithium-Ion Battery Raw Material Supply and Demand 2016–2025; Avicenne Energy: Paris, France, 2017; Available online: http://www.avicenne.com/pdf/Lithium-Ion%20Battery%20Raw%20Material%20Supply%20and%20Demand%202016-2025%20C.%20Pillot%20-%20M.%20Sanders%20Presentation%20at%20AABC-US%20San%20Francisco%20June%202017.pdf (accessed on 25 May 2023).
- Farchy, J.; Warren, H. China Has a Secret Weapon in the Race to Dominate Electric Cars. Bloomberg. 2018. Available online: https://www.bloomberg.com/graphics/2018-china-cobalt/ (accessed on 25 May 2023).
- Li, Y.; Hou, X.; Zhang, W.; Xiong, W.; Wang, L.; Zhang, S.; Wang, P.; Wang, C. Integration of life cycle assessment and statistical analysis to understand the influence of rainfall on WWTPs with combined sewer systems. J. Clean. Prod. 2018, 172, 2521–2530. [Google Scholar] [CrossRef]
- Hussien, A.; Saleem, A.A.; Mushtaha, E.; Jannat, N.; Al-Shammaa, A.; Bin Ali, S.; Assi, S.; Al-Jumeily, D. A statistical analysis of life cycle assessment for buildings and buildings’ refurbishment research. Ain Shams Eng. J. 2023, 14, 102143. [Google Scholar] [CrossRef]
- Eckelman, M.J. Facility-level energy and greenhouse gas life-cycle assessment of the global nickel industry. Resour. Conserv. Recycl. 2010, 54, 256–266. [Google Scholar] [CrossRef]
- Norgate, T.; Haque, N. Energy and greenhouse gas impacts of mining and mineral processing operations. J. Clean. Prod. 2010, 18, 266–274. [Google Scholar] [CrossRef]
- Memary, R.; Giurco, D.; Mudd, G.; Mason, L. Life cycle assessment: A time-series analysis of copper. J. Clean. Prod. 2012, 33, 97–108. [Google Scholar] [CrossRef]
- International Energy Agency (IEA). World Energy Statistics; IEA: Paris, France, 2021; Available online: https://www.iea.org/data-and-statistics/data-product/world-energy-statistics-and-balances (accessed on 11 March 2022).
- Sleeswijk, A.W.; van Oers, L.F.; Guinée, J.B.; Struijs, J.; Huijbregts, M.A. Normalisation in product life cycle assessment: An LCA of the global and European economic systems in the year 2000. Sci. Total Environ. 2008, 390, 227–240. [Google Scholar] [CrossRef] [PubMed]
- Jiang, T.; Wang, H.; Jin, Q. Comparison of three typical lithium-ion batteries for pure electric vehicles from the perspective of life cycle assessment. Clean Technol. Environ. Policy 2023, 26, 331–350. [Google Scholar] [CrossRef]
- Gutsch, M.; Leker, J. Costs, carbon footprint, and environmental impacts of lithium-ion batteries—From cathode active material synthesis to cell manufacturing and recycling. Appl. Energy 2024, 353, 122132. [Google Scholar] [CrossRef]
- Tabrizi, M.K.; Bonalumi, D.; Lozza, G.G. Analyzing the global warming potential of the production and utilization of lithium-ion batteries with nickel-manganese-cobalt cathode chemistries in European Gigafactories. Energy 2024, 288, 129622. [Google Scholar] [CrossRef]
- Popien, J.-L.; Thies, C.; Barke, A.; Spengler, T.S. Comparative sustainability assessment of lithium-ion, lithium-sulfur, and all-solid-state traction batteries. Int. J. Life Cycle Assess. 2023, 28, 462–477. [Google Scholar] [CrossRef]
- Winjobi, O.; Kelly, J.C.; Dai, Q. Life-cycle analysis, by global region, of automotive lithium-ion nickel manganese cobalt batteries of varying nickel content. Sustain. Mater. Technol. 2022, 32, e00415. [Google Scholar] [CrossRef]
- Llamas-Orozco, J.A.; Meng, F.; Walker, G.S.; Abdul-Manan, A.F.N.; MacLean, H.L.; Posen, I.D.; McKechnie, J. Estimating the environmental impacts of global lithium-ion battery supply chain: A temporal, geographical, and technological perspective. PNAS Nexus 2023, 2, pgad361. [Google Scholar] [CrossRef]
- Gusman, I.; Triatmojo, P.; Rostiarti, P.; Arifiyanto, B. Energy Efficiency and Greenhouse Gas Emissions Reduction Through Electrification Program at TanjungEnim Mine Business Unit of PT Bukit Asam (Persero) Tbk. Indones. J. Environ. Manag. Sustain. 2018, 2, 7–10. [Google Scholar] [CrossRef]
- Earl, C.; Shah, I.H.; Cook, S.; Cheeseman, C.R. Environmental Sustainability and Supply Resilience of Cobalt. Sustainability 2022, 14, 4124. [Google Scholar] [CrossRef]
- Bamana, G.; Miller, J.D.; Young, S.L.; Dunn, J.B. Addressing the social life cycle inventory analysis data gap: Insights from a case study of cobalt mining in the Democratic Republic of the Congo. One Earth 2021, 4, 1704–1714. [Google Scholar] [CrossRef]
Figure 1.
Definition of a unit process.

Figure 2.
Map of geographic locations incorporated in this study; blue = cobalt mining and processing; orange = cobalt refining; green = cathode manufacturing; purple = refining and cathode manufacturing. Dashed lines indicate the flow of Co(OH)2 for the refinery location scenario analysis, and line thickness indicates the relative flow by weight.

Figure 3.
System boundary for LCA of cobalt in LIBs.

Figure 4.
Base-case major life cycle impacts of NMC111.


Figure 5.
Impact of ore grade on GWP of mining and processing of Co(OH)2. (Dashed line represents fitted power-law curve).
Figure 5.
Impact of ore grade on GWP of mining and processing of Co(OH)2. (Dashed line represents fitted power-law curve).

Figure 6.
Impact of refinery location on GWP (ore grade of 0.3%).

Figure 7.
Material-wise impact of refinery location on GWP. (Numbers for base case reflect kg CO2eq, while numbers for Canada and Finland routes reflect percent change from base case).
Figure 7.
Material-wise impact of refinery location on GWP. (Numbers for base case reflect kg CO2eq, while numbers for Canada and Finland routes reflect percent change from base case).

Figure 8.
Process-wise comparison of GWP for the three battery chemistries. Numbers shown for NMC111 show actual numbers and the percentage decrease for the other battery chemistries (location—China and ore grade—0.3%).
Figure 8.
Process-wise comparison of GWP for the three battery chemistries. Numbers shown for NMC111 show actual numbers and the percentage decrease for the other battery chemistries (location—China and ore grade—0.3%).

Figure 9.
Yearly variation of GWP during use phase for the five battery chemistries under study.

Figure 10.
Variation in environmental impacts with ore grade, refining location, and battery chemistry.
Figure 10.
Variation in environmental impacts with ore grade, refining location, and battery chemistry.


Figure 11.
Single-score results for major environmental impacts comparison of the different combined scenarios (ore grade—0.3%).
Figure 11.
Single-score results for major environmental impacts comparison of the different combined scenarios (ore grade—0.3%).

Table 1.
LCA studies of metals used in LIBs.
| Reference | Metal under Study | Life Cycle Phases Included in System Boundary | Scope of the Analysis |
|---|---|---|---|
| Schenker et al., 2022 [37] | Battery-grade Li2CO3 | Cradle to gate, recycling | Life cycle environmental assessment |
| Farjana et al., 2019 (a) [38] | Cobalt | Extraction | Life cycle environmental assessment |
| Mistry et al., 2015 [39] | Nickel | Cradle to gate | Primary energy demand, Global warming potential |
| Schmidt et al., 2016 [15] | Nickel and cobalt | Cradle to gate | Life cycle environmental assessment |
| Engels et al., 2022 [40] | Natural graphite | Cradle to gate | Global warming potential |
| Farjana et al., 2019 (b) [41] | Aluminum | Cradle to gate | Life cycle environmental assessment |
Table 3.
Battery augmentation rate used for analysis.
| Year End | Battery Capacity (% of Rating) | Augmentation (% of Rating) | Battery Installed Capacity (% of Rating) | Useable Capacity (% of Rating) |
|---|---|---|---|---|
| 0 | 100 | - | 120.5 | 100 |
| 3 | 88.7 | 10 | 118.0 | 100 |
| 7 | 82.0 | 10 | 119.3 | 100 |
| 14 | 74.5 | 15 | 123.3 | 100 |
| 21 | 64.9 | 112 (Battery replacement) | 122 | 100 |
Table 4.
Impact categories considered in this study.
| Impact Category | Abbreviation | Unit | Damage Pathways |
|---|---|---|---|
| Fine particulate matter formation | PMFP | kg PM2.5eq | Increased respiratory illness |
| Fossil resource scarcity | FFP | kg oileq | Scarcity in fossil resources on earth |
| Freshwater ecotoxicity | FETP | kg 1,4-DCB | Loss of plant and aquatic life; increased risk of cancer |
| Freshwater eutrophication potential | FEP | kg Peq | Loss of aquatic species |
| Global warming potential | GWP | kg CO2eq | Increased flood risk, human disease, species decline |
| Human carcinogenic toxicity | HTPc | kg 1,4-DCB | Increased toxicity and human disease |
| Human non- carcinogenic toxicity | HTPnc | kg 1,4-DCB | Increased toxicity and human disease which are non-carcinogenic |
| Ionizing radiation | IRP | kBq Co-60eq | Increased DNA damage |
| Land use | LOP | m2a cropeq | Increased land footprint |
| Marine ecotoxicity | METP | kg 1,4-DCB | Loss of plant and aquatic life; increased risk of cancer |
| Marine eutrophication potential | MEP | kg Neq | Loss of aquatic species |
| Mineral resource scarcity | SOP | kg Cueq | Scarcity of minerals on the earth |
| Ozone formation, human health | OFHH | kg NOxeq | Increased threat to human health |
| Ozone formation, terrestrial ecosystems | OFTE | kg NOxeq | Increased threat to terrestrial ecosystems |
| Stratospheric ozone depletion | ODP | kg CFC-11eq | Increased risk of disease |
| Terrestrial acidification potential | TAP | kg SO2eq | Loss of plant life |
| Terrestrial ecotoxicity | TETP | kg 1,4-DCB | Loss of plant species |
| Water depletion potential | WDP | m3 | Loss of aquatic species; malnutrition |
Table 5.
Description of scenarios used in the analysis.
| Scenarios | Ore Grade | Mining + Processing Location | Battery Chemistry | Refining Location |
|---|---|---|---|---|
| Base Case | 0.30% | DRC | NMC111 | China |
| 1–30 | 0.1–1% | DRC | NMC111 | China |
| Canada (NA) | ||||
| Finland (EU) | ||||
| 31–60 | NMC532 | China | ||
| Canada (NA) | ||||
| Finland (EU) | ||||
| 61–90 | NMC622 | China | ||
| Canada (NA) | ||||
| Finland (EU) | ||||
| 91–120 | NMC811 | China | ||
| Canada (NA) | ||||
| Finland (EU) | ||||
| 121–150 | NCA | China | ||
| Canada (NA) | ||||
| Finland (EU) |
Table 6.
Variables used in sensitivity analysis.
| Independent Variables | Dependent Variable | ||||
|---|---|---|---|---|---|
| Ore Grade | Fossil Fuel Generation at Refining Location (%) | Cobalt Content in the Battery Type (kg/MWh) | |||
| 0.1–1% | China Canada Finland | 75 18 29 | NMC111 | 394 | Global Warming Potential (GWP) |
| NMC532 | 230 | ||||
| NMC622 | 190 | ||||
| NMC811 | 94 | ||||
| NCA | 143 | ||||
Table 7.
Results of multivariate regression analysis.
| Constant | Ore Grade | Refining Location-Grid Mix | Cobalt Content in Battery | R2 | |
|---|---|---|---|---|---|
| Global Warming Potential (GWP) | 0.97 | ||||
| = 4866.2 = −0.271 | |||||
| 4952.7 | 0.77 | ||||
| = 1604.78 = 1 | |||||
| 1490 | 0.99 | ||||
| = 51.1 = 1 | |||||
| 0.94 | |||||
| = 4684.5 | = 1632.7; | ||||
| = −0.271 | = 1 | ||||
| −1122 | 0.95 | ||||
| = 1682.9 | = 62.7 | ||||
| = −0.8323 | = 1 | ||||
| 0.97 | |||||
| = 4522.29 | = 72.4185 | ||||
| = 1 | = 1 | ||||
Table 8.
Comparative analysis with select existing literature on LIBs (The studies referred to are lithium-ion battery LCAs including all components and battery manufacturing).
Table 8.
Comparative analysis with select existing literature on LIBs (The studies referred to are lithium-ion battery LCAs including all components and battery manufacturing).
| Ref | LCA Boundary/ Method | Fun. Unit | Battery | Impact Category | ||||||||
|---|---|---|---|---|---|---|---|---|---|---|---|---|
| GWP (kg CO2eq) | HTPeq (1,4 DCBeq) | FETP (kg 1,4-DCB) | METP (kg 1,4-DCB) | TETP (kg 1,4-DCB) | TAP (kg SO2eq) | FEP (kg Peq) | MEP (kg Neq) | WCP m3 | ||||
| Gutsch et al., 2024 [75] | Cradle to grave/ ReCiPe 2016 Midpoint | 1 kWh | 811 | 64.5 | ||||||||
| Tabrizi et al., 2024 [76] | Cradle to gate/ ReCiPe 2016 Midpoint | 1 kWh | 111 | 85 | ||||||||
| 622 | 76 | |||||||||||
| 811 | 74 | |||||||||||
| Popien et al., 2023 [77] | Cradle to gate/The ReCiPe Midpoint (H) V1.13 | 1 kWh | NCA | 110.54 | 254.46 | |||||||
| 622 | 110.76 | 254.13 | ||||||||||
| 811 | 102.34 | 243.81 | ||||||||||
| Jiang et al., 2023 [74] | Cradle to grave/CML-IA | 1 kWh | 622 | 132 | 13.5 | 70.3 | 1.77 × 10⁵ | 0.199 | 2.76 | |||
| 811 | 121 | 14.4 | 68.8 | 1.76 × 10⁵ | 0.189 | 2.65 | ||||||
| Sun et al., 2020 [30] | Cradle to grave/ReCiPe Midpoint (H) V1.11/ | 1 kWh | 622 | 93.57 | 12.53 | 1.5 | 0.01 | 0.49 | 0.01 | 0.02 | ||
| Winjobi et al. 2022 [78] | Cradle to gate/ GREET | 1 kWh | 111 | 59.5 | 0.44 | |||||||
| 532 | 59.3 | 0.42 | ||||||||||
| 622 | 56.4 | 0.39 | ||||||||||
| 811 | 55.1 | 0.39 | ||||||||||
| Dai et al., 2019 [35] | Cradle to gate/ GREET | 1 kWh | 111 | 72.87 | 0.752 | |||||||
| Orozco et al., 2023 [79] | Cradle to gate/ GREET | 1 kWh | 111 | 78.10 | ||||||||
| 532 | 81.13 | |||||||||||
| 622 | 77.43 | |||||||||||
| 811 | 77.37 | |||||||||||
| NCA | 82.33 | |||||||||||
| Peters et al., 2017 [42] | Review | 1 kWh | NMC | 40–250 | ||||||||
| This study | Cradle to gate/The ReCiPe Midpoint (H) V1.13 | 1 kWh (Base Case) | 111 | 8.5 | 150.15 | 3.7 | 4.7 | 54.8 | 0.07 | 6 × 10⁻³ | 2 × 10⁻⁴ | 0.27 |
| 532 | 5.2 | 88.89 | 2.2 | 2.8 | 33.2 | 0.04 | 4 × 10⁻³ | 1 × 10⁻⁴ | 0.17 | |||
| 622 | 4.3 | 73.46 | 1.8 | 2.4 | 27.6 | 0.03 | 3 × 10⁻³ | 1 × 10⁻⁴ | 0.14 | |||
| 811 | 2.2 | 38.37 | 0.96 | 1.2 | 15.1 | 0.02 | 16 × 10−2 | 6 × 10⁻⁴ | 0.07 | |||
| NCA | 3.2 | 54.99 | 1.4 | 1.8 | 21.3 | 0.03 | 3 × 10⁻³ | 8 × 10⁻⁴ | 0.11 | |||
Disclaimer/Publisher’s Note: The statements, opinions and data contained in all publications are solely those of the individual author(s) and contributor(s) and not of MDPI and/or the editor(s). MDPI and/or the editor(s) disclaim responsibility for any injury to people or property resulting from any ideas, methods, instructions or products referred to in the content. |
© 2024 by the authors. Licensee MDPI, Basel, Switzerland. This article is an open access article distributed under the terms and conditions of the Creative Commons Attribution (CC BY) license (https://creativecommons.org/licenses/by/4.0/).
Share and Cite
MDPI and ACS Style
Das, J.; Kleiman, A.; Rehman, A.U.; Verma, R.; Young, M.H. The Cobalt Supply Chain and Environmental Life Cycle Impacts of Lithium-Ion Battery Energy Storage Systems. Sustainability 2024, 16, 1910. https://doi.org/10.3390/su16051910
AMA Style
Das J, Kleiman A, Rehman AU, Verma R, Young MH. The Cobalt Supply Chain and Environmental Life Cycle Impacts of Lithium-Ion Battery Energy Storage Systems. Sustainability. 2024; 16(5):1910. https://doi.org/10.3390/su16051910
Chicago/Turabian StyleDas, Jani, Andrew Kleiman, Atta Ur Rehman, Rahul Verma, and Michael H. Young. 2024. "The Cobalt Supply Chain and Environmental Life Cycle Impacts of Lithium-Ion Battery Energy Storage Systems" Sustainability 16, no. 5: 1910. https://doi.org/10.3390/su16051910
Note that from the first issue of 2016, this journal uses article numbers instead of page numbers. See further details here.