
The Sustained Response of Dissolved Inorganic Carbon to Urban Constructed Wetland in the Fenhe River, China: A Case Study


1
Student Affairs Department, Shanxi Agricultural University, Taigu 030801, China
2
Environmental Science Laboratory, College of Resource and Environment, Shanxi Agricultural University, Taigu 030801, China
*
Author to whom correspondence should be addressed.
Sustainability 2024, 16(5), 1930; https://doi.org/10.3390/su16051930
Submission received: 14 January 2024
/
Revised: 7 February 2024
/
Accepted: 22 February 2024
/
Published: 27 February 2024
(This article belongs to the Special Issue Applications and Strategies of Using Seaweed and Other Resources for Environmental Protection and Resource Sustainability)
Abstract
:Sustained wetland utilization has been effective in purifying urban riverine pollutants and promoting sustainable development. However, its effect on water CO2 system remains unclear in semi-arid areas. In this study, seasonal monitoring of the carbonate system was performed at two compared stations, i.e., in constructed wetland (Xiangyun station) and its upstream (Lancun station) in a semi-arid river (the Fenhe River) in China. As indicated by the result of the sustained monthly observation from May 2020 to May 2021, riverine dissolved inorganic carbon (DIC) and partial pressure of CO2 (pCO2) reached 30.9–46.7 mg L−1 and 524–1050 μatm in Lancun station, respectively, whereas the above-described values declined significantly in Xiangyun station with the values of 24.1–39.1 mg L−1 for DIC and 188–873 μatm for pCO2. Compared with the Lancun station where the carbonate system was primarily controlled by natural factors (e.g., carbonate weathering and temperature), significant aquatic photosynthesis and calcification precipitation due to constructed wetland triggered the decrease in DIC and pCO2 and dominated their temporal variation in Xiangyun station. Thus, the large CO2 reduction arising from constructed wetlands may create vital paths for CO2 neutralization and sustainable conservation in urban rivers in arid and semi-arid areas in the future.
1. Introduction
The inland river system, i.e., a vital segment connecting the land, ocean and atmosphere, has taken on critical significance in global carbon cycle, annually horizontally transporting ~0.4 Pg inorganic carbon to the ocean and vertically releasing ~1.8 Pg CO2 to the atmosphere [1,2,3,4,5]. Although extensive research has placed a focus on carbonate systems in big rivers [6,7,8,9], optimized and in-depth efforts are required, especially in small watershed rivers with less attention possibly arising from their small volume [10,11,12]. Moreover, small watershed rivers are more sensitive to rapid urbanization and enhanced land use variations, and the transportation and transformation rates of riverine carbon are faster [13]. Thus, the changes of inorganic carbon system and its control mechanism in small watershed rivers turn out to be more sophisticated.
Compared with big rivers with large freshwater runoff such as Yangtze River or Mississippi River, the effect exerted by anthropogenic disturbance on small watershed rivers may be more prominent for their low runoff and weak environmental capacity [10,14,15]. Notably, in urbanized rivers, industrial or municipal sewage input has significantly worsened the ecological environment and surrounding landscape of the receiving water body [16]. In the lower Han River (South Korea) with high urbanization, Yoon et al. [17] found that wastewater input caused the CO2 levels in the receiving water increased 4-fold, approaching 8000 μatm. In two small rivers in Chongqing City (China), Wang et al. [11] found that riverine CO2 concentration in urban water bodies increased by 2–2.5 times compared to suburban areas. Correspondingly, constructed wetlands have progressively become effective in optimizing urban water environment, and attracted large numbers of studies [18,19]. For example, Scholz et al. [20] found that constructed wetlands would result in a removal of 72% initial nitrate and 35% of initial biological oxygen demand within weeks. Also, wetlands have high efficiency for the removal of PAH and persistent organic pollution [21,22]. Moreover, massive implementation of urban constructed wetland caused enhanced aquatic photosynthesis due to eutrophication [23], which may decrease riverine CO2 levels and even emerge a potential CO2 sink in urbanized regions. In an urban tidal marsh in the Huson-Raritan estuary, Schäfer et al. [24] assessed the net ecosystem exchange and the maximum rates reached −30 μmol m−2 s−1. Recently, Wu et al. [25] found that the CO2 flux of urban wetland in the Xining City in the Qinghai Tibet Plateau showed a net uptake in each month and the maximum value occurred in September. In particular, the achievement of the CO2 peak and further net-zero CO2 emissions (i.e., carbon neutrality) followed by the Pairs Agreement in 2016 have become a global consensus. In China, the areas of constructed wetland have reached more than 67,000 km2 [26]. Thus, the effect of urban constructed wetland on carbonate system in the surrounding rivers should be explored, which may help further clear the anthropogenic stressors on inorganic carbon system and achieve more CO2 absorption in a natural form in urban rivers.
In the arid and semi-arid climate, the rivers on the Loess Plateau in northern China have relatively small discharge compared with the rivers in humid areas, e.g., the discharge of the Yellow River (the sixth longest river in the world) that only takes up 5.0% of Yangtze River and 7.7% of the Mississippi River in humid areas [27,28]. Thus, the human interference in urban expansion may further increase the variation intensity of riverine carbonate system in loess areas. However, the research on riverine carbon transport in the Loess Plateau mainly focused on the main stream of the Yellow River with large runoff [29,30], while the related research in small watersheds especially several small rivers flowing through big cities showed a minor attention. The Fenhe River, the second longest tributary of the Yellow River, offers ~40% water supply in Shanxi Province, China [31], and is deeply affected by human interference. To be specific, when the river drains the capital of Shanxi Province (Taiyuan City), a ~30 km riverside wetland park through rubber damming and artificial planting is conducted for water quality purification, ecological restoration, and landscape enhancement. Thus, it is interesting and important to examine how the riverine inorganic carbon system and CO2 dynamic have responded to the artificial wetlands. In this study, based on monthly observations over an annual cycle at two stations (one was in urban wetland and the other was in the upstream of wetland), the riverine carbonate system variability and related CO2 dynamic controls were analyzed to highlight the potential impact of constructed wetland. This study would be helpful to present more insights into the inorganic carbon system and contribute to the predication of CO2 trend in urbanized rivers with constructed wetland in semi-arid areas.
2. Materials and Methods
2.1. Study Area
This study is conducted on Lancun station and Xiangyun station with a distance interval of ~30 km between them. These two stations are in the Taiyuan section of the Fenhe River (112.39° E–112.57° E and 37.61° N–38.02° N, Figure 1), which is in the middle of Shanxi Province, China. The Fenhe River is the second longest tributary of the Yellow River and the largest river in Shanxi Province, which is in the east of the Loess Plateau, with an extensive loess cover. Taiyuan City is the capital of Shanxi Province and has a 5.3 million population and a 65-billion-dollar GDP in 2021.
Lancun station is located in the upstream of Taiyuan City and is an important drinking water source. The river at this station and its upstream expresses as a mountainous river with a karst land type [32] and a good vegetation coverage dominated by forests and grassland (Figure 1). Thus, the river water at Lancun station shows a relatively natural river background. In comparison, when the river enters the urban zone of Taiyuan City, the river water is gradually stored by about 11 rubber dams or weirs and constructed ecological wetland is implemented for water conservancy regulation, forming a riverside urban park with a width of ~500 m and a length of ~30 km. Xiangyun station is located in the middle of this riverside urban park and it is investigated for analyzing the impact of urban constructed wetland (Figure 1). Dominated by a temperate semi-arid monsoon climate, the study area has an average annual precipitation of ~450 mm and the rainfall in summer accounts for >60% proportion.
2.2. Station Setting and Sample Processing
For this study, monthly observations over an annual cycle were conducted in Lancun station as background station and Xiangyun station in urban constructed wetland (Figure 1) from May 2020 to May 2021, and thus 13 observations were obtained in each station. During each month, the sampling work was carried out on sunny days and near mid-day, and water sample at a depth of ~0.2 m in the middle of the riverbed was obtained at these two stations using a plexiglass vertical water sampler. After collecting the water sample on site, dissolved oxygen saturation (DO%) were determined immediately, and then the samples of riverine ions, dissolved inorganic carbon (DIC) and its stable carbon isotope (δ13CDIC) were filtrated. pH samples were determined in the laboratory within 8 h after sampling (Table 1). Also, the parallel double samples were collected for DIC, δ13CDIC, pH and ions parameters, and their average values were adopted in this study due to the minor concentration differences between the parallel double samples.
Water temperature (Tw) and DO% were determined via a YSI oxygen analyzer (Pro20i, YSI Corporation, Yellow Spring, OH, USA), and the Winkler titration method was also applied for DO calibration (nominal precision: 0.1%). Then, apparent oxygen utilization (AOU) was calculated via saturated DO concentration in river minus the observed DO concentration [33]. AOU has been reported as a vital indicator of biological production or community respiration [10,34,35,36], i.e., negative AOU suggests the dominance of biological production and positive AOU corresponds to the dominance of community respiration. pH samples were collected in 150 mL polytetrafluoroethylene bottles and sealed to avoid bubbles, and they were measured at 25 °C (pH@25°C) in the laboratory using a pH Benchtop Meter (FE28, Mettler Toledo Corporation, Switzerland) with a precision of ±0.01, and the NBS (pH = 4.01, 7.00, and 9.21 at 25 °C) buffers were used for pH measurements. DIC and δ13CDIC samples were filtered to 20 mL high borosilicate glass bottles with 0.45 μm disposable syringe filters and dissolved organic carbon (DOC) samples were filtered through 0.7 μm GF/F glass fiber membrane (Whatman Corporation, Maidstone, UK) into 100 mL vials, and then these samples were stored at 4 °C until laboratory analysis after addition of saturated mercuric chloride solution (final concentration: ~0.04% by volume). The concentrations of DIC and DOC were measured by using a total organic carbon analyzer (Multi N/C 3100, Analytik Jena Corporation, Jena, Germany) with an uncertainty of ~0.06 mg L−1 [37]. The δ13CDIC values were measured using a Gasbench Ⅱ Extraction Line coupled with a Finnigan MAT 253 Mass Spectrometer (Thermo Electron Corporation, Massachusetts, USA), with a standard deviation of 0.05‰ (n = 4). Ca2+ and Mg2+ samples were filtered in 125 mL polytetrafluoroethylene bottles with 0.45 μm cellulose acetate membranes, and their concentrations were determined by using an Ion Chromatography (HIC-20Asuper, Shimadzu Corporation, Kyoto, Japan) with uncertainties of 5%. The above instrument analysis work was completed within three weeks after sampling. Also, in situ pH, partial pressure of CO2 (pCO2) and [HCO3−] were calculated from DIC, pH@25°C and Tw based on the CO2SYS program (Version 2.3) [38] which was a calculator for the CO2 system for Microsoft Excel 2016 and was used in many studies [35,36,37,39]. The dissociation constants (K1 and K2) of carbonic acid determined by Millero. (1979) [40] were used.
2.3. Simulation of pCO2 Change Due to Temperature Effect and Biological Production
2.3.1. Temperature Effect
Temperature could affect the concentration and proportion of carbonate components, causing pCO2 change through changing the dissociation degree of H2O and HCO3− at a constant total alkalinity (TA) and DIC level [35,36,38,39]. Thus, the contribution of temperature effect to pCO2 changes (ΔpCO2Tem) is calculated via Equation (1) based on the CO2SYS program.
where DICi, TAi, Tw i and pCO2i represent DIC, TA, water temperature and pCO2 for the calculation starting point, respectively. ΔTw indicated the temperature change. TA was computed by pH and DIC.
ΔpCO2Tem = p(DICi, TAi, Tw i + ΔTw) − pCO2i
Also, to remove the effect exerted by temperature, through Equation (1) in situ pCO2 could be normalized to a constant temperature, such as the annual average temperature, and thus npCO2 could be obtained.
2.3.2. Biological Production
Based on the classic Redfield stoichiometry of DIC: AOU = 106:138 [41], the changes of DIC caused by biological production (ΔDICBio) could be calculated through Equation (2) based on the AOU difference (ΔAOU):
ΔDICBio = ΔAOU/138 × 106
Thus, the changes of pCO2 caused biological production (ΔpCO2Bio) could be computed via Equation (3):
ΔpCO2Bio = p(DICi + ΔDICBio, TAi, Tw i) − pCO2i
2.4. Statistical Analysis
The correlations tests in the investigated parameters were analyzed using a SPSS 17.0 software (IBM Corporation, New York, NY, USA). Statistical analysis was considered significant at the level of p < 0.05.
3. Results
3.1. Variations of Water Chemistry
As depicted in Table 1, over an annual cycle from May 2020 through May 2021, Tw was 0.3–22.4 °C in Lancun station and 2.2–27.4 °C in Xiangyun station, and a minor difference was reported in the annual mean Tw between the above-mentioned two stations (11.4 °C vs. 13.9 °C). The river water was mildly alkaline, and in situ pH values ranged from 8.29 to 8.55, with a mean of 8.39 in Lancun station. However, in Xiangyun station located in urban constructed wetland, the pH values were elevated notably with a range between 8.33 and 8.86 (average 8.52). AOU values in both of the above-described two stations over an entire year were negative, showing the dominance of biological production. In Lancun station, DO was slightly supersaturated with an average AOU of −23.6 ± 16.1 μmol kg−1. In contrast, in Xiangyun station the degree of DO supersaturation was notably increased with an average AOU of −40.9 ± 41.3 μmol kg−1 (Figure 2b), suggesting a significant aquatic photosynthesis. The mole concentration of Ca2+ reached 1.68 ± 0.17 mmol L−1 in Lancun station, and it declined in Xiangyun station, with a mean of 1.57 ± 0.26 mmol L−1. The mole concentration of Mg2+ was 1.06–1.36 mmol L−1 in Lancun station and 0.74–1.29 mmol L−1 in Xiangyun station (Table 1).
3.2. Variations of Riverine DIC, DOC, δ13CDIC and pCO2
Riverine DIC concentrations in Lancun station varied widely from 30.9 mg L−1 to 46.7 mg L−1, with a mean of 38.1 mg L−1 (Table 1, Figure 2). Temporally, high DIC (>45 mg L−1) was primarily reported in high-runoff and cold months (e.g., January and February), and low DIC (<35 mg L−1) in low-runoff and warm months (e.g., July–October). In comparison, Xiangyun station achieved a lower DIC concentration ranging from 24.1 mg L−1 to 39.1 mg L−1, with a mean of 34.5 mg L−1, and especially during warm July-October DIC concentration was even below 30 mg L−1. Riverine δ13CDIC concentration in Lancun station varied from −6.98‰ to −5.51‰ with a mean of −6.31‰, showing a minor temporal variation. However, in Xiangyun station, riverine δ13CDIC changed widely with a range of −6.54‰~−2.10‰ and showed a more enriched average concentration (−4.94‰). Temporally, compared with Lancun station, the enriched δ13CDIC mainly appeared in warm months (e.g., July–October) with the concentration of >−4.50‰. The DOC concentration was 4.37 ± 0.73 mg L−1 in Lancun station and it increased to 6.99 ± 2.88 mg L−1 in Xiangyun station. Temporally, the obvious increase in DOC also mainly showed in warm months (e.g., July–October) with the concentration of >8.50 mg L−1 in Xiangyun station. Riverine pCO2 in Lancun station was supersaturated for atmospheric CO2 on an annual cycle, ranging between 524 μatm and 1050 μatm, with a mean of 722 μatm. Besides, it generally declined from June to January and then rose to May of the next year. Riverine pCO2 in Xiangyun station varied from 188 μatm to 873 μatm, with a mean of 519 μatm. Temporally, compared with Lancun station, pCO2 during November-May achieved a small decrease of ~90 μatm, and it was also supersaturated for atmospheric CO2. However, pCO2 during warm months (i.e., July–October) displayed a large reduction of >400 μatm with the minimum value of 188 μatm, and the river acted as an atmospheric CO2 sink.
4. Discussion
4.1. The Controls of DIC Variation at Background Station
Generally, the chemical weathering of rocks in the basin could convert atmospheric CO2 and C (carbonatite) contained in rocks into HCO3− in river water, which is the main source of DIC in natural rivers [6,27,42,43]. Meanwhile, compared with granite rocks, the weathering rate of carbonate rocks is 12 times faster [44], and thus its effect on riverine DIC has been widely reported [10,42,45]. In this study, Lancun station as background station is the important drinking water source of Taiyuan City with a better vegetation coverage (Figure 1), and both banks of its upstream are dominated by rock mountain area charactered by Ordovician limestone (carbonate rocks) with little silicate cover [32]. Thus, carbonate weathering would be an important cause for the high annual DIC concertation (38.1 ± 5.2 mg L−1) at Lancun station.
In carbonate weathering, carbonate rocks are usually predominantly dissolved by H2CO3. In this process, the δ13C value of soil CO2 dissolved in water should be −17‰ for C3 plants, and marine carbonate δ13C has more enriched value with an average of ~0‰ [46,47,48]. Thus, half of total DIC is derived from carbonate rocks and the other half from soil CO2, producing a 1:2 molar ratio of [Ca2+ + Mg2+]/[HCO3−] with a δ13C value of −8.5‰ according to Equation (4) due to the minor effect of CO2 degassing. However, when carbonate rocks are weathered by H2SO4, total DIC is 100% derived from minerals, producing a 1:1 molar ratio of [Ca2+ +Mg2+]/[HCO3−] with an enriched δ13C value of 0‰ according to Equation (5):
CaxMg1−xCO3 + CO2 + H2O ↔ xCa2+ + (1 − x)Mg2+ + 2HCO3−
2CaxMg1−xCO3 + H2SO4 ↔ 2xCa2+ + 2(1 − x)Mg2+ + SO42− + 2HCO3−
As depicted in Figure 3a and Table 1, the mole ratios of [Ca2++Mg2+]/[HCO3−] at Lancun station as background station notably ranged from 1 to 0.5, and the δ13CDIC value (−6.98‰~−5.51‰) was also between −8.5‰ and 0‰. It was suggested that riverine DIC at this station primarily originated from carbonate weathering involved by H2CO3 and H2SO4. Moreover, the above finding was confirmed by the equivalent ratio of [Ca2++Mg2+]/[HCO3−+SO42−] that was generally distributed around 1:1 line (Figure 3b). It is noteworthy that the participation of H2SO4 may arise from the extensive exploitation of coal resources with considerable SO42− [32]. Numerous coal mining sites were close to the study area (Figure 1). Moreover, the annual volume of coal mining in Shanxi Province in 2019 where the study station was located reached 9.9 × 10⁸ tons, taking up 26% of China’s total coal output [49]. Likewise, in two small karst catchments in Chongqing City (China) with high-sulfur (3.2%) coal as an energy resource, Zhang et al. [50] reported the significant involvement of H2SO4 in carbonate weathering. Thus, temporally, the intensity of carbonate weathering would determine the annual change of DIC at Lancun station. River discharge is an important factor for the chemical weathering rate of rocks. High flow accompanied by significant erosion process will promote more weathering products to enter the river, thus leading to the increase in riverine DIC [9,51]. As depicted in Figure 4, riverine DIC at Lancun station showed a significant positive correlation with riverine discharge, and high DIC values accompanied with high discharge. Moreover, the determination coefficient (r2) reached 0.78, suggesting that at least 78% monthly variation of DIC could be explained by river discharge. Note that river discharge at Lancun station is mainly controlled by reservoir regulation due to the existence of Fenhe Reservoir II with a 88 m height dam at its upstream (Figure 1) though river discharge variation is always closely related to rainfall which usually brings dilution effect and reduces the concentration of ions in the river [12,43]. Therefore, in Lancun station the high discharge did not occur in summer with more rainfall and the magnitude of reservoir-affected discharge corresponded to the intensity of erosion process. As for the biological activities, it may have a minor effect on DIC temporal variation in Lancun station, considering the near-equilibrium DO (107.6% ± 6.0%) and minor monthly changes in the DOC (4.37 ± 0.73 mg L−1) and δ13CDIC (−6.30‰ ± 0.39‰) in this entire year cycle (Figure 2, Table 1). Overall, carbonate weathering involved by H2CO3 and H2SO4 resulted in the high DIC levels at Lancun station as background station, and weathering intensity was mainly affected by river discharge.
4.2. The Effect of Urban Constructed Wetland on Riverine DIC
Compared with Lancun station at the urban upstream, the river is gradually closured with ~11 dams or weirs when it flows into Taiyuan City, forming a riverside wetland park with a ~30 km length and ~500 m width, and Xiangyun station is located in the middle of the riverside wetland park. From May 2020 to May 2021, the DIC concentrations at Xiangyun station (24.1–39.1 mg L−1) were generally lower than those (30.9–46.7 mg L−1) at Lancun station in the respective month, and in warm summer the DIC even decreased by >20%, suggesting that some processes notably reducing DIC were existed in Xiangyun station (Figure 2).
In general, the non-free flowing water body is easy to be autotrophic, due to the accumulation of nutrients and stable water conditions; the free-flowing water body tends to be a slightly heterotrophic or biological balanced status [52,53,54]. Aquatic photosynthesis could consume a large amount of CO2 and preferentially absorb 12C in the river, leading to the decrease in DIC and a more positive δ13CDIC. Compared with Lancun station with well fluidity (10.3 ± 6.3 m3 s−1) and near-equilibrium DO (107.6% ± 6.0%) (Figure 2, Table 1), wider riverbed and more static water body induced by the closure of the dams would facilitate the photosynthesis of plankton. DO at Xiangyun station was notably supersaturated all year round with an average DO% of 114.3% ± 15.7% and showed a more enriched δ13CDIC value of −4.94‰ ± 1.48‰. This indicated that a strong biological production appeared in Xiangyun station, and the large biological CO2 consumption would be an important factor for the decrease in DIC. Moreover, both AOU and δ13CDIC showed significant positive correlations with DIC (Figure 5a,b), suggesting that aquatic photosynthesis dominated the DIC monthly variability. Especially in warm July-October, AOU was below −80 μmol kg−1 with the δ13CDIC of >−4.50‰ and thus DIC reached the minimum level (<30 mg L−1). Also, the obvious control of aquatic production was shown on the variation of DOC which could indicate the organic matter produced in primary production. Compared with Lancun station, DOC in Xiangyun station increased by 60% with a value of 6.99 ± 2.88 mg L−1 (Figure 2h), and showed a good positive correlation with δ13CDIC (Figure 5c). Similarly, this decrease in riverine DIC caused by aquatic photosynthesis was widely found in several river-reservoir systems [51,55,56].
As revealed by natural observations and experimental studies, biological production is one of the vital reasons for inducing calcite precipitation which can also result in a significant DIC decrease [57,58,59,60]. In other words, significant aquatic photosynthesis can consume considerable CO2 and increase pH, causing the decrease in the solubility of calcite and the occurrence of calcite precipitation. In Xiangyun station dominated by aquatic photosynthesis, riverine pH reached 8.52 ± 0.13 with high calcium carbonate saturation state (>1). As depicted in Figure 5d, Ca2+ displayed a significant positive correlation with DIC, and low DIC values accompanied with low Ca2+, suggesting the important control of calcite precipitation on DIC monthly variation. Similar situations also showed in Ichetucknee River in USA [61], Wujiang [56] and Pearl River in China [62].
Additionally, the changes in water flow at the upstream Lancun station may still affect the hydrological conditions of the wetland area, though the water body of Xiangyun station tends to become stationary due to the layer-by-layer interception of the rubber dams. At the Lancun station, the discharge in summer was at its lowest throughout the year (Figure 2), which indicated that the water in the downstream wetland area was less affected by fluctuations from upstream inflow. Thus, more stable water structure would facilitate the growth of planktonic algae. This may also be one of the reasons for the lowest AOU and DIC during summer at Xiangyun station. In comparison, in autumn and early winter, the flow rate at Lancun station was the highest (Figure 2), suggesting that the stable hydrological structure of the downstream wetland area was more susceptible to damage. During this period, the AOU and DIC of Xiangyun station were the highest, and the weak biological production were shown. Meanwhile, the rainfall may also affect algal activities in constructed wetland and resulted in the changes in DIC and CO2. Especially in summer, rainfall may bring more nutrient inputs and some trace elements such as Fe and Mn [63,64], promoting the growth of planktonic algae and resulting in the lower AOU and DIC. Overall, in Xiangyun station, significant aquatic photosynthesis and calcification precipitation were the main factors for the decrease in DIC and dominated DIC seasonality.
4.3. The Effect of the Urban Constructed Wetland on Riverine pCO2 Variability
Riverine pCO2, i.e., the dissolved CO2 component in DIC, directly affects the CO2 source/sink pattern for the atmosphere in rivers. When the riverine pCO2 exceeds the atmospheric CO2, the river will act as a CO2 source and vice versa (sink). In this study, the controls of riverine pCO2 between Lancun station and Xiangyun station were compared, highlighting the effect of urban constructed wetland.
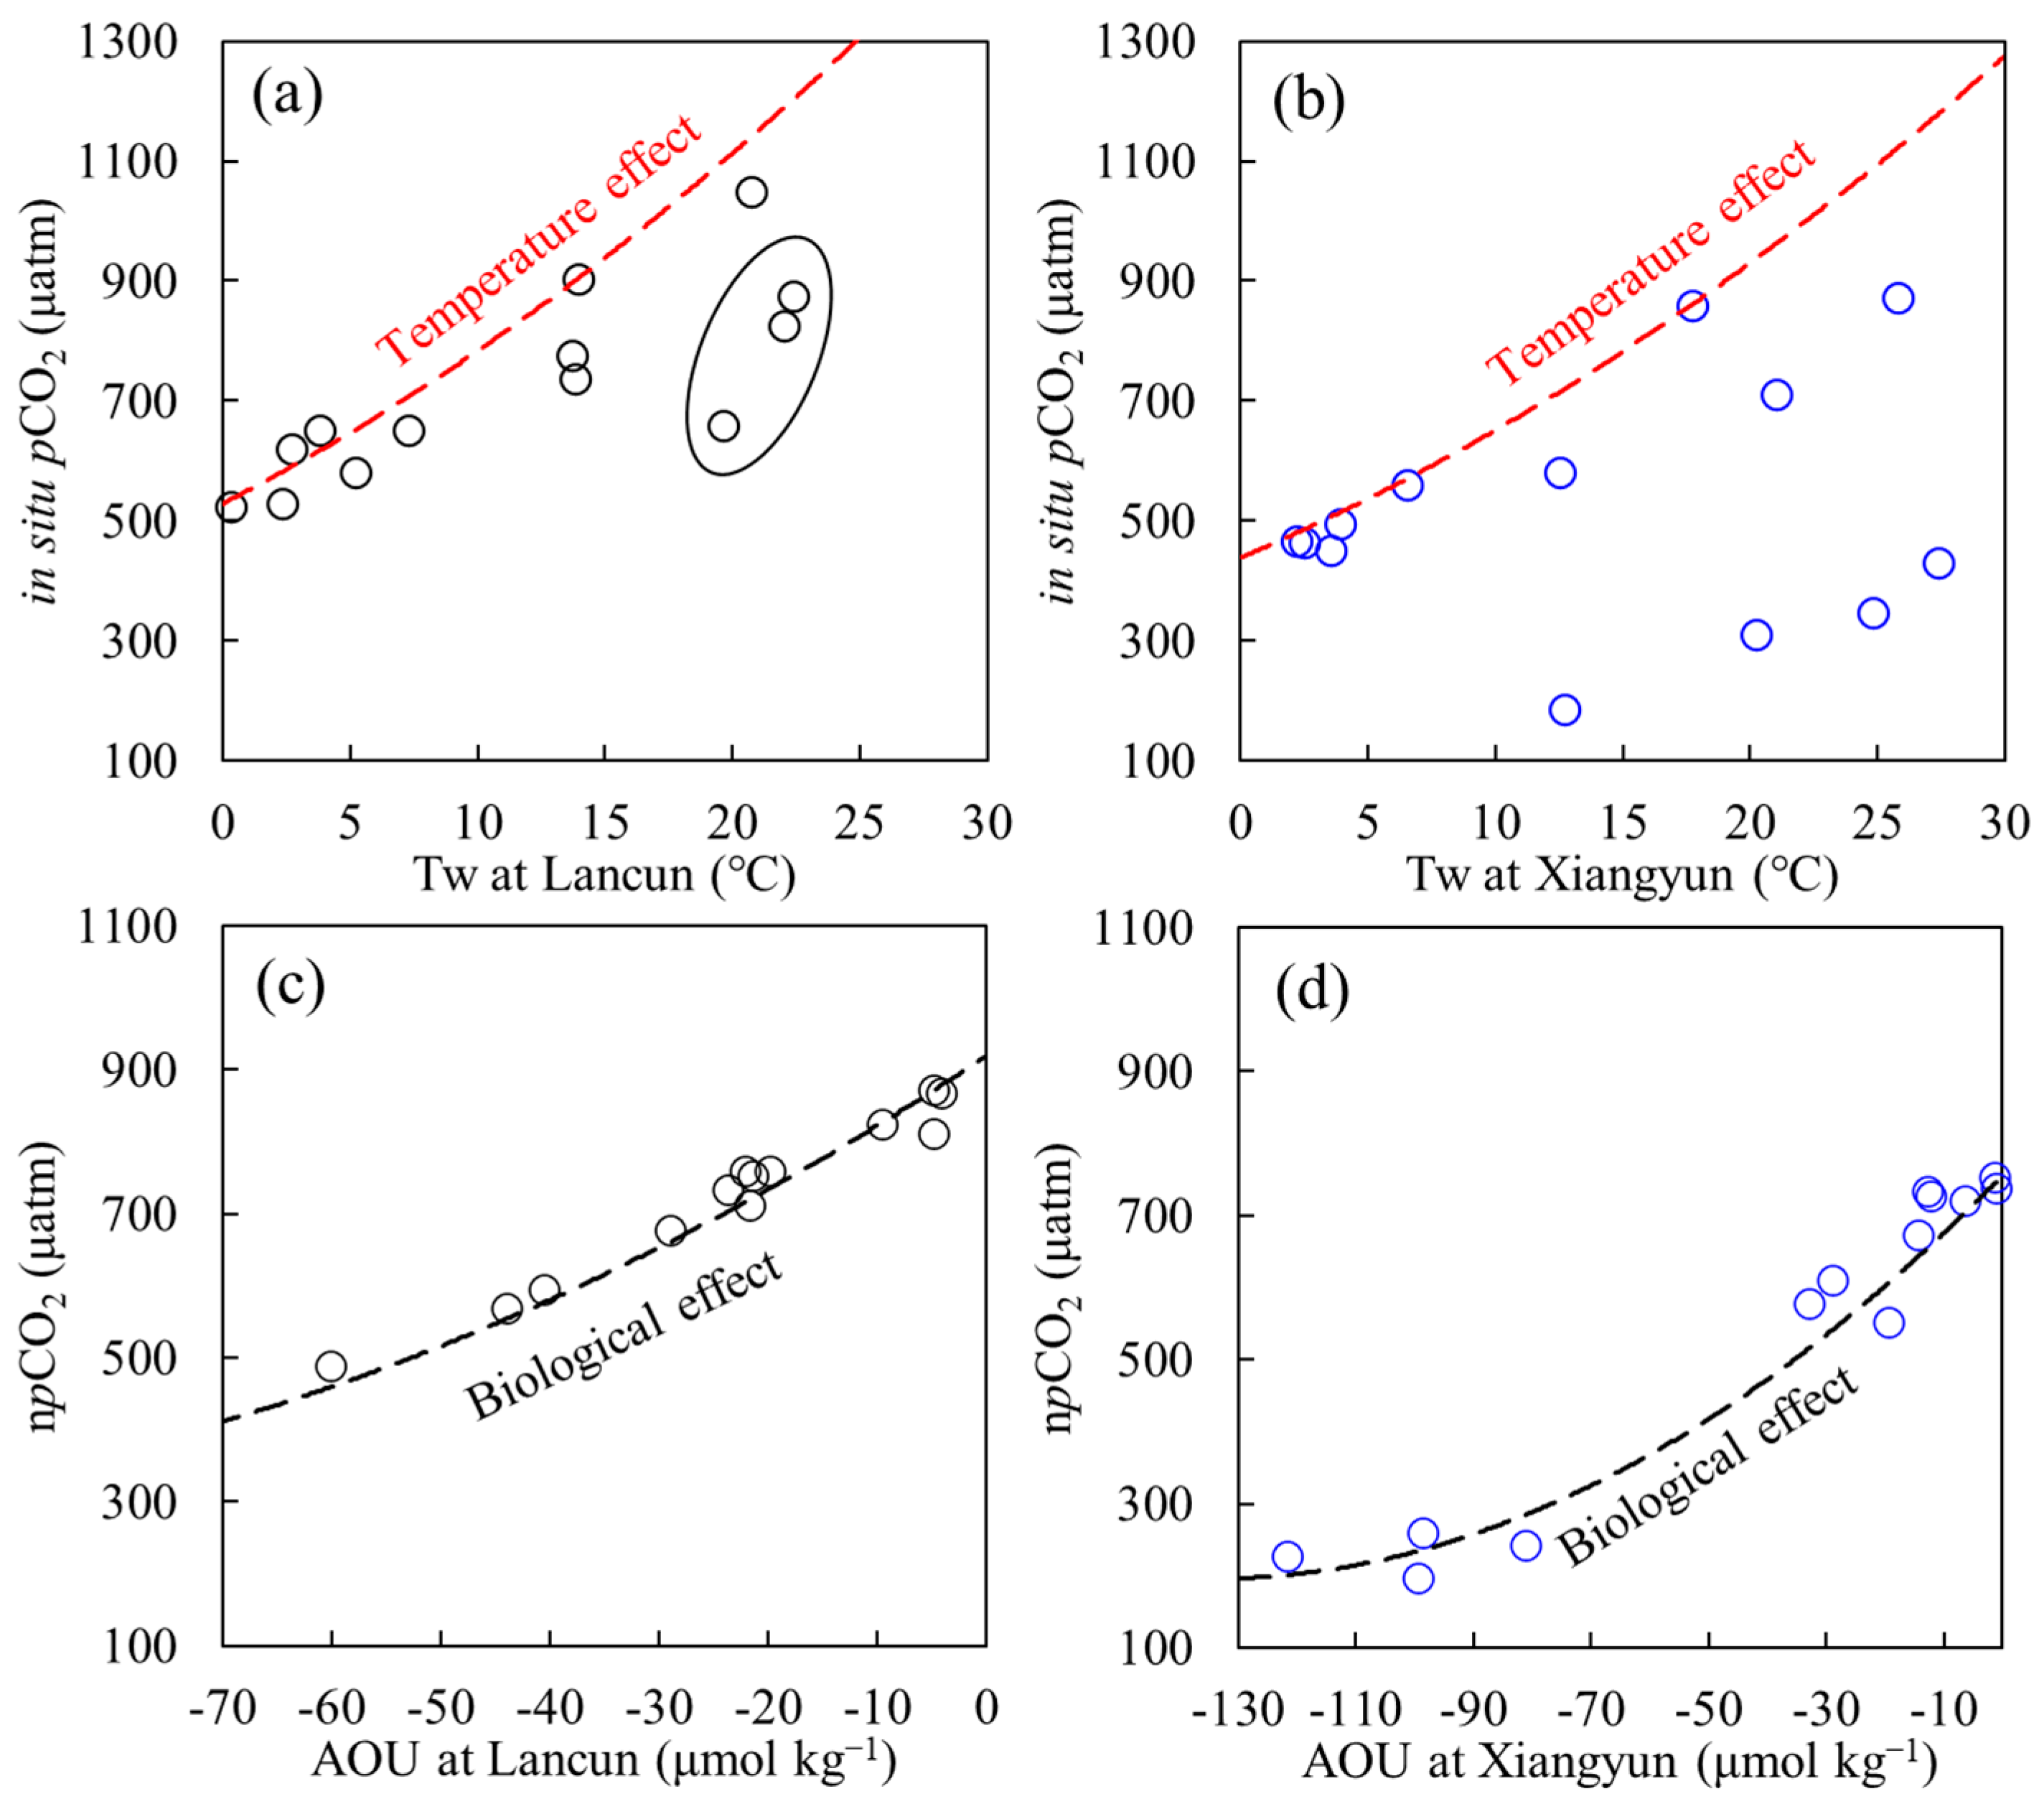
In general, temperature is a vital factor for pCO2 variability. Thermodynamically, the rise of temperature will lead to an increase in riverine pCO2 by increasing the dissociation degree of H2O and HCO3−, showing a positive correlation between pCO2 and Tw [65]. On average, annual average Tw only displayed a minor variation between Lancun station (11.4 °C) and Xiangyun station (13.9 °C), suggesting that temperature was not the dominant factor for the large annual pCO2 difference between the above-mentioned two stations (722 μatm vs. 519 μatm) (Table 1, Figure 2j). However, in monthly variation, the temperature effect was not ignored due to the significant Tw seasonality. In this study, to obtain the temperature effect on the monthly variability of pCO2, the values (Tw, DIC, pCO2) in May 2020 served as the starting point of calculation, and pCO2 monthly variation which was purely resulted from temperature effect was simulated based on CO2SYS program and represented by the red dashed lines in Figure 6a,b (See the Equation (1) in Section 2.3.1). As indicated by the results, the simulated in situ pCO2 value at Lancun station generally was in good agreement with their respective observation in the respective month (Figure 6a) except for the warm July-September months. Meanwhile, from January with minimum pCO2 (524 μatm) to June with highest pCO2 (1050 μatm), the estimated pCO2 variation (604 μatm) arising from the temperature effect only deviated by 15% with the identified pCO2 difference (526 μatm). As revealed by the above results, temperature effect may dominate monthly variation of pCO2 in Lancun station. In contrast, in Xiangyun station, the simulated pCO2 value notably deviated from their respective observation in most months (Figure 6b), suggesting a minor effect from temperature and highlighting the significance of non-temperature processes. In the following, to remove the effect exerted by temperature on the monthly variation of pCO2, in situ pCO2 would be normalized to the annual average temperature (11.4 °C in Lancun and 13.9 °C in Xiangyun) of the corresponding station, and npCO2 was obtained to explore the effect of biological processes in depth.
Biological production will consume CO2 and release oxygen, such that pCO2 can be decreased, and DO can be supersaturated (negative AOU). In contrast, community respiration will cause an increased pCO2, unsaturating DO (positive AOU). As depicted in Table 1 and Figure 2a, over an annual cycle from May 2020 to May 2021, DO in two investigated stations was supersaturated, and the biological production turned out to be dominant. Moreover, compared with Lancun station (−23.6 ± 16.1 μmol kg−1), Xiangyun station displayed stronger aquatic photosynthesis, which was demonstrated by the lower and more negative AOU (−40.9 ± 41.3 μmol kg−1). First, we simulated the contribution of biological production to the pCO2 change between these two stations. Based on the Equations (2) and (3) in Section 2.3.2, annual average values (Tw, AOU, DIC, pCO2) in Lancun station served as the calculation starting point, and the pCO2 decrease solely to biological production would be 142 μatm, taking up 70% of the identified difference (203 μatm) between the above-described two stations. This indicated that aquatic photosynthesis would serve as the dominant factor for the significant decrease in pCO2 at Xiangyun station. Second, temporally, with the aim of analyzing the biological effect on monthly variation of pCO2 for each station, the values (AOU, DIC, npCO2) in May 2020 served as the starting point of calculation, and npCO2 monthly variation was estimated, which was solely induced by the biological effect and represented as the black dashed lines in Figure 6c,d. As indicated by the results, the simulated npCO2 value in the above-mentioned two investigated stations was generally consistent with their respective observation in the respective month (Figure 6c,d). The results suggested that aquatic photosynthesis also took on critical significance in monthly variation of pCO2 in Lancun station though the dominant of temperature effect. Especially during warm July-September with AOU values of <−40 μmol kg−1, aquatic photosynthesis resulted in the significant decrease in pCO2, primarily accounting for the negative deviation of in situ pCO2 during the above-described months to simulated value solely to temperature effect (Figure 6a,c). In contrast, in Xiangyun station in urban constructed wetland, aquatic photosynthesis dominated the monthly variability of riverine pCO2 (Figure 6d), and from July to October with AOU of <−80 μmol kg−1 the station even acted as an atmospheric CO2 sink.
In addition, some other factors may also affect the changes in pCO2. Such as discharge and wind speed whose impacts are mainly reflected in the CO2 degassing process [66,67]. High discharge often enhances water-gas CO2 exchange, promoting CO2 degassing and leading to a decrease in pCO2. However, in Lancun station having good liquidity, we did not find an obvious decrease in pCO2 in cold months (e.g., January and February) with high discharge compared with the warm months (e.g., July–October) with low discharge (Figure 2c,i). Especially the temperature normalized pCO2 (npCO2) showed good agreement with biological Redfield line (Figure 6c). This indicated that discharge may have a minor effect on the monthly changes of pCO2 at Lancun station. In comparison, in Xiangyun station with a nearly stationary water body, wind speed is an important factor affecting CO2 degassing. However, it may also have a minor effect on pCO2 monthly variation due to the pCO2 levels (450 μatm, Figure 2j) close to atmospheric CO2 and the good agreement between npCO2 and simulated biological pCO2 (Figure 6d). Nevertheless, the impact of CO2 degassing on the changes of pCO2 in rivers is still worth further research [3], especially quantifying their contributions will help to detail the specific impacts of important processes through calculation model or field experiments.
Overall, urban constructed wetlands can substantially contribute to the decrease in riverine CO2 and even trigger the appearance of CO2 sink. Urban constructed wetlands are capable of beautifying the residential environment and ecological landscape while bringing a vital natural CO2 sink. Carbon reduction caused by conducted wetlands would become an important aspect of urban low-carbon management. Thus, supplemented by relevant protection policies and pollution discharge restrictions, expanding the scope of riverside wetlands along the river would be an effective low-carbon approach. This is due to the fact that urban wetlands not only bring ecological landscapes and a healthy environment to residents, but also promote low-carbon development and healthy management of cities. Moreover, the CO2 absorption capacity arising from aquatic photosynthesis turned out to be a major underestimation factor of carbon sinks in rivers, especially in several non-free flowing rivers exhibiting highly eutrophic state [10,60,68]. Despite the rising attention aroused by the CO2 sink in lakes that is caused by photosynthesis [69], the focus on urban wetland in the inland rivers has been limited (e.g., this study area). It is noteworthy that net autotrophic status even appeared in some forested headwater stream with a significant solar radiation and moderate temperature [70]. With the global expanding of urban area and rapid migration of population (over two thirds of the world’s population was expected to cities by 2050) to big cities [71], the expected large CO2 absorption from the atmosphere and carbon sequestration by urban eutrophic river reaches should be reviewed in depth. Moreover, compared with the humid areas and tropical rainforests, arid and semi-arid areas which covered 45% of global land surface had a higher turnover rates of carbon pools [72]. Notably, Ran et al. [3] suggested that the CO2 emission of rivers in arid and semi-arid North and Northwestern China declined by 56% under the effects of damming and water withdrawals from the 1980s to the 2010s. Thus, more observation and targeted research on CO2 systems should be conducted for urban rivers in arid and semi-arid regions in subsequent research.
4.4. Limitation and Future Research
Some limitations and future research in this study were addressed. First, pCO2 was determined based on pH and DIC. Thus, the uncertainty of pCO2 calculated from the pH and DIC was estimated as ~25 μatm via the CO2SYS program, given the uncertainty of ~0.06 mg L−1 for DIC measurement and the uncertainty of ~0.01 for pH measurement. However, this uncertainty can be ignored due to the large monthly variation of pCO2 in the investigated stations. Second, AOU was adopted to determine whether the water body was dominated by primary production or community respiration. Though the supersaturated DO and negative AOU as well as the variation of DOC and δ13CDIC at Xiangyun station located in the wetland area better suggested the dominance of aquatic production on DIC and pCO2, further incubation experiments or investigation of related biological parameters (e.g., chlorophyll a or nutrients) can be conducive to revealing the effect of aquatic photosynthesis in depth. Moreover, some in situ experiments of calcification precipitation can further confirm the occurrence of calcium carbonate precipitation in urban wetland areas. Third, this study focused on the main factors of DIC and pCO2 variability through correlation analysis and semi-quantitative means. However, some other processes (e.g., nitrification processes) may exist though their effects may be minor. Further, recently the interaction conversion between biological organic carbon and DIC was reported by Ni and Li [73] in detail. This process may also have a certain impact on riverine carbonate system indirectly in constructed wetland though more observations and profound explorations are still needed. Lastly, for the entire riverside constructed wetland, the change of carbonate system in different regions is still in doubt due to the limited investigated stations. Moreover, monthly observations for only one year cycle are limited due to the large annual changes of discharge. For example, in 2021 the annual discharge of the Fenhe River was 16.65 × 10⁸ m3, which was obviously higher than the multi-year average value of 9.18 × 10⁸ m3 [31], and high discharge may lead to an underestimation of observed results due to dilution effect.
Correspondingly, further future research is urgently needed. Firstly, more field investigation (especially high frequency and continuous observation) will help to truly understand the real-time changes of CO2 systems in artificial wetland regions, and further accurately obtain CO2 flux to avoid missing unexpected events such as rainfall. Secondly, the observation of in situ pCO2 associated with laboratory cultivation experiments or in situ experiments [20], and the application of more advanced means about carbon cycle models will gain a deeper understanding of the internal mechanisms of biological process effects on riverine CO2 and to gain more insights into the complex CO2 system in urbanized rivers. Thirdly, this study confirms the carbon sequestration effect of constructed wetlands on CO2 absorption. In comparison, methane is also another important greenhouse gas associated with wetlands [23]. Relevant investigations combined with sediment and microbial analysis [74] will help us gain a more comprehensive understanding of the role of artificial wetlands in the entire river carbon system.
5. Conclusions
In this study, we analyzed the effect of constructed wetland on carbonate system in urbanized river based on monthly observations over an annual cycle from May 2020 to May 2021 at two compared stations, which were in a constructed wetland (Xiangyun station) and its upstream (Lancun station) in the Taiyuan section of the Fenhe River on the Loess Plateau. In Lancun station, riverine DIC and pCO2 were 30.9–46.7 mg L−1 and 524–1050 μatm, respectively. Its DIC was mainly sourced from natural carbonate weathering involved by H2CO3 and H2SO4 and discharge-affected weathering intensity dominated DIC seasonality while pCO2 was dominated by temperature. In comparison, a significant decrease in DIC and pCO2 was reported in Xiangyun station in constructed wetland, and the values reached 24.1–39.1 mg L−1 and 188–873 μatm, respectively. The above-mentioned decrease in DIC primarily arose from significant aquatic photosynthesis and calcification precipitation, whereas the decrease in pCO2 was attributed to aquatic photosynthesis that dominated the seasonality of pCO2.
As revealed by the results of this study, urban constructed wetlands can notably contribute to the decrease in riverine CO2 and even trigger the appearance of CO2 sink. In urbanized semi-arid areas similar to the study area, scarce water resources are often efficiently utilized through dam or weir interception. More importantly, constructed wetlands could be set up to optimize water quality and living environments, becoming a natural driving force for urban low-carbon and sustainable development. With the increasing global CO2 concentration and urbanization especially the arid and semi-arid areas covering 45% of global land, aquatic photosynthesis and related biological processes caused by damming and constructed wetland resulted from population concentration will be even more important to the CO2 system in inland rivers. Thus, the CO2 absorption capacity arising from aquatic photosynthesis will become a major underestimation factor of CO2 sinks in urbanized rivers for CO2 neutralization.
Author Contributions
Conceptualization, Investigation, Software, Supervision, Writing—Original Draft, Writing—Review and Editing, J.D. and Y.L.; Formal analysis, Methodology, J.D., M.Z. and Y.L.; Funding acquisition, Y.L. All authors have read and agreed to the published version of the manuscript.
Funding
This research was funded by jointly supported by the Plan Project of Shanxi Basic Research, grant number 20210302124317, the Water Conservancy Science and Technology Research and Promotion Project in Shanxi, grant number 2023GM41, and the Scientific and Technological Innovation Programs of Higher Education Institutions in Shanxi, grant number 2020L0151.
Data Availability Statement
The data presented in this study are available on request from the corresponding author.
Conflicts of Interest
The authors declare no conflicts of interest.
References
- Barnes, R.T.; Raymond, P.A. The contribution of agricultural and urban activities to inorganic carbon fluxes within temperate watersheds. Chem. Geol. 2009, 266, 318–327. [Google Scholar] [CrossRef]
- Chaplot, V.; Mutema, M. Sources and main controls of dissolved organic and inorganic carbon in river basins: A worldwide meta-analysis. J. Hydrol. 2021, 603, 126941. [Google Scholar] [CrossRef]
- Ran, L.; Butman, D.E.; Battin, T.J.; Yang, X.; Tian, M.; Duvert, C.; Hartmann, J.; Geeraert, N.; Liu, S. Substantial decrease in CO2 emissions from Chinese inland waters due to global change. Nat. Commun. 2021, 12, 1730. [Google Scholar] [CrossRef] [PubMed]
- Raymond, P.A.; Hartmann, J.; Lauerwald, R.; Sobek, S.; McDonald, C.; Hoover, M.; Butman, D.; Striegl, R.; Mayorga, E.; Humborg, C.; et al. Global carbon dioxide emissions from inland waters. Nature 2013, 503, 355–359. [Google Scholar] [CrossRef]
- Wehrli, B. Biogeochemistry: Conduits of the carbon cycle. Nature 2013, 503, 346–347. [Google Scholar] [CrossRef]
- Lauerwald, R.; Hartmann, J.; Moosdorf, N.; Kempe, S.; Raymond, P.A. What controls the spatial patterns of the riverine carbonate system?—A case study for North America. Chem. Geol. 2013, 337–338, 114–127. [Google Scholar]
- Reiman, J.H.; Xu, Y.J. Dissolved carbon export and CO2 outgassing from the lower Mississippi River—Implications of future river carbon fluxes. J. Hydrol. 2019, 578, 124093. [Google Scholar] [CrossRef]
- Zhang, F.; Xiao, X.; Wang, L.; Zeng, C.; Yu, Z.; Wang, G.; Shi, X. Chemical weathering and CO2 consumption in the glaciated Karuxung River catchment, Tibetan Plateau. Hydrol. Process 2021, 35, e14330. [Google Scholar] [CrossRef]
- Zhang, Q.; Jin, Z.; Zhang, F.; Xiao, J. Seasonal variation in river water chemistry of the middle reaches of the Yellow River and its controlling factors. J. Geochem. Explor. 2015, 156, 101–113. [Google Scholar] [CrossRef]
- Chen, S.; Zhong, J.; Li, S.; Ran, L.; Wang, W.; Xu, S.; Yan, Z.; Xu, S. Multiple controls on carbon dynamics in mixed karst and non-karst mountainous rivers, Southwest China, revealed by carbon isotopes (δ13C and Δ14C). Sci. Total Environ. 2021, 791, 148347. [Google Scholar] [CrossRef]
- Wang, J.; Wang, X.; Liu, T.; Yuan, X.; Chen, H.; He, Y.; Wu, S.; Yuan, Z.; Li, H.; Que, Z.; et al. pCO2 and CO2 evasion from two small suburban rivers: Implications of the watershed urbanization process. Sci. Total Environ. 2021, 788, 147787. [Google Scholar] [CrossRef] [PubMed]
- Zhong, J.; Li, S.L.; Cai, H.M.; Yue, F.J.; Tao, F.X. The response of carbon geochemistry to hydrological events within an urban river, Southwestern China. Geochem. Int. 2018, 56, 462–473. [Google Scholar] [CrossRef]
- Li, S.; Luo, J.; Wu, D.; Jun Xu, Y. Carbon and nutrients as indictors of daily fluctuations of pCO2 and CO2 flux in a river draining a rapidly urbanizing area. Ecol. Indic. 2020, 109, 105821. [Google Scholar] [CrossRef]
- Tang, W.; Jun Xu, Y.; Li, S. Rapid urbanization effects on partial pressure and emission of CO2 in three rivers with different urban intensities. Ecol. Indic. 2021, 125, 107515. [Google Scholar] [CrossRef]
- Yu, S.; He, S.; Sun, P.A.; Pu, J.; Huang, J.; Luo, H.; Li, Y.; Li, R.; Yuan, Y. Impacts of anthropogenic activities on weathering and carbon fluxes: A case study in the Xijiang River basin, southwest China. Environ. Earth Sci. 2016, 75, 589. [Google Scholar] [CrossRef]
- Park, J.; Jin, H.; Yoon, T.K.; Begum, M.S.; Eliyan, C.; Lee, E.; Lee, S.; Oh, N. Wastewater-boosted biodegradation amplifying seasonal variations of pCO2 in the Mekong-Tonle Sap river system. Biogeochemistry 2021, 155, 219–235. [Google Scholar] [CrossRef]
- Yoon, T.K.; Jin, H.; Begum, M.S.; Kang, N.; Park, J. CO2 outgassing from an urbanized river system fueled by wastewater treatment plant effluents. Environ. Sci. Technol. 2017, 51, 10459–10467. [Google Scholar] [CrossRef]
- Vymazal, J. Enhancing ecosystem services on the landscape with created, constructed and restored wetlands. Ecol. Eng. 2011, 37, 1–5. [Google Scholar] [CrossRef]
- Zhang, T.; Xu, D.; He, F.; Zhang, Y.; Wu, Z. Application of constructed wetland for water pollution control in China during 1990–2010. Ecol. Eng. 2012, 47, 189–197. [Google Scholar] [CrossRef]
- Scholz, C.; Jones, T.G.; West, M.; Ehbair, A.M.S.; Dunn, C.; Freeman, C. Constructed wetlands may lower inorganic nutrient inputs but enhance DOC loadings into a drinking water reservoir in North Wales. Environ. Sci. Pollut. Res. 2016, 23, 18192–18199. [Google Scholar] [CrossRef]
- Zhao, C.; Xu, J.; Shang, D.; Zhang, Y.; Zhang, J.; Xie, H.; Kong, Q.; Wang, Q. Application of constructed wetlands in the PAH remediation of surface water: A review. Sci. Total Environ. 2021, 780, 146605. [Google Scholar] [CrossRef]
- Rizzo, A.; Tondera, K.; Pálfy, T.G.; Dittmer, U.; Meyer, D.; Schreiber, C.; Zacharias, N.; Ruppelt, J.P.; Esser, D.; Molle, D.; et al. Constructed wetlands for combined sewer over flow treatment: A state-of-the-art review. Sci. Total Environ. 2020, 727, 138618. [Google Scholar] [CrossRef]
- de Klein, J.J.M.; van der Werf, A.K. Balancing carbon sequestration and GHG emissions in a constructed wetland. Ecol. Eng. 2014, 66, 36–42. [Google Scholar] [CrossRef]
- Schäfer, K.V.R.; Tripathee, R.; Artigas, F.; Morin, T.H.; Bohrer, G. Carbon dioxide fluxes of an urban tidal marsh in the Hudson-Raritan estuary. J. Geophys. Res. Biogeosci. 2014, 119, 2065–2081. [Google Scholar] [CrossRef]
- Wu, Y.; Mao, X.; Zhang, Z.; Tang, W.; Cao, G.; Zhou, H.; Ma, J.; Yin, X. Temporal and spatial characteristics of CO2 flux in plateau urban wetlands and their influencing factors based on eddy covariance technique. Water 2021, 13, 1176. [Google Scholar] [CrossRef]
- Zhang, H.; Tang, W.; Wang, W.; Yin, W.; Liu, H.; Ma, X.; Zhou, Y.; Lei, P.; Wei, D.; Zhang, L.; et al. A review on China’s constructed wetlands in recent three decades: Application and practice. J. Environ. Sci. 2021, 104, 53–68. [Google Scholar] [CrossRef]
- Cai, W.; Guo, X.; Chen, C.A.; Dai, M.; Zhang, L.; Zhai, W.; Lohrenz, S.E.; Yin, K.; Harrison, P.J.; Wang, Y. A comparative overview of weathering intensity and HCO3− flux in the world’s major rivers with emphasis on the Changjiang, Huanghe, Zhujiang (Pearl) and Mississippi Rivers. Cont. Shelf Res. 2008, 28, 1538–1549. [Google Scholar] [CrossRef]
- Wang, X.; Luo, C.; Ge, T.; Xu, C.; Xue, Y. Controls on the sources and cycling of dissolved inorganic carbon in the Changjiang and Huanghe River estuaries, China: 14C and 13C studies. Limnol. Oceanogr. 2016, 61, 1358–1374. [Google Scholar] [CrossRef]
- Shan, S.; Luo, C.; Qi, Y.; Cai, W.; Sun, S.; Fan, D.; Wang, X. Carbon isotopic and lithologic constraints on the sources and cycling of inorganic carbon in four large rivers in China: Yangtze, Yellow, Pearl, and Heilongjiang. J. Geophys. Res. Biogeo. 2021, 126, e2020JG005901. [Google Scholar] [CrossRef]
- Wu, W. Hydrochemistry of inland rivers in the north Tibetan Plateau: Constraints and weathering rate estimation. Sci. Total Environ. 2016, 541, 468–482. [Google Scholar] [CrossRef] [PubMed]
- Department of Ecological Environment of Shanxi Province. Report on the Ecological Environment of Shanxi Province in 2021; Department of Ecological Environment of Shanxi Province: Taiyuan, China, 2021.
- Yang, Y.; Meng, Z.; Jiao, W. Hydrological and pollution processes in mining area of Fenhe River Basin in China. Environ. Pollut. 2018, 234, 743–750. [Google Scholar] [CrossRef] [PubMed]
- Grasshoff, K.; Kremling, K.; Ehrhardt, M. Methods of Seawater Analysis, 3rd ed.; Wiley: Weinheim, Germany, 1999. [Google Scholar]
- Liu, Z.; Zhang, L.; Cai, W.; Wang, L.; Xue, M.; Zhang, X. Removal of dissolved inorganic carbon in the Yellow River Estuary. Limnol. Oceanogr. 2014, 59, 413–426. [Google Scholar] [CrossRef]
- Xue, L.; Yang, X.; Li, Y.; Li, L.; Jiang, L.; Xin, M.; Wang, Z.; Sun, X.; Wei, Q. Processes controlling sea surface pH and aragonite saturation state in a large northern temperate bay: Contrasting temperature effects. J. Geophys. Res. Biogeo. 2020, 125, e2020JG005805. [Google Scholar] [CrossRef]
- Zhang, T.; Li, J.; Pu, J.; Yuan, D. Carbon dioxide exchanges and their controlling factors in Guijiang River, SW China. J. Hydrol. 2019, 578, 124073. [Google Scholar] [CrossRef]
- Li, Y.; Yang, H.; Dang, J.; Yang, X.; Xue, L.; Zhang, L. Seasonal variation of sea surface pH and its controls in the Jiaozhou Bay, China. Cont. Shelf Res. 2022, 232, 104613. [Google Scholar] [CrossRef]
- Lewis, E.; Wallace, D.W. Program Developed for CO2 Systems Calculations; ORNL/CDIAC 105; Carbon Dioxide Information Analysis Center, Oak Ridge National Laboratory US Department of Energy: Oak Ridge, TN, USA, 1998.
- Chen, B.; Cai, W.; Brodeur, J.R.; Hussain, N.; Testa, J.M.; Ni, W.; Li, Q. Seasonal and spatial variability in surface pCO2 and air-water CO2 flux in the Chesapeake Bay. Limnol. Oceanogr. 2020, 65, 3046–3065. [Google Scholar] [CrossRef]
- Millero, F.J. The thermodynamics of the carbonate system in seawater. Geochim. Cosmochim. Acta 1979, 43, 1651–1661. [Google Scholar] [CrossRef]
- Redfield, A.C. The influence of organisms on the composition of seawater. Sea 1963, 2, 26–77. [Google Scholar]
- Calabrese, S.; Parolari, A.J.; Porporato, A. Hydrologic transport of dissolved inorganic carbon and its control on chemical weathering. J. Geophys. Res. Earth 2017, 122, 2016–2032. [Google Scholar] [CrossRef]
- Sun, P.; He, S.; Yu, S.; Pu, J.; Yuan, Y.; Zhang, C. Dynamics in riverine inorganic and organic carbon based on carbonate weathering coupled with aquatic photosynthesis in a karst catchment, Southwest China. Water Res. 2021, 189, 116658. [Google Scholar] [CrossRef]
- Meybeck, M. Global chemical weathering of surficial rocks estimated from river dissolved loads. Am. J. Sci. 1987, 287, 401–428. [Google Scholar] [CrossRef]
- Martin, J.B. Carbonate minerals in the global carbon cycle. Chem. Geol. 2017, 449, 58–72. [Google Scholar] [CrossRef]
- Clark, I.D.; Fritz, P. Environmental Isotopes in Hydrogeology; Lewis Publishers: New York, NY, USA, 1997; pp. 111–169. [Google Scholar]
- Deuser, W.G.; Degens, E.T. Carbon isotope fractionation in the system CO2(gas)-CO2(aqueous)-HCO3−(aqueous). Nature 1967, 215, 1033–1035. [Google Scholar] [CrossRef]
- Telmer, K.; Veizer, J. Carbon fluxes, pCO2 and substrate weathering in a large northern river basin, Canada: Carbon isotope perspectives. Chem. Geol. 1999, 159, 61–86. [Google Scholar] [CrossRef]
- National Bureau of Statistics of China. China Statistical Yearbook 2021; National Bureau of statistics of China: Beijing, China, 2021.
- Zhang, Y.; Jiang, Y.; Yuan, D.; Cui, J.; Li, Y.; Yang, J.; Cao, M. Source and flux of anthropogenically enhanced dissolved inorganic carbon: A comparative study of urban and forest karst catchments in Southwest China. Sci. Total Environ. 2020, 725, 138255. [Google Scholar] [CrossRef]
- Wang, W.; Li, S.; Zhong, J.; Li, C.; Yi, Y.; Chen, S.; Ren, Y. Understanding transport and transformation of dissolved inorganic carbon (DIC) in the reservoir system using δ13CDIC and water chemistry. J. Hydrol. 2019, 574, 193–201. [Google Scholar] [CrossRef]
- Jiang, D.; Li, Z.; Luo, Y.; Xia, Y. River damming and drought affect water cycle dynamics in an ephemeral river based on stable isotopes: The Dagu River of North China. Sci. Total Environ. 2021, 758, 143682. [Google Scholar] [CrossRef]
- Maavara, T.; Lauerwald, R.; Regnier, P.; Van Cappellen, P. Global perturbation of organic carbon cycling by river damming. Nat. Commun. 2017, 8, 15347. [Google Scholar] [CrossRef]
- Ran, L.; Li, L.; Tian, M.; Yang, X.; Yu, R.; Zhao, J.; Wang, L.; Lu, X.X. Riverine CO2 emissions in the Wuding River catchment on the Loess Plateau: Environmental controls and dam impoundment impact. J. Geophys. Res. Biogeo. 2017, 122, 1439–1455. [Google Scholar] [CrossRef]
- Cui, G.; Li, X.; Li, Q.; Huang, J.; Tao, Y.; Li, S.; Zhang, J. Damming effects on dissolved inorganic carbon in different kinds of reservoirs in Jialing River, Southwest China. Acta Geochim. 2017, 36, 581–597. [Google Scholar] [CrossRef]
- Wang, W.; Li, S.; Zhong, J.; Maberly, S.C.; Li, C.; Wang, F.; Xiao, H.; Liu, C. Climatic and anthropogenic regulation of carbon transport and transformation in a karst river-reservoir system. Sci. Total Environ. 2020, 707, 135628. [Google Scholar] [CrossRef]
- Cicerone, D.S.; Stewart, A.J.; Roh, Y. Diel cycles in calcite production and dissolution in a eutrophic basin. Environ. Toxicol. Chem. 1999, 18, 2169–2177. [Google Scholar] [CrossRef]
- Hammes, F.; Verstraete, W. Key roles of pH and calcium metabolism in microbial carbonate precipitation. Rev. Environ. Sci. Biotechnol. 2002, 1, 3–7. [Google Scholar] [CrossRef]
- Liu, Z.; Macpherson, G.L.; Groves, C.; Martin, J.B.; Yuan, D.; Zeng, S. Large and active CO2 uptake by coupled carbonate weathering. Earth-Sci. Rev. 2018, 182, 42–49. [Google Scholar] [CrossRef]
- Rogerson, M.; Pedley, H.M.; Wadhawan, J.D.; Middleton, R. New insights into biological influence on the geochemistry of freshwater carbonate deposits. Geochim. Cosmochim. Acta 2008, 72, 4976–4987. [Google Scholar] [CrossRef]
- de Montety, V.; Martin, J.B.; Cohen, M.J.; Foster, C.; Kurz, M.J. Influence of diel biogeochemical cycles on carbonate equilibrium in a karst river. Chem. Geol. 2011, 283, 31–43. [Google Scholar] [CrossRef]
- Yang, M.; Liu, Z.; Sun, H.; Yang, R.; Chen, B. Organic carbon source tracing and DIC fertilization effect in the Pearl River: Insights from lipid biomarker and geochemical analysis. Appl. Geochem. 2016, 73, 132–141. [Google Scholar] [CrossRef]
- Zhang, J.; Liu, M.G. Observations on nutrient elements and sulphate in atmospheric wet depositions over the northwest Pacific coastal oceans—Yellow Sea. Mar. Chem. 1994, 47, 173–189. [Google Scholar] [CrossRef]
- Zhang, G.; Zhang, J.; Liu, S. Characterization of nutrients in the atmospheric wet and dry deposition observed at the two monitoring sites over Yellow Sea and East China Sea. J. Atmos. Chem. 2007, 57, 41–57. [Google Scholar] [CrossRef]
- Weiss, R.F. Carbon dioxide in water and seawater: The solubility of a non-ideal gas. Mar. Chem. 1974, 2, 203–215. [Google Scholar] [CrossRef]
- Xia, M.; Craig, P.M.; Schaeffer, B.; Stoddard, A.; Liu, Z.; Peng, M.; Zhang, H.; Wallen, C.M.; Bailey, N.; Mandrup-Poulsen, J. Influence of physical forcing on bottom-water dissolved oxygen within Caloosahatchee River Estuary, Florida. J. Environ. Eng. 2010, 136, 1032–1044. [Google Scholar] [CrossRef]
- Liu, Y.; Weisberg, R.H.; Zheng, L.; Heil, C.A.; Hubbard, K.A. Termination of the 2018 Florida red tide event: A tracer model perspective. Estuar. Coast. Shelf Sci. 2022, 272, 107901. [Google Scholar] [CrossRef]
- Grill, G.; Lehner, B.; Thieme, M.; Geenen, B.; Tickner, D.; Antonelli, F.; Babu, S.; Borrelli, P.; Cheng, L.; Crochetiere, H.; et al. Mapping the world’s free-flowing rivers. Nature 2019, 569, 215–221. [Google Scholar] [CrossRef]
- Pacheco, F.S.; Roland, F.; Downing, J.A. Eutrophication reverses whole-lake carbon budgets. Inland Waters 2014, 4, 41–48. [Google Scholar] [CrossRef]
- Roberts, B.J.; Mulholland, P.J.; Hill, W.R. Multiple scales of temporal variability in ecosystem metabolism rates: Results from 2 years of continuous monitoring in a forested headwater stream. Ecosystems 2007, 10, 588–606. [Google Scholar] [CrossRef]
- Gratani, L.; Catoni, R.; Puglielli, G.; Varone, L.; Crescente, M.F.; Sangiorgio, S.; Lucchetta, F. Carbon dioxide (CO2) sequestration and air temperature amelioration provided by urban parks in Rome. Energy Procedia 2016, 101, 408–415. [Google Scholar] [CrossRef]
- Poulter, B.; Frank, D.; Ciais, P.; Myneni, R.B.; Andela, N.; Bi, J.; Broquet, G.; Canadell, J.G.; Chevallier, F.; Liu, Y.Y.; et al. Contribution of semi-arid ecosystems to interannual variability of the global carbon cycle. Nature 2014, 509, 600–603. [Google Scholar] [CrossRef]
- Ni, M.; Li, S. Dynamics and internal links of dissolved carbon in a karst river system: Implications for composition, origin and fate. Water Res. 2022, 226, 119289. [Google Scholar] [CrossRef]
- Bledsoe, R.B.; Bean, E.Z.; Austin, S.S.; Peralta, A.L. A microbial perspective on balancing trade-offs in ecosystem functions in a constructed stormwater wetland. Ecol. Eng. 2020, 158, 109000. [Google Scholar] [CrossRef]
Figure 1.
Study area and sampling station map. Note that this figure shows the riverside constructed wetland area in Taiyuan City, coal mining sites and land-use type of study area.
Figure 1.
Study area and sampling station map. Note that this figure shows the riverside constructed wetland area in Taiyuan City, coal mining sites and land-use type of study area.
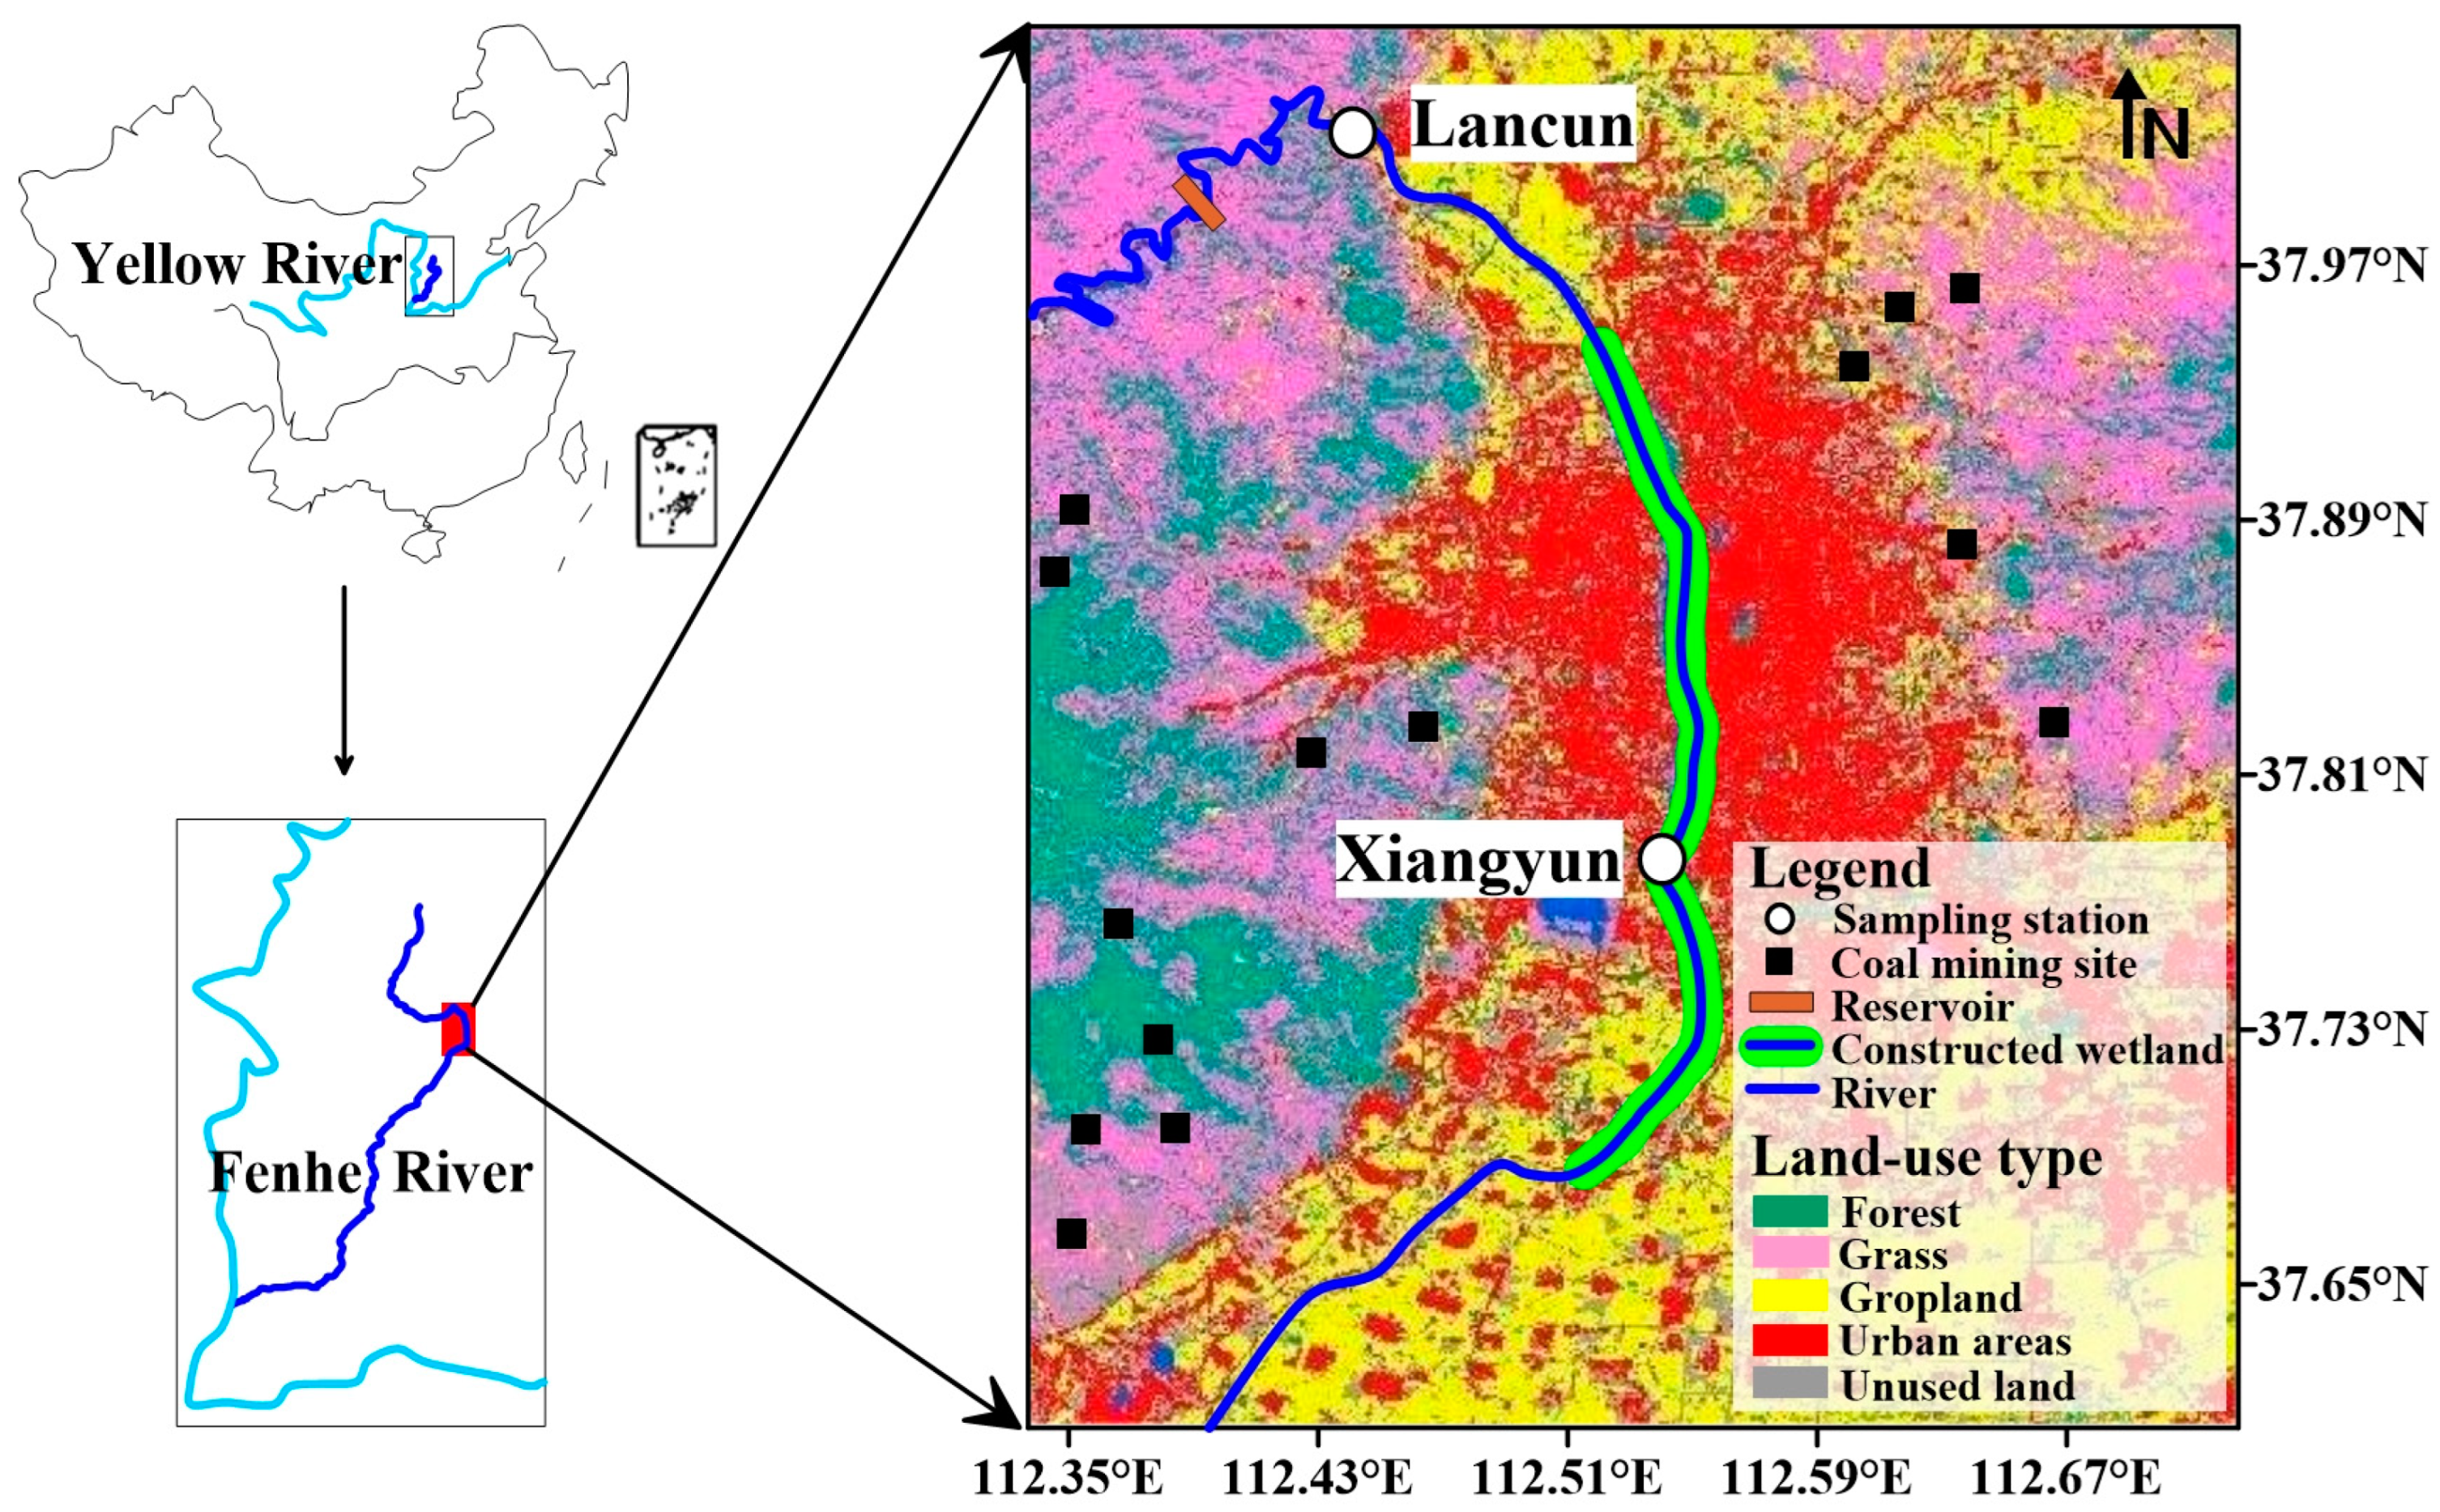
Figure 2.
Monthly variations of riverine AOU (a), DIC (c) and pCO2 (i) in Lancun station (black circles) and Xiangyun station (blue circles) from May 2020 through May 2021 and the boxplots describing the yearly AOU (b), DIC (d) and pCO2 (j) concentrations. In panel (c), the grey dashed line denotes river discharge at Lancun station. Also, the monthly riverine δ13CDIC (e,f) and DOC (g,h) concentration from January 2021 to December 2021 are showed.
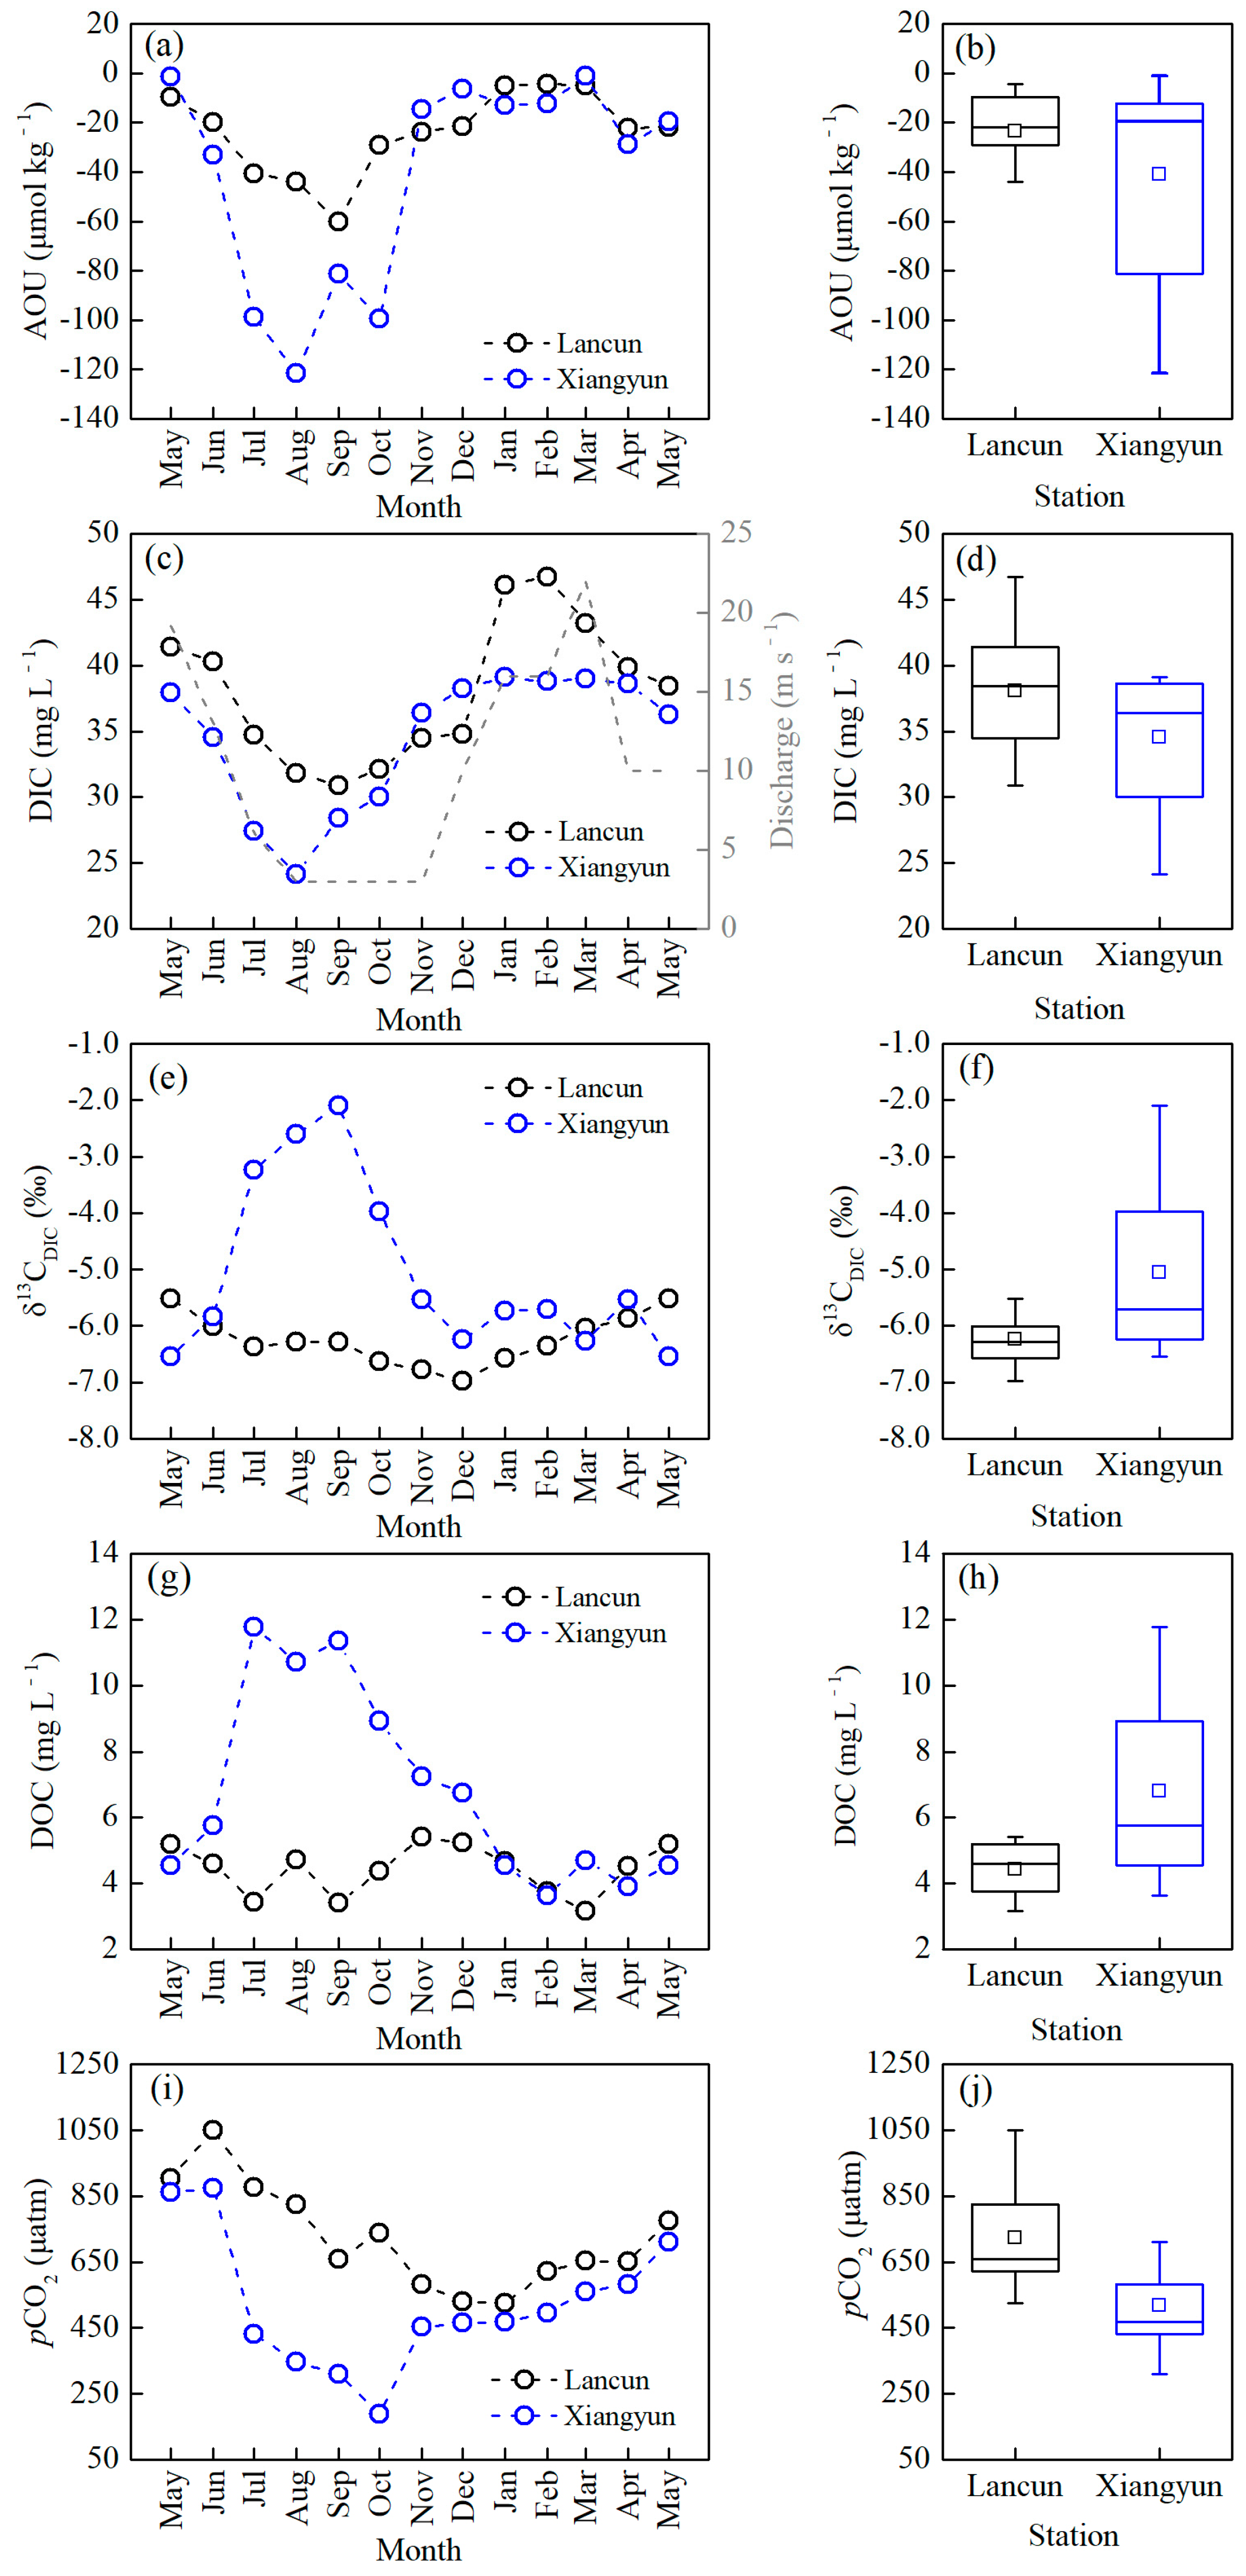
Figure 3.
Variations in molar [HCO3−] versus [Ca2++Mg2+] ratio (a), and equivalent [HCO3−+SO42−] versus [Ca2++Mg2+] ratio (b) at Lancun station over an annual cycle from May 2020 to May 2021.
Figure 3.
Variations in molar [HCO3−] versus [Ca2++Mg2+] ratio (a), and equivalent [HCO3−+SO42−] versus [Ca2++Mg2+] ratio (b) at Lancun station over an annual cycle from May 2020 to May 2021.
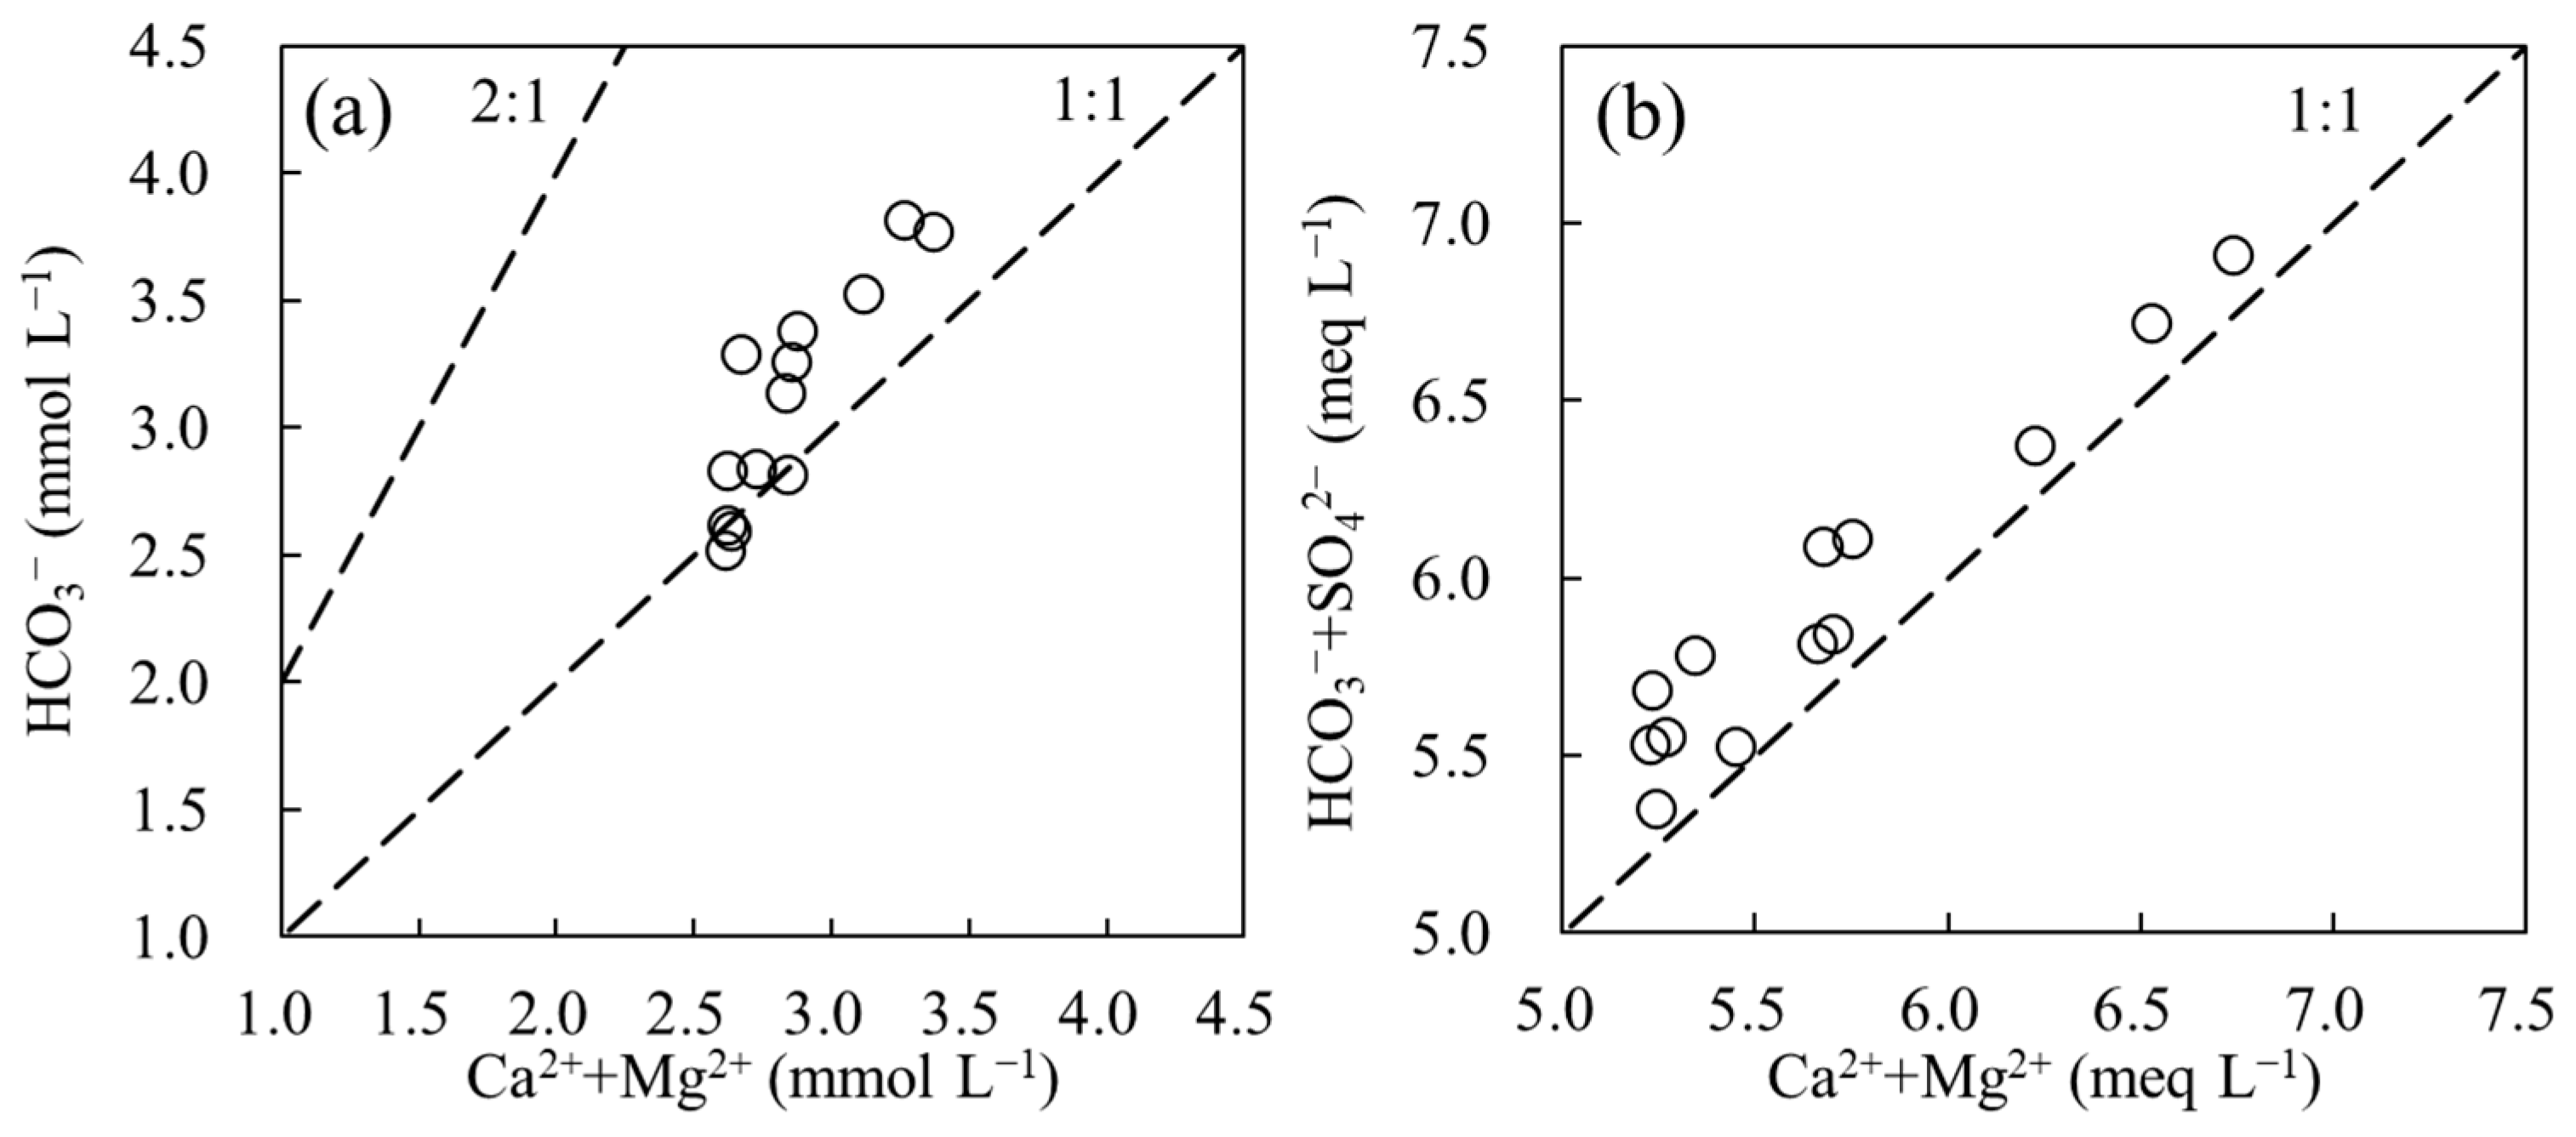
Figure 4.
Correlation of DIC and water discharge at Lancun station over an annual cycle from May 2020 to May 2021.
Figure 4.
Correlation of DIC and water discharge at Lancun station over an annual cycle from May 2020 to May 2021.

Figure 5.
Correlations of DIC vs. AOU (a), DIC vs. δ13CDIC (b), DOC vs. δ13CDIC (c) and DIC versus Ca2+ (d) at Xiangyun station. Note that the data of δ13CDIC and DOC is from January 2021 to December 2021.
Figure 5.
Correlations of DIC vs. AOU (a), DIC vs. δ13CDIC (b), DOC vs. δ13CDIC (c) and DIC versus Ca2+ (d) at Xiangyun station. Note that the data of δ13CDIC and DOC is from January 2021 to December 2021.
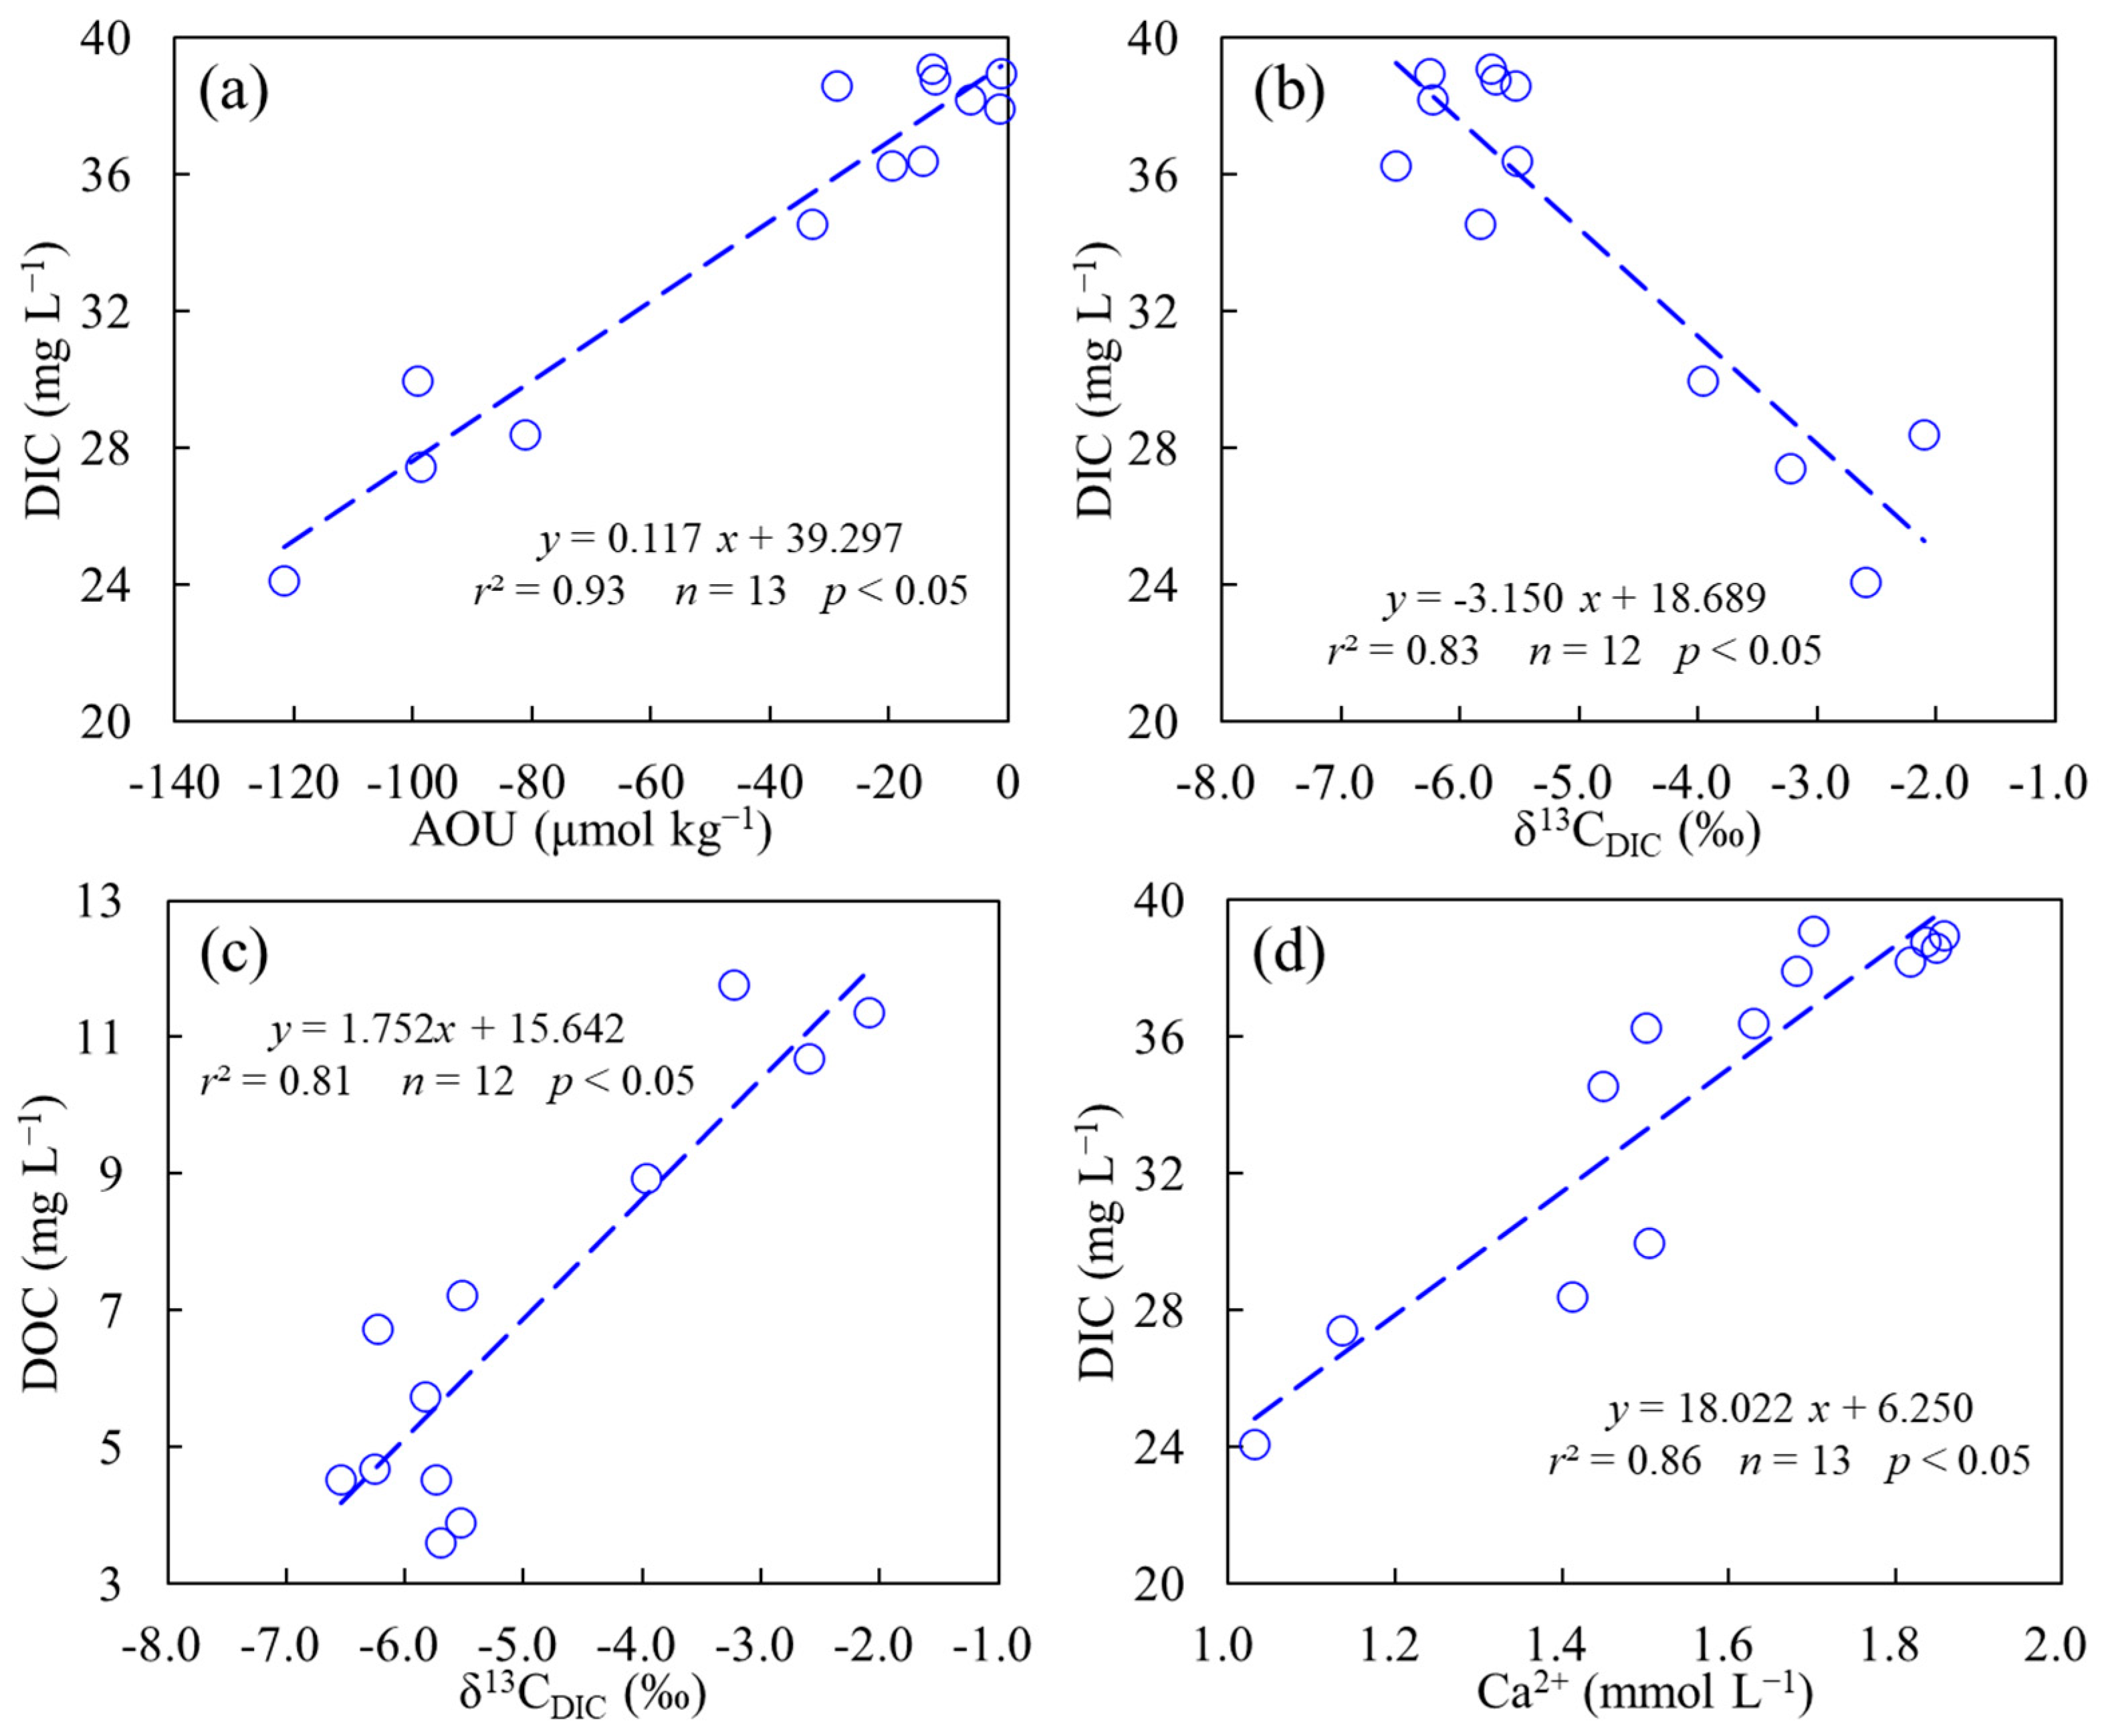
Figure 6.
Plots of in situ pCO2 versus Tw and npCO2 versus AOU at Lancun station (a,c) and Xiangyun station (b,d). In panels (a,b), the dashed red line represents the variations of simulated pCO2 solely due to the temperature effect, starting from the value in May 2020. In panel (a), the values in black circle represent the observations from July to September. In panels (c,d), the dashed black line represents npCO2 variations just due to biological activities, which were determined based on the classic Redfield stoichiometry of DIC:AOU = 106:138 and started from the value in May 2020.

Table 1.
Riverine water chemistry and concentrations of DIC, δ13CDIC, DOC and pCO2 in two investigated stations over an annual cycle.
Table 1.
Riverine water chemistry and concentrations of DIC, δ13CDIC, DOC and pCO2 in two investigated stations over an annual cycle.
| Location | Sample | Tw | pH | AOU | DIC | δ13CDIC | DOC | pCO2 | Ca2+ | Mg2+ |
|---|---|---|---|---|---|---|---|---|---|---|
| °C | μmol kg−1 | mg L−1 | ‰ | mg L−1 | μatm | mmol L−1 | mmol L−1 | |||
| Lancun | Max | 22.4 | 8.55 | −60.1 | 46.7 | −5.51 | 5.40 | 1050 | 2.01 | 1.36 |
| Min | 0.3 | 8.29 | −4.2 | 30.9 | −6.98 | 3.16 | 524 | 1.46 | 1.06 | |
| Average | 11.4 | 8.39 | −23.6 | 38.1 | −6.31 | 4.37 | 722 | 1.68 | 1.16 | |
| SD | 7.8 | 0.08 | 16.1 | 5.2 | 0.39 | 0.73 | 151 | 0.17 | 0.08 | |
| Xiangyun | Max | 27.4 | 8.86 | −121.7 | 39.1 | −2.10 | 11.77 | 873 | 1.86 | 1.29 |
| Min | 2.2 | 8.33 | −1.2 | 24.1 | −6.54 | 3.62 | 188 | 1.03 | 0.74 | |
| Average | 13.9 | 8.52 | −40.9 | 34.5 | −4.94 | 6.99 | 519 | 1.57 | 1.16 | |
| SD | 9.1 | 0.13 | 41.3 | 5.0 | 1.48 | 2.88 | 193 | 0.26 | 0.13 |
Disclaimer/Publisher’s Note: The statements, opinions and data contained in all publications are solely those of the individual author(s) and contributor(s) and not of MDPI and/or the editor(s). MDPI and/or the editor(s) disclaim responsibility for any injury to people or property resulting from any ideas, methods, instructions or products referred to in the content. |
© 2024 by the authors. Licensee MDPI, Basel, Switzerland. This article is an open access article distributed under the terms and conditions of the Creative Commons Attribution (CC BY) license (https://creativecommons.org/licenses/by/4.0/).
Share and Cite
MDPI and ACS Style
Dang, J.; Zhang, M.; Li, Y. The Sustained Response of Dissolved Inorganic Carbon to Urban Constructed Wetland in the Fenhe River, China: A Case Study. Sustainability 2024, 16, 1930. https://doi.org/10.3390/su16051930
AMA Style
Dang J, Zhang M, Li Y. The Sustained Response of Dissolved Inorganic Carbon to Urban Constructed Wetland in the Fenhe River, China: A Case Study. Sustainability. 2024; 16(5):1930. https://doi.org/10.3390/su16051930
Chicago/Turabian StyleDang, Jiajia, Meifang Zhang, and Yunxiao Li. 2024. "The Sustained Response of Dissolved Inorganic Carbon to Urban Constructed Wetland in the Fenhe River, China: A Case Study" Sustainability 16, no. 5: 1930. https://doi.org/10.3390/su16051930
Note that from the first issue of 2016, this journal uses article numbers instead of page numbers. See further details here.