
Projection of Non-Industrial Electricity Consumption in China’s Pearl River Delta under Global Warming Scenarios


1
School of Marine Sciences, Nanjing University of Information Science and Technology, Nanjing 210044, China
2
School of Atmospheric Sciences, Nanjing University, Nanjing 210023, China
*
Author to whom correspondence should be addressed.
Sustainability 2024, 16(5), 2012; https://doi.org/10.3390/su16052012
Submission received: 4 December 2023
/
Revised: 8 January 2024
/
Accepted: 21 January 2024
/
Published: 29 February 2024
(This article belongs to the Special Issue Global Climate Change and Sustainable Social and Economic Development)
Abstract
:Global warming is a global issue closely linked to sustainability, and power systems around the world are facing immense pressure due to global warming. The purpose of this study is to investigate the impact of global warming on non-industrial electricity consumption in China’s Pearl River Delta. The Weather Research and Forecasting (WRF) model is employed to dynamically downscale and simulate summer climate change characteristics during historical periods and future warming scenarios of 1.5/2 °C. Then, in order to dynamically investigate the changes in non-industrial electricity consumption in cities after warming, we developed a non-industrial electricity consumption estimation model based on degree days and GDP. The regression model can well reproduce non-industrial electricity consumption in summer. Under future warming scenarios of 1.5/2 °C, the results indicate an annual growth trend in non-industrial electricity consumption due to global warming. Under a 1.5 °C warming scenario, non-industrial electricity consumption in both Guangzhou and Zhuhai increases, with Guangzhou experiencing a larger increase of about 10 terawatt-hours (TWh) compared to the historical period. However, under a 2 °C warming scenario, non-industrial electricity consumption in both cities slightly decreases compared to the 1.5 °C warming scenario, with a maximum decrease of 874 million kilowatt-hours.
1. Introduction
Climate change is one of the most severe and pressing global issues facing the world today. As global temperatures continue to rise, extreme weather events (i.e., heatwaves) are becoming more frequent [1,2], which can put immense pressure on power systems and potentially lead to power shortages and grid overloads. This not only threatens the stability of our power systems but also challenges the sustainability of our energy use.
Researchers have found that climate change leads to an increase in energy demand, and hot weather exacerbates people’s demand for electricity, making the relationship between power supply and demand more tense [3]. A recent study focusing on California concluded that, with high temperatures, residential electricity demand could increase by 47% to 87% between 2020 and 2060 [4]. Especially during the hot summer months, the widespread use of smart products has also led to a significant increase in electricity consumption, often peaking in the afternoon for 1–3 h, which further strains the power system [5]. Therefore, we need to seek more sustainable energy solutions to reduce the pressure on the power system.
This consumption pattern is not sustainable in the long run, as it affects the efficiency and economy of the energy system. For example, as early as the 1940s, it was discovered in the U.S. that for every 2.8 °C change in temperature above 18 °C, the power load increased by 2% [6]. This indicates that, as global temperatures continue to rise due to climate change, our electricity consumption will also increase, further exacerbating the sustainability challenge.
Therefore, understanding the impact of climate change on electricity consumption and finding ways to manage and reduce this impact is crucial for achieving sustainability in our energy systems. The power industry plays a significant role in promoting the national economy. Research shows that an increase in monthly electricity consumption tends to lead to a corresponding increase in Chinese actual GDP, with a 1.82 unit increase per unit of electricity consumption [7,8,9]. This highlights the importance of electricity to China’s economic development. However, not all changes in electricity consumption can be explained by GDP growth. Research shows that only 23.37% of changes in electricity consumption can be explained by GDP, while other influencing factors such as climate and weather conditions, national energy policies, population, and urbanization also play a significant role in electricity consumption [10].
In recent years, with the availability of data and methodological innovations, lots of studies have been undetaken to investigate the complex relationship between temperature changes and electricity demand from different dimensions and perspectives. For example, Zhang [11] discovered that variations in temperature influence both human economic activity and power consumption, with the latter showing regional differences for identical temperature increases. Al-Mulali et al. [12] also identified a positive and significant long-term impact of temperature on power consumption, which fluctuates based on income group and season. Aroonruengsawat and Auffhammer [13] observed that temperature has a nonlinear and asymmetric influence on power demand, varying by region and income level. They noted that, if the average temperature exceeds a certain threshold, regional electricity consumption escalates in a nonlinear fashion [14]. A comparison between northern and southern countries revealed a more pronounced nonlinear relationship between electricity consumption and temperature in warmer countries. Rolling regression results indicated that summer electricity consumption is more temperature-sensitive [15]. More recently, Damm et al. [16] and Yao [17] reported that temperature has a U-shaped effect on power demand, which is more pronounced in countries with higher incomes and fewer heating degree days.
Moreover, by further analyzing the impact of temperature changes on electricity demand in different regions, seasons, and industries, researchers find that there exist significant regional and industry differences in temperature’s changes of electricity demand [18]. Additionally, there are also significant nonlinear effects and lag effects between the two, affected by holidays, air quality, etc. [19]. Moreover, some also found that temperature changes have a significant positive effect on industrial electricity demand and a long-term equilibrium relationship, affected by economic growth and energy prices, etc. [20,21,22].
Although the above studies cover various dimensions such as different regions, times, industries, and methods, they mainly rely on the regression analysis of historical data. There is still relatively less research on the prediction and evaluation of changes in electricity demand under future temperature change scenarios [23,24,25,26,27]. With the achievement of the global warming agreement, countries have pledged to control the global average temperature rise within 2 °C by the end of this century and even strive to achieve a target of 1.5 °C.
Previous researchers have established many models for simulating and predicting electricity consumption using various methods. The variables involved mainly include trade openness [28], population density [29], urbanization [30], labor productivity [31], temperature and human capital [32], etc. This paper will further evaluate the relative contribution of these variables to electricity consumption, identify the few variables that have the greatest impact on regional non-industrial electricity consumption, and re-establish a new non-industrial electricity consumption prediction model suitable for a certain region to achieve better simulation and prediction effects.
During the period from 1996 to 2005, China experienced rapid economic growth, while also making significant progress in environmental protection. The urban and technological transformation in China had a positive impact on sustainable development. During this transformation process, China successfully balanced economic growth and environmental protection, providing a model for sustainable development for other countries around the world. Therefore, it is of great significance to study the changes in electricity demand under future warming scenarios of 1.5/2 °C, which will help us predict and manage electricity demand, formulate scientific energy policies and energy-saving measures, and tackle the challenges brought about by climate change [30,31,32,33]. In addition, research has found that the sustainability of electricity is closely related to local economic development and environmental pollution [34]. Studying changes in electricity will provide a basis for energy policies, energy infrastructure services, and environmental protection in specific sectors [35]. However, due to data limitations and a relative lack of literature on China’s future climate change scenarios and energy consumption, there is ample scope for further exploration, particularly in the area of temperature change. Based on previous research, this study extends the existing literature and analyzes the nonlinear relationship between non-industrial electricity consumption and temperature increase from the perspective of climate change.
From the above research, it is found that the issues for electricity and energy caused by global warming are quite severe. Scholars in the past few decades have deeply analyzed and explored this issue through modeling and causal analysis methods and have achieved many results [28,29,30,31]. This issue involves the national economy and people’s lives. This paper will use high-resolution models and the new estimation methods of the new era to further study this topic, aiming to reveal the impact of global warming on non-industrial electricity consumption in Chinese cities. The newly established electricity consumption estimation model in this paper can dynamically simulate and estimate the changes in non-industrial electricity consumption in the past and future. It can also dynamically represent the factors affecting non-industrial electricity consumption. This is crucial for achieving the sustainability of energy systems [36]. Furthermore, by reducing power consumption and optimizing energy use, we can reduce greenhouse gas emissions, thereby further slowing the pace of global warming. This is of great importance for achieving global sustainable development goals.
The paper is structured into three main sections. Section 2 outlines the model and methodology employed in the study. In Section 3, the results are presented, which include an analysis of the interannual anomalies of electricity consumption under historical scenarios, as well as the trends of electricity consumption under various future warming scenarios. Section 4 offers a discussion and conclusion. It provides an analysis and comparison of the study’s results, offers recommendations for energy decision makers, and concludes the paper by summarizing the findings and discussing the limitations of this study.
2. Data Sources and Experimental Design
2.1. Data Sources
The observational data for the sites come from the daily dataset (V3.0) of China’s surface climate data from the China Meteorological Data Network. It includes daily data for meteorological elements such as atmospheric pressure, temperature, relative humidity, wind direction and speed, precipitation, evaporation, sunshine duration, and 0 cm ground temperature for all sites from 840 benchmark and basic meteorological stations in China since January 1951 (National Meteorological Science Data Center; http://data.cma.cn/ (accessed on 24 May 2021)). The observational data used for comparison with the simulation results of the historical period are the daily mean temperature, relative humidity, and other basic meteorological parameters from July to September 1996–2005. After comparing the latitude and longitude of the research area, 12 observation sites within the scope of the Pearl River Delta urban agglomeration were selected. The non-industrial electricity consumption model for the historical period was established using data from 2009–2017. The daily average temperature data of the sites corresponding to Guangzhou and Zhuhai were selected to calculate the cooling degree days (CDDs) and heating degree days (HDDs). The socioeconomic data was obtained from the statistical yearbooks of Guangzhou and Zhuhai, including annual GDP data from 2009–2017. The monthly non-industrial electricity consumption data come from the Prospective Database (https://d.qianzhan.com (accessed on 1 June 2021)). Since the future warming scenario used in this paper is RCP4.5, the GDP data for the future period come from the estimated results of China’s grid under the shared socioeconomic pathways Version 2 (SSP2) [35].
2.2. Model Description and Experiment Design
Numerical experiments are a crucial method for studying the urban heat island effect, such as the Weather Research and Forecasting (WRF) model being widely used. The WRF model is a mesoscale forecasting and assimilation system established jointly by institutions such as the National Center for Atmospheric Research (NCAR) and the National Centers for Environmental Prediction (NCEP) in the United States. It has advanced data assimilation technology, powerful nesting capabilities, higher accuracy, and is capable of fine-grained simulation with spatiotemporal resolution. In this study, we utilize three types of urban models nested within the Weather Research and Forecasting (WRF) model: the Single-Layer Urban Canopy Model (UCM), Building Environment Parameterization (BEP), and the Building Energy Model (BEM). These models collectively offer a comprehensive toolkit for the analysis and prediction of urban climate phenomena. We employed the WRF3.9 mesoscale meteorological model, coupled with the UCM, to conduct high-resolution numerical simulations and downscaling analysis of the results derived from the Community Earth System Model (CESM). The configuration, depicted in Figure 1, includes a two-fold nested and land cover setting with spatial resolutions of 15 km and 5 km, respectively, a grid number of 45 × 57, and a total of 37 vertical layers, 16 of which are below 2 km in height. The microphysical process employs the WSM 3-class simple ice scheme, long-wave radiation utilizes the RRTM scheme, short-wave radiation employs the Dudhia scheme, the near-surface layer uses the Revised MM5 Monin–Obukhov scheme, the boundary layer employs the YSU scheme, and cumulus parameterization is exclusively used for the outermost layer, utilizing the Kain–Fritsch scheme [36]. By adjusting the initial temperature field size of the model, we obtained simulation results for the summer historical period (1 June to 31 August, 1996–2005) and for the warming periods of 1.5 °C (2025–2034) and 2.0 °C (2042–2051) for the Pearl River Delta urban agglomeration.
The CESM model, developed by the National Center for Atmospheric Research (NCAR) in the United States, is an earth system model based on the CCSM4 model. It provides state-of-the-art computer simulations of the Earth’s past, present, and future climate states. For this study, we used the historical simulation dataset provided by the CESM model, which has been bias-corrected by ERA-interim data. We selected 1996–2005 as the representative years for the historical climate status, referring to the historical dataset (1995–2005) by Chen et al. [37]. Additionally, this study uses the climate prediction experiment results provided by the RCP4.5 scenario. The ten years before and after the 1.5 °C/2.0 °C warming are used as representative years to simulate the climate characteristics of urban agglomerations under future scenarios.
2.3. A Non-Industrial Electricity Consumption Model
The total electricity consumption of society is composed of industrial electricity consumption, residential electricity consumption, and commercial electricity consumption. It reflects the economic development level and quality of life of a region. Existing research has demonstrated a significant correlation between non-industrial electricity consumption (residential and commercial) and GDP, as well as degree days [25,26,27]. The Pearl River Delta region is one of the most important economic areas in China, with a rapid urbanization process. Urbanization leads to population concentration, dense buildings, and strong electricity demand [25]. Therefore, in the present study, we will mainly focus on the Pearl River Delta and collect the monthly electricity consumption and GDP of the Pearl River Delta urban agglomeration from 2009 to 2017. Based on the strong relationship of meteorological variables and GDP with non-industrial electricity consumption, a multi-variable regression method is used to build up the non-industrial electricity consumption model. Here, the meteorological variables are the CDD and HDD. CDD and HDD have been widely used in the recent literature [35,36,37]. The mathematical quantities CDD and HDD are defined as follows:
and
In Equations (1) and (2), “degree days” are used to quantify the energy demand needed for heating or cooling buildings. It is based on the difference between the daily average temperature and the base temperature. The notation CDD represents the monthly cooling degree days (°C·month), which are the cumulative degree days when the daily average temperature is higher than the base temperature, reflecting the demand for cooling in the region; the notation HDD represents the monthly heating degree days (°C·month), which are the cumulative degree days when the daily average temperature is lower than the base temperature, reflecting the demand for heating in the region; the quantity represents the number of days in the month; the quantity represents the average temperature on day (i). The quantity represents the base temperature, typically 18 °C. Using the CDD and HDD predictors, the non-industrial electricity consumption model is obtained by optimizing the following equation:
In Equation (3), the quantity E is used to denote non-industrial electricity consumption; GDP represents the total output value; the quantities , , are the regression coefficients of GDP, CDD, and HDD on electricity consumption, respectively.
3. Results and Analysis
3.1. Evaluation of WRF Model Simulation Results
Previous research has shown that the WRF simulation system has good consistency when comparing simulated results such as temperature, relative humidity, and wind with observed data [37]. To verify the credibility of the simulation results for urban temperature and relative humidity fields, observational data from 12 automatic meteorological stations within the Pearl River Delta urban agglomeration were selected. These were compared with the simulated 2 m average temperature (T/°C) and relative humidity (RH/%) to test the model’s performance. As shown in Figure 2, the simulated 2 m average temperature and relative humidity are consistent with the observed data trends. In addition, the simulation results have small deviations from the observed ones. Figure 2 indicates that the model has the performance in the simulation of climate evolution in the Pearl River Delta region. Figure 3 illustrates the spatial distribution of the average 2 m temperature and the correlation coefficient between the model simulation and the observed data. The observed data, which excludes the ocean part, reveals that, in areas near the river such as Zhaoqing, Foshan, Guangzhou, Huizhou, and Dongguan, the temperature at 2 m on land is relatively high, reaching up to 29 °C, as shown in Figure 3a. Moreover, the correlation coefficients between the model simulation and the observed data in these regions all exceed 0.7, indicating a strong match. Additionally, in the near-triangle areas of Zhuhai, Zhongshan, and Shenzhen, the temperatures simulated by the model are slightly higher than the observed data. This discrepancy may be attributed to the urban heat island effect and the model boundary capabilities of the Pearl River Delta urban agglomeration [37,38,39]. In summary, the WRF model demonstrates substantial capabilities in simulating spatial temperature distribution. It accurately identifies temperature characteristics in different regions.
3.2. Changes in Temperature
To explore the temperature change trends in the Pearl River Delta urban agglomeration from historical times, from a warming of 1.5 °C to a warming of 2 °C, this study selected the ten-year average temperatures of eight cities in the Pearl River Delta region during these three periods for research. Figure 4 shows the distribution of the ten-year average temperatures in the Pearl River Delta urban agglomeration. The ten-year average temperatures of each city in the Pearl River Delta show an overall upward trend from historical times, from a warming of 1.5 °C to a warming of 2 °C. Among them, Foshan and Jiangmen have relatively lower ten-year average temperatures, and the range of temperature change is smaller, within 0.5 °C. However, Huizhou and Dongguan have relatively higher ten-year average temperatures, and the range of temperature change is larger, exceeding 0.5 °C. Especially in areas such as Huizhou, Guangzhou, Dongguan, and Shenzhen, annual average temperatures are above the average value. Particularly in northern Huizhou, the maximum annual average temperature deviation can reach +0.9 °C, and in southern Huizhou, the maximum increase can reach 0.5 °C. This indicates that these areas have a faster ground temperature growth rate under the background of global warming. In contrast, in areas such as Foshan, Zhongshan, Zhuhai, and Jiangmen, annual average temperature deviations have changed from negative to positive. Especially in the Jiangmen area, annual average temperature has changed from −0.6 °C to +0.5 °C, indicating that its annual average temperature is rising at the fastest rate.
To examine the decadal temperature evolution characteristics in the Pearl River Delta in the context of global warming, we computed the average temperature for eight cities within the Pearl River Delta urban agglomeration. This was conducted for both the historical period and the warming period, using a 10-year interval. Figure 5 presents the decadal average temperature change trends for these eight cities during historical times, as well as during periods of 1.5 °C and 2.0 °C warming. As depicted in the figure, Guangzhou consistently exhibits higher temperatures than the other areas across all periods, and this temperature shows a year-on-year increasing trend. For instance, between 1996 and 2005, the regional average temperature in Guangzhou reached 28.5 °C. Following future warming of 1.5 °C and 2.0 °C, the regional average temperature in Guangzhou is projected to rise to 29 °C and 32.5 °C, respectively. In contrast, the temperature in Huizhou is lower than that in other areas during all periods, but also gradually rises with future warming. For example, during historical times, a warming of 1.5 °C, and a warming of 2.0 °C, the lowest temperatures in Huizhou were 23.5 °C, 24 °C, and 27.5 °C, respectively. Jiangmen is also a low-temperature area, but its temperature change shows a general trend of first decreasing and then increasing. For example, during historical times, a warming of 1.5 °C, and a warming of 2.0 °C, the lowest temperatures in Jiangmen were 24.5 °C, 24.2 °C, and 27.5 °C, respectively.
Overall, in the Pearl River Delta urban agglomeration, most cities such as Guangzhou, Shenzhen, Dongguan, Zhongshan, and Zhuhai are high-temperature areas and continue to warm with interannual changes. Among them, Guangzhou has the highest average temperature and the largest warming range. However, Huizhou, Jiangmen, and Foshan are three low-temperature areas that gradually cool down with interannual changes. Among them, Huizhou has the lowest average temperature and the largest cooling range.
3.3. Evaluation of the Constructed Non-Industrial Electricity Consumption Model
In the preceding subsection, we developed a projection model for non-industrial electricity consumption. This model simulates changes in non-industrial electricity consumption under actual conditions and following temperature increases, thereby enabling an assessment of the impact of temperature changes on the power industry. In this subsection, we evaluate the effectiveness of this model. To this end, we selected Guangzhou and Zhuhai as representative research areas. We gathered data on the monthly electricity consumption and GDP of these two locations for different periods from 2009–2014 and 2010–2017. We also calculated the CDD and HDD using the observations from the site. Using multiple linear regression, we obtained the regression coefficients as shown in Table 1.
Table 1 reveals that the relationship between electricity consumption and GDP is similar in both cities. However, Guangzhou exhibits a much higher sensitivity to degree days than Zhuhai, with the coefficient of degree days in Guangzhou being seven times that of Zhuhai. Interestingly, unlike previous research results for Jiangsu Province [21], the electricity consumption of the Pearl River Delta urban agglomeration exhibits a negative correlation with heating degree days.
Figure 6 presents a comparison between the non-industrial electricity consumption model and the actual electricity consumption in Guangzhou and Zhuhai. The model demonstrates good simulation performance, with the simulation results aligning with the trend of the actual observational data and correlation coefficients, all exceeding 0.9. This suggests that this model is highly reliable in predicting electricity consumption in Guangzhou and Zhuhai. Furthermore, both cities exhibit a clear upward trend in non-industrial electricity consumption, with significant periodicity and volatility. This implies that global warming may accelerate the growth of non-industrial electricity consumption.
3.4. Changes in Non-Industrial Electricity Consumption under Future Warming Scenarios
In the previous subsection, we have validated the reliability of the non-industrial electricity consumption prediction model and estimated the correlation coefficients between the non-industrial electricity consumption models and actual electricity consumption in both Guangzhou and Zhuhai, exceeding 0.9. According to the data from the Intergovernmental Panel on Climate Change (IPCC) [2], in a climate without human influence, extreme high-temperature events that occur once every decade would occur 1.5 times every decade at a warming of 4.1 °C, and 6.2 times at 5 °C. At the same time, extreme heat events will have potential and far-reaching impacts on the power system. So, in this subsection, we will further explore changes in electricity consumption under future warming scenarios of 1.5 °C and 2 °C. Therefore, exploring the changes in electricity consumption under different degrees of warming scenarios in the future will help generate future electricity consumption forecasts and support the operation planning of the power system.
In this subsection, we will further explore changes in electricity consumption under future warming scenarios of 1.5 °C and 2 °C. Here, we also selected Guangzhou and Zhuhai as two representative areas and calculated the annual anomalies of non-industrial electricity consumption for 2009–2014 and 2010–2017, respectively (Figure 7). Our research reveals that the non-industrial electricity consumption in Guangzhou and Zhuhai has been increasing steadily each year. In particular, during the summer months, the increase in non-industrial electricity consumption is more obvious. This phenomenon suggests that, with the development of the local economy, the non-industrial electricity consumption related to residents’ lives and business activities in Guangzhou and Zhuhai is gradually increasing. Moreover, people’s demand for power increases in summer, which is closely related to national economic growth, technological progress, and changes in the lifestyles of the residents. For example, people use air conditioners, refrigerators, televisions, and other electrical appliances more frequently in summer. In Figure 7, one can also notice from the annual anomalies of non-industrial electricity consumption calculated for these two cities that, before 2013, the annual anomalies of non-industrial electricity consumption in both cities were negative, reaching a minimum of −50 TWh. However, after 2013, they turned positive and gradually increased, reaching a maximum of 40 TWh. This indicates that, before 2013, Guangzhou’s non-industrial electricity consumption was below the long-term average level, while, after 2013, it was above the long-term average level. This change is attributed to several factors such as global warming, national economic development, and an accelerated urbanization process, which led to increased demand for urban construction and infrastructure construction. The improved living standards of residents also contributed to an increase in non-industrial electricity demand and household electricity consumption. Notably, in 2013, the loss of non-industrial electricity consumption reached a relative balance with the multi-year average. However, changes in electricity consumption can also affect local temperature conditions, especially at night and in densely populated areas, where temperatures can rise by up to about 1.2 °C [38,39,40,41].
As mentioned above, changes in non-industrial electricity consumption in the Pearl River Delta urban agglomeration are not only related to local economic activities, policy adjustments [42], and technological progress, but also local policy formulation and grid planning [35]. Therefore, it is crucial to understand the actual changes in non-industrial electricity consumption in this region to make informed decisions about the power demand of the non-industrial sector. To this end, the annual anomalies in electricity consumption for Guangzhou and Zhuhai from 2009 to 2014 and from 2010 to 2017 are calculated, respectively (Figure 7). The Detrended Fluctuation Analysis (DFA) method [33] is then used to remove the long-term trend caused by the non-stationarity of the time series (Figure 8). This method effectively reveals the natural global warming caused by human factors. The results show that, after eliminating the upward trend of interannual changes, the annual non-industrial electricity consumption in Guangzhou and Zhuhai fluctuates around zero and shows obvious periodic characteristics, with a fluctuation period of about 6 months. It indicates that, besides being affected by human factors such as urban market demand, trade policies, and high-tech services, the non-industrial electricity consumption of the Pearl River Delta urban agglomeration is also influenced by climate change effects. Therefore, in a climate without human influence, warming will cause more extreme events, resulting in serious losses to the power system [2], among which the summer non-industrial electricity consumption loss is the most severe.
GDP serves as a pivotal measure of a region’s economic activity, with its fluctuations directly influencing electricity demand. By examining the GDP alterations in various cities under distinct warming scenarios, we can delve deeper into understanding the repercussions of global warming on non-industrial electricity consumption in the Pearl River Delta. Similarly, CDDs act as a significant gauge of a region’s cooling requirements. As temperatures rise, there could be an escalation in the utilization of cooling appliances like air conditioners, subsequently leading to an increase in electricity consumption. Figure 9 delineates the trends in CDD and GDP for Guangzhou and Zhuhai over historical periods, as well as periods of 1.5 °C and 2 °C warming. As evident from Figure 9a and Table 2, Guangzhou has consistently lower CDDs than Zhuhai over all periods. However, as temperatures rise, the CDDs of Guangzhou also increase year by year. For example, during historical periods, warming of 1.5 °C, and warming of 2 °C, Guangzhou’s CDDs were 56.79 °C·month, 78.02 °C·month, and 87.97 °C·month, respectively. Zhuhai’s CDD data also show a similar increasing trend, at 66.71 °C·month, 85.43 °C·month, and 96.51 °C·month, respectively. Compared to the CDD during historical periods, the difference in CDD between Guangzhou and Zhuhai remains unchanged after warming. Moreover, it is not difficult to find that both Guangzhou and Zhuhai have increased CDDs under warming of 1.5 °C and 2 °C scenarios, indicating an increase in regional cooling demand. According to the regression model between electricity consumption and influencing factors mentioned earlier, an increase in CDD would contribute to an increase in electricity consumption.
From Figure 9b and Table 2, it can be seen that the GDPs of Guangzhou and Zhuhai were at a relatively low level during historical periods, but both experienced significant growth during the warming of 1.5 °C period. For example, in the ten years before and after the warming of 1.5 °C, Guangzhou’s GDP increased by CNY 54,776.45 billion, while Zhuhai’s GDP increased by CNY 6179.96 billion. However, during the warming of 2 °C period, the GDP of both places declined. For example, in the ten years before and after the warming of 2 °C, Guangzhou’s GDP decreased by CNY 5430.82 billion, a decrease of 9.41%, while Zhuhai’s GDP decreased by CNY 5205.24 billion, a decrease of 79.36%. In addition, it can also be seen from the figure that the ten-year average temperature of both places showed an upward trend from historical periods to the warming of 1.5 °C period but showed a downward trend during the warming of 2 °C period. This suggests that there is a certain correlation between changes in GDP and temperature changes in Guangzhou and Zhuhai.
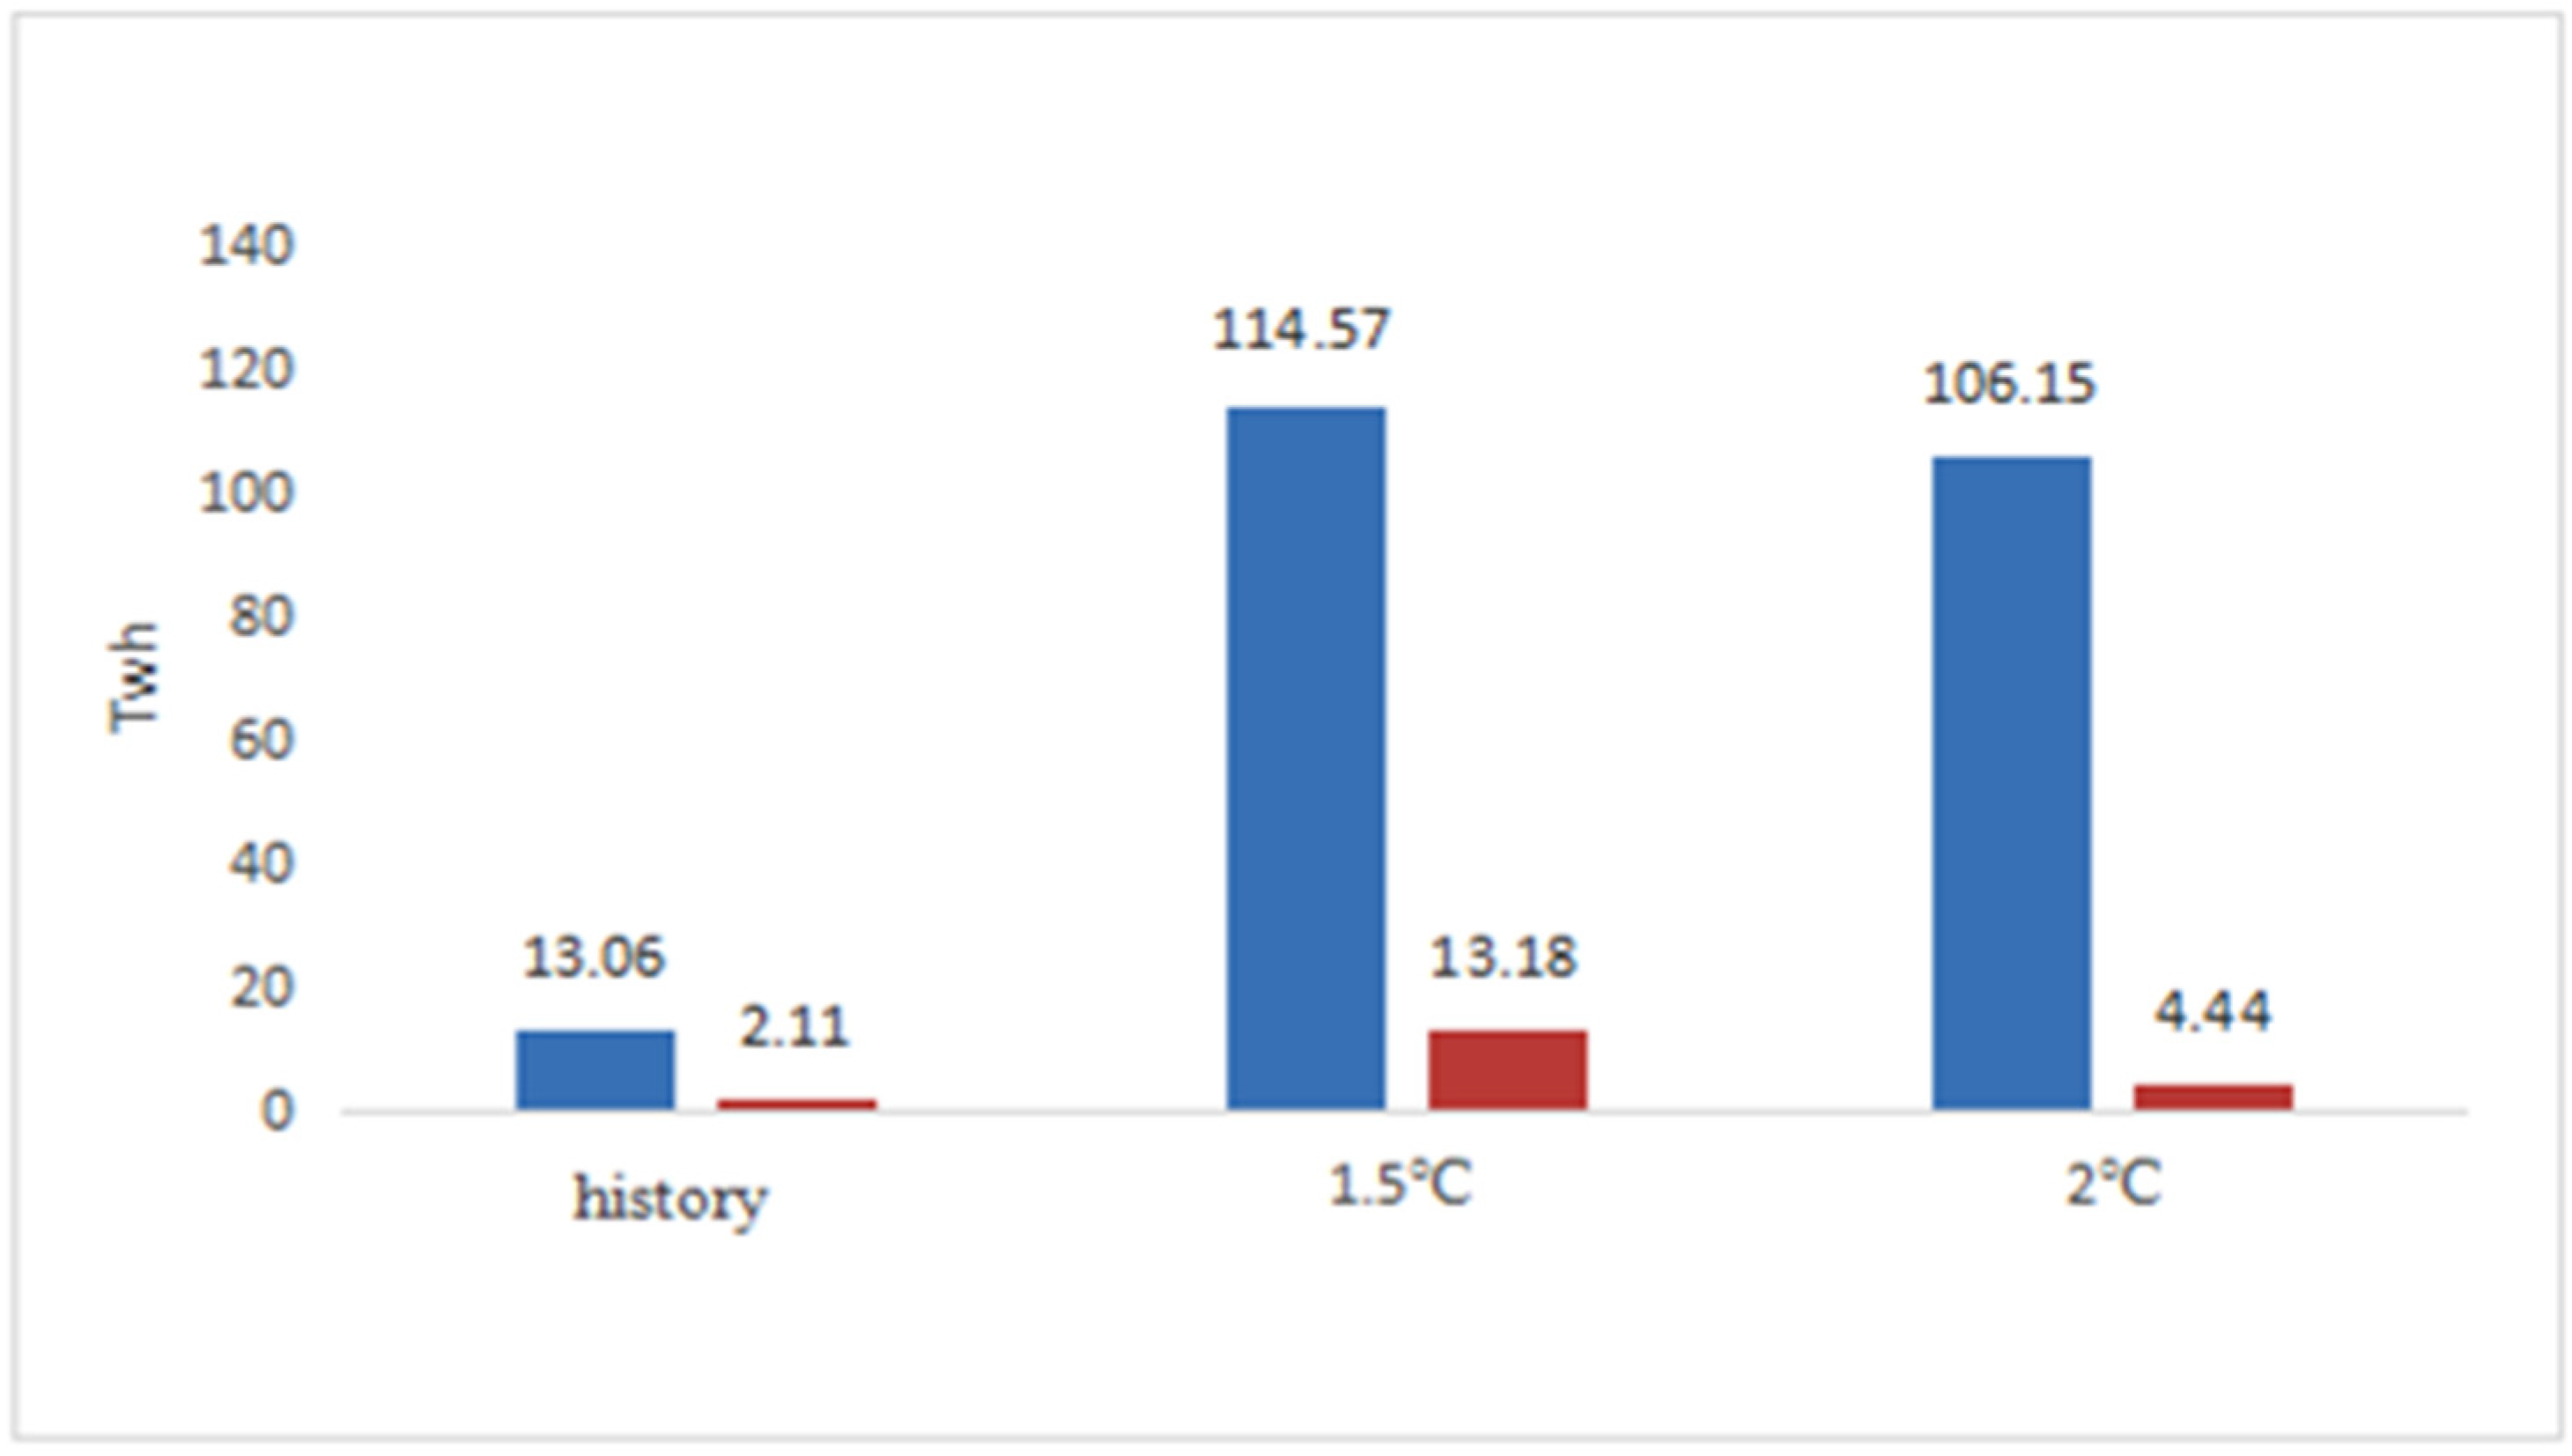
In Figure 10 and Table 2, we can observe the trends in non-industrial electricity consumption in Guangzhou and Zhuhai during different scenarios of historical periods, warming of 1.5 °C, and warming of 2 °C. As the temperature rises, both cities experience an increase in non-industrial electricity consumption. The highest increases are seen in Guangzhou and Zhuhai, with 10.151 TWh and 1.107 TWh, respectively. Interestingly, when the temperature rises by 1.5 °C, the electricity consumption in both places is higher than the non-industrial electricity consumption when the temperature rises by 2 °C. Specifically, the maximum non-industrial electricity consumption during a warming of 2 °C is 0.874 TWh lower than during a warming of 1.5 °C. It is worth noting that Guangzhou experienced the highest increase in electricity consumption, which was about 10 TWh more than the average electricity consumption during the historical periods. In addition, according to the non-industrial electricity consumption projection model, it can be found that after warming, the trend of changes in electricity consumption is similar to the trend of GDP changes, indicating that GDP has a significant impact on electricity consumption.
4. Discussion and Conclusions
From the above results, it can be seen that the overall trend of non-industrial electricity consumption under the global warming scenario estimated in this paper is consistent with previous expectations. Non-industrial electricity consumption tends to increase during periods of temperature rise, which may be related to the use of high-power appliances after warming. Interestingly, when the temperature increase exceeds a certain threshold, non-industrial electricity consumption decreases. This is a new finding in this paper, that too high a temperature may also cause a lag effect in the electricity industry. The specific reasons need further study. The results of this paper should encourage policymakers to formulate a series of energy-saving and emission reduction measures, control the speed and intensity of global warming, and achieve the sustainable development of the ecological economy.
One main part of the study is that we built a new electricity consumption model for Guangzhou and Zhuhai to empirically estimate the electricity consumption using climate data; this is crucial for achieving the sustainability of energy systems. We analyzed the changes in electricity consumption in the urban agglomeration of the Pearl River Delta under future warming scenarios of 1.5 °C and 2 °C, with Guangzhou and Zhuhai serving as representative cities. The results are summarized as follows:
- The model can simulate the thermal environment characteristics of the Pearl River Delta urban agglomeration well and can simulate the change laws of 2 m temperature and relative humidity. The simulation results have a small deviation from the observation results. The simulation results obtained using the WRFV3.9 model and parameterization scheme are credible, indicating that the model has a good simulation effect for the Yangtze River Delta region.
- The temperatures of various cities in the Pearl River Delta are generally on an upward trend. Foshan and Jiangmen have relatively low ten-year average temperatures, and the temperature change range is relatively small. Huizhou and Dongguan have relatively high ten-year average temperatures, and the temperature change range is relatively large. The warming speed is faster in areas such as Huizhou, Guangzhou, Dongguan, Shenzhen, etc.
- The relationship between electricity consumption and GDP in Guangzhou and Zhuhai is not much different, but Guangzhou is more sensitive to degree days than Zhuhai. The coefficient of degree days in Guangzhou is about seven times that of Zhuhai. At the same time, the electricity consumption of the Pearl River Delta urban agglomeration is negatively correlated with heating degree days.
- Non-industrial electricity consumption in Guangzhou and Zhuhai has a clear trend of continuous annual growth. Under warming scenarios of 1.5/2 °C, electricity consumption in both places has increased, with a significant increase in electricity consumption in Guangzhou, which is about 10 TWh more than the average electricity consumption during historical periods. However, non-industrial electricity consumption in both places has slightly decreased under a warming scenario of 2 °C, with a decrease of about 0.874 TWh.
Our research indicates that we need to seek more sustainable energy solutions to cope with the pressure on the power system due to hot weather. Our findings not only reveal the severity of this issue but also provide a new perspective for future research on sustainable development. Due to limitations such as data availability and research dimensions, the projection model established in this paper is linear and does not consider the impact of non-linear factors such as energy price adjustments and national policies. These factors may also affect the trend and magnitude of changes in non-industrial electricity consumption. Therefore, in the future, we will try to consider these detailed factors and construct a more reasonable and precise non-linear mathematical model or statistical model using big data techniques and AI techniques. In addition, this paper only estimates changes in non-industrial electricity consumption under warming scenarios of 1.5/2 °C, while industrial electricity consumption is affected by climate change. Subsequent research can be extended to estimate industrial electricity consumption and the total electricity consumption of society to more comprehensively assess the impact of climate change on energy consumption.
Finally, for researchers, this study provides a new and data-based method that can effectively analyze and evaluate the impact of global warming on non-industrial electricity consumption, as well as changes in electricity demand under different climate change scenarios. This method can help researchers gain a deeper understanding of the relationship between global warming and energy consumption. This study also provides researchers with a new research direction, namely, exploring the impact of non-linear factors on non-industrial electricity consumption and how to establish more accurate and flexible prediction models. In addition, through this study, decision makers can understand the changing laws and influencing factors of non-industrial electricity consumption, as well as changes in electricity demand under different climate change scenarios. This can help decision makers better plan and allocate electricity resources, improve the stability and reliability of the power system, and reduce electricity costs and risks.
Author Contributions
T.L. and M.Z. were responsible for conceptualizing and writing the paper, including temperature, humidity, CDD, HDD, downloading and organizing and calculating GDP data, modeling electricity consumption and analyzing the growth of electricity consumption; Writing—review & editing, L.T. All authors have read and agreed to the published version of the manuscript.
Funding
This study was supported by the Startup Foundation for Introducing Talent of NUIST.
Institutional Review Board Statement
Not applicable.
Informed Consent Statement
Not applicable.
Data Availability Statement
Data are contained within the article, and the datasets used and/or analyzed during the current study are available from the corresponding author on reasonable.
Acknowledgments
We would like to express our deepest gratitude to Zhang Ronghua, and Ma Hongyun for their invaluable advice and patient guidance throughout the writing and revision process of this paper. Their expertise and insights have greatly enriched our work. We also extend our sincere thanks to the China Meteorological Data Network, the statistical yearbooks of Guangzhou and Zhuhai, and the shared socioeconomic pathways Version 2 (SSP2) for providing invaluable data and resources that were instrumental in our research. Their contributions have significantly advanced our understanding of this field. This study was supported by the Startup Foundation for Introducing Talent of NUIST.
Conflicts of Interest
The authors declare no conflict of interest.
References
- Zhang, R.-H.; Rothstein, L.M.; Busalacchi, A.J. Origin of upper-ocean warming and El Nino change on decadal scales in the tropical Pacific Ocean. Nature 1998, 39, 879–883. [Google Scholar] [CrossRef]
- Allen, M.; Babiker, M.; Chen, Y.; Zickfeld, K. Summary for policymakers. In Global Warming of 1.5 °C; IPCC: Geneva, Switzerland, 2018. [Google Scholar]
- Cawthorne, D.; de Queiroz, A.R.; Eshraghi, H.; Sankarasubramanian, A.; DeCarolis, J.F. The Role of Temperature Variability on Seasonal Electricity Demand in the Southern US. Front. Sustain. Cities 2021, 3, 644789. [Google Scholar] [CrossRef]
- Ocal, O.; Aslan, A. Renewable energy consumption-economic growth nexus in Turkey. Renew. Sustain. Energy Rev. 2013, 28, 494–499. [Google Scholar] [CrossRef]
- Pardo, A.; Meneu, V.; Valor, E. Temperature and seasonality influences on Spanish electricity load. Energy Econ. 2002, 24, 55–70. [Google Scholar] [CrossRef]
- Han, J.S.; Tan, Z.F. Interpretive Structural Model of Generalized Power System. Autom. Electr. Power Syst. 2008, 32, 42–49. [Google Scholar]
- Tang, Q.; Liu, Y.J. Empirical research on the relationship between energy consumption and economic growth in two periods in China. Sci. Technol. Manag. Res. 2011, 8, 31–40. [Google Scholar]
- Abdrabo, M.A.K.A.; Hassaan, M.A.; Abdelraouf, H. Impacts of Climate Change on Seasonal Residential Electricity Consumption by 2050 and Potential Adaptation Options in Alexandria Egypt. Am. J. Clim. Chang. 2018, 7, 11. [Google Scholar] [CrossRef]
- Erdem, H.H.; Sevilgen, S.H. Case study: Effect of ambient temperature on the electricity production and fuel consumption of a simple cycle gas turbine in Turkey. Appl. Therm. Eng. 2006, 26, 320–326. [Google Scholar] [CrossRef]
- Huang, B.; Zeng, Y.H. Empirical Analysis of the Correlation between Electricity Consumption and Economic Growth. J. North China Electr. Power Univ. 2004, 7, 31–33. [Google Scholar]
- Zhang, C.; Liao, H.; Mi, Z.F. Climate impacts: Temperature and electricity consumption. Nat. Hazards 2019, 99, 14–21. [Google Scholar] [CrossRef]
- Al-Mulali, U.; Ozturk, I.; Lean, H. The influence of economic growth, urbanization, trade openness, financial development, and renewable energy on pollution in Europe. Nat. Hazards 2015, 79, 621–644. [Google Scholar] [CrossRef]
- Auffhammer, M.; Aroonruengsawat, A. Erratum to Simulating the impacts of climate change, prices and population on California’s residential electricity consumption. Clim. Chang. 2012, 113, 1101–1104. [Google Scholar] [CrossRef]
- Liao, S.Y.; Chen, C.C.; Hsu, C.S. The Non-Linear Relationship between Electricity Consumption and Temperature in Taiwan: An Application for STR (Smooth Transition Regression) Model. Mod. Econ. 2018, 9, 587–605. [Google Scholar] [CrossRef]
- Bessec, M.; Fouquau, J. The non-linear link between electricity consumption and temperature in Europe: A threshold panel approach. Energy Econ. 2008, 30, 2705–2721. [Google Scholar] [CrossRef]
- Damm, A.; Kberl, J.; Prettenthaler, F.; Rogler, N.; Töglhofer, C. Corrigendum to “Impacts of +2 °C global warming on electricity demand in Europe”. Clim. Serv. 2023, 4, 31–43. [Google Scholar]
- Yao, J. Electricity Consumption and Temperature: Evidence from Satellite Data. IMF Work. Pap. 2021, 22, A001. [Google Scholar] [CrossRef]
- Tanaka, K.; Matsumoto, K.; Keeley, A.R.; Managi, S. The impact of weather changes on the supply and demand of electric power and wholesale prices of electricity in Germany. Sustain. Sci. 2022, 17, 1813–1825. [Google Scholar] [CrossRef]
- Li, L.; Song, X.; Li, J.; Li, K.; Jiao, J. The Impacts of temperature on residential electricity consumption in Anhui, China: Does the electricity price matter? Clim. Chang. 2023, 176, 26. [Google Scholar] [CrossRef]
- Kpodar, K.R.; Liu, B. The Distributional Implications of the Impact of Fuel Price Increases on Inflation. IMF Work. Pap. 2021, 271, A001. [Google Scholar] [CrossRef]
- Liu, K.; Du, Y.; Chen, W.; Wu, X. Simulation of interaction between high-temperature process and heat emission from electricity system in summer. Glob. Energy Interconnect. 2022, 5, 692–702. [Google Scholar] [CrossRef]
- Tol, R.S.J. The Economic Effects of Climate Change. J. Econ. Perspect. 2009, 23, 29–51. [Google Scholar] [CrossRef]
- Obringer, R.; Kumar, R.; Nateghi, R. Managing the water–electricity demand nexus in a warming climate. Clim. Chang. 2020, 159, 233–252. [Google Scholar] [CrossRef]
- Salehizade, A.A.; Rahmanian, M.; Farajzadeh, M.; Ayoubi, A. Analysis of Temperature Changes on Electricity Consumption in Fars Province. Mediterr. J. Soc. Sci. 2015, 6, 610. [Google Scholar] [CrossRef]
- Zhang, M.; Cheng, C.H.; Ma, H.Y. Projection of residential and commercial electricity consumption under SSPs in Jiangsu province, China. Adv. Clim. Chang. Res. 2020, 11, 131–140. [Google Scholar] [CrossRef]
- Han, W.; Su, J.; Wang, L. Effects of urbanization on human comfort in the Yangtze River Delta. J. Appl. Meteorol. Sci. 2013, 24, 380–384. [Google Scholar]
- Al-Zayer, J.; Al-Ibrahim, A.A. Modelling the impact of temperature on electricity consumption in the Eastern Province of Saudi Arabia. J. Forecast. 1996, 15, 97–106. [Google Scholar] [CrossRef]
- Kasman, A.; Duman, Y.S. CO2 emissions, economic growth, energy consumption, trade and urbanization in new EU member and candidate countries: A panel data analysis. Econ. Model 2015, 44, 97–103. [Google Scholar] [CrossRef]
- Holden, E.; Norland, I.T. Three Challenges for the Compact City as a Sustainable Urban Form: Household Consumption of Energy and Transport in Eight Residential Areas in the Greater Oslo Region. Urban Stud. 2005, 42, 2145–2166. [Google Scholar] [CrossRef]
- Dujardin, S.; Marique, A.F.; Teller, J. Spatial planning as a driver of change in mobility and residential energy consumption. Energy Build. 2014, 68, 779–785. [Google Scholar] [CrossRef]
- Román-Collado, R.; Colinet, M.J. Are labor productivity and residential living standards drivers of the energy consumption changes? Energy Econ. 2018, 74, 746–756. [Google Scholar] [CrossRef]
- Pablo-Romero, M.D.P.; Sánchez-Braza, A.; González-Jara, D. Economic growth and global warming effects on electricity consumption in Spain: A sectoral study. Environ. Sci. Pollut. Res. Int. 2022, 30, 43096–43112. [Google Scholar] [CrossRef] [PubMed]
- Ausloos, K.I. Application of the detrended fluctuation analysis (DFA) method for describing cloud breaking. Phys. A Stat. Mech. Its Appl. 1999, 35, 18–27. [Google Scholar]
- Shameem, M.P.; Villanthenkodath, M.A.; Chittedi, K.R. Economic growth and sectoral level electricity consumption nexus in India: New evidence from combined cointegration and frequency domain causality approaches. Int. J. Sustain. Energy 2022, 41, 1721–1738. [Google Scholar] [CrossRef]
- Jiang, T.; Zhao, J.; Jing, C.; Cao, L.; Wang, Y.J.; Huang, J.L.; Su, B.D.; Wang, R. Projection of population changes in China and its provinces under the IPCC Shared Socioeconomic Pathways. Prog. Clim. Chang. Res. 2017, 13, 128–137. [Google Scholar]
- Li, H.J.; Ma, H.Y.; Lin, Y.T.; Liang, Y.X. Numerical simulation of the impact of urban group heterogeneity on regional heat island effect in the Yangtze River Delta. Meteorol. Sci. 2019, 39, 194–205. [Google Scholar]
- Chen, L.; Ma, Z.; Li, Z.; Wu, L.; Flemke, J.; Li, Y. Dynamical Downscaling of Temperature and Precipitation Extremes in China under Current and Future Climates. Atmos.-Ocean. 2018, 56, 55–70. [Google Scholar] [CrossRef]
- Tian, W.W.; Huang, Z.Y.; Hu, C.J. Research on climate warming and urban heat island in Xi’an. J. Appl. Meteorol. Sci. 2006, 17, 438–443. [Google Scholar]
- Aroonruengsawat, A.; Auffhammer, M. Impacts of Climate Change on Residential Electricity Consumption: Evidence from Billing Data. NBER Chapters 2011, 52, 666–673. [Google Scholar]
- Kim, H.G. Effects of Climate Change on Electricity Consumption: A Decomposition of Industrial, Residential, Agricultural, And Commercial Sectors. Clim. Chang. Econ. 2021, 12, 2150014. [Google Scholar] [CrossRef]
- Duan, H.L.; Qian, H.S. Responses of the electric power consumption to climate change in Guangzhou city. J. Appl. Meteorol. Sci. 2009, 20, 80–87. [Google Scholar]
- Carraro, C.; Massetti, E. Energy and climate change in China. Environ. Dev. Econ. 2012, 17, 689–713. [Google Scholar] [CrossRef]
Figure 1.
(a) The double-layered setting of the Pearl River Delta urban agglomeration and (b) the land cover-type map of the innermost layer of the simulated area. (The black dots represent the observation stations in the Chinese surface climate daily dataset).
Figure 1.
(a) The double-layered setting of the Pearl River Delta urban agglomeration and (b) the land cover-type map of the innermost layer of the simulated area. (The black dots represent the observation stations in the Chinese surface climate daily dataset).
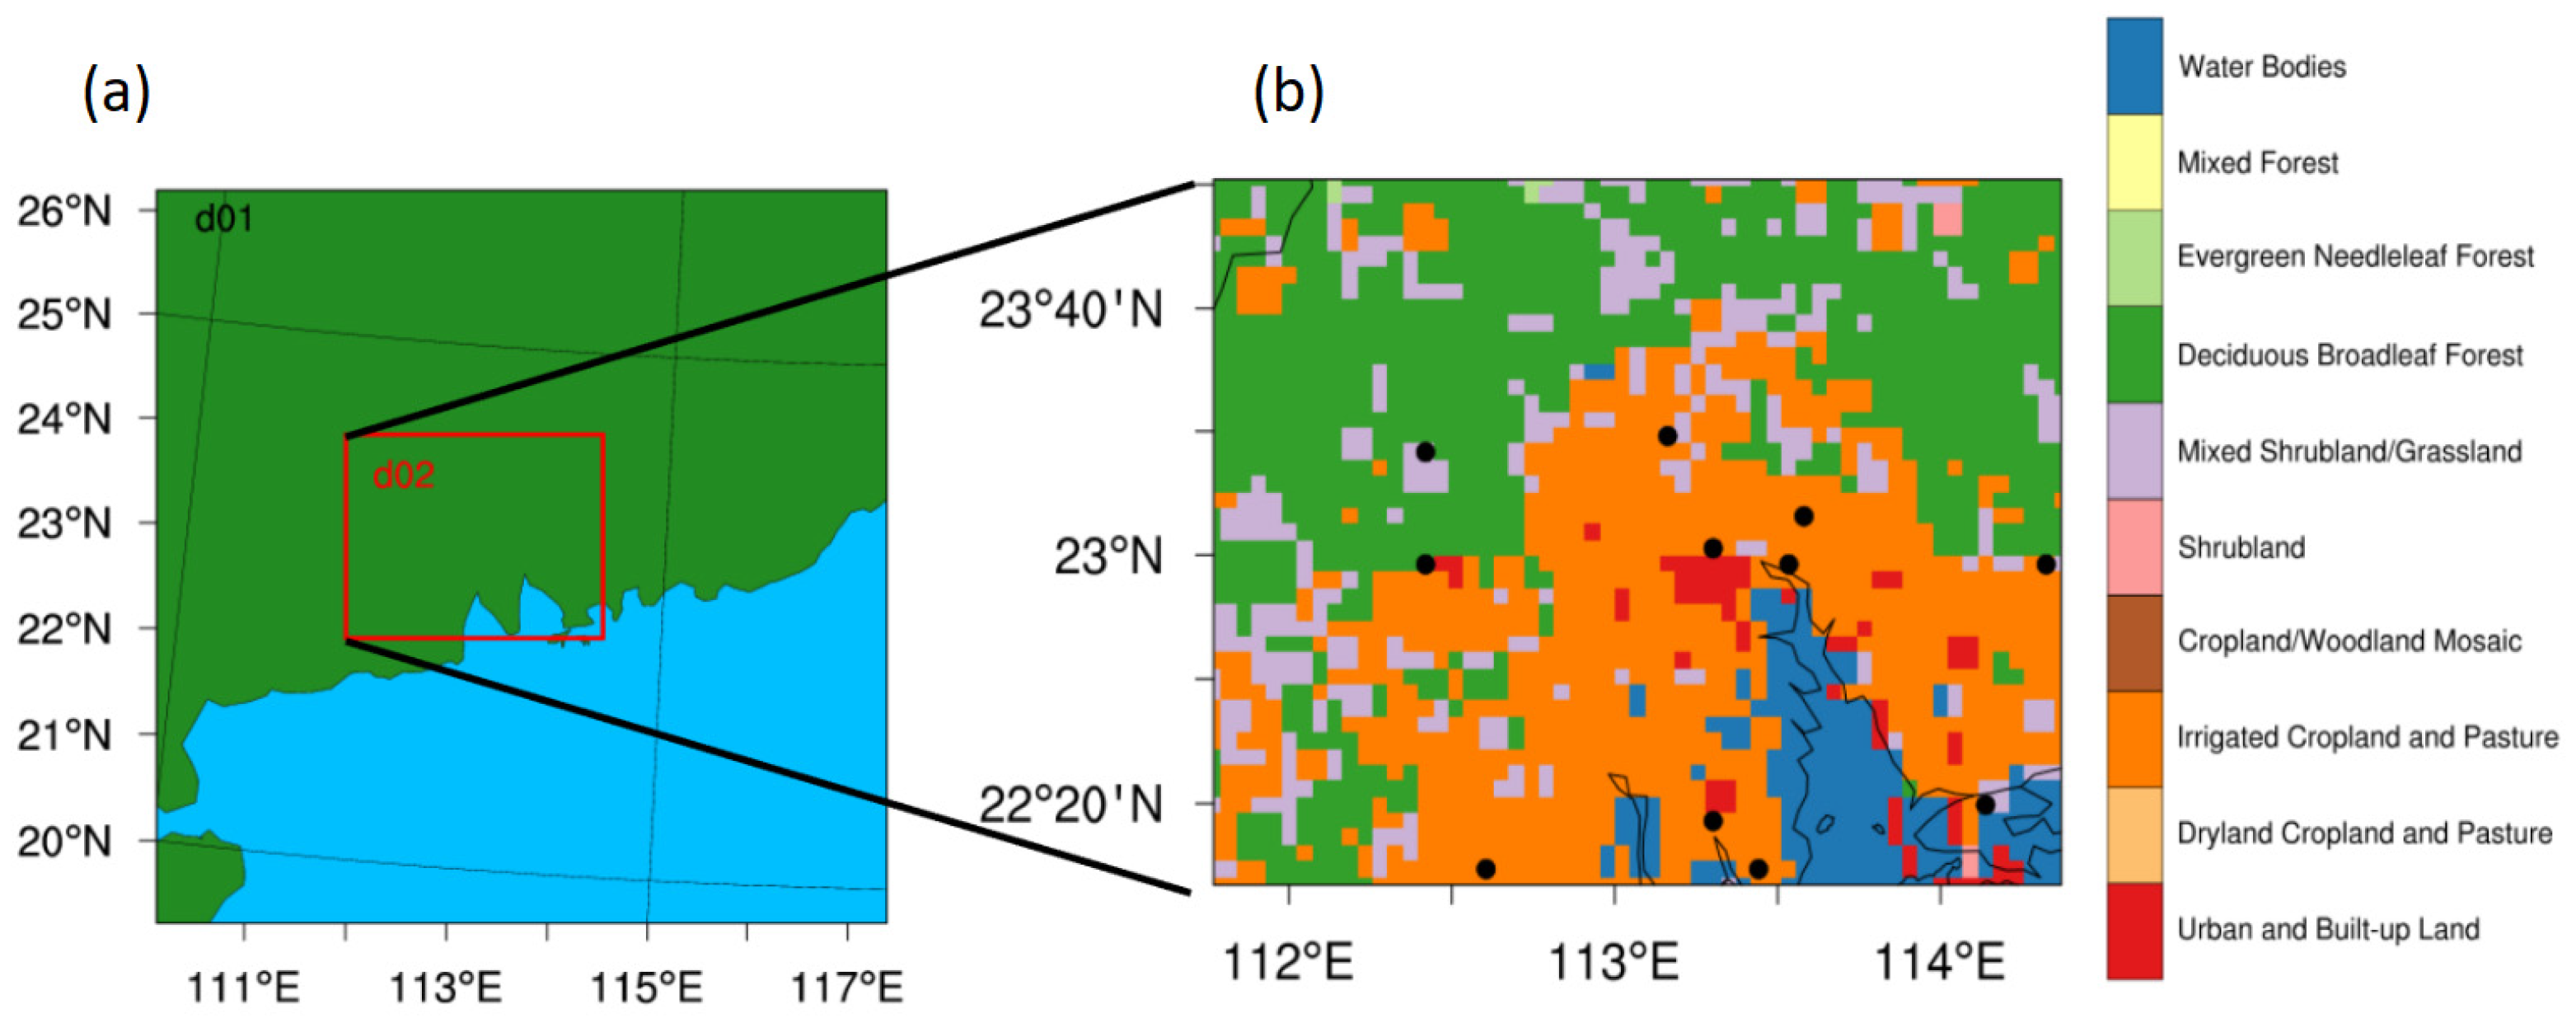
Figure 2.
Comparison of daily simulated values (CTRL, red lines) and observed values (OBS, blue lines) of (A) 2 m average temperature (unit: °C) and (B) relative humidity (unit: %) during the summer (1 June–31 August) from 1996 to 2005.
Figure 2.
Comparison of daily simulated values (CTRL, red lines) and observed values (OBS, blue lines) of (A) 2 m average temperature (unit: °C) and (B) relative humidity (unit: %) during the summer (1 June–31 August) from 1996 to 2005.
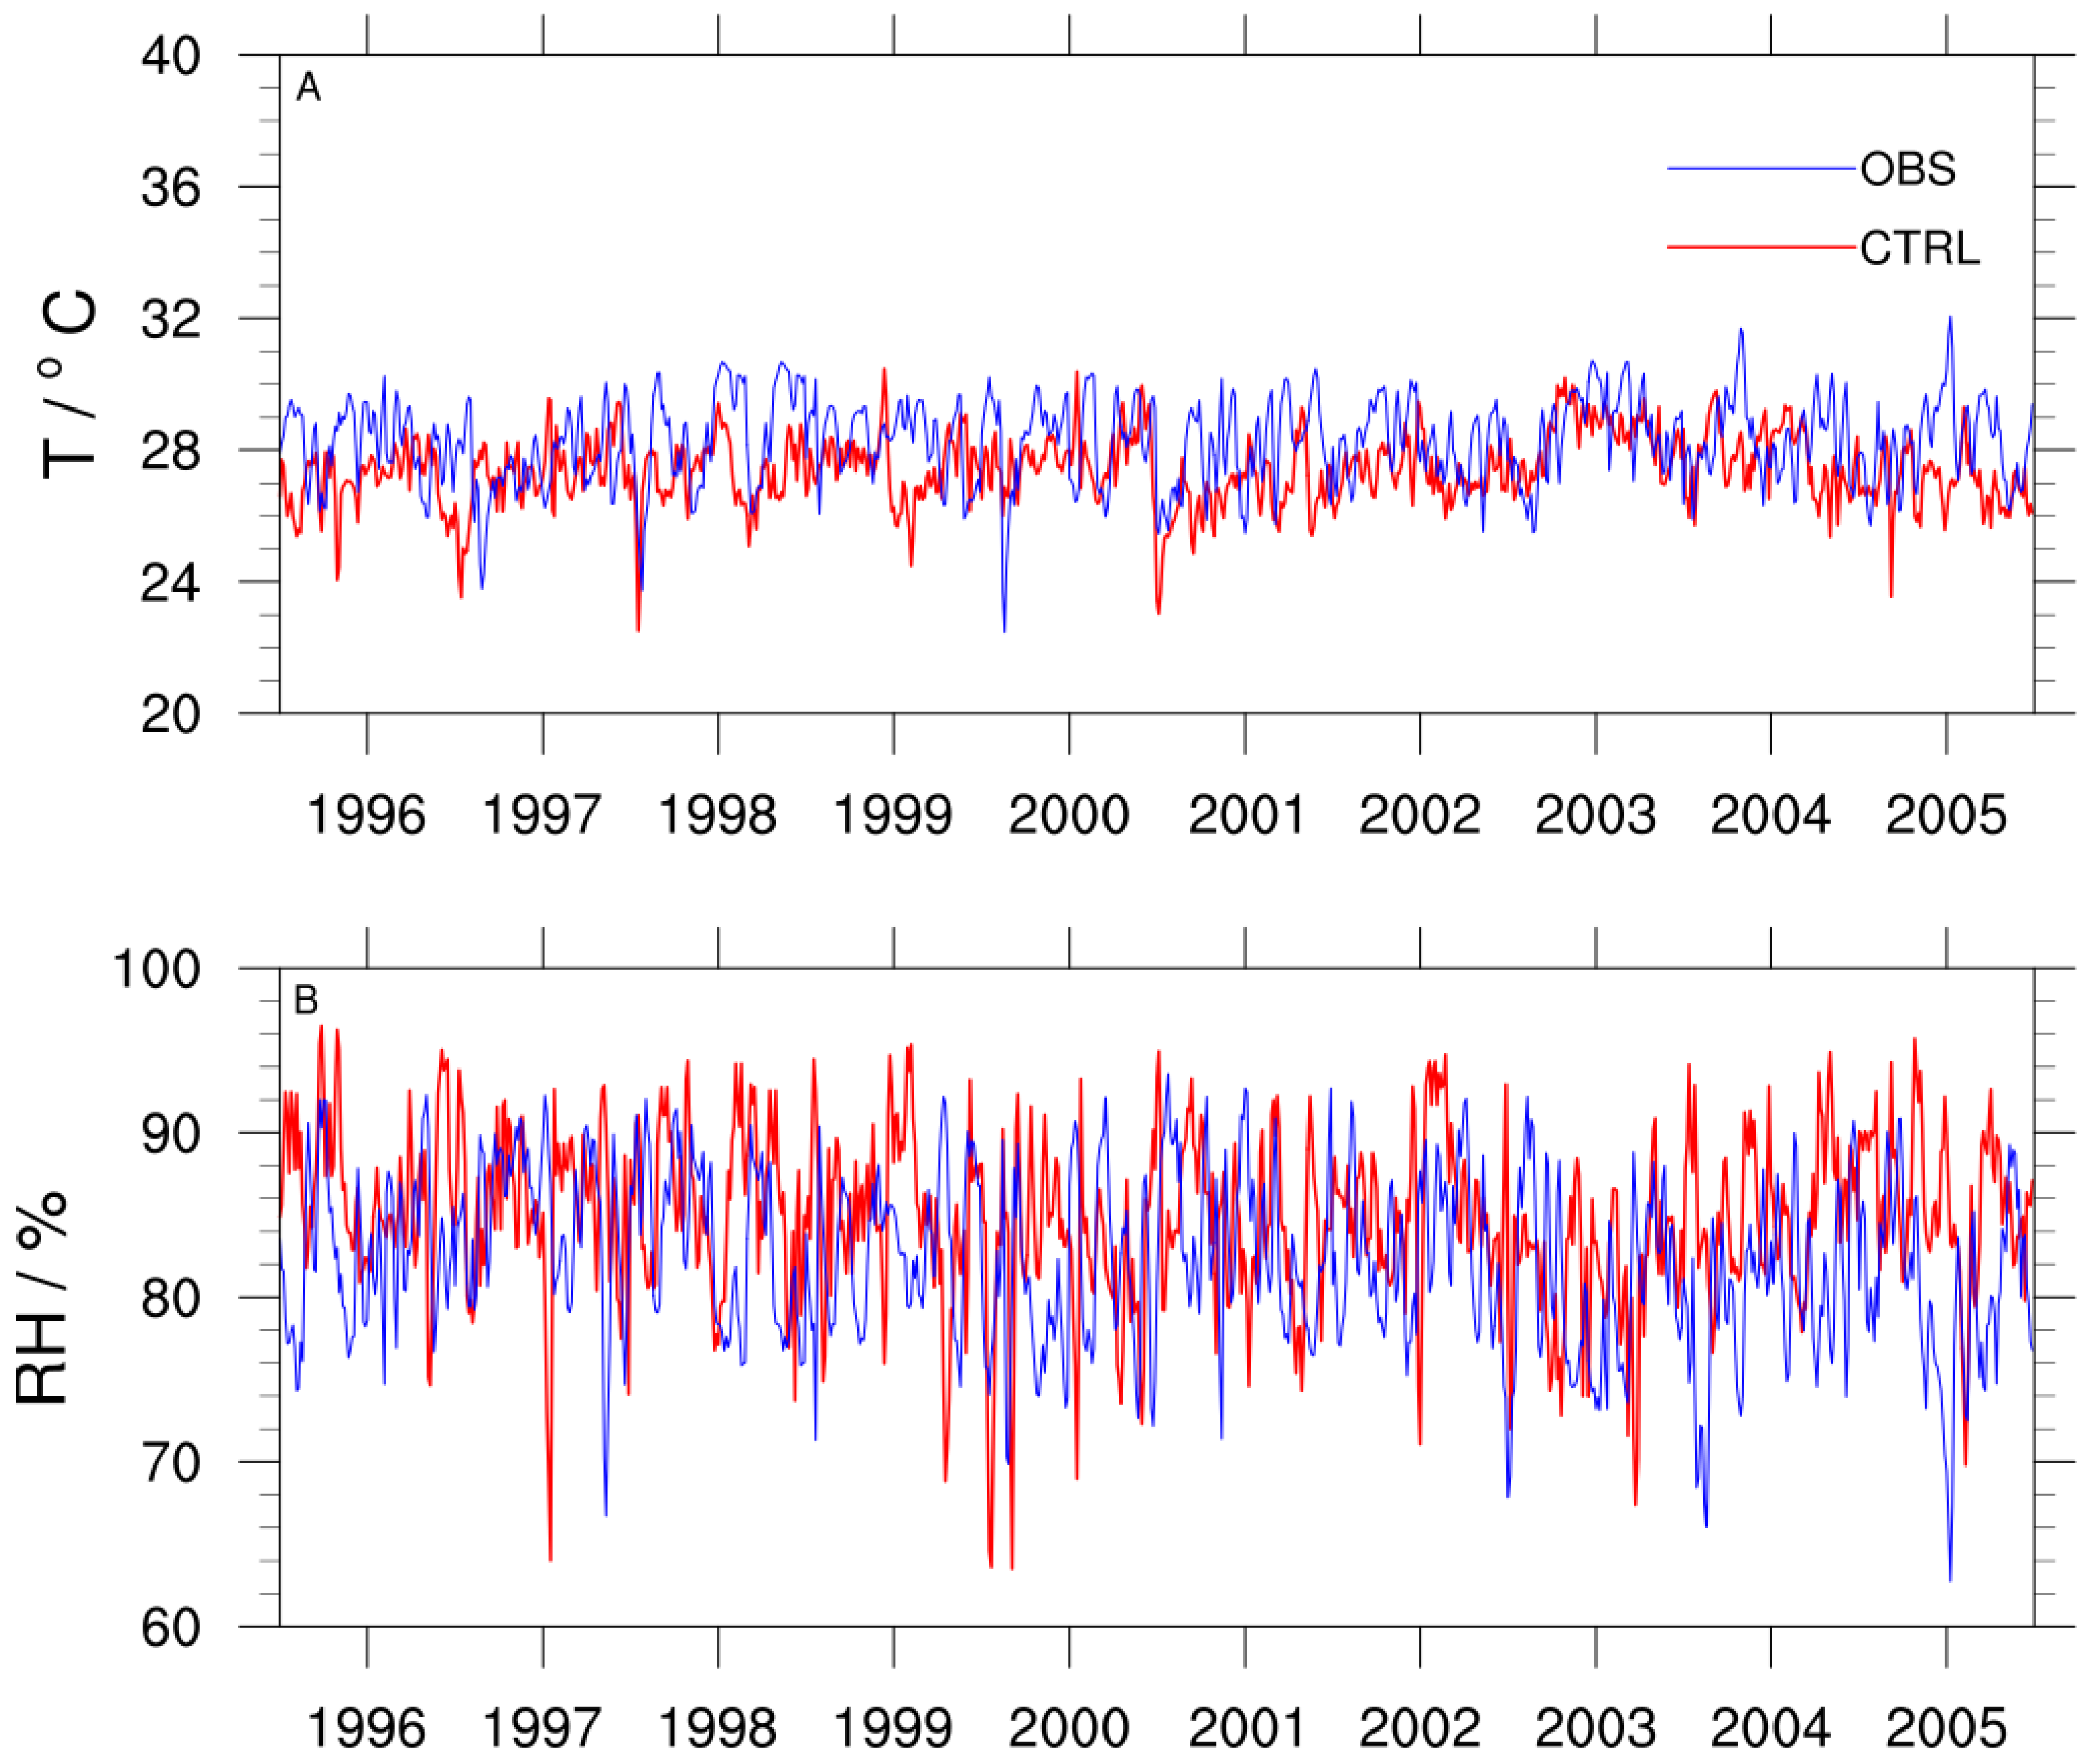
Figure 3.
Spatial distribution map of the ten-year average of observed values (a) and model simulation (b) of 2 m average temperature (unit: °C) during the summer (1 June–31 August) from 1996 to 2005 (The dotted areas have a correlation coefficient greater than 0.7).
Figure 3.
Spatial distribution map of the ten-year average of observed values (a) and model simulation (b) of 2 m average temperature (unit: °C) during the summer (1 June–31 August) from 1996 to 2005 (The dotted areas have a correlation coefficient greater than 0.7).
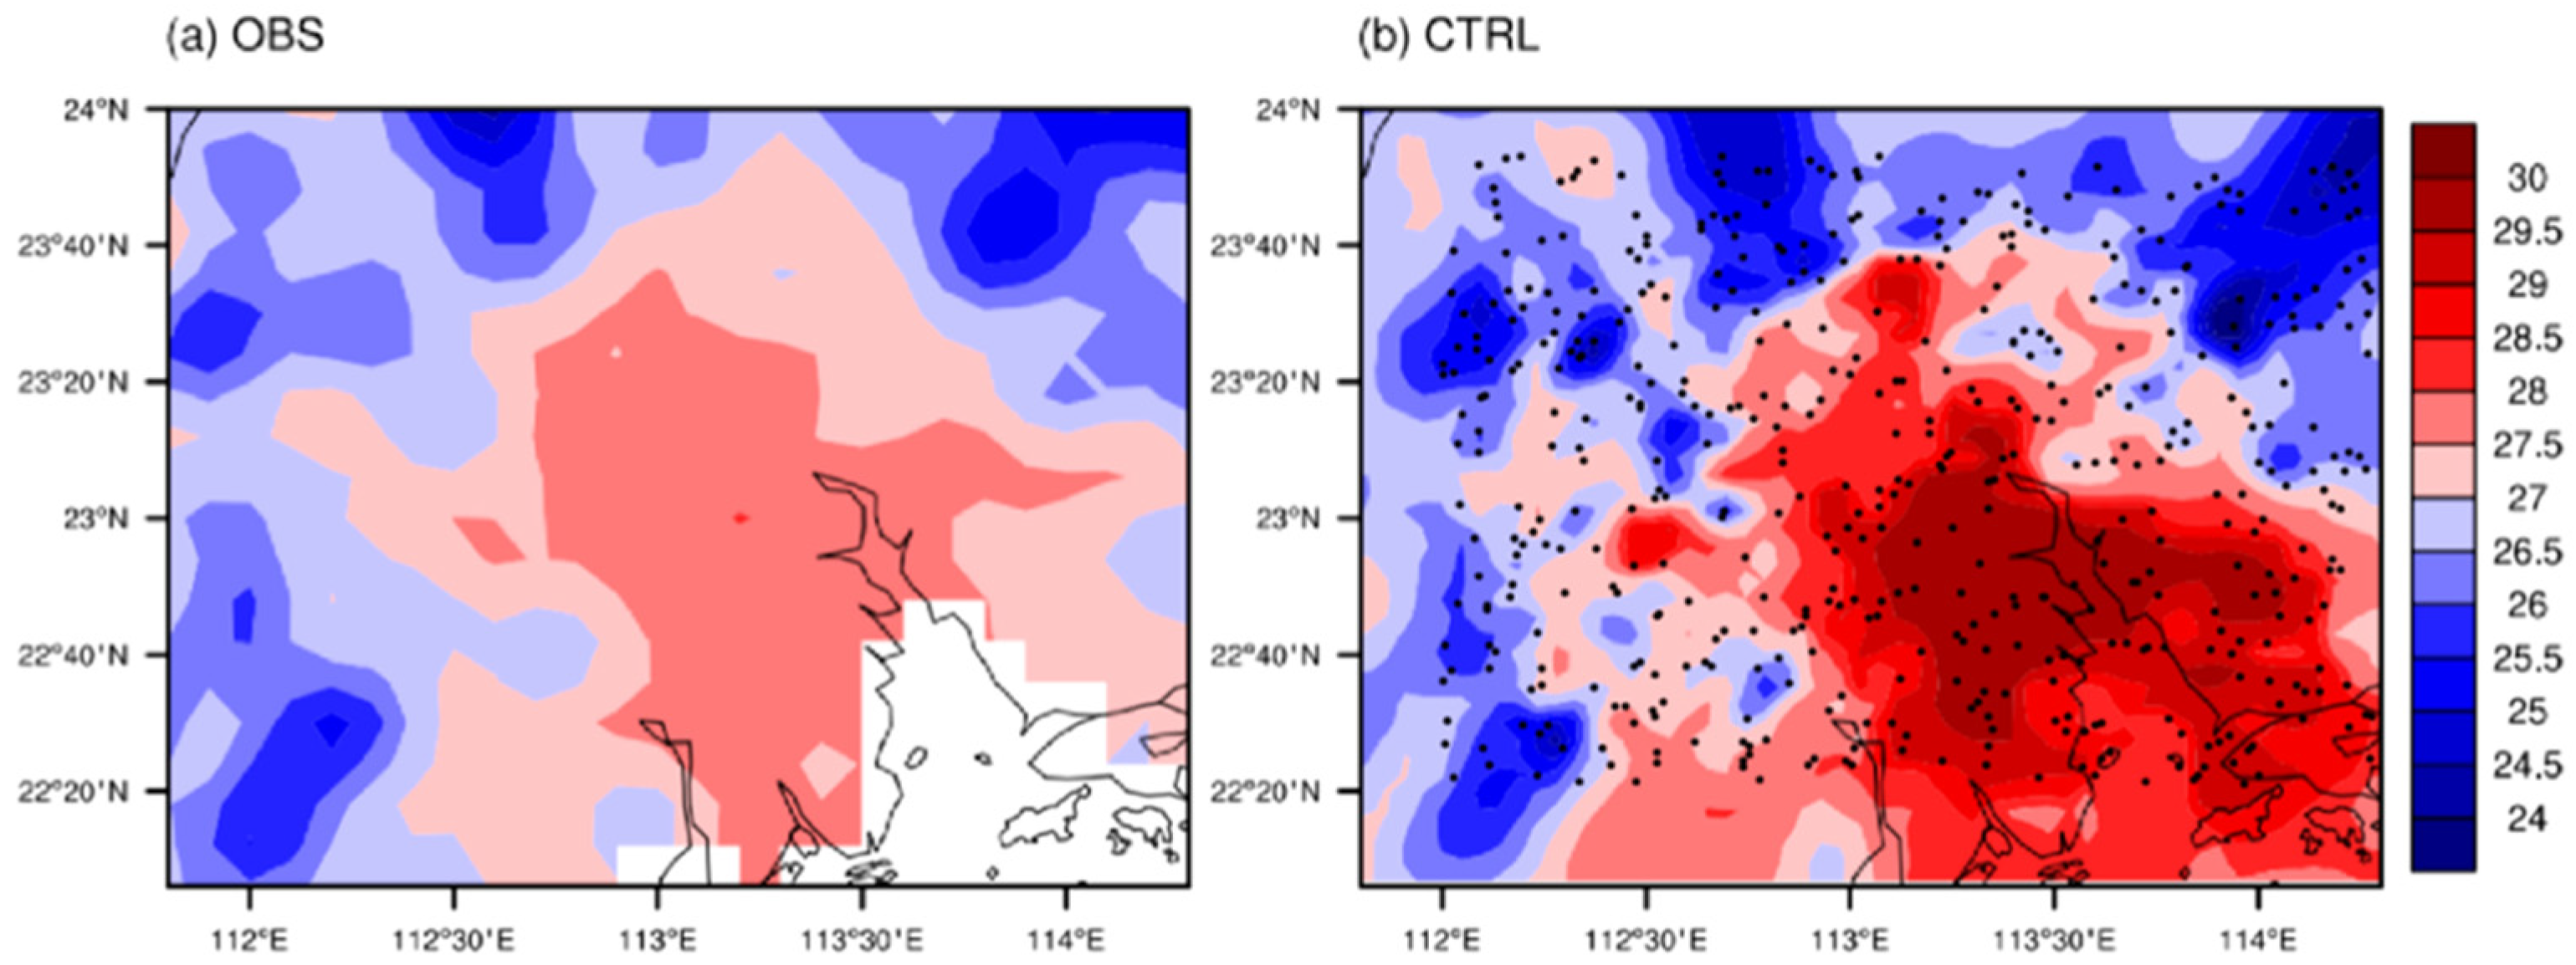
Figure 4.
Spatial distribution of the decadal average of daily average temperature (unit: °C) during the historical period (a), 1.5 °C warming period (b), 2.0 °C warming period (c), and the difference between 1.5 °C (d), 2 °C (e) warming, and the historical period in the Pearl River Delta urban agglomeration.

Figure 5.
Average temperature (unit: °C) of each city in the Pearl River Delta urban agglomeration during the historical period (blue), 1.5 °C warming period (red), and 2.0 °C warming period (green).
Figure 5.
Average temperature (unit: °C) of each city in the Pearl River Delta urban agglomeration during the historical period (blue), 1.5 °C warming period (red), and 2.0 °C warming period (green).

Figure 6.
Comparison of the non-industrial electricity consumption model (red) and detrended actual electricity consumption (blue): (a) Guangzhou city from 2009 to 2014 (b) Zhuhai city from 2010 to 2017 (unit: TWh).
Figure 6.
Comparison of the non-industrial electricity consumption model (red) and detrended actual electricity consumption (blue): (a) Guangzhou city from 2009 to 2014 (b) Zhuhai city from 2010 to 2017 (unit: TWh).
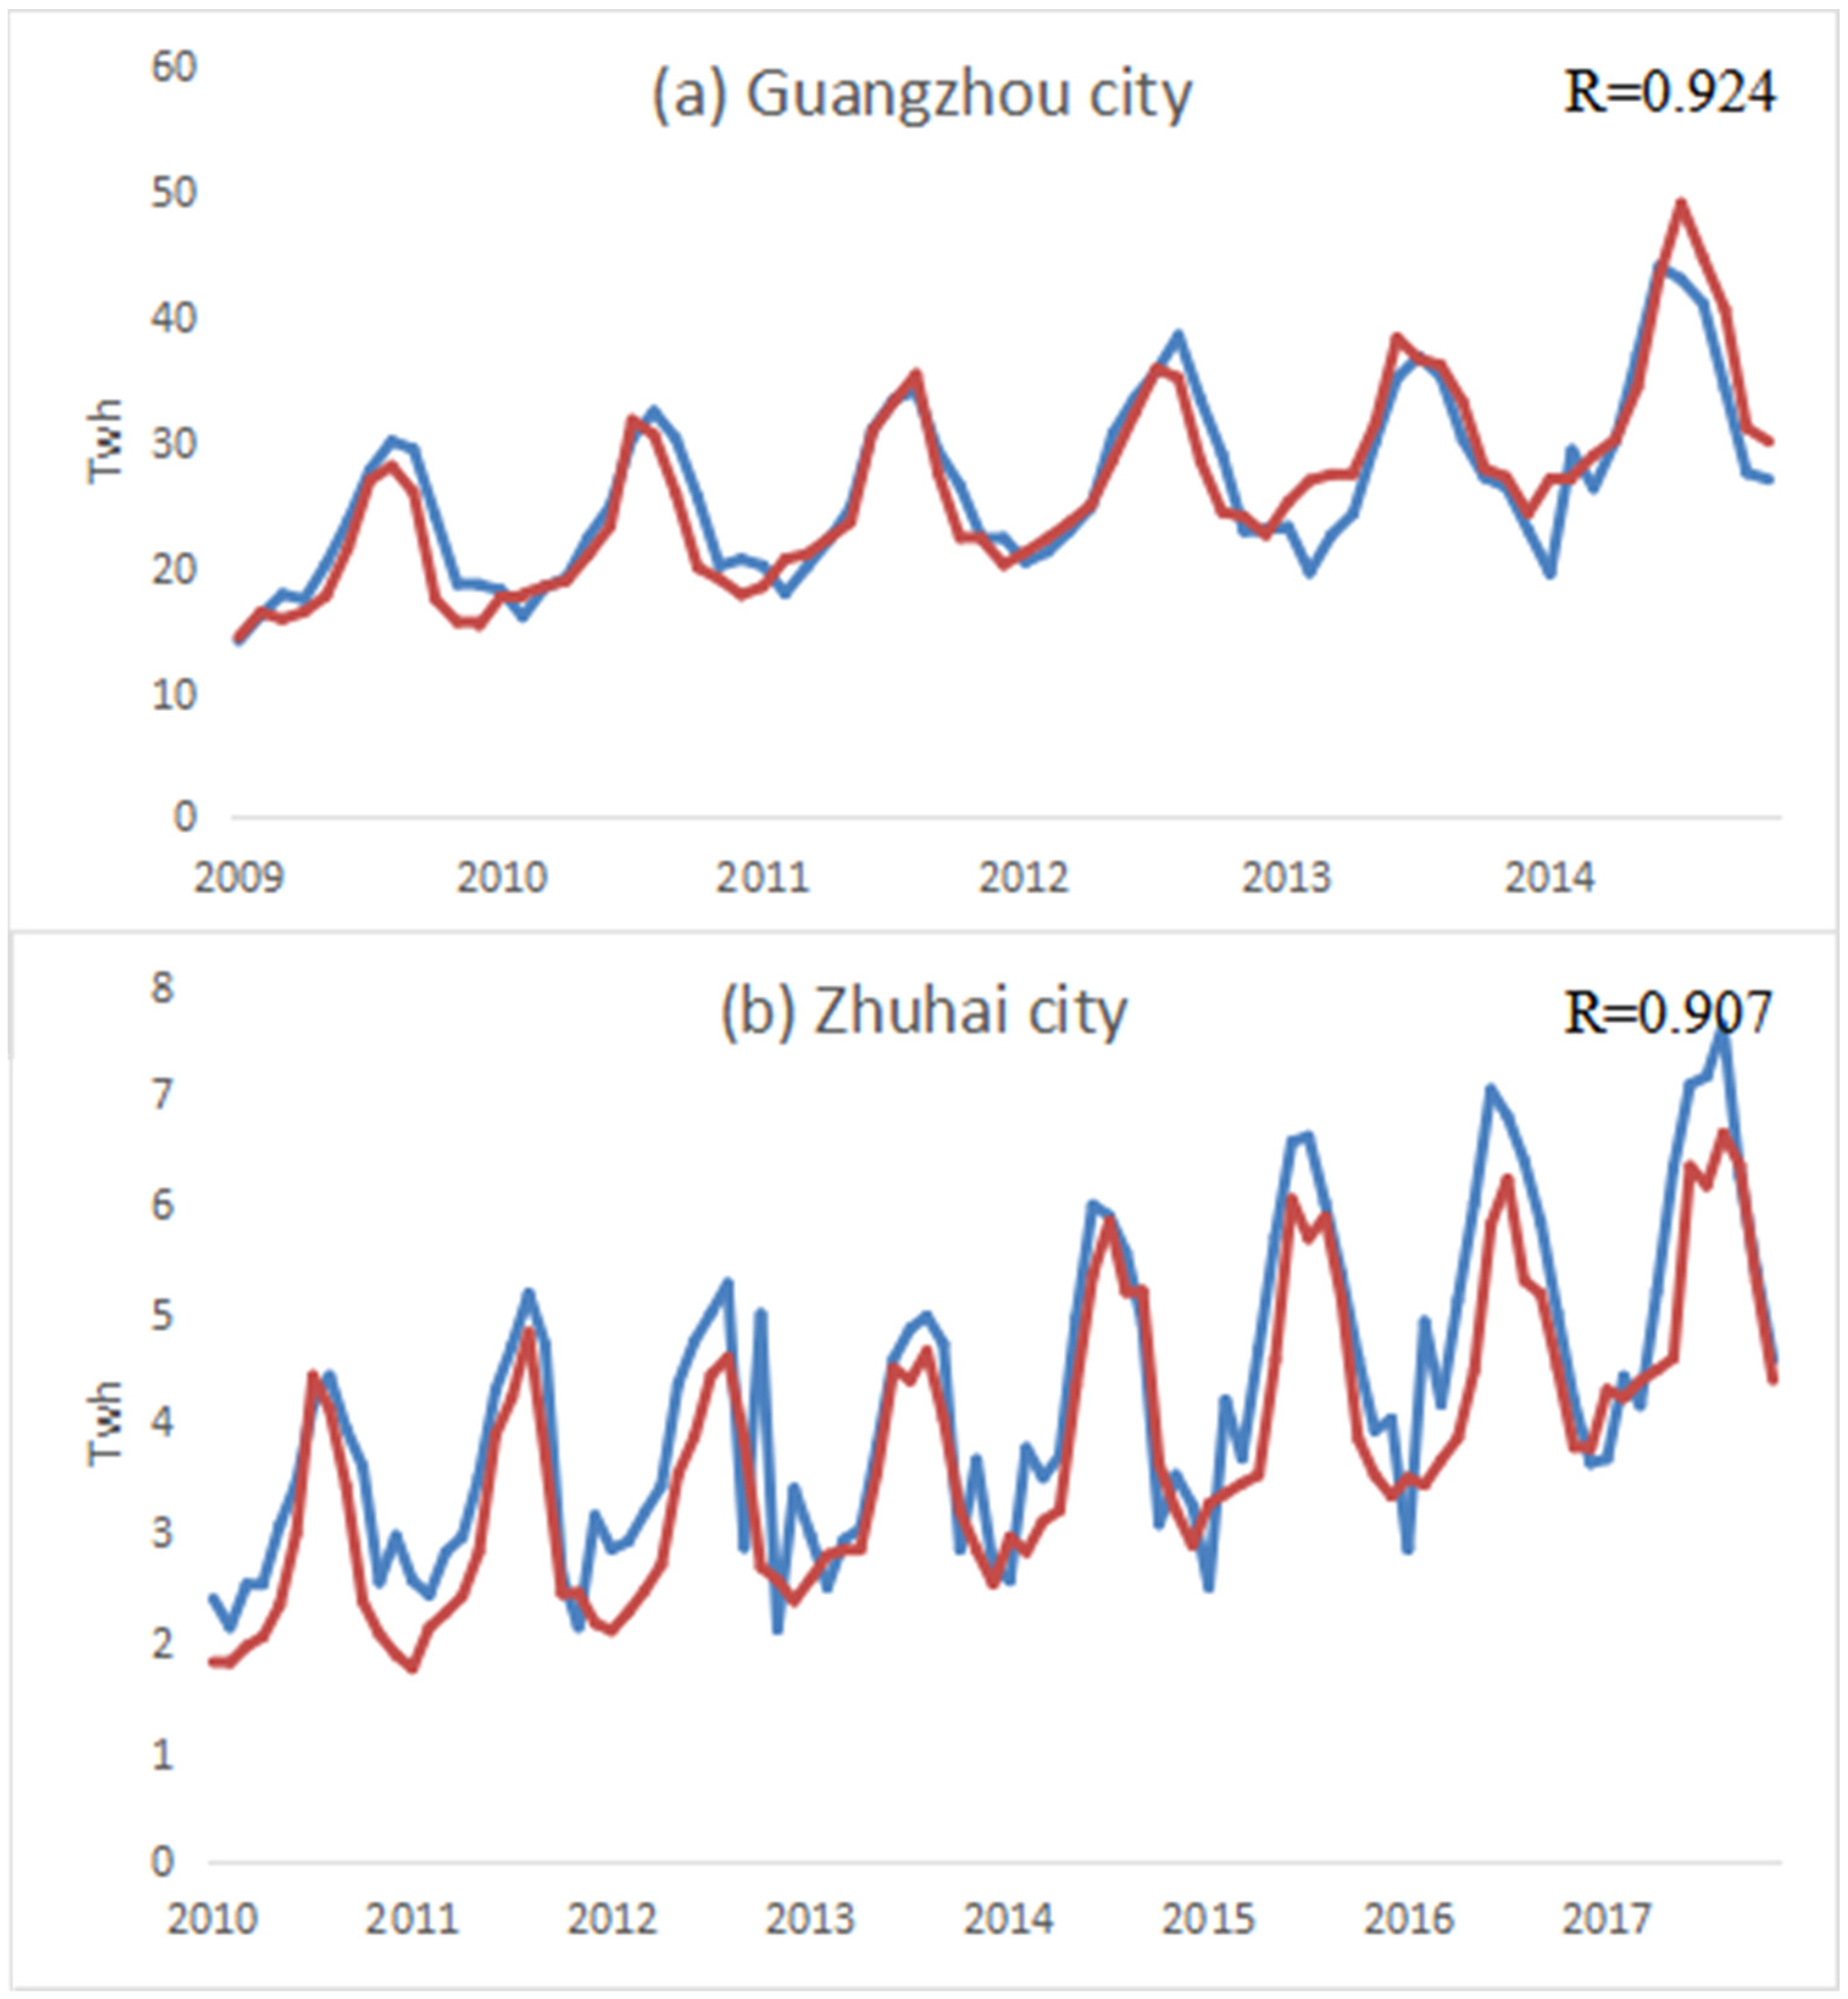
Figure 7.
Interannual anomalies of the non-industrial electricity consumption model (red) and detrended actual electricity consumption (blue): (a) Guangzhou city from 2009 to 2014 and (b) Zhuhai city from 2010 to 2017 (unit: TWh).
Figure 7.
Interannual anomalies of the non-industrial electricity consumption model (red) and detrended actual electricity consumption (blue): (a) Guangzhou city from 2009 to 2014 and (b) Zhuhai city from 2010 to 2017 (unit: TWh).
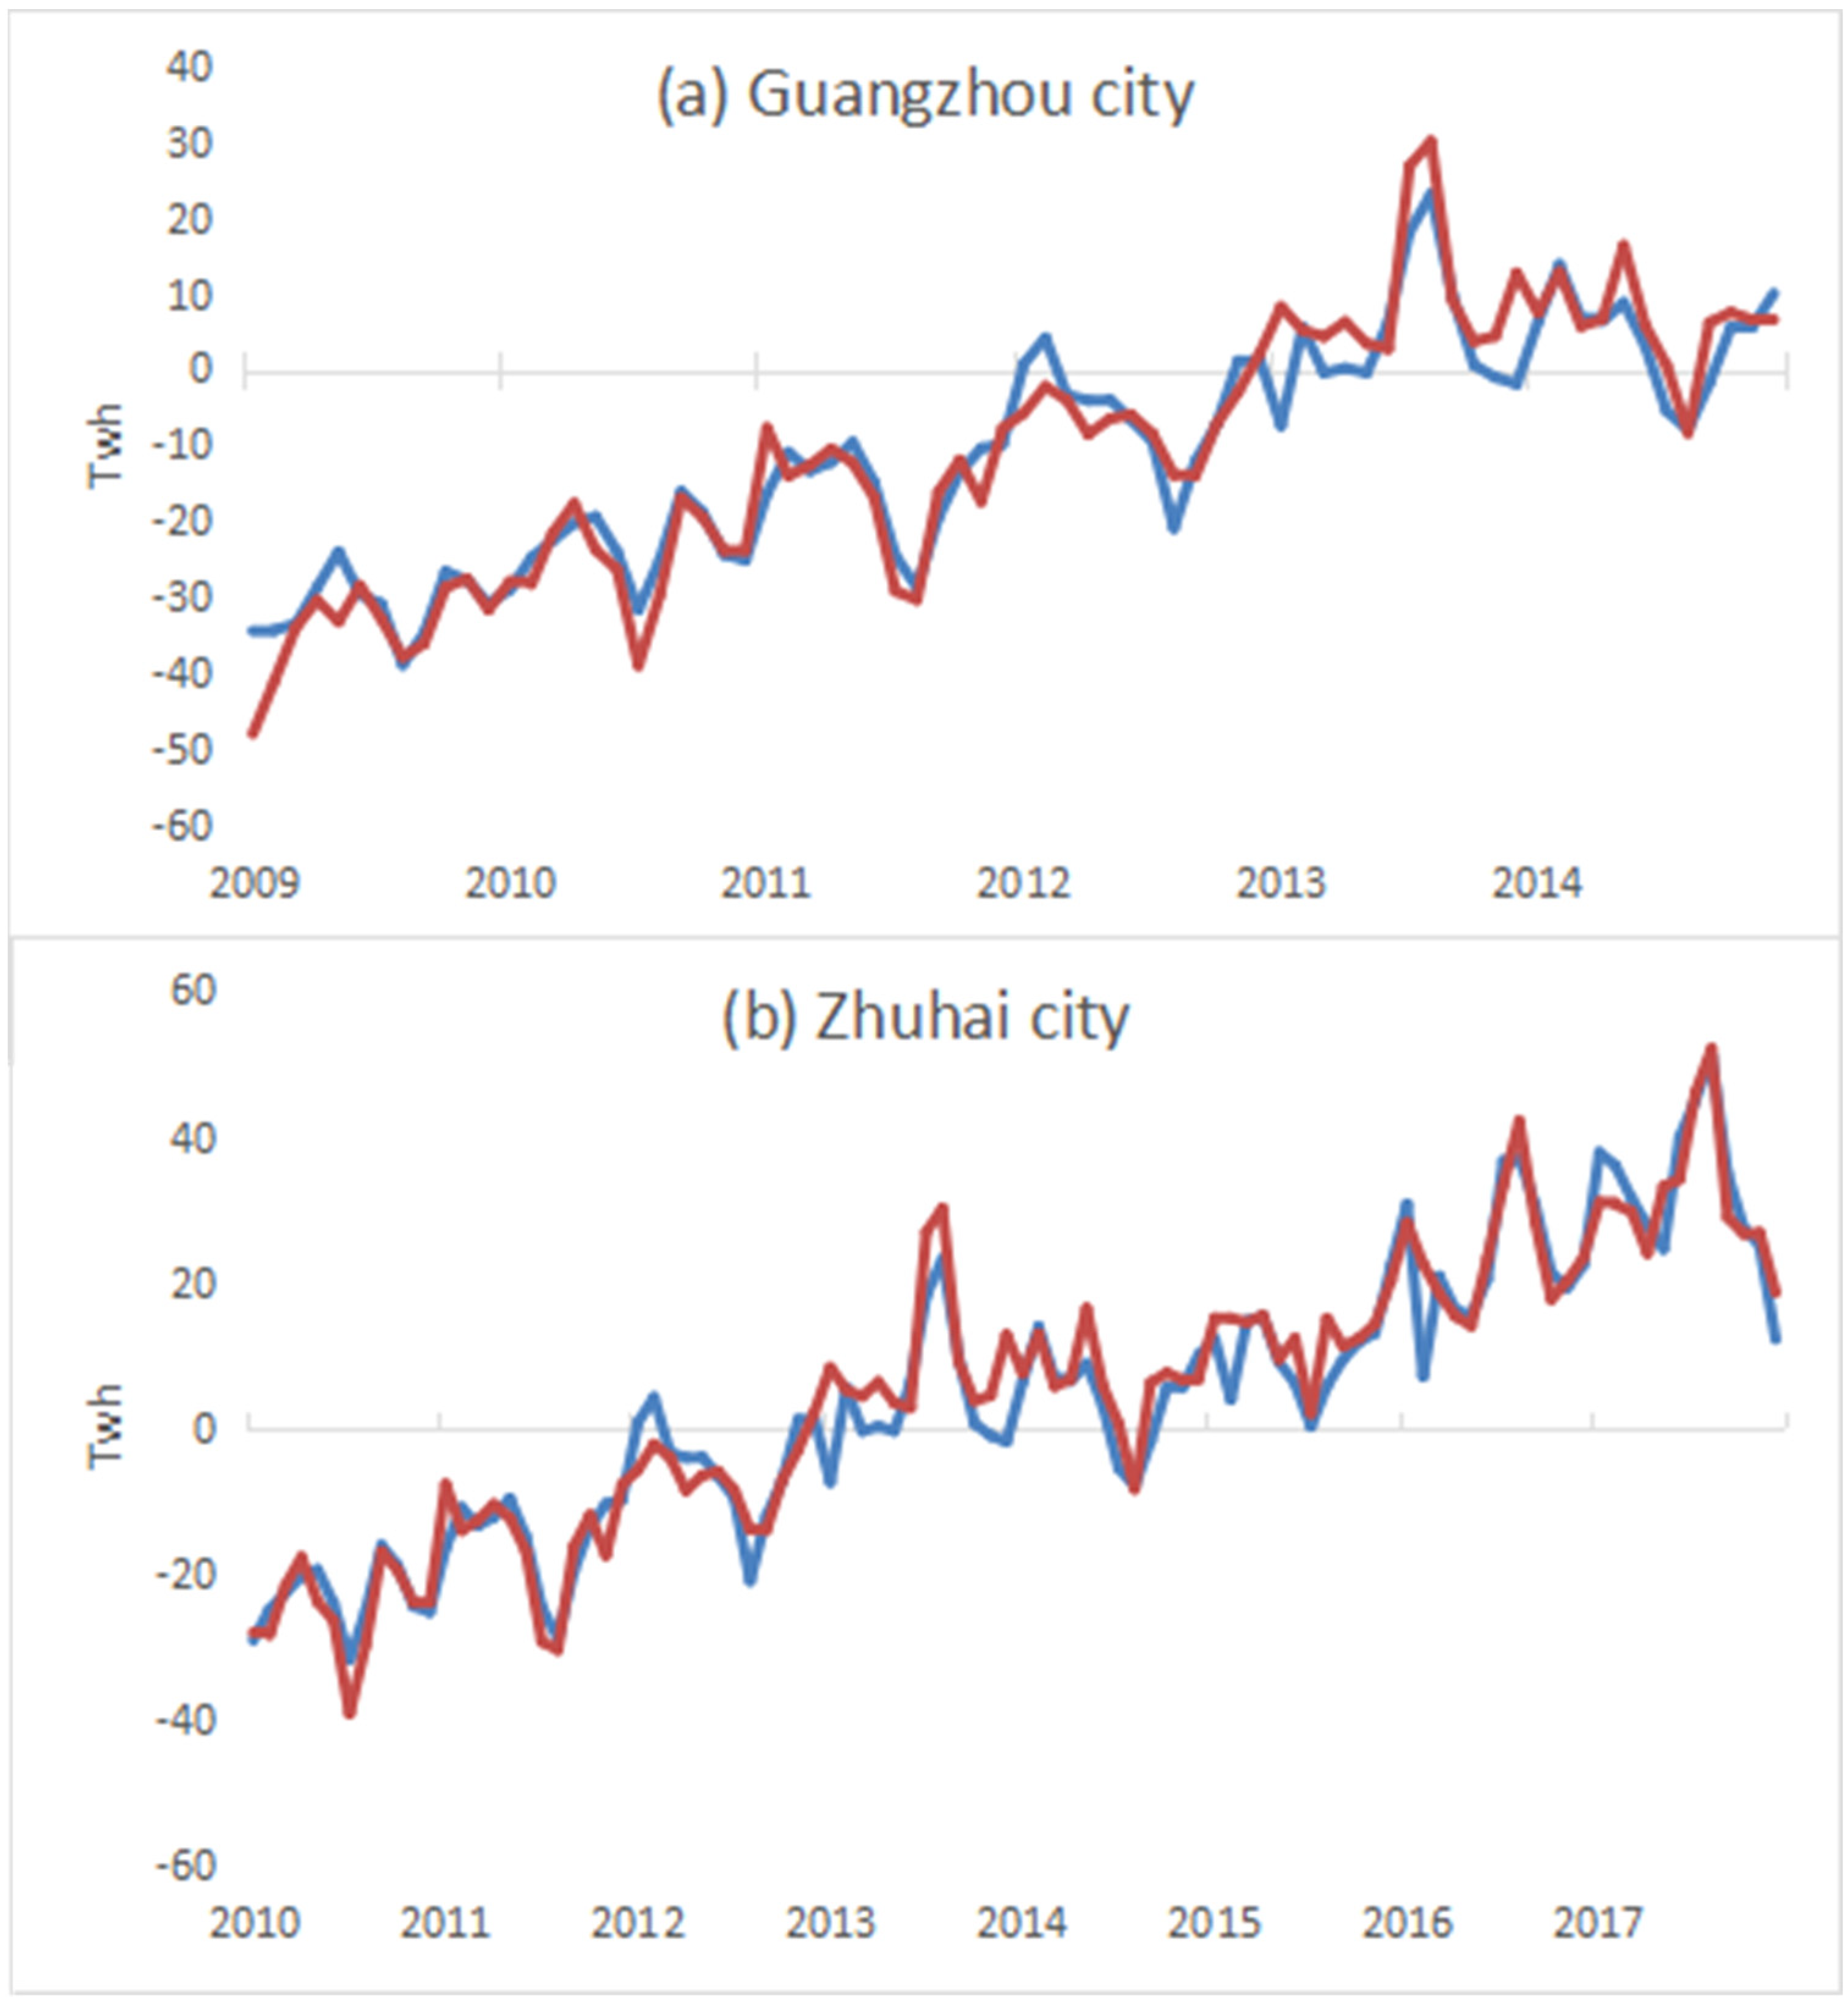
Figure 8.
Interannual anomalies of the non-industrial electricity consumption model (red) and detrended actual electricity consumption (blue) in Guangzhou city from 2009 to 2014 (a) and in (b) Zhuhai city from 2010 to 2017 (unit: TWh).
Figure 8.
Interannual anomalies of the non-industrial electricity consumption model (red) and detrended actual electricity consumption (blue) in Guangzhou city from 2009 to 2014 (a) and in (b) Zhuhai city from 2010 to 2017 (unit: TWh).
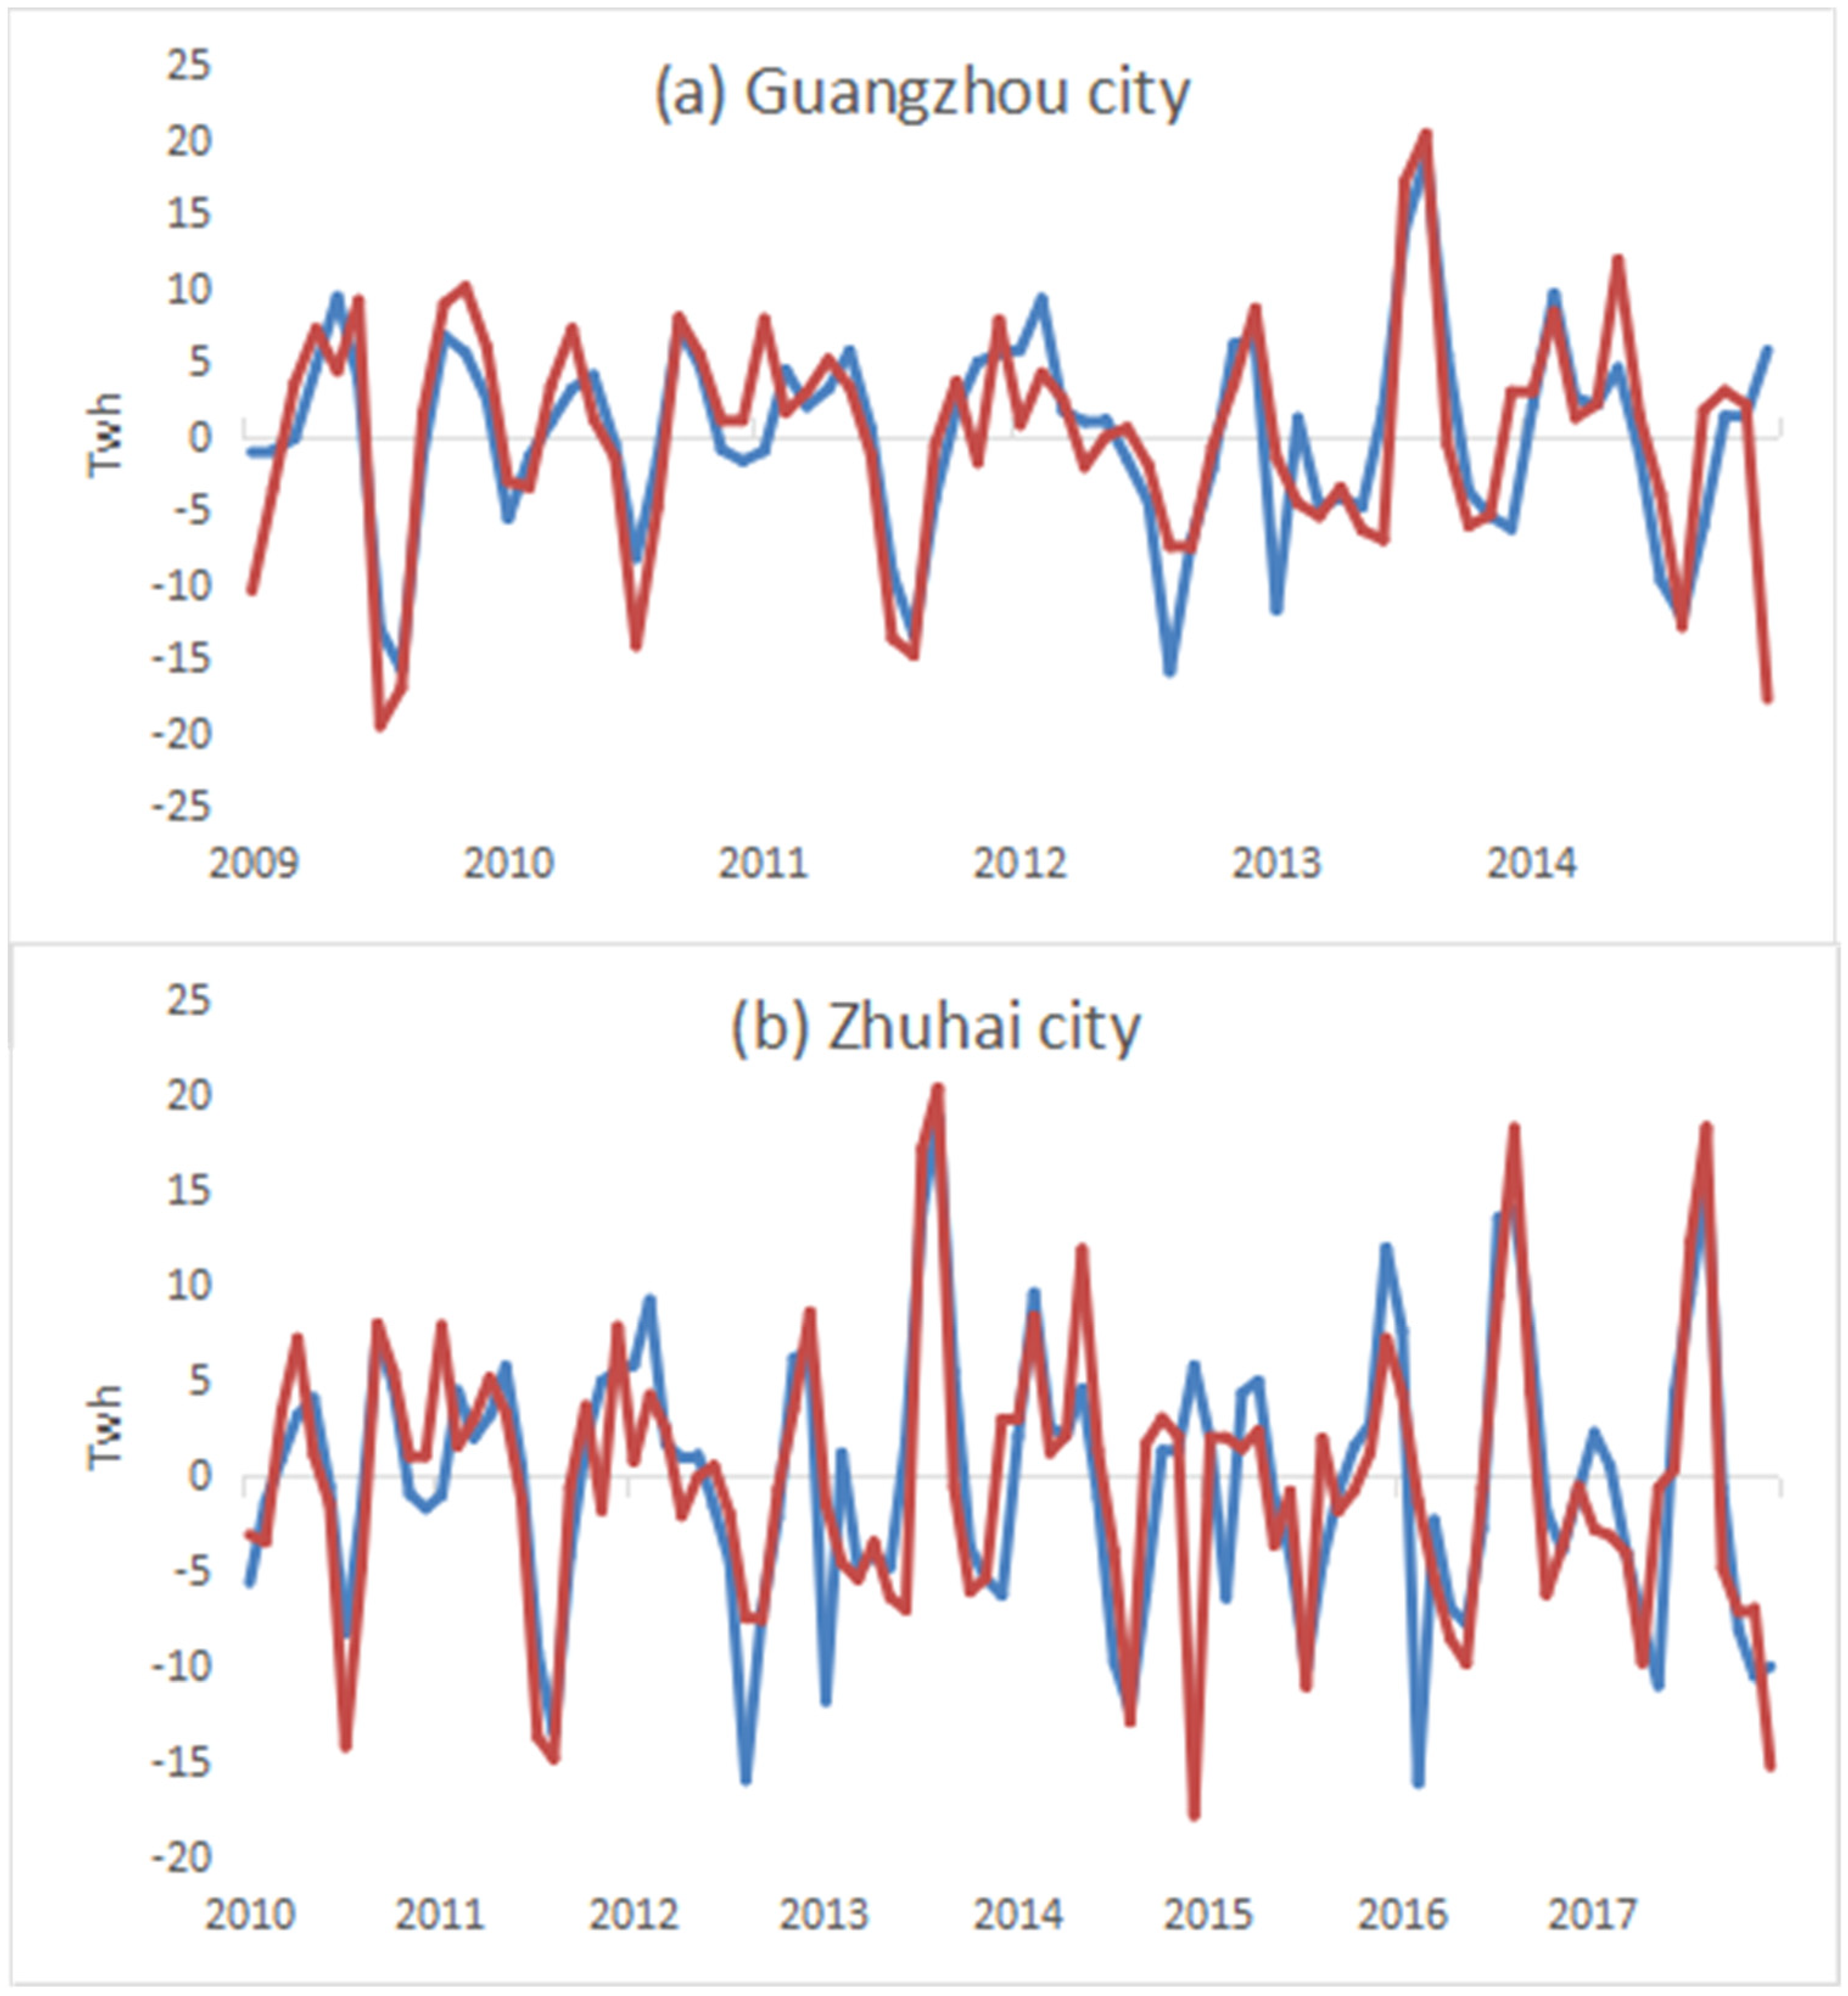
Figure 9.
Changes in (a) CDD (unit: °C·month) and (b) GDP (unit: 100 million yuan) in Guangzhou (blue) and Zhuhai (red) under future warming of 1.5 °C and 2 °C.
Figure 9.
Changes in (a) CDD (unit: °C·month) and (b) GDP (unit: 100 million yuan) in Guangzhou (blue) and Zhuhai (red) under future warming of 1.5 °C and 2 °C.
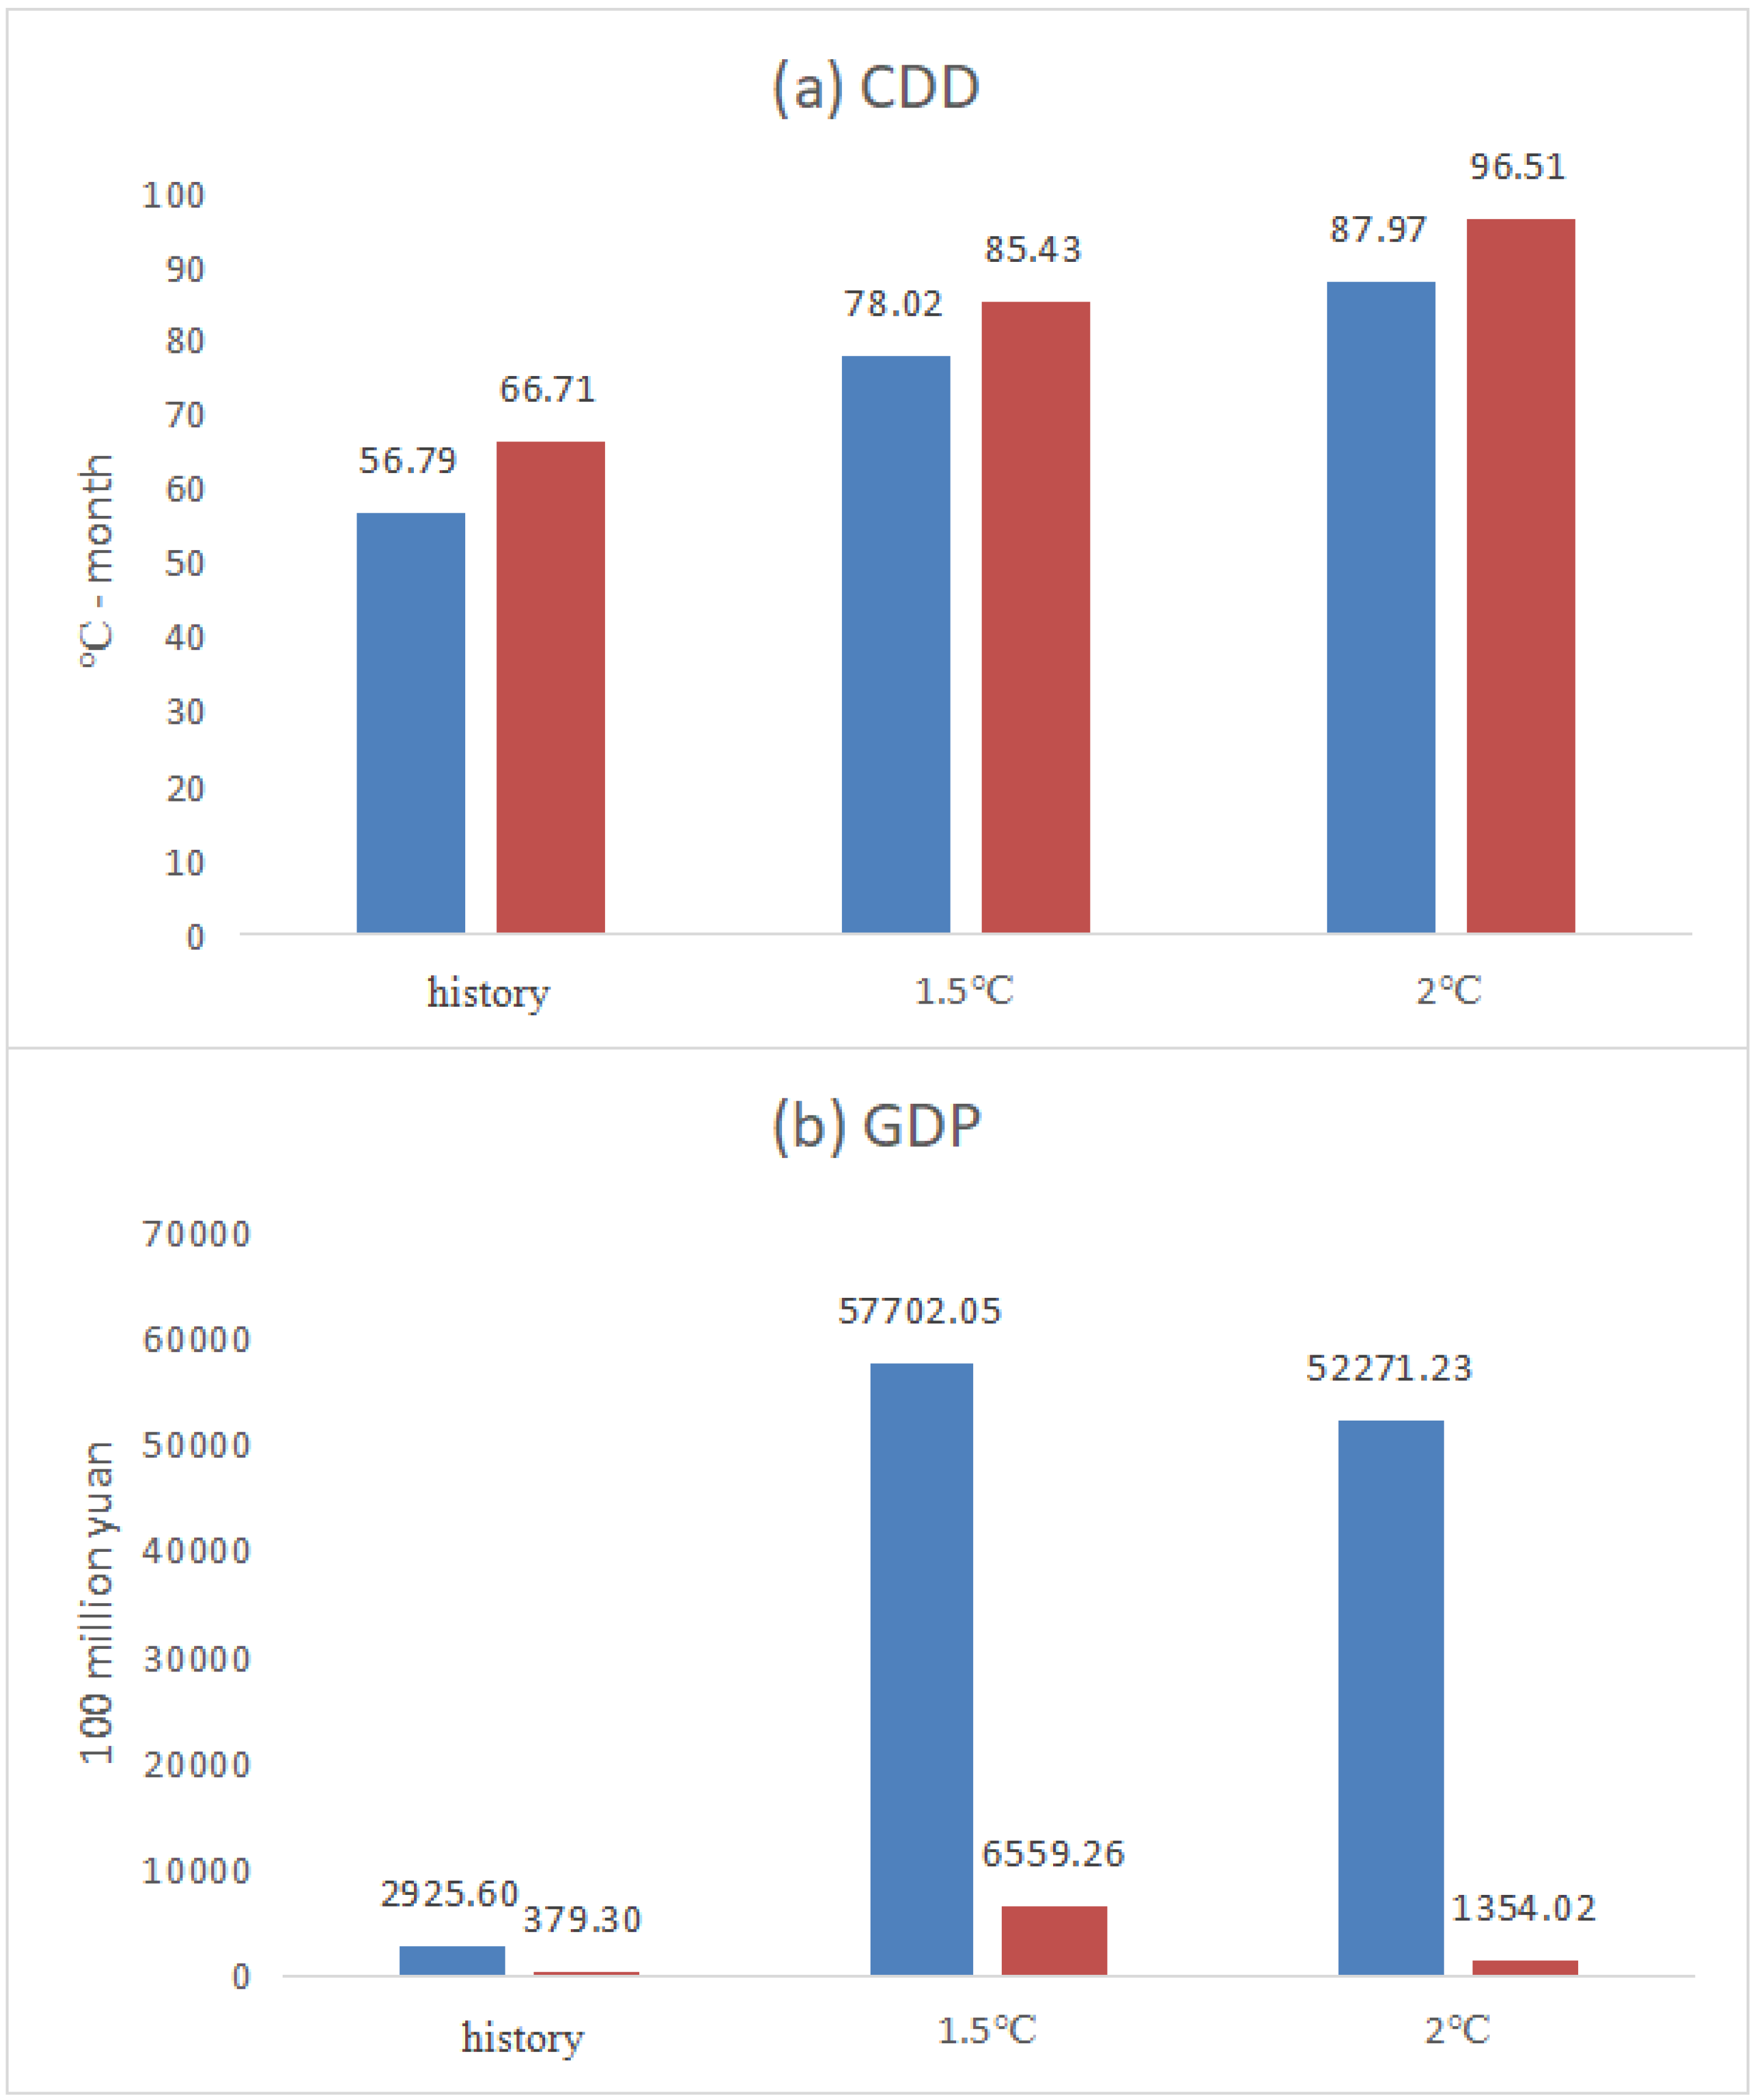
Figure 10.
Estimated summer non-industrial electricity consumption (unit: TWh) in Guangzhou (blue) and Zhuhai (red) during future warming periods of 1.5 °C and 2 °C.
Figure 10.
Estimated summer non-industrial electricity consumption (unit: TWh) in Guangzhou (blue) and Zhuhai (red) during future warming periods of 1.5 °C and 2 °C.

Table 1.
Coefficients of the non-industrial electricity consumption model for Guangzhou and Zhuhai cities.
Table 1.
Coefficients of the non-industrial electricity consumption model for Guangzhou and Zhuhai cities.
| R | ||||
|---|---|---|---|---|
| Guangzhou city | 0.0018 | 0.137158 | −0.024598 | 0.924 |
| Zhuhai city | 0.001725 | 0.021855 | −0.003403 | 0.907 |
Table 2.
Changes in CDD, GDP, and non-industrial electricity consumption in Guangzhou during historical and future warming periods of 1.5 °C and 2 °C.
Table 2.
Changes in CDD, GDP, and non-industrial electricity consumption in Guangzhou during historical and future warming periods of 1.5 °C and 2 °C.
| History | 1.5 °C | 2 °C | |
|---|---|---|---|
| CDD (°C·month) | 56.76 | 78.02 | 87,97 |
| GDP (100 million yuan) | 2925.60 | 57,702.05 | 52,271.23 |
| electricity consumption (TWh) | 13.06 | 114.57 | 106.15 |
Disclaimer/Publisher’s Note: The statements, opinions and data contained in all publications are solely those of the individual author(s) and contributor(s) and not of MDPI and/or the editor(s). MDPI and/or the editor(s) disclaim responsibility for any injury to people or property resulting from any ideas, methods, instructions or products referred to in the content. |
© 2024 by the authors. Licensee MDPI, Basel, Switzerland. This article is an open access article distributed under the terms and conditions of the Creative Commons Attribution (CC BY) license (https://creativecommons.org/licenses/by/4.0/).
Share and Cite
MDPI and ACS Style
Li, T.; Tao, L.; Zhang, M. Projection of Non-Industrial Electricity Consumption in China’s Pearl River Delta under Global Warming Scenarios. Sustainability 2024, 16, 2012. https://doi.org/10.3390/su16052012
AMA Style
Li T, Tao L, Zhang M. Projection of Non-Industrial Electricity Consumption in China’s Pearl River Delta under Global Warming Scenarios. Sustainability. 2024; 16(5):2012. https://doi.org/10.3390/su16052012
Chicago/Turabian StyleLi, Tiaoye, Lingjiang Tao, and Mi Zhang. 2024. "Projection of Non-Industrial Electricity Consumption in China’s Pearl River Delta under Global Warming Scenarios" Sustainability 16, no. 5: 2012. https://doi.org/10.3390/su16052012
Note that from the first issue of 2016, this journal uses article numbers instead of page numbers. See further details here.