Article

Comparative Life Cycle Assessments and Economic Analyses of Alternative Marine Fuels: Insights for Practical Strategies

1
R&D Division, Korean Register, 36, Myeongji Ocean City 9-ro, Gangseo-gu, Busan 46762, Republic of Korea
2
Division of Coast Guard Studies, Korea Maritime and Ocean University, 727, Taejong-ro, Yeongdo-gu, Busan 49112, Republic of Korea
3
Department of Mechanical Convergence Engineering, Gyeongsang National University, 48-54 Charyong-ro, Uichang-gu, Changwon 51391, Republic of Korea
*
Author to whom correspondence should be addressed.
Sustainability 2024, 16(5), 2114; https://doi.org/10.3390/su16052114
Submission received: 6 February 2024 / Revised: 28 February 2024 / Accepted: 28 February 2024 / Published: 4 March 2024
(This article belongs to the Section Energy Sustainability)

Abstract

:
The growth of the global shipping industry has increased the interest in the environmental impact of this sector. The International Maritime Organization adopted the initial Greenhouse Gas strategy for reducing GHG emissions from ships at the 72nd Marine Environment Protection Committee in April 2018. In this study, we carried out a life cycle assessment of nine production pathways of alternative fuels, including LNG, ammonia, methanol, and biofuels, and conducted an economic analysis considering the life cycle carbon pricing of each fuel pathway. Our results indicate that biomass-based FT-diesel, e-methanol, and e-ammonia are the most environmentally friendly, with GHG reductions of 92%, 88.2%, and 86.6%, respectively. However, our net present value analysis of ship life cycle cost considering carbon price indicated that using those fuels would not be cost-effective during the target period of study. Sensitivity analysis was performed by changing the life cycle carbon pricing from the baseline scenario, and we investigated the approximate years for when these alternative fuels will become more cost-effective compared to conventional fossil fuels. Further, to provide practical implications for shipping stakeholders, we analysed the effect of blending the same kinds of fuels with different production pathways.

1. Introduction

Due to the increase in global seaborne trade, the shipping industry is rapidly growing, and there is an increasing interest in greenhouse gases (GHGs) and other pollutants generated from ships. The ‘Fourth International Maritime Organization (IMO) GHG study’ estimated that the total amount of emissions derived from shipping was 1056 million tonnes of carbon dioxide (CO2) in 2018, accounting for about 2.89% of the total global CO2 emissions [1]. The IMO continues to strengthen its regulations for limiting the emission of various air pollutants as part of the effort to cope with climate change. In particular, to reduce sulphur oxides (SOx) generated from ships, the IMO has introduced the Global Sulphur Cap to limit the sulphur content in fuel oils to below 0.5% (m/m) for all ships engaged in international sailing. Furthermore, the IMO adopted the initial IMO GHG strategy for reducing GHG emissions from ships at the 72nd Marine Environment Protection Committee (MEPC), held in April 2018, to ensure harmony with the Paris Agreement, which was adopted in 2015. The initial strategy includes reduction goals and measures for the decarbonization of ships within the present century. It is aimed at reducing the carbon intensity of international shipping by 40% by 2030 and by 70% before 2050 while reducing total GHG emissions by 50% by 2050 compared with the base levels in 2008. Short- and mid-term measures in initial strategy focus on speed reduction, operational energy efficiency measures, the optimization of logistic chains, alternative low-carbon fuels, etc., as shown in Figure 1 [2]. However, the operational measures and efficiency improvements are insufficient for achieving the GHG reduction goals set at the initial IMO GHG strategy meeting [3]. The fourth IMO GHG Study estimates that about 64% of the total amount of CO2 reduction from shipping in 2050 will be achieved using alternative low/zero-carbon fuels [1]. To achieve this, several existing challenges in the context of technology development, infrastructure expansion and the cost competitiveness of alternative fuels, and regulations, among others, will need to be addressed [4].
Today, several alternative fuels in the shipping sector are receiving attention as substitutes for conventional fossil fuels, including liquefied natural gas (LNG), ammonia, methanol, and biofuels [5,6,7,8,9].
There are several aspects that are important to consider when shipowners adopt alternative marine fuel in their fleets, including technical (available infrastructure, reliable supply of fuel), economic (investment cost for propulsion system, operational costs, and fuel price), environmental (air pollution, health impact, climate change, and acidification), social (safety and upcoming legislation), and other aspects (logistics) [10,11].
From an environmental perspective, it is worth noting that different fuel pathways can generate different amounts of emissions in the life cycle approach, although tail pipe emissions are similar. From this perspective, methodologies such as life cycle assessments (LCAs) for evaluating environmental impacts across the entire life cycle of a fuel are needed [13]. The inclusion of the upstream emission of ship fuels can help in conducting a more comprehensive assessment of emissions in this sector and prevent the miscalculation of overall emissions [4]. Although the proportion of upstream emissions varies depending on the type of fuel, it can be up to 20% of life cycle emissions in the case of LNG [14].
Implementing LCAs of marine fuel can help quantify GHG emissions from the extraction of feedstock and conversion or synthesis and transportation of fuels, as well as their bunkering and onboard combustion. This could eventually help shipowners make decisions for the selection of environmentally viable marine fuels. At the 76th session of MEPC held in 2021, the development of life cycle assessment GHG/carbon intensity guidelines (LCA Guidelines) for all relevant types of fuels was discussed [15]. Life cycle emission of marine fuel can be defined as Well-to-Wake emission, which is a combination of Well-to-Tank (from the production of the fuel to the bunkering of the fuel to a tank onboard) and Tank-to-Wake (from the fuel tank of the ship to an exhaust gas) [16].
Alternative fuels are relatively costly compared to conventional fuels, despite their positive effects in terms of GHG reduction in the maritime sector. Therefore, for the fuel transition from conventional fossil fuels to alternative fuels, emission reductions and related costs should be considered [17].
To facilitate the transition to alternative fuels and accordingly achieve emission reductions in the maritime sector, carbon pricing is gaining strength as one of the most important measures. In May 2022, Japan made a proposal to the IMO for a shipping carbon tax of USD 56 per tonne of CO2 from 2025, rising to USD 135 per tonne of CO2 in 2030. However, this proposal only counts Tank-to-Wake emissions and does not cover emissions produced from Well-to-Tank. This means that several alternative fuels, i.e., ammonia or hydrogen produced from fossil feedstock, can be considered as low-emission fuels [18]. The IMO Intersessional Working Group (ISWG), held in June 2022, agreed to move toward the further development of ‘basket of candidate mid-term measures’—integrating both technical and carbon pricing [19]. Besides the IMO, the European Commission (EC) recently proposed the ‘Fit for 55’ package, which includes the maritime sector in the European Emission Trading Scheme (ETS) [20]. The inclusion of the maritime sector into the EU-ETS will raise the operational costs for shipping companies due to CO2 emission allowances [21]. When carbon pricing is strengthened, it will account for a large portion of fuel costs. Further, several financial institutions are signing onto the Poseidon Principles, which were established in 2019 to assess the climate alignment of ship finance portfolios. This will expedite the process of shipping companies ensuring alignment with the IMO’s GHG emission reduction targets [22].
In this study, we conducted a LCA of alternative fuels such as LNG, ammonia, methanol, and biofuel and performed an economic analysis of ships using those fuels considering life cycle carbon pricing. As fuels with different pathways can generate different amounts of emissions despite sometimes having the same chemical properties, several pathways of fuels were considered, including the following: fossil LNG, biomass-based Fischer–Tropsch (FT)-diesel, biodiesel, natural gas (NG)-based methanol, biomass-based methanol, e-methanol, NG-based ammonia, NG-based ammonia plus CCS (Carbon Capture and Storage), and e-ammonia. For comparison, conventional marine fuels such as HFO (0.1% sulphur) and MGO (0.1% sulphur) were used as reference fuels. The life cycle GHG emissions of the fuels were converted to carbon prices and incorporated in fuel cost values. Further, we selected the Long Range 1 (LR1) tanker, which ranges in size from 55,000 to 79,999 deadweight (DWT), as a reference ship using alternative fuels and investigated which fuel was commercially competitive over the 25-year ship life cycle. Economic analysis results are expressed as fuel cost including carbon price with varying year and the net present value (NPV) of the ship. Frameworks showing how we implemented LCA and LCCA in this study are shown in Figure 2. For our sensitivity study, we changed the carbon prices from the baseline scenario and investigated the approximate years for when alternative fuels will become more cost-effective than conventional fossil fuels. Further, as a case study, fuel blending was investigated; we assessed a blend of HFO and biomass-based FT-diesel, a blend of NG-based ammonia and NG-based ammonia plus CCS, and a blend of NG-based methanol and biomass-based methanol. The properties of these fuels are identical; thus, they can run the same engine without the need to retrofit the ship.
The aim of this study is to provide shipowners with insights for practical solutions and strategies, supporting the selection of environmentally and economically viable marine fuel. This study could help shipowners ensure that their fleets stay compliant and commercially competitive.

2. Literature Review

Four alternative fuels—LNG, ammonia, methanol, and biofuels—were investigated via a literature review. LNG has been widely adopted by the shipping industry as an alternative fuel over the past decade. Using LNG can lead to several advantages, such as a 95–100% reduction in SOx emissions, a 45–80% reduction in nitrogen oxides (NOx), and a 25–30% reduction in CO2 emissions, depending on the engine technology [23]. The decarbonization potential of LNG is limited as it has a carbon atom in its structure. Fossil LNG tends to be considered as a bridge solution before moving to green methanol, ammonia, and biofuels, although more investigation is needed [11]. One of the major disadvantages of using LNG as a ship fuel is methane emissions resulting from the supply chain and engine operation. This is because the global warming potential (GWP) of methane is 30 times higher than CO2 in the 100-year time horizon and 85 times higher in the 20-year time horizon. Minimizing these methane emissions will yield significantly positive impacts on GHG emissions from LNG [24].
Ammonia is one of the most promising alternative fuels that could be used to meet the IMO’s goals in the shipping sector [25]. Ammonia produces few carbon emissions after combustion, as it does not contain carbon atoms in its structure [26]. Ammonia can be produced from fossil fuels such as natural gas, oil, and coal [27] (Al-Aboosi et al., 2021), as well as by synthesis between hydrogen generated through water electrolysis by renewable electricity and captured nitrogen (N2) from air [6]. Depending on the ammonia production pathway, the amount of CO2 emissions significantly varies over the ammonia life cycle. Among the several types of ammonia, electro-ammonia (e-ammonia) generated with renewable electricity is receiving more attention. E-ammonia is currently costly compared to other fuels [28], but as a green hydrogen carrier, the market for it is increasing. As the cost of electrolysis decreases, the production cost of e-ammonia can be further reduced [29]. A key milestone for the development of ammonia for deployment as a marine fuel is an ammonia engine, which is currently being developed by several engine manufacturers [30,31]. One of the advantages of using ammonia over LNG is its ease of storage. Ammonia can be stored under refrigerated or pressurized conditions, i.e., −33 °C at 1 bar or 45 °C at 18 bar, respectively [9,32,33]. However, consideration should be given to the hazards associated with the toxicity and corrosiveness of ammonia during the design of systems [34,35]. In addition, due to the fact that ammonia has a lower volumetric energy density (12.53 GJ/m3 at 33.34 °C, 1 bar) than HFO, a fuel tank that is approximately 3.12 times larger is needed, and accordingly, a larger pipe and related auxiliary equipment should be considered, as summarized in Table 1. In addition, ammonia has an adverse impact when it is spilled into water in bulk, as it causes eutrophication. This causes nutrients such as phosphorus and nitrogen to become overly abundant in water, resulting in excessive algal growth [36].
The Danish container shipping company Maersk recently announced that it ordered eight large ocean-going container vessels fuelled by a carbon-neutral methanol built by Hyundai Heavy Industries for 2024 [37]. In March 2022, the same company entered into a partnership with six other companies to source 730,000 tonnes/year of renewable methanol by 2025 [38]. Methanol contains zero sulphur and produces little PM and NOx when combusted. It can be produced via several production pathways: from fossil fuels such as natural gas, from renewable feedstock such as biomass, and from the synthesis of hydrogen generated from renewable electricity [39]. If released into seawater, methanol is largely biodegradable, and therefore, it has little potential for bioaccumulation. It is therefore unlikely to have acute effects on the aquatic environment [40]. Methanol can be used in dual-fuel oil/methanol engines which are currently available [41]. The amount of emission reduction from methanol combustion is similar to that which can be achieved using LNG; however, the installation cost associated with methanol is lower than that associated with LNG. Despite this, methanol has several drawbacks: methanol is toxic, corrosive, and requires a fuel tank that is 2.45 times larger compared to HFO [41]. Properties of alternative fuels are shown in Table 2.
Biofuels are another available option that could provide short- and mid-term emission reductions. Biofuels, which are defined as fuels produced from biomass, include a comprehensive range of products, such as biomethanol, biodiesel, bioethanol, and bio-DME [42]. One advantage of using biofuels in the marine sector is that, as ‘drop-in’ fuels, they are compatible for use in the components of existing infrastructure, such as conventional engines, bunkering facilities, tanks, and pipelines. For biofuels that are not fully compatible with existing marine engines, such as bioethanol, blending with conventional fuel is a practical workaround [43]. As drop-in fuels or after being blended with a conventional fuel, biofuels can help mitigate net GHG emissions significantly [42]. A biofuel blended with petroleum diesel that contains XX% of biofuels is designated as BXX [44]. Several demonstration projects have been carried out, including the use of ‘B20′, a marine biofuel, on a 85K DWT Kamsarmax bulker; the use of ‘B100′, a marine biodiesel, on eight bulkers for six months with no engine modification; the use of a 100% biofuel on the 37k DWT chemical tanker; and so on [38]. One of the major challenges of using biofuels is their limited availability, i.e., supply capacity [11,38]. The pros and cons of each fuel are summarized in Table 1.
Table 1. Pros and cons of alternative fuels [11,38,45].
FuelsProsCons
LNG
  • Mature technology
  • Bunkering network evolving
  • Low NOx and SOx emissions
  • Methane slip
  • Uncertain LNG pricing
  • High Capital Expenditure (CAPEX)
  • Low volumetric energy density
Methanol
  • Fuel handling simpler than LNG
  • Low NOx and SOx emissions
  • Compatible with existing terminal infrastructure
  • Used in dual fuel engines
  • Global renewable production still limited
  • Toxic and flammable
  • Low volumetric energy density
  • Life cycle GHG emissions equivalent to marine diesel oil (MDO) in case of fossil-based methanol
Biofuels
  • Widely available at competitive prices depending on the type of fuel
  • Requires limited changes to engines and fuel handling
  • Limited feedstock and production capacity
  • Emissions vary depending on fuel pathway
  • Land Use Change
Ammonia
  • Already produced and traded at scale
  • Possibility of production capacity increases for the use of hydrogen carriers
  • Zero emissions onboard, except for emissions generated from pilot fuels
  • Ammonia engines will be commercially available by the mid-2020s
  • Toxic and corrosive
  • Highly energy-intensive production process (Haber–Bosch)
  • Low volumetric energy density
  • Significant NOx emissions
Table 2. Properties of alternative fuels [9,11,41,46,47,48].
PropertyLSHFO aDieselLNG bMethanolAmmonia
Chemical formulaC8-C25C8-C25CH4CH3OHNH3
Liquid density
(kg/m3)
991840425.6798673.5
Lower heating value
(MJ/kg)
39.542.75020.118.6
Volumetric energy density
(GJ/m3)
39.1435.8721.2816.0412.53
Boiling temperature
(°C at 1 bar)
>180>180−16265−33.34
Flammable limits
(vol%)
0.6–7.50.5–7.55–156–3615–28
a: LSHFO denotes low-sulphur heavy fuel oil; b: LNG is a mixture of several gases, predominantly methane. Here, the properties of methane are used as representative values.
There are several studies on the LCA of marine fuels. Hwang et al. conducted an LCA of LNG and marine gas oil (MGO) as ship fuels in domestic service in Korea. According to their findings, the emissions from LNG are significantly lower than that from MGO in terms of GWP and other environmental impact categories. Their results reveal that the GHG emissions of LNG varied with the degree of methane slip during combustion, which depends on the type of engine [49]. High-pressure two-stroke diesel cycle engines have a methane slip of less than 1%, while four-stroke otto cycle engines are more sensitive to methane slips [50]. Gilbert et al. investigated fuel candidates for the decarbonization of the shipping industry. Life cycle emissions were estimated for several marine fuels: conventional oil-based fuels, LNG, bio-LNG, hydrogen with CCS, renewable hydrogen, natural gas (NG)-based methanol, liquid hydrogen (LH2), biodiesel, and straight vegetable oil. NG-based methanol and LNG does not have benefits in terms of CO2 emission reductions. Bio-derived fuels have the potential to reduce CO2 emissions significantly when CO2 emitted in the life cycle is used for biomass photosynthesis, although the amount of feedstock is limited. Potential GHG emission reductions of 57–79% can be achieved by bio-based fuels when compared to conventional marine fuels, depending on the feedstock, whereas methanol increases GHG emissions by 12–15% [4]. In another study, the potential of CO2 emission reduction through the use of biogas, dimethyl ether, ethanol, LNG, liquefied petroleum gas (LPG), methanol, ammonia, and biodiesel was assessed through LCAs. The results revealed that biogas was most effective in reducing CO2 emissions, while fossil fuel-based ammonia generated the largest amount of CO2 emissions (5.3 times more CO2 emissions than biogas) [5]. Perčić et al. conducted an LCA and life cycle cost assessment (LCCA) of alternative marine fuels and ship power systems for inland shipping in Croatia. Electric-powered ships emitted the least CO2 equivalent (CO2-eq) in the entire life cycle, including emissions of CO2-eq during the ship manufacturing process. Furthermore, ships fuelled by the proton exchange membrane fuel cell (PEMFC) emitted the largest amount of CO2-eq. An LCCA was conducted considering power system cost, carbon pricing, and fuel cost. The most cost-effective option varied depending on the type of ship and its operating profiles. In the LCCA, carbon pricing affected the emissions generated only during the Tank-to-Wake phase, and accordingly, carbon pricing for the Well-to-Tank phase of NG-based ammonia and hydrogen was not taken into account [51].
Simultaneously considering environmental and economic aspects in the selection of alternative fuels is important, and this can prevent omitting the effect of GHG emissions in life cycle cost assessments of ships. Eventually, it can help shipowners select compliant and cost-effective alternative fuels. Kanchiralla et al. evaluated e-hydrogen, e-ammonia, e-methanol, and electricity in several propulsion systems, such as engines, fuel cells, and carbon capture technologies, in terms of the environmental and economic aspects. The carbon abatement costs were 408 EUR/ton CO2 for e-hydrogen using fuel cells, 532 EUR/ton CO2 for e-hydrogen using engines, 316 EUR/ton CO2 for fuel cells using e-ammonia, 355 EUR/ton for engines using e-ammonia, and 326−412 EUR/ton CO2 for engines using e-methanol [52]. Lindstad et al. compared e-fuels such as e-ammonia, e-hydrogen, e-methanol, e-LNG, e-diesel, and other fossil-based fuels in terms of GHG emissions, energy use, and cost. Their results show that NG-based liquid hydrogen and NG-based ammonia emits 66% and 40% more CO2-eq per kWh of power than that of MGO, respectively. The annual ship costs, including the costs of the basic vessel, engine, an additional fuel system, and fuel consumption, were investigated. In the low-renewable electricity price scenario, the cost difference between hydrocarbon e-fuels and carbon free e-fuels was 20%, while it was 60% in the high-renewable electricity price scenario. However, hydrocarbon e-fuels have an advantage, as they can be used in the existing fleet without retrofitting [53]. Wang et al. performed an LCA and LCCA for battery-powered ships. According to their results, battery-powered ships showed a 30% reduction in life cycle GHG emissions and 15% reduction in ship life cycle cost compared with conventional ships when using the grid mix electricity [54]. Kim et al. compared conventional HFO propulsion systems and ammonia propulsion systems from economic and environmental perspectives. Their results reveal that the ammonia-based system can reduce GHG emissions by 83.7–92.1%, while the life cycle cost increased by 3.5–5.2 times compared to the conventional propulsion systems [25]. Perčić et al. conducted LCAs and LCCAs for dimethyl ether, electricity, methanol, natural gas, biodiesel, and hydrogen on three different RoPax ships. The carbon tax for tailpipe emissions was taken into account. The results showed that battery-powered ships showed 50% reduced CO2-eq emissions compared to diesel-powered ships and showed 56% lower costs than diesel-powered ships [55]. Zincir investigated the effect of an ammonia dual-fuel engine in terms of the environmental and economic aspects. Blue ammonia shows 42.8% lower CO2 emissions than MDO. Green ammonia with solar power showed a similar degree of CO2 reduction capacity to blue ammonia, while green ammonia from wind energy attained 79.2% lower CO2 emissions than MDO. The cost of blue ammonia fuel is estimated to be 8.8–13.9% higher than MDO, while the use of green ammonia seems unfeasible due to its significantly higher cost [9].
Through our literature review, the following limitations of previous studies were identified: Although there were several LCA studies for alternative marine fuels, the types of fuels and production pathways assessed were not comprehensive; life cycle carbon pricing was not appropriately considered for economic analysis, and the existing research lacks the consideration of fuel blending between similar-level fuels with different pathways. Accordingly, sufficient insight for more cost-effective fuel options was not provided. The ship power systems, such as fuel cells, batteries, and engines, varied, inhibiting direct comparisons. The effect of pilot fuels was not appropriately considered for environmental and economic analyses.
To address these gaps, in this study, LCAs for the aforementioned alternative fuels considering their application in engines were implemented. Life cycle carbon pricing was added onto fuel price. The LR-1 tanker was selected as a reference ship, and LCCAs were conducted. The effects of blending fuels in different production pathways were assessed and compared.

3. Methodology

3.1. Life Cycle Assessment

LCA consists of four phases: goal and scope definition, including the functional unit and system boundary; inventory analysis; impact assessment; and interpretation [13]. The goal of the LCAs carried out in this study was to examine the environmental impact of marine fuels for the selection of relatively viable marine fuels. The scope of assessment included stages such as feedstock extraction, conversion and transportation, storage, and combustion in the ship engine. The detailed system boundary is described in the following sections and in Figure 3. The functional unit is defined as the quantification of the identified functions of the fuels and is important for the comparison of different systems being assessed on a common basis [13]. GHG emissions, including CH4, N2O, and CO2 per kWh of output power in the engines, were used as functional units in this study. Furthermore, the 100-year GWPs of CO2, CH4, and N2O from the Fifth Assessment Report (AR5) of the Intergovernmental Panel on Climate Change (IPCC) were adopted for GHG emission calculations and are provided in Table 3. The total CO2-eq emissions of each fuel can be calculated by multiplying the mass of CO2, N2O, and CH4 by the GWP of each gas, respectively. The total CO2-eq emissions of the fuels can be calculated as follows:
E M = ( G W P C O 2 m C O 2 + G W P C H 4 m C H 4 + G W P N 2 O m N 2 O )
where m denotes the mass of emission.
The marine module in the Greenhouse gases, Regulated Emissions, and Energy use in Transportation (GREET) model developed by Argonne National Laboratory was used to implement the LCAs. The marine module of GREET consists of two key stages: Well-to-Tank, which analyses the energy use and emissions associated with production and delivery, and Tank-to-Wake, which refers to the combustion of fuels [48]. The GREET calculates emissions such as CO2, CH4, and N2O and other pollutants emitted from fuel life cycles. Several studies have used GREET for the LCA of marine fuels [25,51,55,56,57,58]. Data not in the GREET inventory were calculated externally and reflected for the calculation of the Well-to-Wake emissions.
Table 3. GWPs of greenhouse gases [59].
AR Edition/TypeAR5/GWP
Time Horizon (YR)100
CO21
CH430
N2O265
The specific fuel consumption of each fuel in the calculation of emissions in the Tank-to-Wake phase are shown in Table 4.
Note that the ammonia engine has not been fully developed, though it is expected to be commercially available in 2024. Therefore, the specific fuel consumption of a main engine using ammonia was assumed based on the preliminary data of ammonia engine development plans. The specific fuel consumption for a main engine using methanol was based on the currently available methanol engine. The specific fuel consumption of an auxiliary engine for ammonia and methanol was assumed based on each main engine.
The life cycle CO2-eq emissions of fuels combusted in the designated engines can be calculated using Equation (2).
E M W t W = E M W t T , m f + E M T t W , m f + E M W t T , p f + E M T t W , p f
The subscripts WtW, WtT, and TtW denote Well-to-Wake, Well-to-Tank, and Tank-to-Wake, respectively. The subscripts mf and pf represent main fuel and pilot fuel, respectively. Note that fuel life cycle emissions include emissions from both the main and pilot fuel in cases where dual-fuel (DF) engines are used.

3.2. Fuel Pathway

3.2.1. HFO (0.1% Sulphur) and MGO (0.1% Sulphur)

The fuel pathways of each fuel, from production to combustion, are presented in Figure 3. Extracted crude oil is transported 12,645 km via very large (310,000 DWT) crude carriers (VLCC tankers). The ship transportation distance of other fuels in this study was set to the same as HFO for consistency. Furthermore, 100% of conventional crude oil, excluding shale oil, was considered. Crude oil is unloaded at the port and transported by pipeline to a refinery 14 km away. To produce HFO with a sulphur content 0.1%, hydrogen produced from NG is supplied to a refinery through pipelines for 24 km. The industrial electricity mix adopted in this study was as follows: 39% NG, 60.7% oil, and 0.3% renewables. MGO has a similar life cycle to HFO, although with MGO, less hydrogen is needed for desulphurization. These fuels were selected as reference fuels and compared to the alternative fuels.

3.2.2. Fossil LNG

NG extracted at the well is sent out to a liquefaction plant through a pipeline for 50 km. After pre-treatment, such as desulphurization, the NG is refrigerated to a temperature of about −163 °C, liquefied, and stored for subsequent shipment. Similar to HFO, conventional natural gas, excluding shale gas, was considered. LNG is then shipped to a 174,000 m3 LNG carrier. The fuel mix for LNG carriers is considered to be 45.8% residual oil, and the rest is LNG. Boil-off gas generated due to heat ingress is assumed to be completely recovered via a re-liquefaction system during transportation via an LNG carrier and during storage in the production plant and/or terminal. In general, methane slip plays an important role in determining total Tank-to-Wake emissions [60,61]. A two-stroke slow-speed diesel DF engine was considered as the propulsion engine, and a four-stroke otto cycle DF engine was considered as the auxiliary engine in the Tank-to-Wake phase. The use of a four-stroke otto cycle DF engine tends to result in higher methane slip than the use of a two-stroke slow-speed diesel DF engine. The emission factors of N2O, CH4, and CO2 for each type of engine used in this study are shown in Table 5.

3.2.3. Biomass-Based FT-Diesel

The feedstock for biomass-based FT-diesel is forest residue. Collected forest residue is transported for gasification to produce synthesis gas, which includes hydrogen and carbon monoxide. After purification, the gases are converted into diesel through the FT synthesis process. The FT synthesis process has been used to convert non-liquid hydrocarbon sources to liquid hydrocarbon for decades and is considered a mature technology [43,62,63]. FT-diesel is transported via tanker (12,000 km) and stored in terminals. Then, it is bunkered to a fuel tank and combusted onboard. The portion of CO2 emissions from the combustion of biomass-based FT-diesel is offset by photosynthesis, while the forest grows so-called biogenic credit. Although this fuel pathway is still in the early stages of development, it is considered a future alternative fuel, like other e-fuels [42].

3.2.4. Biodiesel

The life cycle of soybean-based biodiesel has several steps: fertilizer and chemical production for farming, soybean harvesting and transportation, soy oil extraction, transportation via pipeline, biodiesel production through the transesterification process, transportation via pipeline (100 km), and, lastly, onboard combustion. Biogenic credit is applied, similar to the biomass-based FT-diesel.

3.2.5. NG-Based Methanol

Currently, the majority of commercially available methanol is produced from natural gas [64]. The life cycle of NG-based methanol starts with natural gas extraction. Then, it is transported to the methanol plant via a pipeline for 50 km. Methanol is produced through steam reforming, synthesis, and distillation. Then, pure methanol is transported via 53,000 m3 tankers and stored in terminals. Subsequently, bunkering, onboard storage, and combustion occur. During methanol production, no co-product is considered.

3.2.6. Biomass-Based Methanol

The feedstock for biomass-based methanol is forest residue, similar to the biomass-based FT-diesel. The feedstock process includes harvesting, collecting, transportation, handling, and pyrolysis, which is the endothermic decomposition of the forest residue [65]. The conversion process includes gasification, synthesis for methanol. Subsequently, the biomass-based methanol produced is transported to terminals. Similarly to the other biofuels mentioned above, biogenic credit is applied.

3.2.7. E-Methanol

E-methanol is one of the e-fuels that is defined as a synthetic fuel produced by reacting e-hydrogen, which is generated via the electrolysis of water with renewable electricity, and CO2 from flue gas or direct air capture (DAC) [28]. In this pathway, e-hydrogen is produced via solar electrolysis and sent 10 km away by pipeline to a methanol synthesis plant. CO2 is obtained by DAC, specifically through cryogenic carbon capture. Then, H2 and CO2 are reacted to produce CO through a reverse water gas shift (RWGS) reaction. Methanol is produced through a catalytic synthesis reaction between CO2, CO, and H2 [66]. The other stage of the pathway is the same as NG-based methanol. It is worth noting that the CO2 emitted in engine combustion offsets the CO2 captured through DAC.

3.2.8. NG-Based Ammonia with or without CCS

NG is extracted and transported to the ammonia plant via pipeline for 50 km. H2 is produced from NG via the steam methane reforming (SMR) process, which is a mature technique and the most widely used process for hydrogen production [67]. Where CCS is applied, 90% of CO2 is captured using monoethanolamine (MEA). As additional energy for MEA-based CCS is needed, an overall CO2 capture rate of 89.02% is applied [68]. Ammonia is synthesized from N2 and H2 through the Haber–Bosch process, which is the most common and commercially available process [9,35,69]. Then, ammonia is transported via commercially available 84,000 m3 tankers, the capacity data of which are presented in reference [70], and unloaded to the terminal. Ammonia does not include carbon; therefore, none of the CO2 is generated during combustion onboard. However, it is worth noting that the ammonia engines being developed cannot operate using ammonia alone. Therefore, a portion of diesel for use as a pilot fuel should be supplied [8,71].

3.2.9. E-Ammonia

In this pathway, e-hydrogen is produced through low-temperature electrolysis, and the electricity source is solar energy. It is known that the hydrogen production process accounts for more than 90% of the total energy requirement for ammonia production [67,72]. Although the energy requirement is high, emission is not significantly related, as solar energy is used. In this study, an energy efficiency of 72.6% was selected for low-temperature electrolysis. N2 is produced through cryogenic distillation, which accounts for more than 90% of N2 produced worldwide [73,74]. Through the Haber–Bosch process, ammonia is produced. The electricity source for cryogenic distillation and the Haber–Bosch process is wind electricity. The other stage of the pathway is the same as NG-based ammonia.

3.3. Economic Analysis

3.3.1. Reference Ship

The reference ship selected in this study was a LR1 Panamax tanker with 75,000 DWT. The specifications of the reference ship are as shown in Table 6. The reference ship was assumed to voyage on a route between North America and Northern Europe: Houston–Rotterdam–Ventspils–Houston, as shown Figure 4. The total voyage distance is about 11,700 nautical miles (18,830 km), and we used this fixed route to perform economic analysis [75]. The ship’s life time was assumed to be 25 years.
The average speed of a product tanker with a similar size is 12.5 knots, which was used as the fixed transit speed of the reference ship. It was assumed that the ship operates 360 days a year, corresponding to about eight round trips per year. It was assumed that 87% of the total operating time was spent on transit, 3% on approach, and the remaining 10% on port [76]. The average and design speeds were used to calculate the load factor of the engine, which is defined as the ratio of the average load to the total capacity of the engine [76]. The load factor of the main engine in transit can be determined using Equation (3).
L F = v a v d 3
In Equation (3), LF,   v a , and v d are the load factor, average speed, and design speed of the reference ship, respectively. The average power of main and auxiliary engines can be calculated using Equations (4) and (5).
P M E ,   a v g = P M E , M C R   L F M E , k
P A E , a v g = P A E , M C R   L F A E , k
P M E , M C R and P A E , M C R denote the maximum continuous rating of the main and auxiliary engines, respectively. The subscript k denotes the operational modes, namely the transit, approach, and port modes. The load factor of the auxiliary engine in transit and approach was assumed to be 0.7. The load factor at port was considered to be 0.3. The load factor of the main engine in transit can be calculated as per Equation (3), and the load factor of the main engine upon approach was assumed to be 0.4. In all cases, it was assumed that the cargo capacity of reference ship has not changed and that there is no significant change in the draft of the reference ship related to the use of alternative fuels.
Although the reference ship was selected as a tanker, it is expected that the results of this study can be applied to other categories of ships on international voyages.

3.3.2. CAPEX, Fuel Cost, and Carbon Price

CAPEX
The new building cost of an HFO-fuelled 75,000 DWT Panamax tanker was considered as to be USD 43.3 million [77]. CAPEX ratios of LNG-, methanol-, ammonia-fuelled ships relative to the HFO-fuelled ship were derived from [78], as shown in Table 7. The CAPEX of Panamax tankers fuelled by LNG, methanol, and ammonia were estimated by multiplying the CAPEX ratio by the new building cost of the HFO-fuelled Panamax tanker. The new building cost of the Panamax tanker with an alternative fuel was assumed to include costs related to a dual-fuel engine, the fuel supply system, and the fuel storage tank.

3.4. Fuel Price

Fuel price includes the fuel production cost, distribution cost, profit, and tax. However, in this study, fuel price was estimated by summing the fuel production cost and distribution cost, excluding profit and tax, which have many uncertainties. The fuel production cost was obtained from several sources and assumed to increase linearly from 2025 to 2050.
The production costs of biofuels, including biomass-based FT-diesel, biodiesel, and biomass-based methanol, were taken from reference [79]. The production costs adopted in this study take into account mid-term cost improvements and the impacts of lower capital cost. The current production cost in reference [79] was taken as the 2025 production cost, and the upper bound costs were taken for both the 2025 and 2050 production costs. As there are many uncertainties in long-term cost estimation, such as feedstock cost fluctuations, mid-term production costs considering the impacts of reduced finance costs were used as the 2050 production costs for biofuels. As the biofuel production costs were listed in EUR/MWh in reference [79], they were converted into USD/GJ based on the currency conversion rate (1 Euro to 1.05 USD) and unit conversion rate.
In the case of the e-methanol and e-ammonia production costs, the e-hydrogen production cost is the governing factor. Therefore, in order to have the same assumptions for e-hydrogen production, the e-methanol and e-ammonia costs were extracted from same source. The production costs of e-methanol and e-ammonia in 2025 were estimated to be in the range of 136 to 260 USD/MWh and 126 to 194 USD/MWh, respectively. The 2050 cost target is 107 USD/MWh to 145 USD/MWh for e-methanol and 67 USD/MWh to 114 USD/MWh for e-ammonia [80]. The upper bound cost for each fuel was adopted for a consistent and conservative approach. The costs were initially listed in USD/MWh and converted into USD/GJ using the unit conversion rate.
The production cost of NG-based methanol lies in the range of 100 USD/ton in the Middle East to 300 USD/ton in Europe [81]. The cost of NG-based ammonia production is in the range of 110 USD/ton to 340 USD/ton of ammonia [82]. In this study, 300 USD/ton for both NG-based methanol and NG-based ammonia in 2025 were assumed for calculation. As the costs of NG-based fuels are highly dependent on NG price, the future cost of NG-based fuels was estimated in conjunction with cost projections for NG. The cost for CCS was inputted as 80 USD/ton CO2, considering a 90% CO2 capture ratio, which refers to the capture of CO2 from diluted furnace flue gas [83]. Cost projection of each fuel is shown in Table 8.
The distribution costs of methanol and ammonia were estimated to be 50 USD/tonnage or about 2.5 USD/GJ, 2.7 USD/GJ, respectively. The distribution cost of biomass-based FT-diesel and biodiesel was assumed to be 40 USD/tonnage, i.e., 0.93 USD/GJ. These costs are assumed to stay constant over time.
The prices of fossil fuels (HFO, MGO, and LNG) for 2020, 2030, and 2050 were obtained from [84].
Calculated fuel prices are illustrated in Figure 5.

3.5. Carbon Price

The carbon price refers to the cost imposed onto GHG emissions and takes the form of emission taxes and levies or emission trading systems. The carbon price scenario assumed in this study is that the carbon price continues to be 11 USD/ton of CO2 from 2025 to 2030 and increases to 100 USD/ton of CO2 at the beginning of the 2030s. After this, the carbon price is ramped up to USD 264/ton CO2, as can be seen in Figure 6 [85]. This scenario was produced to achieve a 50% GHG emission reduction by 2050 compared to 2008. Note that we imposed carbon price on ton CO2-eq rather than ton CO2 in this study. The carbon price scenario used in this study is shown in Figure 6.
Ship Life Cycle Cost
Ship life cycle fuel cost can be calculated summing fuel cost consumed in main and auxiliary engines, as follows:
C f , s l c = n = 1 25 ( C f , M E , n + C f , A E , n )
The subscripts f and slc indicate the fuel and ship life cycle, respectively.
C M E , n and C A E , n indicate the annual fuel cost, including carbon price in year n for the main and auxiliary engine, respectively, and can be determined as per the following equations:
C f , M E , n = E M E , m f 10 6 [ ( S F C M E , m f C m f , n L H V m f ) + ( C P n E M W t W , M E , m f ) ] + E M E , p f 10 6 [ ( S F C M E , p f C p f , n L H V p f ) + ( C P n E M W t W , M E , p f ) ]
C f , A E , n = E A E , m f 10 6 [ ( S F C A E , m f C m f , n L H V m f ) + ( C P n E M W t W , A E , m f ) ] + E A E , p f 10 6 [ ( S F C A E , p f C p f , n L H V p f ) + ( C P n E M W t W , A E , p f ) ]
where C m f , n and C p f , n denote the unit fuel cost (USD/GJ) in year n. E M E and E A E of the main and pilot fuel represent the energy needed for an annual voyage (kWh). C P n and S F C refer to the carbon price in year n (USD/ton CO2-eq) and specific fuel consumption (g/kWh), respectively. Only when LNG, ammonia, and methanol are used in a dual-fuel engine is the cost of pilot fuel included. LHV denotes the lower heating value of each fuel (MJ/kg).
The E M E and E A E of the main and pilot fuel can be calculated according to the following equations:
E M E = T t r P M E , a v g , t r + T a p P M E , a v g , a p
E A E   = T t r P A E , a v g , t r + T a p P A E , a v g , a p + T p o P A E , a v g , a p
The subscripts tr, ap, and po denote the operational modes of transit, approach, and port, respectively. T indicates the yearly time spent in each mode of operation.
To compare ship life cycle cost, NPV was calculated by summing CAPEX and discounted fuel cost during the ship’s lifetime.
N P V = C A P E X + n = 1 25 ( C f , M E , n + C f , A E , n ) ( 1 + r ) n
where CAPEX refers to the ship investment cost. The variables r and n represent the discount rate and the number of years within a ship’s lifetime, respectively. Income through ship operation was not counted as cargo capacity, and the reference ship was assumed to stay the same regardless of fuel type. Therefore, a lower NPV represents a greater benefit for ship and fuel selection in this study.

4. Results and Discussion

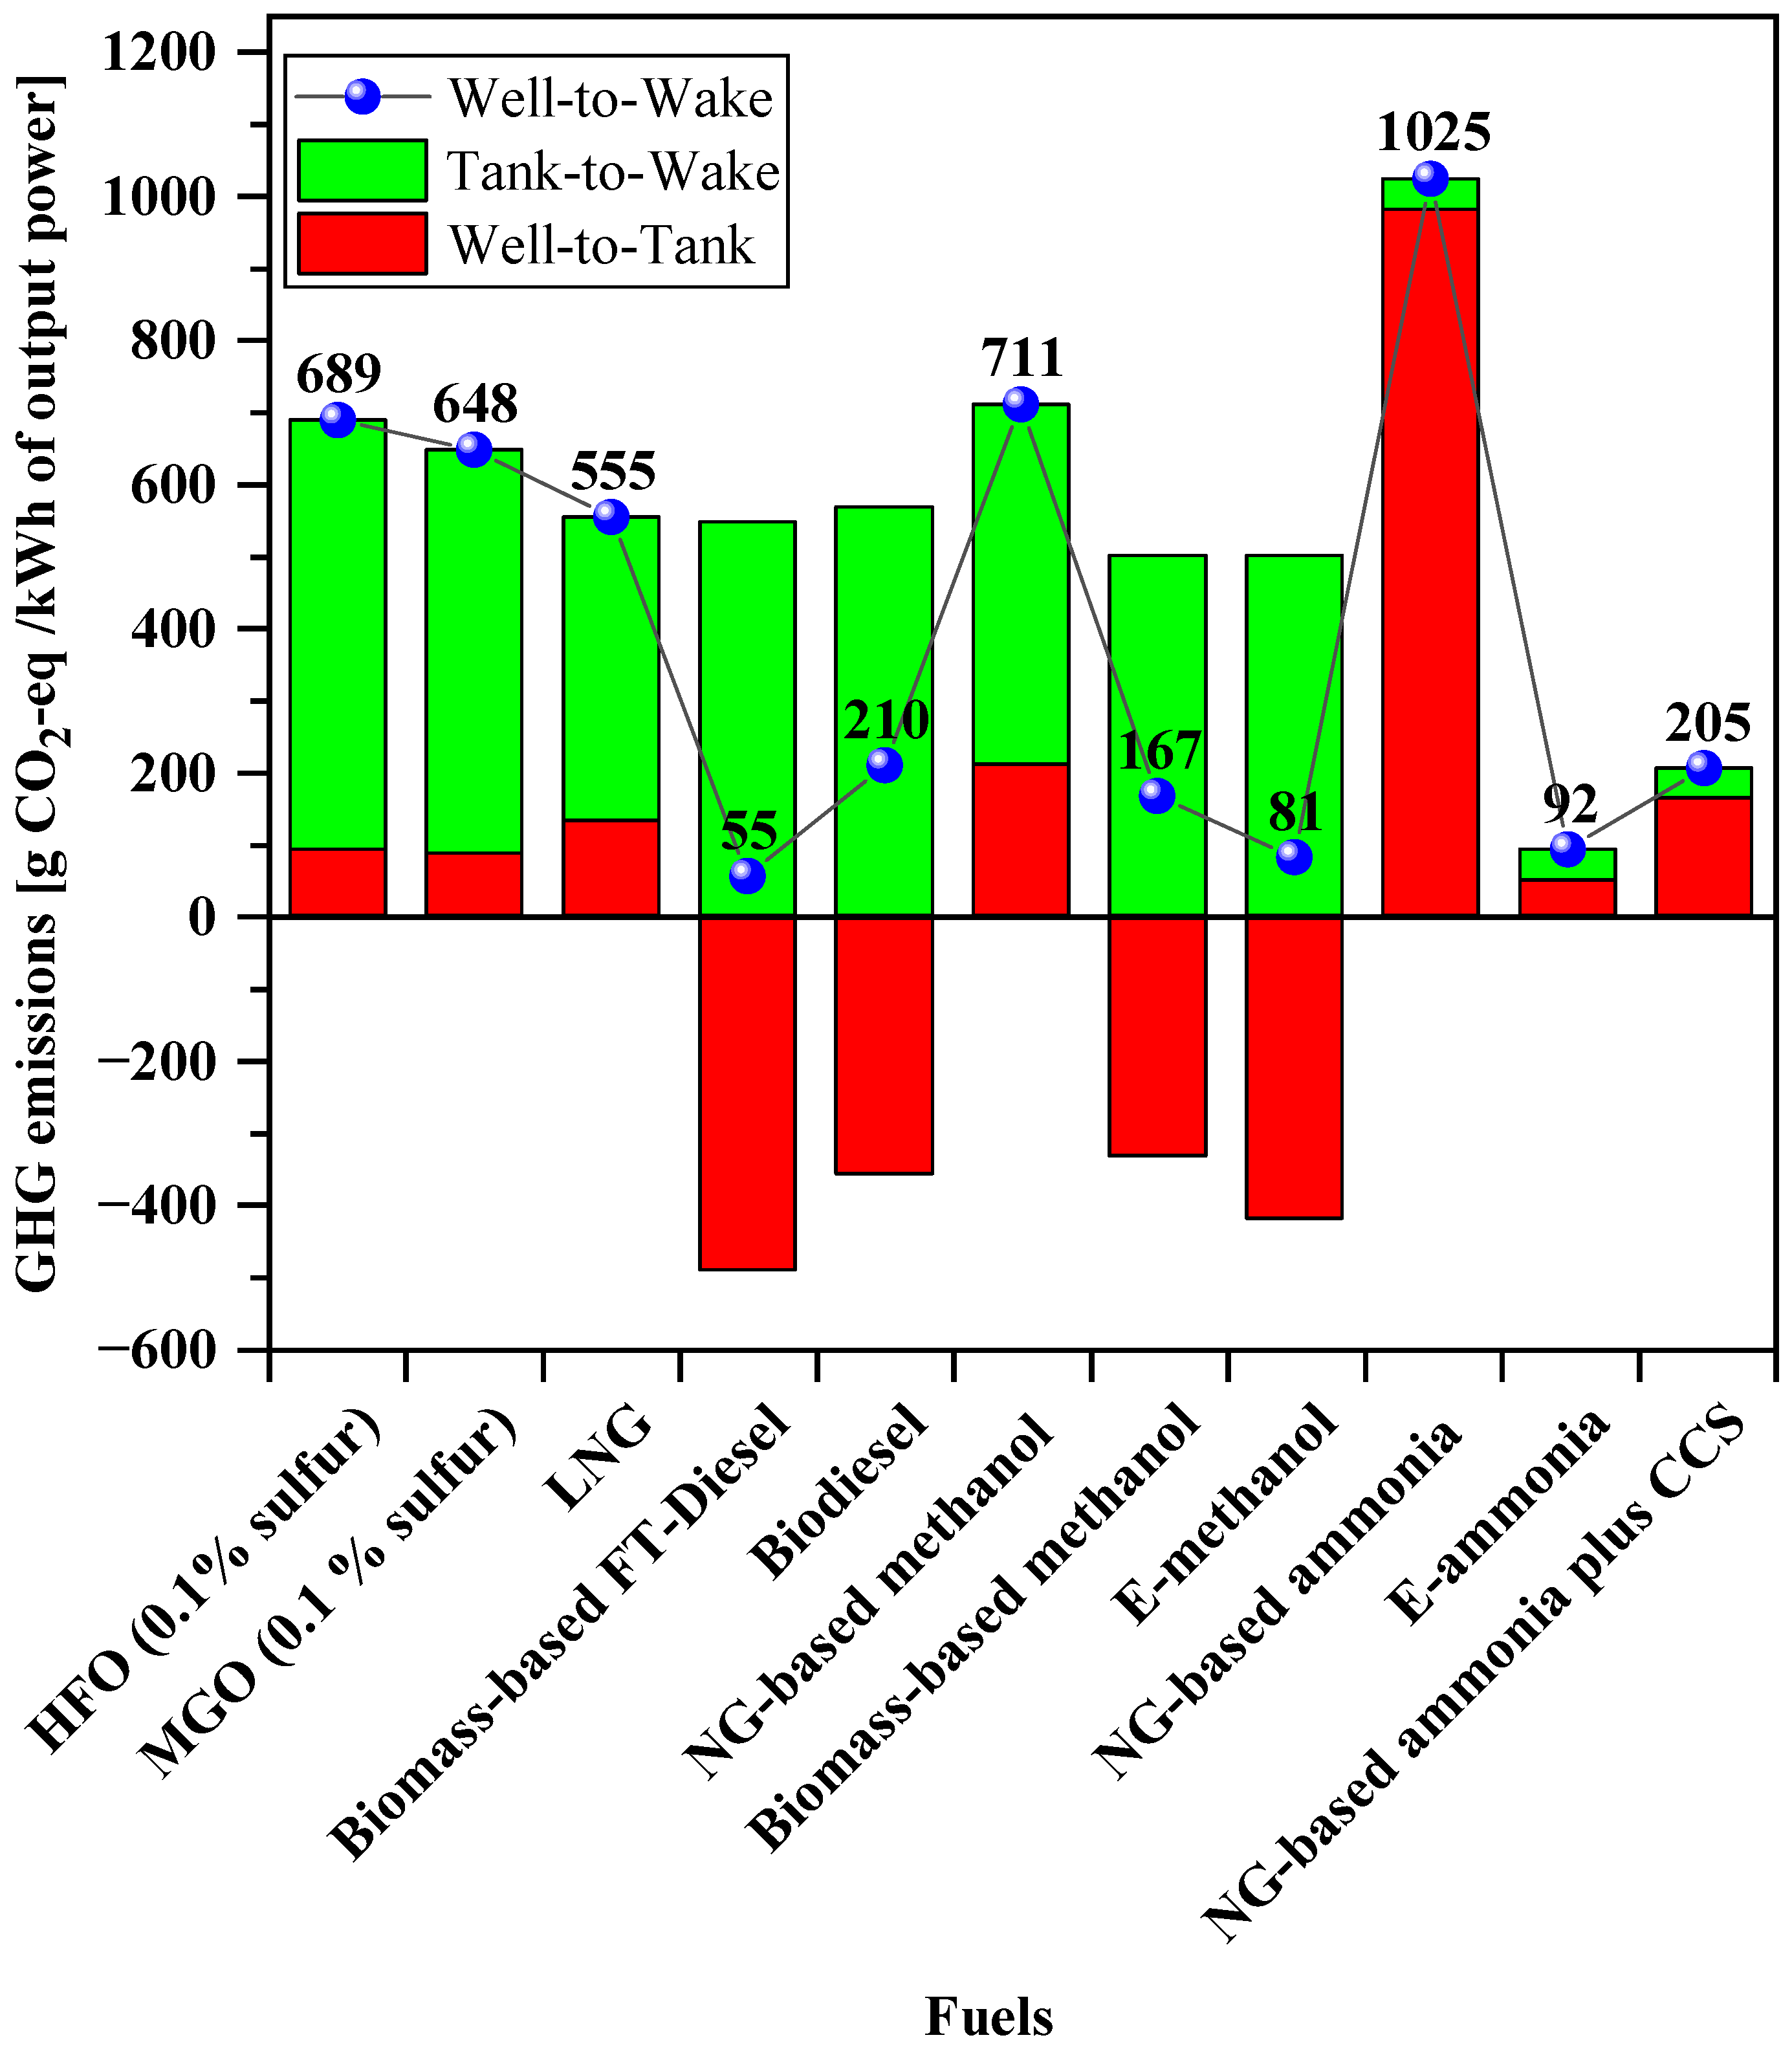
4.1. Life Cycle Assessment

Figure 7 presents the life cycle emissions for each fuel in terms of CO2-eq/kWh, breaking it down into two stages: the Well-to-Tank stage and the Tank-to-Wake stage. Note that the GHG emissions of LNG, ammonia, and methanol were considered including pilot fuel emissions, as explained in Section 3.1. Among the eleven fuels analysed, NG-based ammonia shows the highest GHG emissions. When 1 kWh of output power in the main engine is generated from NG-based ammonia, approximately 1025 g of CO2-eq is emitted, resulting in 48.7% more emissions relative to HFO.
Emissions from the Well-to-Tank stage account for 95.8% of the life cycle CO2-eq emissions, and the Tank-to-Wake stage emits just 42.63 g of CO2-eq, most of which results from pilot fuel combustion. NG-based methanol emits the second highest GHG emissions and has 3.2% more life cycle CO2-eq emissions compared to HFO. From the Well-to-Wake perspective, ammonia and methanol from natural gas is not a viable alternative fuel.
In the case of the main engine, the lowest emission was generated in biomass (forest residue)-based FT-diesel, emitting 55.4 g of CO2-eq (92% lower than that of HFO) per 1 kWh of output power in its life cycle, followed by e-methanol with 81.48 g CO2-eq, e-ammonia with 92.16 g CO2-eq, biomass (forest residue)-based methanol with 166.95 g CO2-eq, NG-based ammonia plus CCS with 205.19 g CO2-eq, and biodiesel (soybean) with 210.23 g CO2-eq. Note that biogenic credit was considered for the biomass-based fuels; namely, the CO2 emitted in combustion is absorbed by photosynthesis while biomass grows. It is worth noting that the life cycle CO2-eq emission of biodiesel was 210.23 g CO2-eq, showing 154 g more than biomass-based FT-diesel. This difference resulted from the energy efficiency of the fuel production process.
The GHG emission of e-methanol in the Well-to-Tank stage is negative, as CO2 is directly captured from the air for the synthesis of methanol. In the case of NG-based ammonia plus CCS, while an 89.02% overall CO2 capture rate in the ammonia plant was assumed, the CO2-eq reduction over its life cycle was 79.9%. This resulted from the GWP effects of CH4 and N2O, which are not captured in CCS, and CO2-eq emissions from pilot fuels combusted in the engine. Our results show that in most cases, except for ammonia, the Tank-to-Wake stage accounted for the majority of the GHG emissions.
Due to the efficiency difference between the main and auxiliary engines, slightly more emissions are generated in the auxiliary engine, as shown on Figure 8. In the case of LNG, 19.5% lower CO2-eq emissions relative to HFO were generated in the main engine, while a similar amount of CO2-eq emissions to HFO were generated in the auxiliary engine. This difference mainly resulted from the methane slip of the otto cycle in auxiliary the engine, as shown in Table 4.
Notably, the CO2-eq emissions of NG-based ammonia in the Tank-to-Wake phase accounts for only 4.3% of the life cycle emissions. For bio-based fuels, if the emissions from Well-to-Tank are not considered, the potential for emission reduction is significantly reduced. Therefore, life cycle emission needs to be appropriately considered for an environmental and economic analysis. The following alternative fuel candidates have the potential to meet the IMO target of reducing the total GHG emissions by 50% by 2050, based on the level recorded in 2008: bio-based fuels, e-methanol, e-ammonia, and CCS combined NG-based ammonia; they have reduction potentials of 69–92%, 88%, 86%, and 70%, respectively.
The energy consumption of each fuel pathway was investigated, and the results are illustrated in the Sanky diagram shown in Figure 9. This diagram shows the total energy value required to produce 3.6 MJ (1kWh) of output power and the energy loss of each stage. The results indicate that fossil fuels such as HFO, MGO, and LNG have lower energy loss in each stage and, accordingly, a lower total energy input than the other fuels. More energy loss does not always result in more CO2-eq emissions. As an example, e-methanol and NG-based methanol require 20.10 MJ and 11.14 MJ for 1 kWh of output power, respectively, but e-methanol emits only 11.5% of CO2-eq emission compared to NG-based methanol. It can be noticed that the efficiencies of most alternative fuels in the Well-to-Tank stage need to be improved for sustainability.

4.2. Economic Analysis
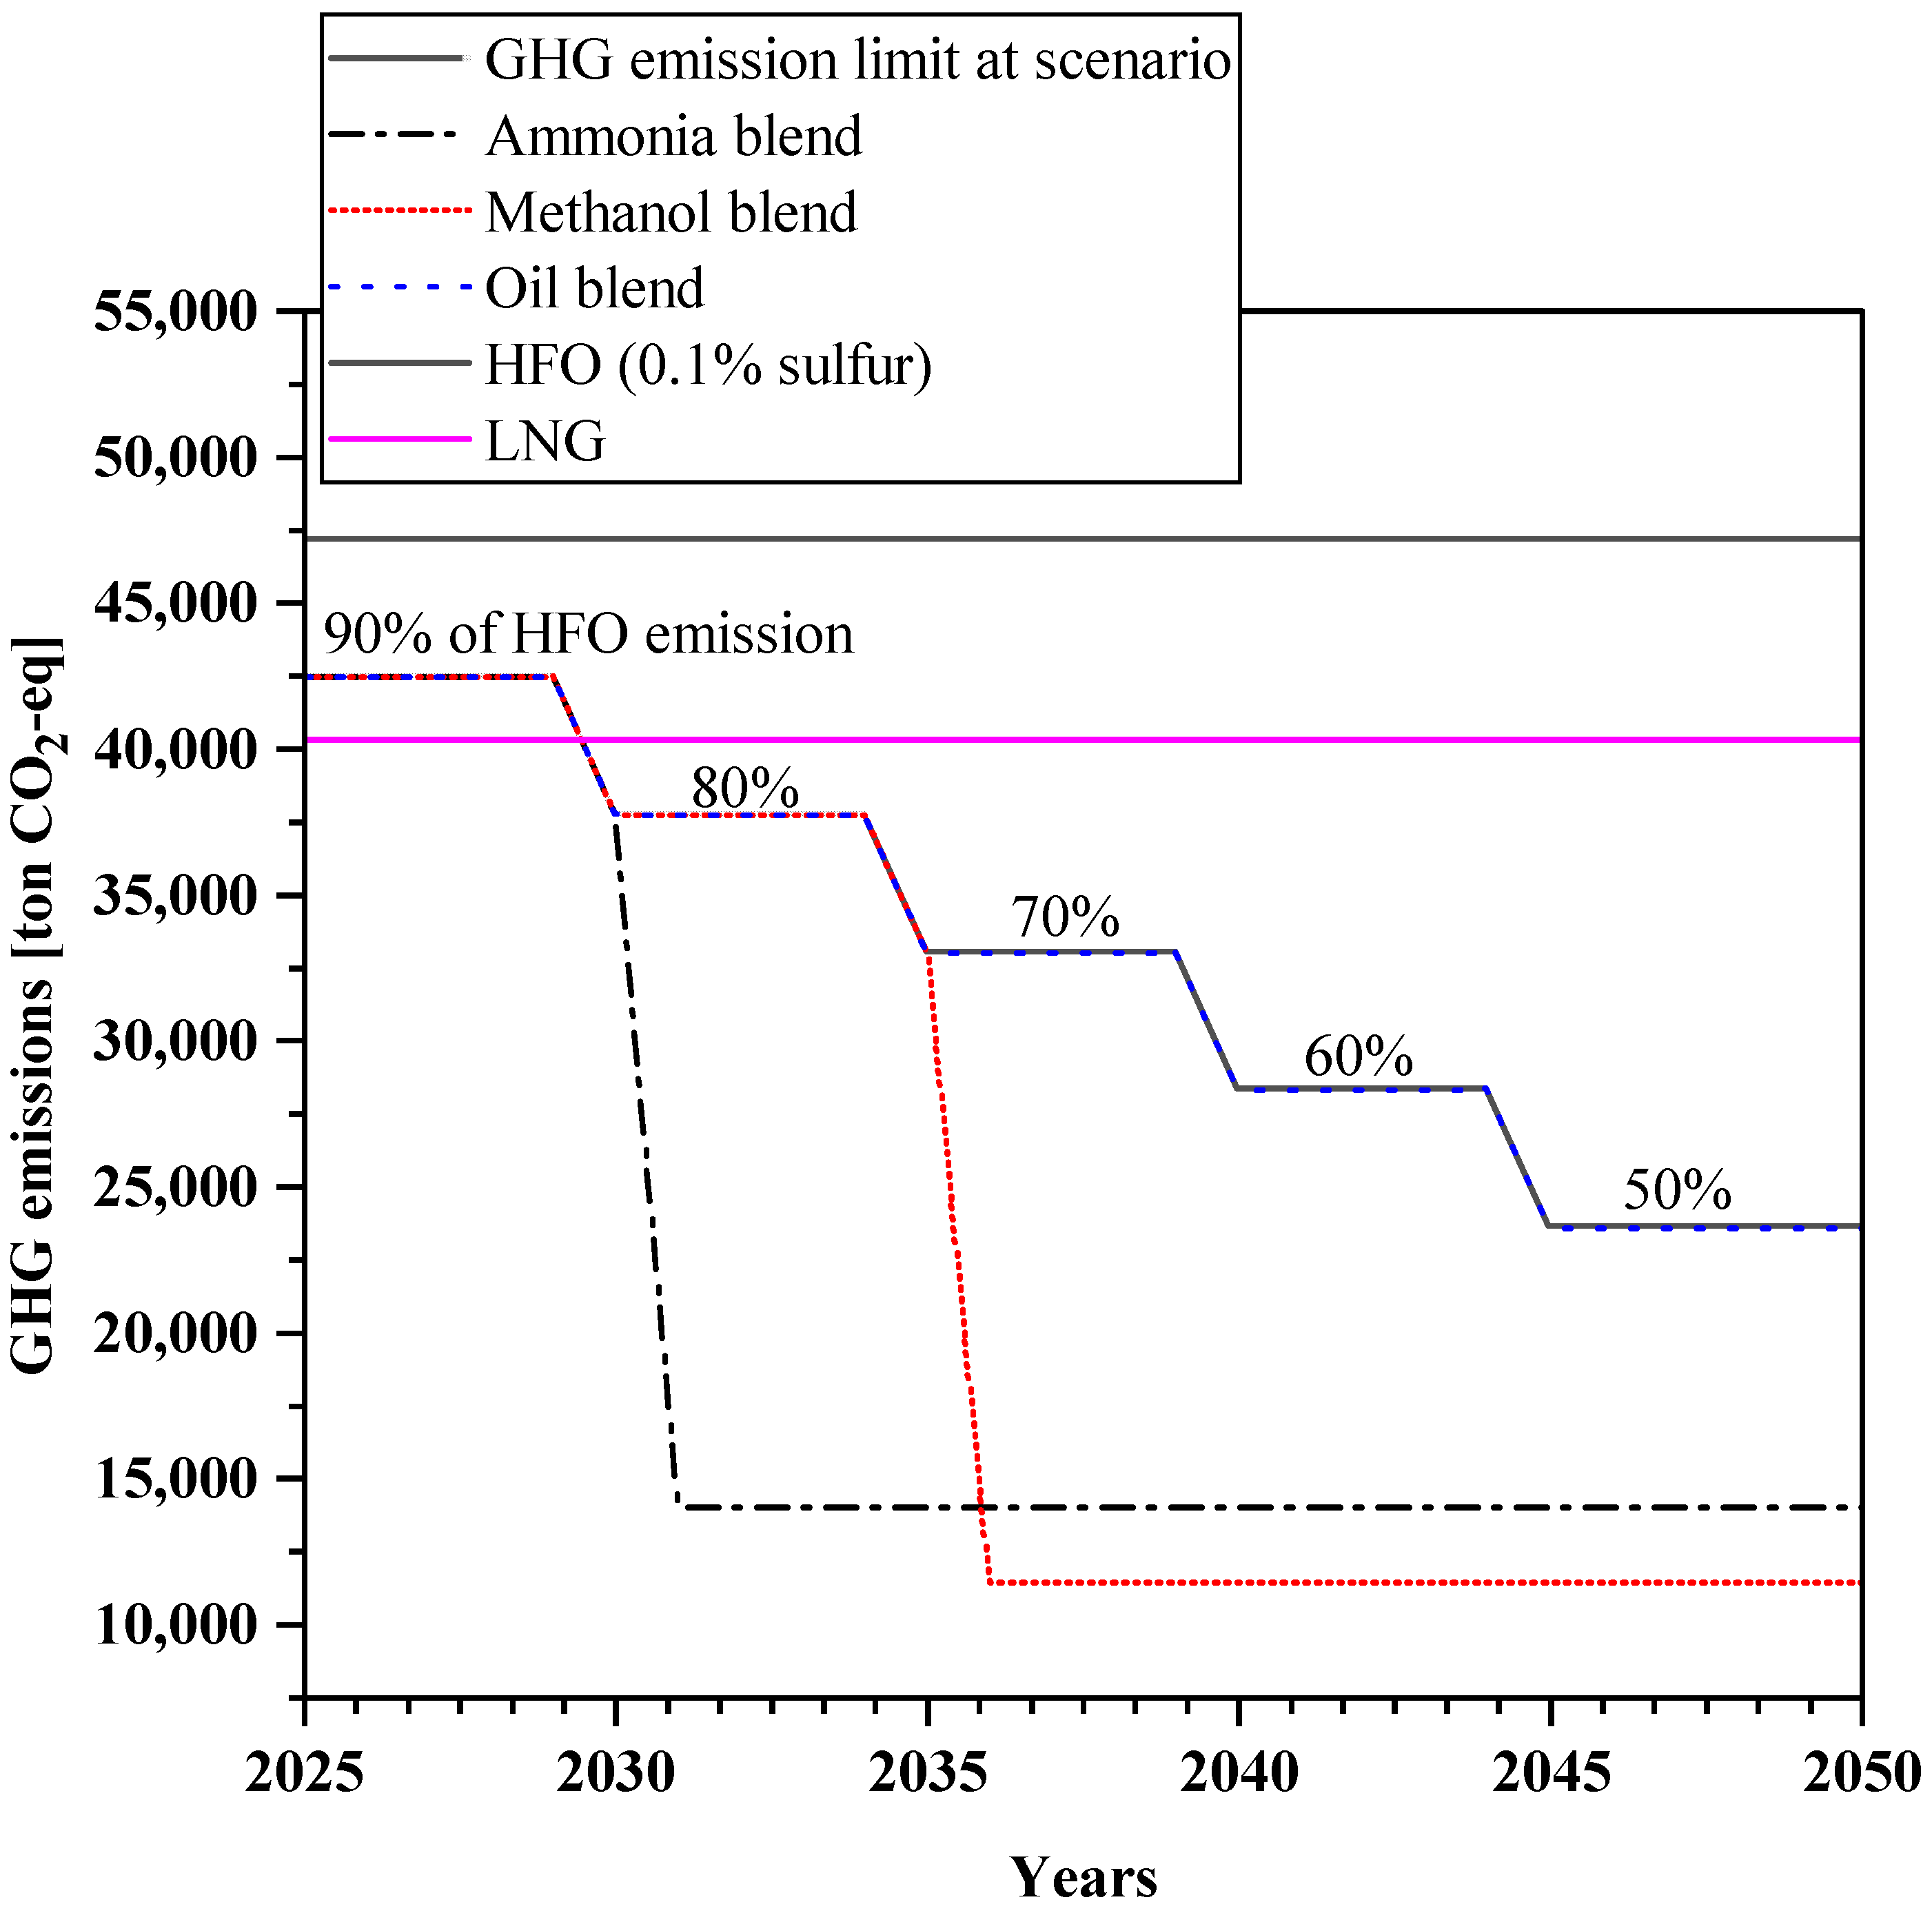
To calculate ship life cycle cost, annual carbon prices for each fuel type were derived by multiplying unit carbon price (USD/ton CO2-eq) and the annual power consumption of ships (kWh) by the Well-to-Wake CO2-eq emissions, as shown in Figure 10. In this figure, we can see a similar trend to that of the results derived from our LCA. NG-based ammonia shows the highest ship carbon price, followed by NG-based methanol, HFO, MGO, and LNG.
At given scenarios, annual fuel costs, including carbon price with varying years, are illustrated in Figure 11. As can be seen, the annual cost of e-fuel follows the trend of the fuel production cost, while fossils and fossil-based fuels, which emit large amounts of CO2-eq, show a similar trend to carbon price. The annual costs of e-methanol and e-ammonia for the reference ship are expected to be approximately 35.35 mUSD and 28.44 mUSD, respectively, in 2025, and these values are expected to fall progressively, eventually achieving values of approximately 21.86 mUSD and 19.0 mUSD, respectively, in 2050. One reason for why the cost projection of e-methanol is higher than that of e-ammonia is that e-methanol requires an external carbon source, specifically, in this study, direct air capture. NG-based ammonia and NG-based methanol are cost-competitive compared to other alternative fuels between 2025 and 2030, though they exceed the cost of other fuels, including e-fuels, between 2031 and 2050. The cost of NG-based ammonia is higher than e-ammonia from 2036 and e-methanol from 2041. The annual cost of NG-based methanol crosses that of e-ammonia in 2045 and the approximate cost of e-methanol in 2050. NG-based ammonia plus CCS becomes cost-competitive over NG-based ammonia from 2031, though it shows still lower annual costs than that of e-fuels even in 2050. The annual cost of biomass-based FT-diesel in 2025 is higher than that of NG-based ammonia and methanol and continuously decreases to become lower than that of NG-based ammonia from 2036, that of NG-based methanol from 2039, and that of NG-based ammonia plus CCS from 2049. Biomass-based methanol shows similar trends to biomass-based FT-diesel. However, its cost is always lower than biomass-based FT-diesel in overall ship lifetime and, accordingly, becomes lower than the annual cost of HFO and MGO by 2046. In 2050, the annual fuel cost is arranged in ascending order as follows: LNG (14.98 mUSD), biomass-based methanol (17.39 mUSD), HFO (17.75 mUSD), MGO (17.77 mUSD), biomass-based FT-diesel (18.24 mUSD), NG-based ammonia plus CCS (18.48 mUSD), and e-ammonia (19 mUSD).
The ship life cycle fuel cost for each given scenario was calculated, as shown in Figure 12. E-methanol shows the highest ship life cycle fuel cost, with 748.08 mUSD, followed by e-ammonia at 621.71 mUSD. Fuel production cost for both fuels accounts for a majority of the ship life cycle fuel cost, while carbon price takes a small portion. The third and fourth higher costs were identified for NG-based ammonia and NG-based ammonia plus CCS, respectively. In NG-based ammonia, both fuel production cost and carbon price were high, while in NG-based ammonia plus CCS, the production cost was much higher than the carbon price. This is because large amounts of CO2 were captured and stored in NG-based ammonia plus CCS. Therefore, the carbon price was lowered, and the production cost was increased by adding CCS cost. The lowest ship life cycle fuel cost among the alternative fuels was attained by LNG (284.54 mUSD), followed by NG-based ammonia plus CCS with 438.72 mUSD, which is still 27.58% higher than that of HFO. NG-based methanol was at 439.70 mUSD, followed by biomass-based methanol at 455.56 mUSD. Although the carbon price accounts for approximately 61.8% of the ship life cycle fuel cost of LNG, it is still cost-competitive compared with the other alternative fuels.
Figure 13 represents the NPVs of ship life cycle cost, including the fuel production cost, carbon price, and CAPEX of the ships. Annual fuel production cost and carbon price were converted to present values and summed to CAPEX as in Equation (11). The discount rate that we adopted was 6%, and the CAPEX of each type of ship was determined as described in Section 3.3.2. The NPVs of e-methanol and e-ammonia were 442.50 mUSD and 373.28 mUSD, respectively. For e-methanol and e-ammonia, these values are approximately 2.34 and 1.97 times that of HFO, respectively, showing a similar trend with ship life cycle fuel cost.
Unlike ship life cycle fuel cost, NG-based methanol is more cost-competitive than NG-based ammonia plus CCS, as can be seen in Figure 13. This can be explained by the fact that a large portion of the total carbon price for NG-based methanol is imposed after 2036, which implies that a greater discount for NG-based methanol was applied. Importantly, NG-based methanol is not a sustainable fuel from the perspective of life cycle emissions, as analysed in the previous section.
From the results previously derived, the life cycle cost competitiveness of ships with alternative fuels against fossil-based fuels may not be attained in the carbon price scenario adopted in this study. As part of the sensitivity analysis, we varied carbon price, and its effects on the NPVs of the ships were investigated as can be seen in Figure 14. At a 30% increase in carbon price, the NPV of NG-based ammonia exceeded the NPVs of biodiesel and biomass-based FT-diesel but still held an NPV lower than that of e-fuels. At a 50% increase in carbon price, the NPV of NG-based ammonia plus CCS was lower than that of NG-based methanol. With increasing carbon prices, the NPVs of fossil-based fuels increased more rapidly than the other fuels. At a 200% increase in carbon price, only the NPVs of NG-based ammonia plus CCS and biomass-based methanol approximated to the NPV of LNG, which remained the fuels with the lowest NPV.
The annual fuel costs with varying years at a 50% increase in carbon price from the baseline scenario are illustrated in Figure 15. The results show that the annual fuel cost of e-methanol is lower than that of NG-based methanol from 2042 and is set to become more cost-competitive than HFO and MGO from 2048 and 2049, respectively. E-ammonia will become more cost-competitive than NG-based methanol from 2036 and HFO and MGO from 2042. Eventually, these will become lower than that of LNG and NG-based ammonia plus CCS from 2049. Another finding is that biomass-based methanol shows more cost benefits than NG-based ammonia plus CCS from 2039. The cost of biomass-based FT-diesel continuously descends and finally becomes lower than NG-based ammonia plus CCS and biomass-based methanol in 2043 and 2049, respectively. The annual fuel cost in 2050 can be arranged in descending order as follows: biomass-based FT-diesel, biomass-based methanol, e-ammonia, LNG, NG-based ammonia plus CCS, biodiesel, and e-methanol. Summarizing the above, biomass-based methanol, biomass-based FT-diesel, and NG-based ammonia plus CCS can act as bridge fuels before the transition to e-fuels.

4.3. Case Study

The results in the previous sections show that the annual cost of cleaner fuel is much higher than that of fossil-based fuel before 2035, and then it gradually becomes competitive. This implies that fuel blending is one option that could be used to achieve both CO2-eq emission reductions and cost competitiveness for ships to be ordered in the mid-2020s. To investigate the effect of fuel blending in detail, the following cases were selected: a blend of HFO and biomass-based FT-diesel, a blend of NG-based ammonia and NG-based ammonia plus CCS, and a blend of NG-based methanol and biomass-based methanol. Using these blended fuels gives the advantages of being able to use the existing machinery and fuel system onboard without retrofitting during the ship’s life cycle. Further, the blending of fuels can provide broad options for fuel selection considering carbon price and fuel cost at any given year. E-methanol and e-ammonia were disregarded in the case study, as the annual cost of these fuels at the baseline carbon price scenario was still much higher than that of the other fuels.
As can be seen in Figure 16, first, we assumed the CO2-eq emission limits for the aforementioned fuel blend cases. These limits can be considered as a direct regulation, except for the one for carbon prices, and they reflect the requirement for a fair comparison of the economic benefits of the fuels. The CO2-eq emission limit targets were set in a staggered manner: 90% of CO2-eq of HFO from 2025 to 2029, 80% from 2030 to 2034, 70% from 2035 to 2039, 60% from 2040 to 2044, and 50% from 2045 to 2050, as shown in Figure 16. Then, we built up several fuel blend ratios, meeting the CO2-eq emission limits, and selected the fuel blend ratio with the lowest fuel cost in a ship’s life cycle.
The objective function for the optimization which minimizes the annual fuel cost is defined as follows:
m i n . a n n u a l   f u e l   c o s t = m i n . C f , x , n x + C f , y , n y   a t   ( E M x , n + E M y , n ) < e m i s s i o n   l i m i t
x and y denote a fraction of each fuel, and the sum of x and y equals 1.
Figure 17 shows the blending ratio of each fuel set, which represents the lowest fuel cost meeting the assumed emission limit in the case study. Fractions of NG-based ammonia plus CCS and biomass-based methanol reach 100% from 2031 and 2036, respectively, due to the increase in carbon price of NG-based methanol and ammonia, respectively. Figure 18 shows the amount of annual CO2-eq emission of each fuel set relative to the emission limits.
The annual fuel cost of blended methanol is higher than that of blended oil until 2035, and its cost decreases to become lower than that of the other blended oils around 2040, when 100% biomass-based methanol is used, as can be seen in Figure 19. The cost of blended oil is lower than any other blended fuels until 2035, and the cost converges to similar levels as the other fuels from 2035. For both methanol and ammonia, a 100% blending ratio of NG-based ammonia plus CCS and biomass-based methanol are required from 2031 and 2036, respectively, to meet both the lowest cost and the assumed emissions limit. This is because carbon price sharply increases from 2031 and 2036; thus, using NG-based ammonia plus CCS and biomass-based methanol alone rather than in combination is more competitive from an economic point of view.
The NPVs of the ship life cycle costs for the blended fuels are displayed in Figure 20. The most cost-competitive option from a life cycle perspective involves using blended oil with a ship life cycle cost of 211.92 mUSD, which is 22.43 mUSD more than the cost of HFO. When blended methanol and ammonia are used, the NPVs of ship life cycle cost are approximately 235.58 mUSD and 248.9 mUSD, respectively, NPVs that are 11.17% and 17.45% higher than that in the mixed oil case, respectively. Among the three blended fuel cases, the ammonia case has the lowest carbon price but the highest fuel production cost. If the carbon capture ratio of NG-based ammonia plus CCS (for which a 90% capture rate is assumed) is adjusted, the result could be different.
The results show that using blended ammonia, methanol, and oil could save 9.7, 36.99, and 100.72 mUSD, respectively, compared to using NG-based ammonia plus CCS, biomass-based FT-diesel, and biomass-based methanol alone. None of the fuel blend cases are more cost-competitive than LNG from a life cycle perspective. However, note that LNG cannot meet the CO2-eq emission limit assumed in the case study, as can be seen in Figure 18.
In order to achieve the IMO’s target of reducing total GHG emissions in the shipping sector by 50% by 2050, an estimated cumulative investment of USD 1–1.4 trillion is required between 2030 and 2050. In this scenario, ammonia is projected to constitute 75–99% of the market share. Approximately 87% of this investment was allocated to alternative fuel infrastructure, including production, onshore storage, and bunkering infrastructure [85,86]. Consequently, it is crucial to not only implement a carbon price but also reinvest the revenue from carbon pricing as subsidies. These subsidies would be aimed at stimulating the development of alternative fuel technologies and infrastructure, ultimately leading to a reduction in the cost of alternative fuels.
Summarizing the results in previous sections, several insights can be given, including the following: Firstly, LNG could be a reasonable option for ships ordered in the mid-2020s from a economic perspective, depending on carbon price and the CO2-eq emission limit. Second, as time goes by, e-fuels are getting more cost-competitive and environmentally competitive; however, adopting these fuels for ships ordered in the mid-2020s is not cost effective. Therefore, biofuels or CCS-connected fuels could be an adoptable solution. Third, the blending of fuels, which enables ships to use existing engines, could help meet environmental regulations and lower overall costs. Although it is not discussed in this study, ship can be ordered as ‘ready’ ship such as LNG fuelled ship considering ammonia ready, which can be modified to ammonia fuelled ship in the future.

5. Limitations and Assumptions

There were several limitations and assumptions in this study:
  • Fuel production costs were obtained from several reliable sources. However, the mutual influence between fuels on price was not considered.
  • It is worth noting that as the upper bounds of fuel production cost were utilized, the annual fuel costs for the ships may be over-estimated, and future studies need to consider both lower- and upper-bound scenarios.
  • A decrease in the life cycle emissions of fuels in the future with technological developments was not considered. There are a broad range of uncertainties concerning future life cycle emissions, and therefore, the fuel life cycle emission amounts presented herein are based on current technologies and pathways.
  • Different carbon price scenarios can result in different annual fuel costs. The variability in carbon price is presented in the sensitivity analysis in the Section 4. However, other carbon price scenarios should be further considered. For example, cases where the rates of increase in carbon price are different must be considered.
  • Biofuels were evaluated as the most promising and cost-effective option among several non-fossil fuels. It is expected that the shipping sector, as well as other energy sectors, may see a large demand for biofuels, despite the limited feedstock capacity. Price increases resulting from excess demand were not appropriately considered.
  • The emissions and fuel consumption of engines under development, such as ammonia engines, are subject to uncertainty, so results for life cycle emissions and annual fuel costs may vary.

6. Conclusions

The IMO’s initial GHG strategy and the EU aim at incorporating the shipping sector into the ETS from 2024 through ‘Fit for 55’ and establishing the ‘FuelEU Maritime’ regulation to encourage the use of low/zero-carbon fuels. Reducing greenhouse gas emissions from ships is now a matter of survival for shipping companies. To assist shipowners in complying with environmental regulations in a more commercially feasible manner, we evaluated the Well-to-Wake GHG emissions of nine fuel pathways for four alternative fuels. Annual carbon price was calculated and incorporated into ship life cycle cost. The effects of fuel blending were investigated as part of a case study. The main conclusions of our study are as follows:
  • Our LCA results indicate that biomass-based FT-diesel, e-methanol, and e-ammonia are the most environmentally friendly options, with GHG reductions of 92%, 88.2%, and 86.6%, respectively, from the perspective of GHG emission per kWh of main engine output power.
  • Even though the LCA results show that biomass-based FT-diesel, e-methanol, and e-ammonia are the most environmentally friendly options, our NPV analysis of ship life cycle cost considering carbon price indicated that using those fuels is not cost-effective.
  • In the 50% increased carbon price scenario, the annual fuel costs of ships using e-ammonia becomes more cost-effective than that of HFO and LNG from 2042 and 2049, respectively. In the case of e-methanol with DAC, it is more economical from 2048 compared to that of HFO but still higher than that of LNG. The NPVs of ship life cycle cost using e-ammonia and e-methanol are still much higher than those for HFO and LNG, even at a 200% increase in carbon price.
  • A blend of HFO and biomass-based FT-diesel, a blend of NG-based ammonia and NG-based ammonia plus CCS, a blend of NG-based methanol, and biomass-based methanol were investigated at assumed GHG emission limits. The NPV of ship life cycle cost analysis reflected that using blended ammonia, methanol, and oil could save 9.7, 36.99, and 100.72 mUSD, respectively, compared to using NG-based ammonia plus CCS, biomass-based FT-diesel, and biomass-based methanol alone.
Among the several alternative fuels considered, at present, there is no readily available fuel that can significantly reduce GHG emissions as well as meet cost competitiveness demands. Nevertheless, in the short and mid-term, we consider bio-based fuel and NG-based ammonia with CCS as appropriate options in this context, while in the long term, e-methanol and e-ammonia could be alternative fuel candidates from an economic and environmental point of view. LNG can either be a short- or mid-term option, depending on the carbon price and emission limit. In addition, the blending of fossil-based fuels with green fuels could be an effective option to meet both economic and environmental requirements.
In this study, we conducted comprehensive LCAs and economic analyses of different fuels. Despite the limitations described in Section 5, the results achieved in this study could provide shipowners with insights for selecting commercially and environmentally viable alternative fuels. Further, the framework used in our case study could give shipowners the knowledge required to select fuels which satisfy ambitious environmental regulations in the most cost-effective manner.
In a future study, we will analyse methanol and ammonia by employing a multi-criteria decision analysis approach and considering technical, environmental, economic, and safety aspects. Through this work, we will assist the shipping sector in transitioning to full decarbonization.

Author Contributions

Methodology, H.L., G.R. and H.K.; Software, H.L.; Validation, H.L., J.L. and C.C.; Formal analysis, H.L.; Investigation, G.R.; Resources, S.L.; Data curation, S.L.; Writing—original draft, H.L.; Writing—review & editing, H.L. and J.L.; Visualization, J.L.; Supervision, C.C. and H.K. All authors have read and agreed to the published version of the manuscript.

Funding

This work was supported by the Korea Institute of Energy Technology Evaluation and Planning (KETEP) and the Ministry of Trade, Industry & Energy (MOTIE) of the Republic of Korea (No. 20213030030290 and No. 20213030040460, 20223030030100).

Institutional Review Board Statement

Not applicable.

Informed Consent Statement

Not applicable.

Data Availability Statement

The data presented in this study are available on request from the corresponding author.

Acknowledgments

The authors thank those who participated in this research and contributed their valuable time to support this study.

Conflicts of Interest

The authors declare no conflicts of interest.

References

  1. Faber, J.; Hanayama, S.; Zhang, S.; Pereda, P.; Comer, B.; Hauerhof, E.; van der Loeff, W.S.; Smith, T.; Zhang, Y.; Kosaka, H.; et al. Fourth IMO GHG Study. 2020. Available online: https://www.imo.org/en/OurWork/Environment/Pages/Fourth-IMO-Greenhouse-Gas-Study-2020.aspx (accessed on 7 October 2022).
  2. IMO. Initial IMO Strategy on Reduction of GHG Emissions from Ships. Resolution MEPC.304(72) (adopted on 13 April 2018). Available online: https://wwwcdn.imo.org/localresources/en/KnowledgeCentre/IndexofIMOResolutions/MEPCDocuments/MEPC.304(72).pdf (accessed on 2 October 2023).
  3. Korean Register. Forecasting the Alternative Marine Fuel: Ammonia. 2019. Available online: https://www.krs.co.kr/TECHNICAL_FILE/KR_Forecasting%20the%20Alternative%20Marine%20Fuel_Ammonia.pdf (accessed on 7 October 2023).
  4. Gilbert, P.; Walsh, C.; Traut, M.; Kesieme, U.; Pazouki, K.; Murphy, A. Assessment of full life-cycle air emissions of alternative shipping fuels. J. Clean. Prod. 2018, 172, 855–866. [Google Scholar] [CrossRef]
  5. Bilgili, L. Comparative assessment of alternative marine fuels in life cycle perspective. Renew. Sustain. Energy Rev. 2021, 144, 110985. [Google Scholar] [CrossRef]
  6. Gerlitz, L.; Mildenstrey, E.; Prause, G. Ammonia as clean shipping fuel for the Baltic Sea region. Transp. Telecommun. 2022, 23, 102–112. [Google Scholar] [CrossRef]
  7. Hansson, J.; Månsson, S.; Brynolf, S.; Grahn, M. Alternative marine fuels: Prospects based on multi-criteria decision analysis involving Swedish stakeholders. Biomass Bioenergy 2019, 126, 159–173. [Google Scholar] [CrossRef]
  8. Inal, O.B.; Zincir, B.; Deniz, C. Hydrogen and Ammonia for the Decarbonization of Shipping. In Proceedings of the 5th International Hydrogen Technologies Congress (IHTEC-2021), Niğde, Turkey, 26–28 May 2021; pp. 26–28. Available online: https://www.researchgate.net/publication/351972036_Hydrogen_and_Ammonia_for_the_Decarbonization_of_Shipping (accessed on 7 October 2023).
  9. Zincir, B. Environmental and economic evaluation of ammonia as a fuel for short-sea shipping: A case study. Int. J. Hydrogen Energy 2022, 47, 18148–18168. [Google Scholar] [CrossRef]
  10. Brynolf, S.; Fridell, E.; Andersson, K. Environmental assessment of marine fuels: Liquefied natural gas, liquefied biogas, methanol and bio-methanol. J. Clean. Prod. 2014, 74, 86–95. [Google Scholar] [CrossRef]
  11. Xing, H.; Stuart, C.; Spence, S.; Chen, H. Alternative fuel options for low carbon maritime transportation: Pathways to 2050. J. Clean. Prod. 2021, 297, 126651. [Google Scholar] [CrossRef]
  12. IMO. IMO Action to Reduce Greenhouse Gas Emissions from International Shipping. 2019. Available online: https://www4.unfccc.int/sites/SubmissionsStaging/Documents/201911261754---IMO%20submission%20to%20SBSTA%2051_with%20annex.pdf (accessed on 7 October 2023).
  13. ISO14040; Environmental Management—Life Cycle Assessment—Principles and Framework. ISO: Geneva, Switzerland, 2006.
  14. Al-Douri, A.; Alsuhaibani, A.S.; Moore, M.; Nielsen, R.B.; El-Baz, A.A.; El-Halwagi, M.M. Greenhouse gases emissions in liquified natural gas as a marine fuel: Life cycle analysis and reduction potential. Can. J. Chem. Eng. 2022, 100, 1178–1186. [Google Scholar] [CrossRef]
  15. Report of the Marine Environment Protection Committee on Its Seventy-Sixth Session; IMO: London, UK, 2021.
  16. Hwang, S.S.; Gil, S.J.; Lee, G.N.; Lee, J.W.; Park, H.; Jung, K.H.; Suh, S.B. Life cycle assessment of alternative ship fuels for coastal ferry operating in Republic of Korea. J. Mar. Sci. Eng. 2020, 8, 660. [Google Scholar] [CrossRef]
  17. Acciaro, M.; Nair, A. Alternative fuels for shipping: Optimising fleet composition under environmental and economic constraints. Int. J. Transp. Econ. 2018, 45, 439–460. [Google Scholar] [CrossRef]
  18. Financial Times. Shipping Heavyweight Japan Tables Carbon Tax Proposal for the Industry. 2022. Available online: https://www.ft.com/content/ae5893a1-4a7e-4152-8fb2-65679ebc73c4 (accessed on 7 October 2022).
  19. IMO. ISWG-GHG 12: Reducing GHG Emissions from Ships. 2022. Available online: https://www.imo.org/en/MediaCentre/PressBriefings/pages/ISWGHGMay2022.aspx (accessed on 7 October 2022).
  20. Schroer, M.; Panagakos, G.; Barfod, M.B. Implications of the emission-related policy environment on existing containerships. In Proceedings of the 7th World Maritime Technology Conference 2022, København, Denmark, 26–28 April 2022. [Google Scholar]
  21. Christodoulou, A.; Dalaklis, D.; Ölçer, A.I.; Ghaforian Masodzadeh, P. Inclusion of shipping in the EU-ETS: Assessing the direct costs for the maritime sector using the MRV data. Energies 2021, 14, 3915. [Google Scholar] [CrossRef]
  22. Poseidon Principles. Poseidon Principles: A global framework for responsible ship finance. Copenhagen 2019, 18, 2020. Available online: https://www.poseidonprinciples.org/finance/#home (accessed on 7 October 2022).
  23. EMSA. Guidance on LNG Bunkering to Port Authorities and Administrations; European Maritime Safety Agency: Lisboa, Portugal, 2018; Available online: https://www.emsa.europa.eu/newsroom/latest-news/download/5104/3207/23.html (accessed on 7 October 2022).
  24. Schuller, O.; Kupferschmid, S.; Hengstler, J.; Whitehouse, S. 2nd Life Cycle GHG Emission Study on the Use of LNG as Marine Fuel. 2021. Available online: https://safety4sea.com/wp-content/uploads/2021/04/SEA-LNG-SGMF-2nd-GHG-Analysis-of-LNG-2021_04.pdf (accessed on 7 October 2023).
  25. Kim, K.; Roh, G.; Kim, W.; Chun, K. A preliminary study on an alternative ship propulsion system fueled by ammonia: Environmental and economic assessments. J. Mar. Sci. Eng. 2020, 8, 183. [Google Scholar] [CrossRef]
  26. Kolosz, B.W.; Luo, Y.; Xu, B.; Maroto-Valer, M.M.; Andresen, J.M. Life cycle environmental analysis of ‘drop in’ alternative aviation fuels: A review. Sustain. Energy Fuels 2020, 4, 3229–3263. [Google Scholar] [CrossRef]
  27. Al-Aboosi, F.Y.; El-Halwagi, M.M.; Moore, M.; Nielsen, R.B. Renewable ammonia as an alternative fuel for the shipping industry. Curr. Opin. Chem. Eng. 2021, 31, 100670. [Google Scholar] [CrossRef]
  28. Yugo, M.; Soler, A. A look into the role of e-fuels in the transport system in Europe (2030–2050). CONCAWE Rev. 2019, 28, 4–22. [Google Scholar]
  29. Korberg, A.D.; Brynolf, S.; Grahn, M.; Skov, I.R. Techno-economic assessment of advanced fuels and propulsion systems in future fossil-free ships. Renew. Sustain. Energy Rev. 2021, 142, 110861. [Google Scholar] [CrossRef]
  30. MAN Energy Solution. MAN B&W Two-Stroke Engine Operating on Ammonia. 2020. Available online: https://www.man-es.com/docs/default-source/document-sync/man-b-w-two-stroke-engine-operating-on-ammonia-eng.pdf?sfvrsn=c4bb6fea_1 (accessed on 7 October 2022).
  31. Wärtsilä. Wärtsilä Advances Future Fuel Capabilities with First Ammonia Tests. 2020. Available online: https://www.wartsila.com/media/news/25-03-2020-wartsila-advances-future-fuel-capabilities-with-first-ammonia-tests-2670619 (accessed on 7 October 2022).
  32. Seo, Y.; Han, S. Economic evaluation of an ammonia-fueled ammonia carrier depending on methods of ammonia fuel storage. Energies 2021, 14, 8326. [Google Scholar] [CrossRef]
  33. Yadav, A.; Jeong, B. Safety evaluation of using ammonia as marine fuel by analysing gas dispersion in a ship engine room using CFD. J. Int. Marit. Saf. Environ. Aff. Ship. 2022, 6, 99–116. [Google Scholar] [CrossRef]
  34. Korean Register. Guidelines for Ships Using Ammonia as Fuels. 2022. Available online: https://www.krs.co.kr/Repository/Site_Image/%EB%8B%A4%EC%9A%B4%EB%A1%9C%EB%93%9C%ED%8C%8C%EC%9D%BC-%EC%98%81%EC%A4%911.%20Guidelines%20for%20%20Ships%20Using%20Ammonia%20as%20Fuels.pdf (accessed on 7 October 2022).
  35. McKinlay, C.J.; Turnock, S.; Hudson, D. A Comparison of Hydrogen and Ammonia for Future Long Distance Shipping Fuels. In Proceedings of the International Conference on LNG/LPG and Alternative Fuel Ships 2020, London, UK, 29–30 January 2020. [Google Scholar]
  36. Korean Register. Ammonia Outlook: Report Setting Course for a Zero-Carbon Marine Fuel. 2022. Available online: https://www.krs.co.kr/eng/Brochure/ListView.aspx?MRID=559&URID=908# (accessed on 15 May 2023).
  37. Maersk, A.P. Moller—Maersk Accelerates Fleet Decarbonisation with 8 Large Ocean-Going Vessels to Operate on Carbon Neutral Methanol. 2021. Available online: https://www.maersk.com/news/articles/2021/08/24/maersk-accelerates-fleet-decarbonisation (accessed on 7 October 2022).
  38. CLARKSON. Fuelling Transition: Tracking the Economic Impact of Emission Reductions & Fuel Changes—April 2022 Update (No. 7). 2022. Available online: https://www.clarksons.net (accessed on 7 October 2022).
  39. de Fournas, N.; Wei, M. Techno-economic assessment of renewable methanol from biomass gasification and PEM electrolysis for decarbonization of the maritime sector in California. Energy Convers. Manag. 2022, 257, 115440. [Google Scholar] [CrossRef]
  40. Wissner, N.; Healy, S.; Cames, M.; Sutter, J. Methanol as a Marine Fuel. 2023. Available online: https://safety4sea.com/wp-content/uploads/2023/03/NABU-methanol-study-2023_03.pdf (accessed on 15 May 2023).
  41. MAN Diesel & Turbo. Using Methanol Fuel in the MAN B&W ME-LGI Series. 2014. Available online: https://www.mandieselturbo.com/docs/default-source/shopwaredocuments/using-methanol-fuel-in-the-man-b-w-me-lgi-series.pdf (accessed on 7 October 2022).
  42. Mukherjee, A.; Bruijnincx, P.; Junginger, M. A perspective on biofuels use and CCS for GHG mitigation in the marine sector. Iscience 2020, 23, 101758. [Google Scholar] [CrossRef]
  43. Hsieh, C.-W.C.; Felby, C. Biofuels for the Marine Shipping Sector. 2017. Available online: https://www.ieabioenergy.com/wp-content/uploads/2018/02/Marine-biofuel-report-final-Oct-2017.pdf (accessed on 7 October 2022).
  44. Noor, C.M.; Noor, M.M.; Mamat, R. Biodiesel as alternative fuel for marine diesel engine applications: A review. Renew. Sustain. Energy Rev. 2018, 94, 127–142. [Google Scholar] [CrossRef]
  45. Taylor, J.; Bonello, J.; Baresic, D.; Smith, T. Future Maritime Fuels in the United States-the Options and Their Potential Pathways. 2022. Available online: https://oceanconservancy.org/wp-content/uploads/2022/04/oc_fuels_final_report_20220117.pdf (accessed on 7 October 2022).
  46. Ampah, J.D.; Yusuf, A.A.; Afrane, S.; Jin, C.; Liu, H. Reviewing two decades of cleaner alternative marine fuels: Towards IMO’s decarbonization of the maritime transport sector. J. Clean. Prod. 2021, 320, 128871. [Google Scholar] [CrossRef]
  47. AspenTech. Aspen HYSYS. 2022. Available online: http://www.aspentech.com (accessed on 7 October 2022).
  48. GREET. The Greenhouse Gases, Regulated Emissions, and Energy Use in Technologies (GREET) Model; Argonne National Laboratory: Lemont, IL, USA, 2021. Available online: https://greet.es.anl.gov/ (accessed on 7 March 2021).
  49. Hwang, S.; Jeong, B.; Jung, K.; Kim, M.; Zhou, P. Life cycle assessment of LNG fuelled vessel in domestic services. J. Mar. Sci. Eng. 2019, 7, 359. [Google Scholar] [CrossRef]
  50. Schuller, O.; Kupferschmid, S.; Hengstler, J.; Whitehouse, S. Life Cycle GHG Emission Study on the Use of LNG as Marine Fuel; Thinkstep: Stuttgart, Germany, 2019; Available online: https://sustainableworldports.org/wp-content/uploads/thinkstep_2019_Life-cycle-GHG-emission-study-on-LNG-Final-report-report.pdf (accessed on 7 October 2022).
  51. Perčić, M.; Vladimir, N.; Fan, A. Techno-economic assessment of alternative marine fuels for inland shipping in Croatia. Renew. Sustain. Energy Rev. 2021, 148, 111363. [Google Scholar] [CrossRef]
  52. Kanchiralla, F.M.; Brynolf, S.; Malmgren, E.; Hansson, J.; Grahn, M. Life-cycle assessment and costing of fuels and propulsion systems in future fossil-free shipping. Environ. Sci. Technol. 2022, 56, 12517–12531. [Google Scholar] [CrossRef]
  53. Lindstad, E.; Lagemann, B.; Rialland, A.; Gamlem, G.M.; Valland, A. Reduction of maritime GHG emissions and the potential role of E-fuels. Transp. Res. D 2021, 101, 103075. [Google Scholar] [CrossRef]
  54. Wang, H.; Boulougouris, E.; Theotokatos, G.; Zhou, P.; Priftis, A.; Shi, G. Life cycle analysis and cost assessment of a battery powered ferry. Ocean Eng. 2021, 241, 110029. [Google Scholar] [CrossRef]
  55. Perčić, M.; Vladimir, N.; Fan, A. Life-cycle cost assessment of alternative marine fuels to reduce the carbon footprint in short-sea shipping: A case study of Croatia. Appl. Energy 2020, 279, 115848. [Google Scholar] [CrossRef]
  56. Bicer, Y.; Dincer, I. Clean fuel options with hydrogen for sea transportation: A life cycle approach. Int. J. Hydrogen Energy 2018, 43, 1179–1193. [Google Scholar] [CrossRef]
  57. Bicer, Y.; Dincer, I. Environmental impact categories of hydrogen and ammonia driven transoceanic maritime vehicles: A comparative evaluation. Int. J. Hydrogen Energy 2018, 43, 4583–4596. [Google Scholar] [CrossRef]
  58. De Jong, S.; Antonissen, K.; Hoefnagels, R.; Lonza, L.; Wang, M.; Faaij, A.; Junginger, M. Life-cycle analysis of greenhouse gas emissions from renewable jet fuel production. Biotechnol. Biofuels 2017, 10, 64. [Google Scholar] [CrossRef]
  59. Myhre, G.; Shindell, D.; Bréon, F.-M.; Collins, W.; Fuglestvedt, J.; Huang, J.; Koch, D.; Lamarque, J.-F.; Lee, D.; Mendoza, B.; et al. Anthropogenic and Natural Radiative Forcing. In Climate Change 2013: The Physical Science Basis. Contribution of Working Group I to the Fifth Assessment Report of the Intergovernmental Panel on Climate Change; Stocker, T.F., Qin, D., Plattner, G.-K., Tignor, M., Allen, S.K., Boschung, J., Nauels, A., Xia, Y., Bex, V., Midgley, P.M., Eds.; Cambridge University Press: Cambridge, UK; New York, NY, USA, 2013. [Google Scholar]
  60. Comer, B.; Osipova, L. Accounting for Well-to-Wake Carbon Dioxide Equivalent Emissions in Maritime Transportation Climate Policies. 2021. Available online: https://theicct.org/sites/default/files/publications/Well-to-wake-co2-mar2021-2.pdf (accessed on 7 October 2022).
  61. Pavlenko, N.; Comer, B.; Zhou, Y.; Clark, N.; Rutherford, D. The Climate Implications of Using LNG as a Marine Fuel. 2020. Available online: https://theicct.org/sites/default/files/publications/Climate_implications_LNG_marinefuel_01282020.pdf (accessed on 7 October 2022).
  62. dos Santos, R.G.; Alencar, A.C. Biomass-derived syngas production via gasification process and its catalytic conversion into fuels by Fischer Tropsch synthesis: A review. Int. J. Hydrogen Energy 2020, 45, 18114–18132. [Google Scholar] [CrossRef]
  63. Tyrovola, T.; Dodos, G.; Kalligeros, S.; Zannikos, F. The introduction of biofuels in marine sector. J. Environ. Sci. Eng. A 2017, 6, 415–421. [Google Scholar] [CrossRef]
  64. Palo, D.R.; Dagle, R.A.; Holladay, J.D. Methanol Steam Reforming for Hydrogen Production. Chem. Rev. 2007, 107, 3992–4021. [Google Scholar] [CrossRef]
  65. Glushkov, D.; Nyashina, G.; Shvets, A.; Pereira, A.; Ramanathan, A. Current status of the pyrolysis and gasification mechanism of biomass. Energies 2021, 14, 7541. [Google Scholar] [CrossRef]
  66. Zang, G.; Sun, P.; Elgowainy, A.; Wang, M. Technoeconomic and life cycle analysis of synthetic methanol production from hydrogen and industrial by-product CO2. Environ. Sci. Technol. 2021, 55, 5248–5257. [Google Scholar] [CrossRef]
  67. Boero, A.; Kardux, K.; Kovaleva, M.; Salas, D.; Energies, J.M. Environmental Life Cycle Assessment of Ammonia-Based Electricity. Energies. 2021, 14, p. 6721. Available online: https://www.mdpi.com/1996-1073/14/20/6721 (accessed on 5 February 2024).
  68. IEAGHG. Techno—Economic evaluation of SMR Based Standalone (merchant) hydrogen plant with CCS. Technol. Rev. 2017, 2, 2017-02. Available online: https://ieaghg.org/exco_docs/2017-02.pdf (accessed on 7 October 2022).
  69. Bicer, Y.; Dincer, I.; Zamfirescu, C.; Vezina, G.; Raso, F. Comparative life cycle assessment of various ammonia production methods. J. Clean. Prod. 2016, 135, 1379–1395. [Google Scholar] [CrossRef]
  70. CLARKSON. World Fleet Register. 2022. Available online: https://www.clarksons.net/WFR (accessed on 7 October 2022).
  71. Inal, O.B.; Zincir, B.; Deniz, C. Investigation on the decarbonization of shipping: An approach to hydrogen and ammonia. Int. J. Hydrogen Energy 2022, 47, 19888–19900. [Google Scholar] [CrossRef]
  72. Valera-Medina, A.; Banares-Alcantara, R. Techno-Economic Challenges of Green Ammonia as an Energy Vector; Academic Press: Cambridge, MA, USA, 2020. [Google Scholar]
  73. Belloni, A. Industrial Gases Processing; John Wiley & Sons: Hoboken, NJ, USA, 2008. [Google Scholar] [CrossRef]
  74. Liu, X.; Elgowainy, A.; Wang, M. Life cycle energy use and greenhouse gas emissions of ammonia production from renewable resources and industrial by-products. Green Chem. 2020, 22, 5751–5761. [Google Scholar] [CrossRef]
  75. MAN Energy Solution. Costs and Benefits Alternative Fuels for an LR1 Product Tanker. 2018. Available online: https://www.man-es.com/docs/default-source/document-sync/costs-and-benefits-alternative-fuels-for-an-lr1-product-tanker-key-results-from-a-dnv-gl-and-energy-solutions-joint-study-eng.pdf?sfvrsn=aecadd7d_1 (accessed on 7 October 2022).
  76. Minnehan, J.J.; Pratt, J.W. Practical Application Limits of Fuel Cells and Batteries for Zero Emission Vessels. 2017. Available online: https://energy.sandia.gov/wp-content/uploads/2017/12/SAND2017-12665.pdf (accessed on 7 October 2022).
  77. Theocharis, D.; Rodrigues, V.S.; Pettit, S.; Haider, J. Feasibility of the Northern Sea Route: The Role of Distance, Fuel Prices, Ice Breaking Fees and Ship Size for the Product Tanker Market. Transp. Res. Part E Logist. Trans. 2019, 129, 111–135. [Google Scholar] [CrossRef]
  78. Maersk Mc-Kinney Møller Center. Industry Transition Strategy. 2021. Available online: https://cms.zerocarbonshipping.com/media/uploads/documents/MMMCZCS_Industry-Transition-Strategy_Oct_2021.pdf (accessed on 7 October 2022).
  79. Brown, A.; Waldheim, L.; Landälv, I.; Saddler, J.; Mahmood, E.; McMillan, J.D.; Bonomi, A.; Klein, B. Advanced Biofuels—Potential for Cost Reduction. 2020. Available online: https://www.ieabioenergy.com/wp-content/uploads/2020/02/T41_CostReductionBiofuels-11_02_19-final.pdf (accessed on 7 October 2022).
  80. IRENA. A Pathway to Decarbonise the Shipping Sector by 2050; International Renewable Energy Agency: Abu Dhabi, United Arab Emirates, 2021; Available online: https://www.irena.org/-/media/Files/IRENA/Agency/Publication/2021/Oct/IRENA_Decarbonising_Shipping_2021.pdf (accessed on 7 October 2022).
  81. IRENA; Methanol Institute. Innovation Outlook: Renewable Methanol; International Renewable Energy Agency: Abu Dhabi, United Arab Emirates, 2021; Available online: https://www.irena.org/-/media/Files/IRENA/Agency/Publication/2021/Jan/IRENA_Innovation_Renewable_Methanol_2021.pdf (accessed on 7 October 2022).
  82. IRENA; AEA. Innovation Outlook: Renewable Ammonia; International Renewable Energy Agency: Abu Dhabi, United Arab Emirates; Ammonia Energy Association: New York, NY, USA, 2022; Available online: https://www.irena.org/-/media/Files/IRENA/Agency/Publication/2022/May/IRENA_Innovation_Outlook_Ammonia_2022.pdf (accessed on 7 October 2022).
  83. IEA. The Future of Hydrogen. 2019. Available online: https://iea.blob.core.windows.net/assets/9e3a3493-b9a6-4b7d-b499-7ca48e357561/The_Future_of_Hydrogen.pdf (accessed on 7 October 2022).
  84. Maersk Mc-Kinney Møller Center. Position Paper Fuel Option Scenarios. 2021. Available online: https://cms.zerocarbonshipping.com/media/uploads/documents/Fuel-Options-Position-Paper_Oct-2021_final_2022-06-07-102920_edoy.pdf (accessed on 7 October 2022).
  85. Baresic, D.; Rojon, I.; Shaw, A.; Rehmatulla, N. Closing the Gap: An Overview of the Policy Options to Close the Competitiveness Gap and Enable an Equitable Zero-Emission Fuel Transition in Shipping. Prepared by UMAS, January 2022. London. 2022. Available online: https://www.globalmaritimeforum.org/content/2021/12/Closing-the-Gap_Getting-to-Zero-Coalition-report.pdf (accessed on 7 October 2022).
  86. Carlo, R.; Marc, B.J.; de la Fuente Santiago, S.; Smith, T.; Søgaard, K. Aggregate Investment for the Decarbonisation of the Shipping Industry; UMAS: London, UK, 2020; Available online: https://www.globalmaritimeforum.org/content/2020/01/Aggregate-investment-for-the-decarbonisation-of-the-shipping-industry.pdf (accessed on 15 May 2023).
Figure 1. Measures to reduce carbon intensity [12].
Sustainability 16 02114 g001
Figure 2. Frameworks of analysis.
Sustainability 16 02114 g002
Figure 3. Fuel pathways.
Sustainability 16 02114 g003
Figure 4. Route of reference ship.
Sustainability 16 02114 g004
Figure 5. Fuel prices.
Sustainability 16 02114 g005
Figure 6. Carbon price scenario.
Sustainability 16 02114 g006
Figure 7. Life cycle GHG emissions per kWh of main engine output power.
Sustainability 16 02114 g007
Figure 8. Life cycle GHG emissions per kWh of auxiliary engine output power.
Sustainability 16 02114 g008
Figure 9. Energy flow of each fuel pathway for main engine case including pilot fuel, MJ.
Sustainability 16 02114 g009
Figure 10. Annual carbon prices of reference ship.
Sustainability 16 02114 g010
Figure 11. Annual ship fuel costs including carbon price. (Circle represents major crossover points).
Sustainability 16 02114 g011
Figure 12. Ship life cycle fuel costs including carbon price.
Sustainability 16 02114 g012
Figure 13. NPVs of ship life cycle costs including carbon price.
Sustainability 16 02114 g013
Figure 14. Variation in NPV with increasing carbon price.
Sustainability 16 02114 g014
Figure 15. Annual fuel cost at 50% increased carbon price. (Circle represents major crossover points).
Sustainability 16 02114 g015
Figure 16. Framework of the case study.
Sustainability 16 02114 g016
Figure 17. Blending ratio of each fuel set.
Sustainability 16 02114 g017
Figure 18. Annual CO2-eq emissions at selected fuel blending ratios.
Sustainability 16 02114 g018
Figure 19. Annual fuel cost of each fuel set at selected fuel blending ratios.
Sustainability 16 02114 g019
Figure 20. NPVs of ship life cycle cost for blended fuels.
Sustainability 16 02114 g020
Table 4. Assumed specific fuel consumption of marine engines (g/kWh).
Fuel TypeEngine TypeSpecific Fuel ConsumptionReference
Main FuelPilot Fuel (HFO)
HFOMain engine184.8-[50]
Auxiliary engine197.5-
MGOMain engine174-
Auxiliary engine184.7-
LNGMain engine141.36.4
Auxiliary engine156.52.8
MethanolMain engine330.511.73Assumed value
Auxiliary engine397.212.62Assumed value
AmmoniaMain engine37811.9Assumed value
Auxiliary engine450.112.75Assumed value
Table 5. Engine emission factors, g/kWh [48,60].
ParameterHFOMGOLNGBio-FT-DieselBiodieselMethanolAmmonia
Main engineCH40.012 0.012 0.200 0.012 0.012 0.012 0.003
N2O0.031 0.031 0.030 0.031 0.031 0.031 0.008
CO2584.1547.8 384.4 453.9 472.1 450.3 0.000
Aux. engineCH40.008 0.008 5.500 0.008 0.008 0.008 0.003
N2O0.036 0.036 0.015 0.036 0.036 0.036 0.008
CO2625.6 582.8411.6 560.2 582.6 543.3 0.000
Table 6. Specification of the reference ship: LR1 tanker.
CategoryValue
Length, O.A.225 m
Breadth, Mld.32.26 m
Scantling draught14.2 m
DWT75,000 ton
Specified maximum continuous rating (MCR)11,500 kW
Design speed15 knots
Auxiliary engines3 × 944 kW
Table 7. CAPEX ratios relative to the HFO-fuelled ship.
ParameterHFO Fuelled ShipLNG Fuelled
Ship
Methanol Fuelled ShipAmmonia Fuelled Ship
Newbuilding cost ratio11.141.091.10
Compatible fuelsHFO, MGO Biodiesel, FT-dieselLNGBiomass-based methanol,
NG-based methanol,
e-methanol
E-ammonia,
NG-based ammonia with or without CCS
Table 8. Fuel production costs in USD/GJ and data sources.
ParameterLowHighSourceValues Adopted
in This Study
202520502025205020252050
HFO (0.1% sulphur)-----10.9 b10.6 b
MGO (0.1% sulphur)-----12.26 b11.96 b
LNG-----8.2 b8.8 b
Biomass-based FT-diesel21.87 a16.33 a42.00 a32.67 a[79]42.0032.67
Biodiesel23.04 a19.25 a40.54 a34.70 a[79]40.5434.70
NG-based methanol 5.47-16.92-[81]14.9315.87
Biomass-based methanol18.03 a12.25 a32.67 a27.42 a[79]32.6727.42
E-methanol c37.77 29.72 72.0040.28[80]72.0040.28
NG-based ammonia 5.38-16.13-[82]16.1317.14
E-ammonia c35.0018.6153.8931.67[80]53.8831.67
NG-based ammonia plus CCS-----25.4326.44
a: Production costs which consider mid-term cost improvements and the impacts of reduced finance costs, from reference [79], are considered as 2050 production costs. The current cost in reference [79] was adopted as the 2025 production cost. b: Prices adopted from reference [84]. c: These values were extracted from graphs in reference [81].
Disclaimer/Publisher’s Note: The statements, opinions and data contained in all publications are solely those of the individual author(s) and contributor(s) and not of MDPI and/or the editor(s). MDPI and/or the editor(s) disclaim responsibility for any injury to people or property resulting from any ideas, methods, instructions or products referred to in the content.

