
Evaluating Fuel Cell vs. Battery Electric Trucks: Economic Perspectives in Alignment with China’s Carbon Neutrality Target


1
State Key Laboratory of Automotive Safety and Energy, Tsinghua University, Beijing 100084, China
2
Tsinghua Automotive Strategy Research Institute, Tsinghua University, Beijing 100084, China
*
Author to whom correspondence should be addressed.
Sustainability 2024, 16(6), 2427; https://doi.org/10.3390/su16062427
Submission received: 18 January 2024
/
Revised: 4 March 2024
/
Accepted: 11 March 2024
/
Published: 14 March 2024
Abstract
:The electrification of heavy-duty trucks stands as a critical and challenging cornerstone in the low-carbon transition of the transportation sector. This paper employs the total cost of ownership (TCO) as the economic evaluation metric, framed within the context of China’s ambitious goals for heavy truck electrification by 2035. A detailed TCO model is developed, encompassing not only the vehicles but also their related energy replenishing infrastructures. This comprehensive approach enables a sophisticated examination of the economic feasibility for different deployment contexts of both fuel cell and battery electric heavy-duty trucks, emphasizing renewable energy utilization. This study demonstrates that in the context where both fuel cell components and hydrogen energy are costly, fuel cell trucks (FCTs) exhibit a significantly higher TCO compared to battery electric trucks (BETs). Specifically, for a 16 ton truck with a 500 km range, the TCO for the FCT is 0.034 USD/tkm, representing a 122% increase over its BET counterpart. In the case of a 49 ton truck designed for a 1000 km range, the TCO for the FCT is 0.024 USD/tkm, marking a 36% premium compared to the BET model. The technological roadmap suggests a narrowing cost disparity between FCTs and BETs by 2035. For the aforementioned 16 ton truck model, the projected TCO for the FCT is expected to be 0.016 USD/tkm, which is 58% above the BET, and for the 49 ton variant, it is anticipated at 0.012 USD per ton-kilometer, narrowing the difference to just 4.5% relative to BET. Further analysis within this study on the influences of renewable energy pricing and operational range on FCT and BET costs highlights a pivotal finding: for the 49 ton truck, achieving TCO parity between FCTs and BETs is feasible when renewable energy electricity prices fall to 0.022 USD/kWh or when the operational range extends to 1890 km. This underscores the critical role of energy costs and efficiency in bridging the cost gap between FCTs and BETs.
1. Introduction
China announced its carbon emission targets, aiming to achieve “carbon peak” and “carbon neutrality” by 2030 and 2060, respectively. To fulfill these “dual carbon” objectives, while also taking into account the bottom-up potential for emission reductions, the Society of Automotive Engineers of China proposed a three-phased development strategy for the automotive industry’s carbon emission reduction: reaching a carbon peak by 2028, achieving near-zero emissions by 2050, and attaining carbon neutrality by 2060 [1]. In the process of realizing carbon neutrality within the automotive sector, the reduction in carbon emissions from heavy-duty trucks represents one of the most challenging aspects. In China, despite HDTs comprising a mere 3% of the total vehicle population, they contribute to a disproportionate 35% of greenhouse gas (GHG) emissions across all vehicle categories [2]. This trend is similarly observed in the United States and Europe, where HDTs are responsible for approximately one-quarter of the transportation sector’s GHG emissions, despite their relatively low prevalence [3,4]. Consequently, numerous countries have introduced stringent regulations targeting fuel consumption and emissions in heavy-duty vehicles. Faced with these regulatory challenges, the viability of traditional internal combustion engine (ICE) heavy-duty trucks is increasingly questioned [5]. This has paved the way for the emergence and market adoption of new energy heavy-duty trucks. The electrification of HDTs therefore plays a pivotal role in facilitating the low-carbon transformation within the transportation sector [6]. Specifically, in the realm of long-haul heavy freight transportation, fuel cell technology for heavy-duty vehicles is gaining recognition as a viable alternative, matching the performance of traditional ICE vehicles. This is primarily attributed to the longer driving ranges and shorter refueling times of fuel cell vehicles.
However, the fuel cell truck (FCT) is not the only alternative under consideration. The market is also witnessing a growing interest in battery electric trucks (BETs). Owing to a later start in technological development and the absence of large-scale commercialization, fuel cell-related components confront substantial cost challenges. In contrast, the recent advancements in traction battery technology, along with its extensive application in passenger cars, have rendered the battery electric approach more economically feasible. Nevertheless, BETs face their own set of challenges. These include the necessity for larger batteries to meet the high energy demands of heavy-duty vehicles, which in turn reduces cargo capacity and prolongs charging times, posing practical impediments for their deployment.
The total cost of ownership (TCO) remains a pivotal factor influencing consumer decisions between fuel cell trucks and battery electric trucks [6]. To determine the economic viability of heavy-duty truck electrification, numerous studies have focused on the TCO of both battery electric and fuel cell heavy-duty trucks. Table 1 summarizes the existing TCO research of HDTs.
Existing studies suggested that BETs were poised to achieve TCO parity with diesel trucks within this decade, supported by scholarly forecasts and empirical studies [17,18,19,20]. Policy interventions, including toll exemptions and purchase subsidies, had already rendered BET cost-competitive with their ICE counterparts [10]. The National Renewable Energy Laboratory (NREL) in the US projected that both BETs and FCTs would attain cost parity with conventional diesel vehicles in heavy-duty segments by 2035, independent of incentives [7]. However, FCTs were anticipated to achieve this milestone slightly later than BETs. Burke et al. [8] conducted an economic analysis predicting TCO competitiveness for most BEVs by 2025 and parity between both BETs and FCTs by 2030. Basma et al. [9] extended this analysis to Class 8 tractor-trailers, forecasting a more favorable TCO for battery electric long-haul trucks by 2030, while FCTs might achieve parity only after 2040. This trend was consistent in European and Chinese markets, with battery electric trucks emerging as the most cost-effective decarbonization strategy before 2030, unlike hydrogen fuel cell trucks which may lag in economic performance until 2040. Basma and Rodríguez [11] concluded that in Europe, battery electric trucks are likely to be the most cost-effective decarbonization pathway, potentially enabling an economically viable transition from diesel trucks before 2030. Mao et al. [14] examined the TCO of heavy-duty new energy vehicles in China, indicating that all BET segments could achieve TCO parity with diesel trucks by the latter half of the decade, while FCTs might approach parity by the decade’s end, hindered by slower advancements in fuel cell stack manufacturing and higher energy costs.
Notably, these studies often based their conclusions on current high hydrogen prices. Basma et al. [12] concluded that fuel cell long-haul trucks could achieve TCO parity with diesel trucks by 2030 in Europe, provided the at-the-pump green hydrogen fuel price is around 4 EUR/kg. Ballard [21] indicated that while currently more expensive to operate than battery electric and internal combustion commercial vehicles, fuel cell electric vehicles are expected to become much more cost-effective when manufacturing technology matures, economies of scale improve, hydrogen fuel costs decline, and infrastructure develops. This was also echoed by Wang et al. [15] and Fiquet et al. [22], who suggested that with reduced hydrogen fuel costs, FCEVs could become a more economically viable option. However, at current high hydrogen energy prices, FCEVs lack economic advantages [23,24,25,26].
The economic advantage of BETs was contingent upon optimal battery capacity, as oversized batteries could weaken cost advantages. Additionally, the inconvenience of charging BETs contributed to their hidden operational costs [27]. Various charging strategies, including fast charging and battery swapping, were being explored to address these challenges. Wang et al. [28] analyzed different charging modes for battery HDVs, revealing that swap charging, despite being efficient in energy supplementation, was not profitable below a certain price threshold. Zhu et al. [29] investigated the economic competitiveness of various energy supply modes for electric heavy-duty trucks. The study found that while supercharge mode was economical for short distances, battery swapping was more suitable for medium distances, and fast charging was preferable for longer distances.
Hunter et al. [30] evaluated the TCO for different truck types across various time frames, concluding that the economic feasibility of each powertrain technology is contingent on specific business operating conditions and fuel prices. Wang et al. [13] indicated that BETs were nearing market competitiveness for short-haul trips, while FCTs might be more suitable for long-haul applications due to longer range and quicker refueling times.
In conclusion, while TCO evaluations of FCTs and BETs are influenced by diverse assumptions and conditions, they often do not consider the broader application contexts in heavy-duty vehicle operations. To address the gaps in existing research regarding the direct analysis of factors affecting the TCO, this study develops a model that incorporates specialized sub-models for both vehicles and energy replenishing stations applicable across different powertrain types. A comprehensive analysis of different weight classes and operating ranges in the Chinese market, comparing fuel cell and electric power systems, and including renewable energy-based hydrogenation, charging, and battery swapping, would offer a more nuanced understanding of the cost reduction potential for these technologies in heavy-duty vehicular applications.
2. Methods and Data
2.1. Framework
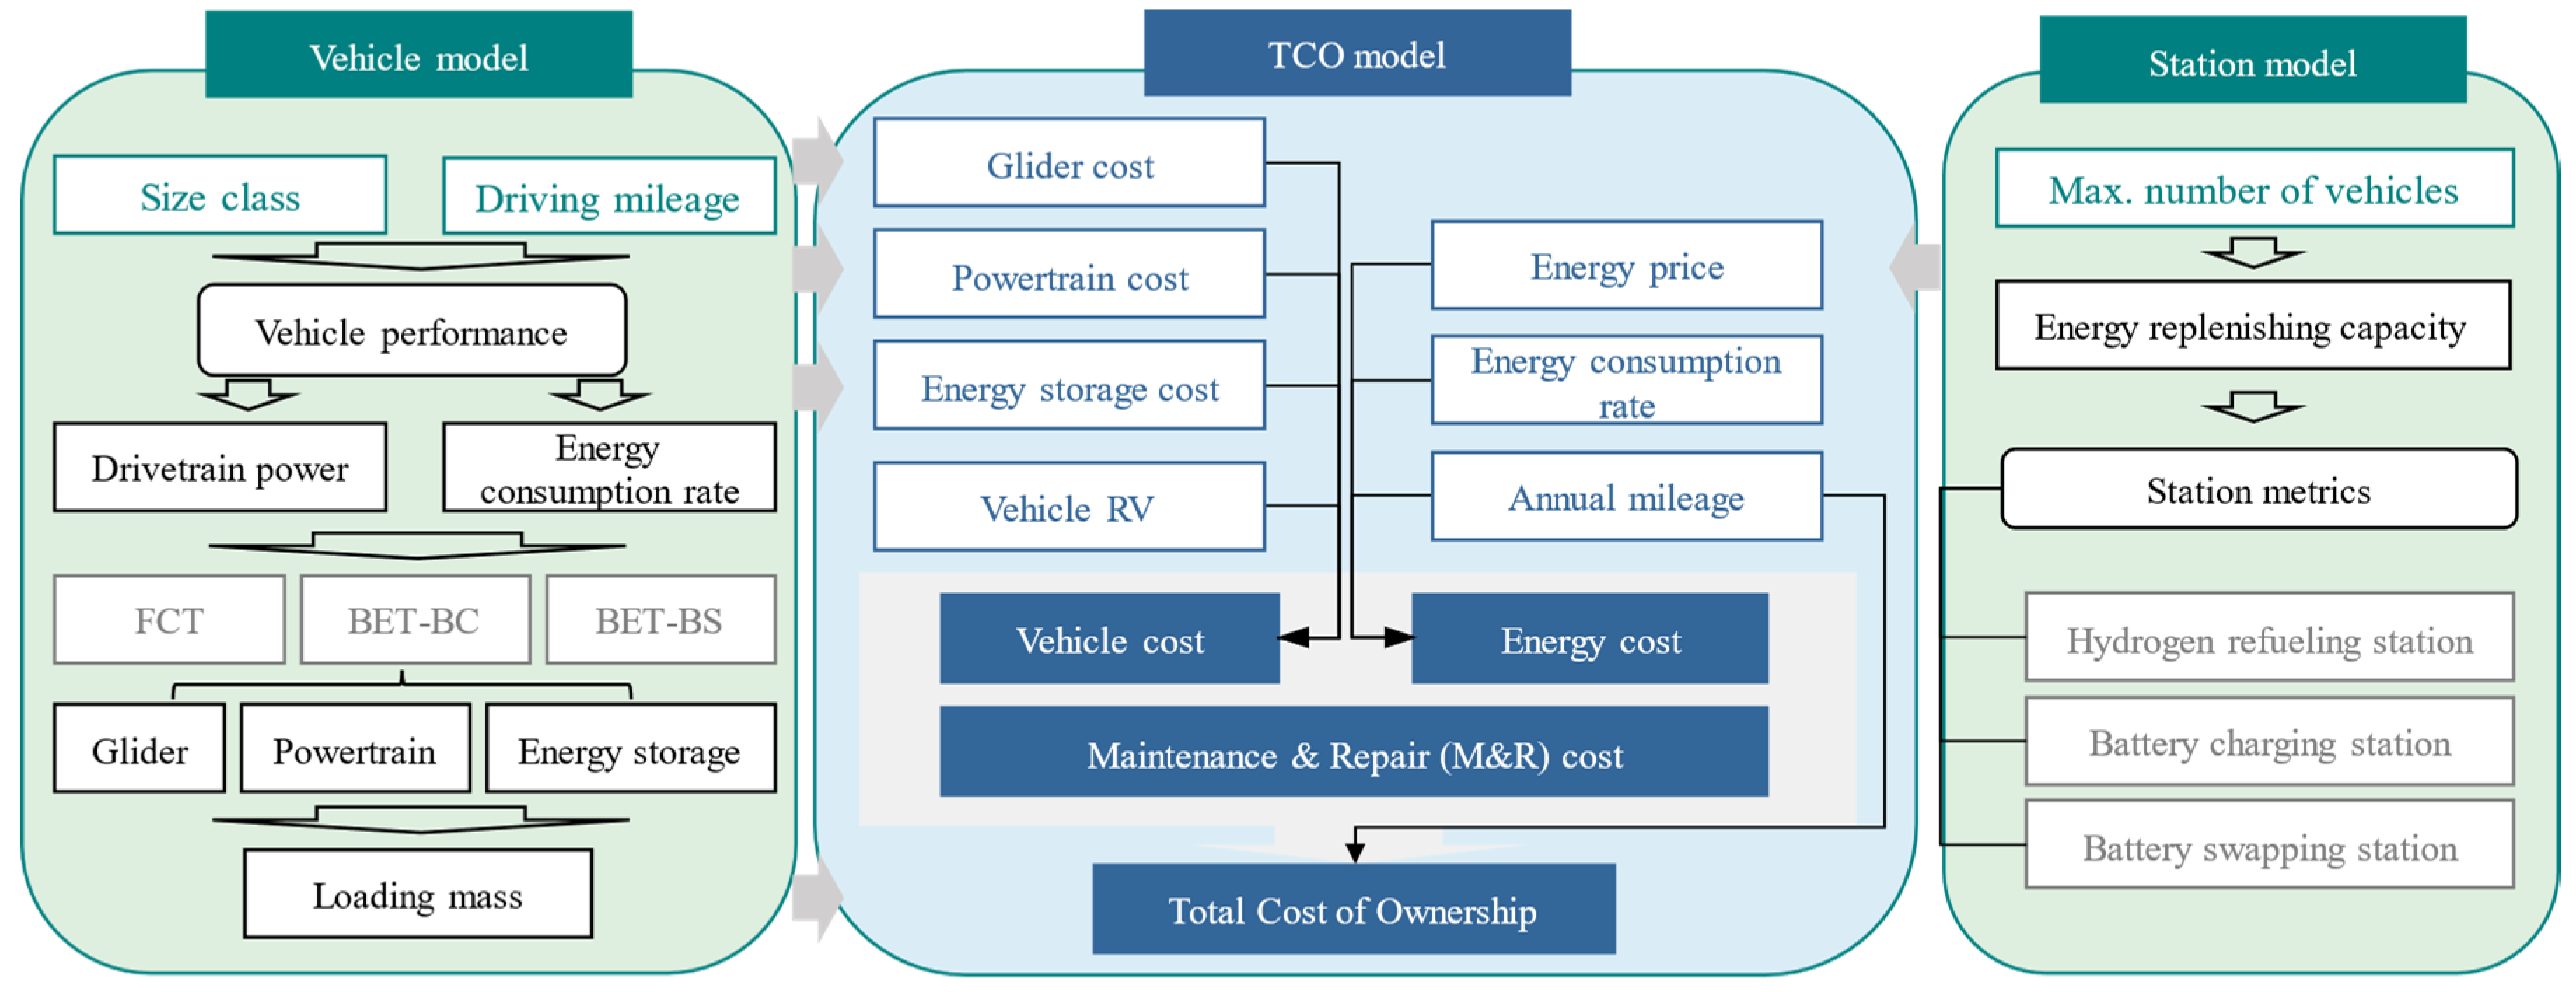
This methodology aims to maintain uniformity in evaluating the TCO for FCTs and BETs, filling a critical void in comparative assessments. Figure 1 delineates a multi-faceted framework for conducting TCO analysis in this paper. The framework synergistically encompasses three sub-models.
At the heart of this study lies the TCO model, which serves as the analytical core for assessing the economic viability of heavy-duty vehicles within China’s renewable energy context. This model meticulously quantifies the comprehensive costs incurred throughout the vehicle’s first ownership, including the cost of the glider and powertrain, expenditures for energy storage, and operating costs covering maintenance, repair, and energy consumption. Additionally, the TCO model integrates the vehicle’s residual value, offering a holistic view of the economic implications associated with HDTs.
The TCO model stands as the primary evaluative tool, with the Vehicle and Station Model supplementing it as vital sub-models. The Vehicle Model encapsulates critical vehicular parameters such as the size class, driving mileage, vehicle performance metrics, drivetrain power, and the energy consumption rate. It is applicable across various HDT types, namely FCTs, BETs with battery charging (BET-BC), and BETs with battery swapping (BET-BS). The Station Model of the framework projects the infrastructure, concentrating on the maximal number of vehicles served per hour by the energy infrastructure, the station’s energy replenishment capacity, and performance metrics pertinent to hydrogen refueling, battery charging, and swapping facilities.
2.2. TCO Model
This paper assesses the costs of heavy-duty vehicles within a 5 year ownership period. It considers the vehicle cost, energy, and maintenance expenses, accounting for the discounted costs and asset depreciation. In the TCO calculation from Equations (1)–(4), all cost units are in USD. The TCO (USD/tkm) is calculated using Equation (1), which is remodeled based on Zhao et al.’s research [17].
where denotes the vehicle’s purchase cost, denotes the operating cost during the use phase, which includes energy and maintenance costs, and RV denotes the residual value of the vehicle after the use phase. represents the vehicle’s loading mass (t); DM denotes the vehicle’s annual driving mileage (km). r denotes the discount rate; T denotes the truck lifespan (years).
2.2.1. Vehicle Cost
In this paper, the vehicle purchase cost () is broken down into individual component costs. This detailed approach is applied to both FCTs and BETs. While these vehicle types share a common glider, they differ in their powertrain and energy storage components. Figure 2 illustrates the differences in the configuration of the power systems between FCT and BET. The calculation of involves a detailed cost calculation of glider cost () and powertrain cost (). Since new energy vehicles are exempt from purchase tax, directly represents the initial cost of the vehicle.
Glider costs are the same for FCTs and BETs. The estimation of the glider cost for China’s heavy-duty trucks in this study is based on Mao et al.’s analysis of public market data for heavy-duty diesel trucks [14]. By applying the finding that the diesel power transmission system constitutes 51.7% of the vehicle’s price, the study calculates the glider cost for the three vehicle models of China’s heavy-duty trucks.
Regarding the powertrain costs, the study differentiates between the systems used in FCTs and BETs. FCTs primarily comprise a hydrogen storage system and a fuel cell system. In contrast, BETs are equipped predominantly with a battery system. Both types of vehicles utilize the same electric drive system.
where , ,, , and denotes the cost of the fuel cell system, high-voltage battery paired with fuel cell system, hydrogen storage system, traction battery system, and electric-drivetrain, respectively. All cost values are measured in USD.
Over the past decade, there has been a significant reduction in the cost of fuel cell systems. All cost data below are converted to USD using exchange rates of 1 USD = 6.8 RMB and 1 USD = 131.5 JPY. The current market prices for fuel cell products from SinoHytec and SinoSynergy in China are reportedly between 4000 and 5000 RMB/kW, equivalent to approximately 588 to 735 USD/kW, with expectations of further reductions due to technological advancements and scaling [31,32]. The FCS cost in the United States was 190 USD/kW in 2019 and is projected to decrease to 80 USD/kW by 2030 and 60 USD/kW by 2050, according to the Department of Energy [33]. Japan’s projections are similarly aligned, aiming for 68.5 USD/kW by 2030 [34]. The Energy-saving and New Energy Vehicle Technology Roadmap 2.0, also known as Roadmap 2.0, outlines progressive goals for reducing the cost of certain technologies. It targets a reduction to 294 USD/kW by 2025 and further down to 88 USD/kW by 2030–2035 [35]. A similar declining cost trend is exhibited when comparing the progress among these countries. This article adopts the Chinese technology roadmap for its 2025 and 2030 projections, targeting for 74 USD/kW.
In this study, a Type IV bottle with a hydrogen storage pressure of 70 MPa is analyzed.
The current market price for on-board hydrogen storage products by GUOFUHEE in the Chinese market is approximately 662 USD per kilogram [36]. The high cost of on-board hydrogen storage is mainly attributed to the utilization of carbon fiber materials. However, projections from Roadmap 2.0 show a decrease in hydrogen storage costs to 588 USD/kg by 2025 and further to 294 USD/kg by 2030 [35], reflecting the anticipated advancements in this technology.
China’s prominence in the vehicle traction battery sector is highlighted by the global leadership of CATL and BYD in market share. Currently, CATL’s traction battery system is priced at around 147 USD/kWh. The cost of these energy batteries is projected to decrease to 76 and 63 USD/kWh by 2025 and 2030, respectively [35]. In this study, high-voltage traction batteries are paired with the fuel cell system. The roadmap outlines the current and projected costs for these batteries, indicating a gradual decrease in prices over time, with current and projected costs of 176, 147, and 118 USD/kWh, respectively [35]. Table 2 presents the specific performance and cost parameter settings of the vehicle models studied in this research.
2.2.2. Energy Cost
The expenditure on energy is intricately linked to variables such as energy prices, fuel consumption, and annual vehicle mileage. The annual energy cost is calculated as follows:
where denotes the energy price (USD/MJ); ECR denotes the energy consumption rate (MJ/km); denotes the daily working hours of the vehicle (hours).
The fuel consumption rate is derived from the Vehicle Model. It is important to note that replenishing times differ across vehicle models across powertrain systems, thereby influencing the average daily mileage . The calculation of is as follows:
where represents the driving range (km), denotes the working time in a day (hours), denotes the driving time after replenishing (hours), and denotes the time taken for replenishing (hours).
Furthermore, the energy cost is significantly impacted by the replenishing cost. By integrating the external factors of renewable energy, such as hydrogen and electricity, with the energy replenishment station model, the energy replenishing costs for fuel cell and battery electric heavy-duty trucks can be obtained. For instance, considering Beijing’s reliance on wind energy sourced from adjacent cities like Zhangjiakou, the levelized cost of electricity (LCOE) for wind power in 2020 ranged between 0.03 and 0.08 USD/kWh. Utilizing Chen et al.’s forecasts, to meet the carbon neutrality target, the observed wind power grid price in China for 2023 was 0.04 USD/kWh. Projections for future years are as follows: 0.03 USD/kWh for 2025, 0.029 USD/kWh for 2030, and 0.028 USD/kWh for 2035 [37]. Incorporating these electricity prices into the energy replenishment station model enables the determination of energy replenishment costs for the three heavy-duty vehicle types.
2.2.3. M&R Cost
In the context of commercial vehicles, the uniformity in Maintenance and Repair (M&R) costs is a significant consideration. Due to the absence of a standard maintenance pricing structure for electric trucks, the literature exhibits considerable variability in the maintenance costs of different truck types. The maintenance cost for diesel trucks in China is at approximately 0.048 USD/km [38]. Furthermore, the maintenance expenses of diesel, fuel cell, and battery electric heavy-duty trucks are based on the study by Wang et al. [39]. By leveraging Wang’s cost structure analysis, this study calculates the maintenance prices for heavy-duty vehicles of varying levels and power types, facilitating a comprehensive comparison.
2.2.4. Vehicle Residual Value
In this study, the residual value (RV) of the glider and various power systems is evaluated over a 5 year usage period by the first owner. Considering China’s 15 year scrapping norm for trucks, where the residual value is zero at the end of this period, a fixed depreciation rate is applied. The study employs a 7.5% depreciation rate, aligned with typical standards but tailored to the specific parameters of this research. This rate is pivotal in calculating the value depreciation of the vehicles across their operational lifespan.
2.3. Vehicle Model
2.3.1. Case Definition
This study focuses on long-distance freight heavy-duty trucks, a category characterized by high utilization rates and relatively short lifespans. Based on market analysis, these trucks typically cover an average annual distance of over 200,000 km. This study selects three common weight classes in the Chinese market—16 t, 25 t, and 49 t—and examines three distinct driving ranges: 500 km, 800 km, and 1000 km. For battery electric trucks with battery swapping (BETs-BS) in the Chinese market, the typical battery capacity ranges from 200 to 300 kWh [40]. BETs-BS show improved economic performance at relatively low driving ranges, specifically around 156 km [29]. Therefore, this article sets the energy storage capacity for BETs-BS at a driving range of 200 km to align with these operational parameters and market trends.
Drawing on data from the 2022 Truck Driver Employment Status Survey Report [41], the research acknowledges that a significant proportion of drivers (over 76%) work an average of 8 h or more daily, with around 28% working 12 h or more. Given the standard practice of employing two drivers per truck for shift driving, the study assumes an average daily driving time of 20 h per truck. The speed limits on highways (ranging from a minimum of 60 km/h to a maximum of 100 km/h) and operational conditions in urban settings are taken into account to establish a reasonable average speed. Considering two days of rest per week, the study estimates the number of working days per year to be 260, resulting in an estimated annual driving distance of about 300,000 km.
The high operational intensity typically leads to heavy trucks being decommissioned after 5 years. Consequently, the study adopts a 5 year life cycle for these vehicles, aligning with the standard set in most contemporary TCO studies. Beijing is selected as a representative city for the analysis, given its significant role in the development and application of heavy-duty vehicle electrification in China, both in terms of policy support and market practicality [42].
2.3.2. Energy Consumption and Storage Sizing
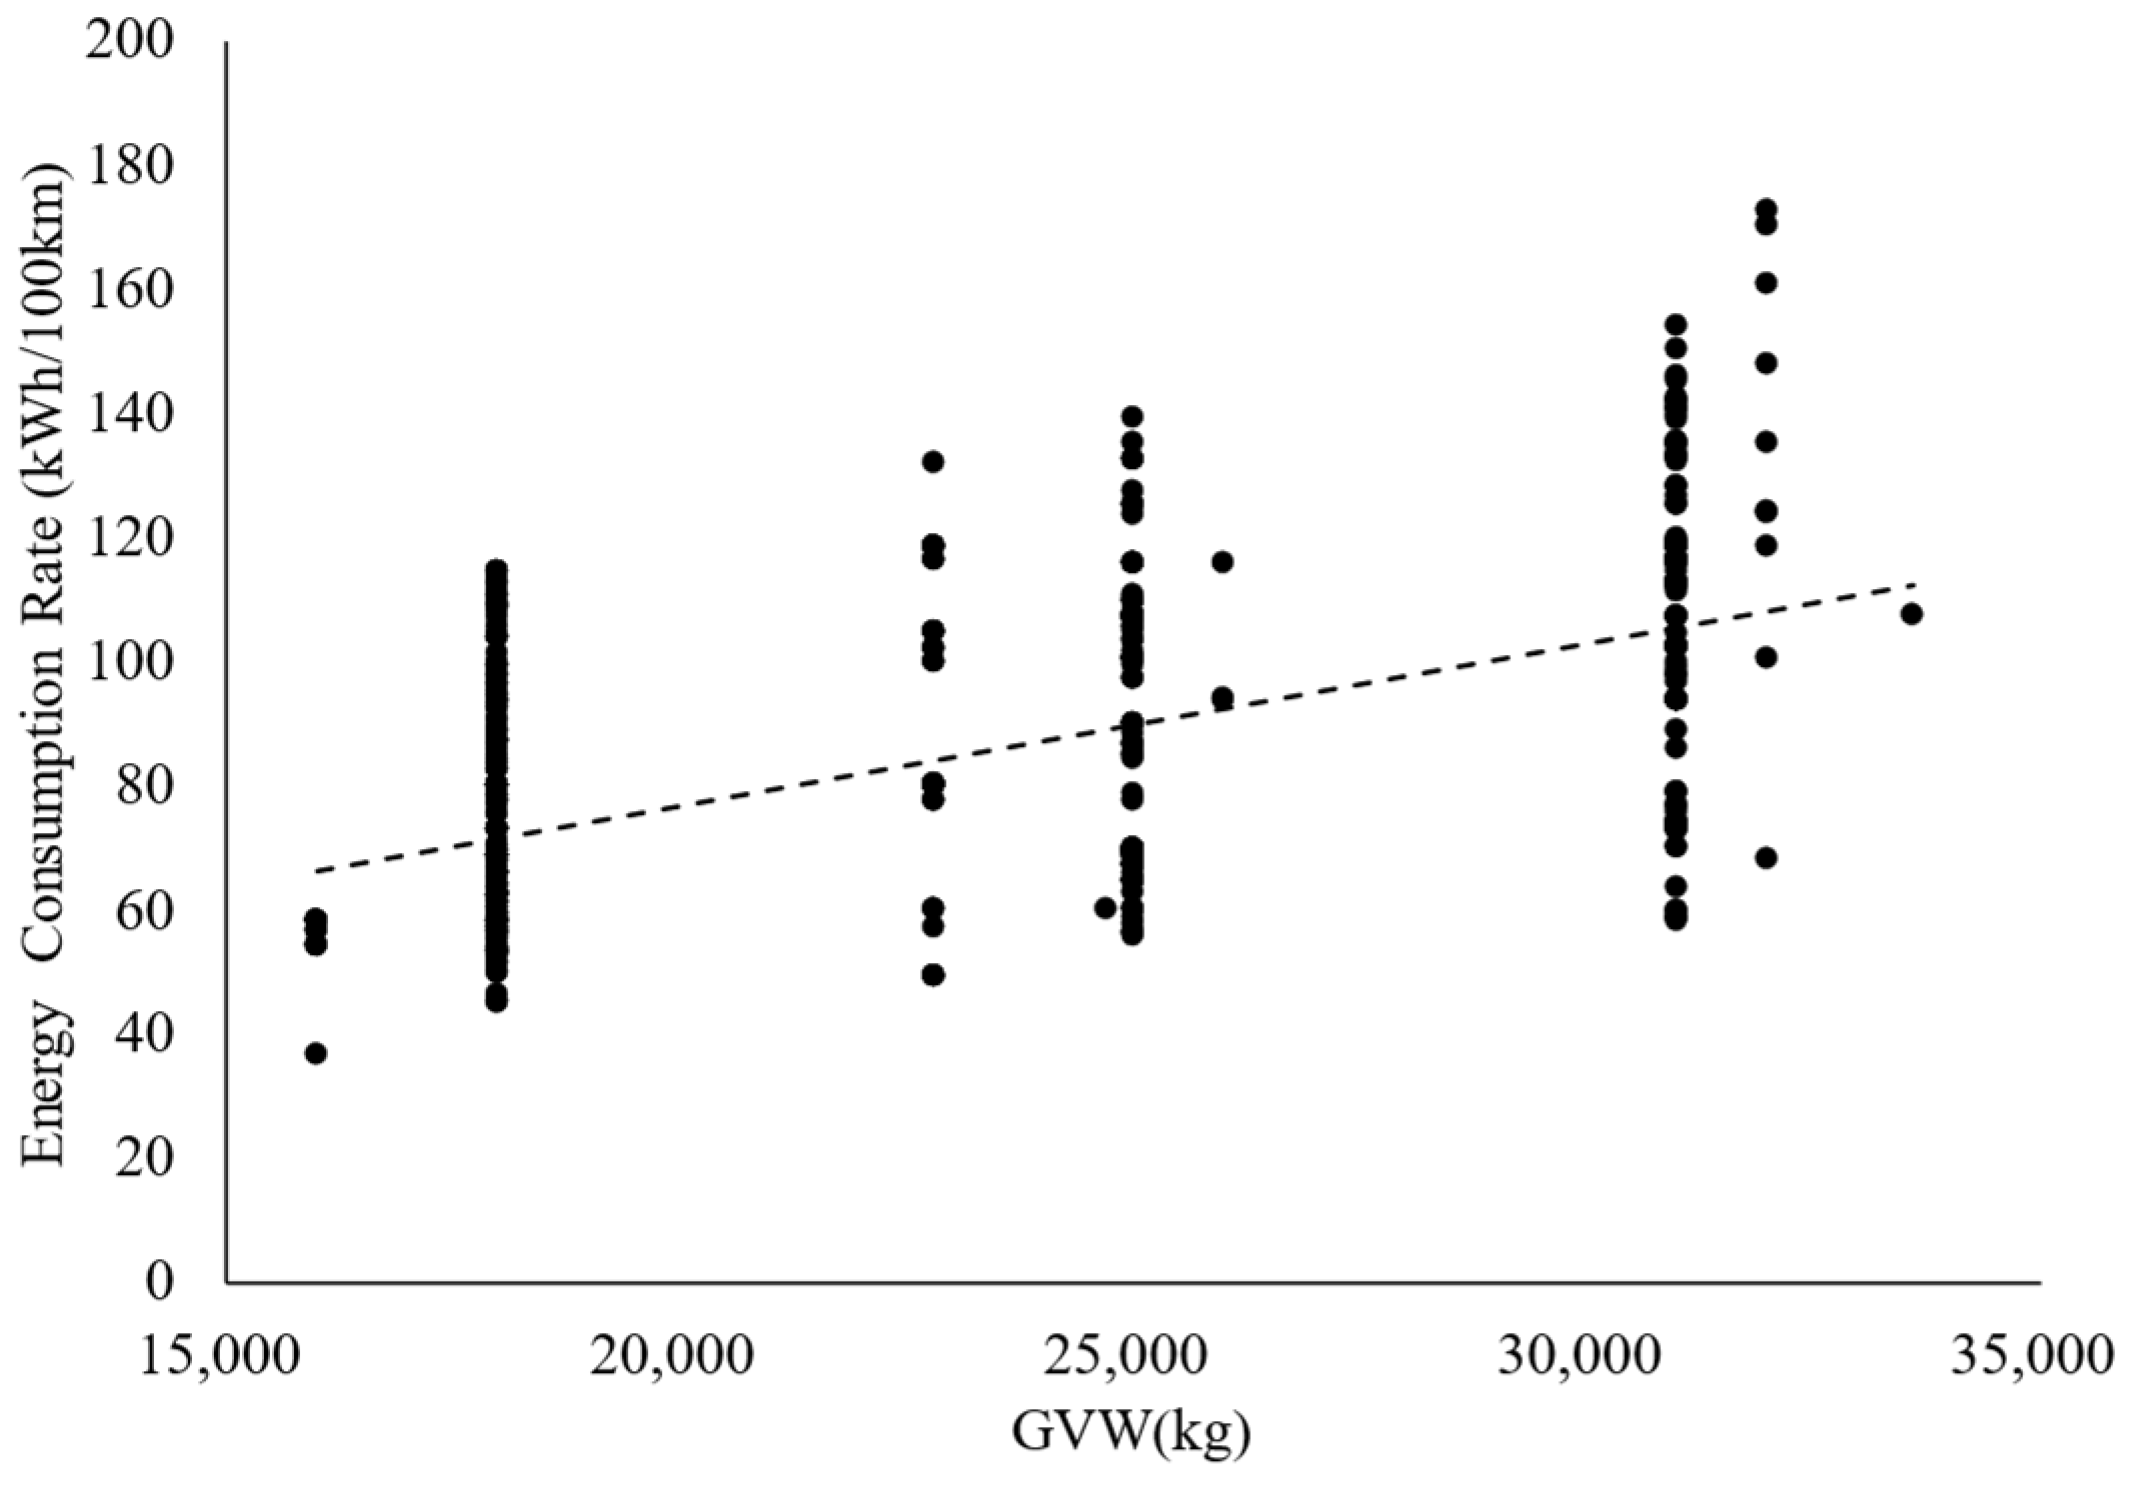
In addressing the data scarcity for fuel cell heavy-duty trucks, this study confronts a notable challenge. Nevertheless, by leveraging the shared electric drive system of electric and fuel cell heavy-duty trucks, it estimates the energy consumption of the latter by extrapolating from available data on battery electric heavy trucks in the Chinese market. This approach is visually represented in Figure 3, which delineates the correlation between the energy consumption rate and Gross Vehicle Weight (GVW).
Utilizing the energy consumption fitting data of BETs within the Chinese market, a correlation is established between the energy consumption per 100 km and GVW. This relationship enables sizing the energy storage components for both fuel cell heavy-duty vehicles (kg H2) and battery electric heavy-duty vehicles (kWh).
where DR denotes the driving range (km); LHV denotes the low heat value of hydrogen, which is 119.6 MJ/kg in this study; denotes the efficiency of FCS; DoD denotes the depth of discharge.
2.3.3. Powertrain Sizing
Modern fuel cell system configurations often combine fuel cells with batteries, categorized into three types based on their power proportions: energy hybrid, power hybrid, and fuel cell full power. This paper focuses on the full power type, highlighting fuel cells’ primary role. In such setups, batteries mainly provide peak power support and aid in braking energy recovery. Figure 2 in this paper illustrates the powertrain system configurations for FCTs and BETs, clearly showing the distinct roles and interactions in each system.
Motor
The determination of the drive motor’s rated power and peak power in full power fuel cell vehicles hinges on the overall power requirements of the vehicle. Following the model established by Ji et al. [43], the calculations for the rated power and peak power are as follows:
where is the vehicle speed when climbing (km/h); is the efficiency of the transmission system; α is the maximum climbing angle (rad); is the max speed (km/h); f is the rolling resistance coefficient, and is the drag coefficient; is the windward area (m2). Table 3 provides a detailed description of HDV parameters.
Fuel Cell System
In the context of fuel cell systems of heavy-duty vehicles, the primary role of the fuel cell is to supply power to the motor under rated operating conditions. Additionally, it is responsible for providing the necessary power for various vehicle accessories. To accurately calculate the power requirements of the fuel cell system, it is essential to consider both these aspects: the power needed for the vehicle’s propulsion under normal operating conditions and the additional power required for the functioning of vehicle accessories. Equation (11) presents the assessment of the fuel cell’s power output.
is the lower limit of the peak power of the fuel cell (kW); is the rated power of the drive motor (kW); represents the efficiency of the boost converter between the fuel cell and the busbar; denotes the efficiency of the motor inverter; is the efficiency of the motor; is the power required for the accessories (kW).
Battery
In designing the battery system to complement the fuel cell in heavy-duty trucks, the focus is on power matching rather than high capacity. This is because the battery in this configuration is not primarily used for energy storage, but rather to provide high power output for specific needs, such as peak power demands and regenerative braking. Therefore, the design emphasizes the battery’s power capabilities rather than its capacity.
where is the lower limit of the maximum discharge power of the battery (kW); is the electrical power required from the energy source when the drive motor outputs peak power (kW); represents the peak power of the drive motor (kW); denotes the efficiency of the bidirectional DC-DC converter between the battery and the bus.
Thus, the battery capacity can be calculated [43] as follows:
is the rated capacity of the battery (kWh); is the maximum charge and discharge power (kW); is the charging rate, and for high-voltage batteries used in FCTs, is set at 1.
2.3.4. Loading Capacity
The loading capacity of heavy-duty trucks is a critical factor in their economic evaluation. The types of powertrain and energy storage systems, with their varying energy densities, significantly influence the curb weight of each truck model. This, in turn, directly affects the truck’s loading capacity. Therefore, assessing the loading capacity is vital for an economic analysis of heavy-duty trucks using different power systems, as it directly impacts their operational efficiency and profitability.
where , , denotes the mass of the glider, powertrain system, and energy storage system, respectively (t).
2.4. Station Model
The market for fuel cell and electric heavy trucks is still developing, and the infrastructure for energy supplementation, including hydrogen refueling stations and charging stations, is in its early stages. Consequently, there is significant uncertainty in the prices of hydrogen and electricity. To facilitate a fair comparison, this study establishes a supplementary levelized cost of replenishing (LCOR) model to determine the energy cost of different replenishing modes, as depicted in Figure 4. Key cost parameters in this model include investment, operation, energy replenishment capacity (charging and hydrogenation volume), and discount rate. Assumptions regarding investment cover initial costs, lifespan, and government subsidies of the energy supplement station, while operational assumptions account for daily expenses like employee wages, power costs, and maintenance costs.
In this section, we establish a model to calculate the levelized costs of hydrogen refueling, battery charging, and battery swapping stations under a unified renewable energy power supply scenario. The LCOR is calculated using a specific formula based on [44] that takes into account factors including initial investment , operation and maintenance costs , residual value , and energy production (in kg for hydrogen and in kWh for electricity). They are all discounted over the station’s lifetime.
where r denotes the discount rate, which is 8% in this paper [44]; T denotes the station lifespan, which is 10 years in this paper [29]; denotes the amount of energy (MJ).
The analysis covers three types of recharging stations: hydrogen refueling stations (HRSs), battery charging stations (BCSs), and battery swapping stations (BSSs), each catering to different vehicle types: FCTs, BETs-BC, and BETs-BS. A key assumption for a fair comparison is that each station type can service the same maximum number of vehicles per hour. Practical aspects like refueling time and equipment costs are considered based on market experience. This paper also makes assumptions regarding the utilization rate of these stations and the anticipated decrease in the cost of key equipment, which are vital factors in the analysis. The operational and cost assumptions for the replenishing stations are shown in Table 4.
2.4.1. Hydrogen Refueling Station
Off-site hydrogen refueling stations (HRSs) are currently prevalent in the market. Bai et al.’s analysis on the economics of hydrogen energy within China’s renewable energy framework suggests a shift towards tube-trailers in the near term and hydrogen pipelines in the long term for economic efficiency. An HRS typically comprises components such as a hydrogen compressor, storage tank, dispenser, and other ancillary equipment like pipeline valves and cooling systems. The primary cost contributors in these stations are the hydrogen storage, compression, and hydrogen dispenser.
Market research reveals significant pricing details for components in hydrogen refueling stations. The cost of hydrogen storage systems ranges between 882 and 1176 USD per kg. There is a notable price difference between imported and domestic compressors, with the former priced between USD 400 and 700 thousand, and the latter between USD 150 and 290 thousand. This paper adopts a value of USD 400 thousand for the compressor costs. Additionally, research by Wang et al. [39] indicated that the combined cost for hydrogenation machines and related cooling equipment in the Chinese market was around USD 400 thousand [44,45].
2.4.2. Battery Charging Station
Electric vehicle charging technology is divided into AC slow charging and DC fast charging, based on the charging power. While AC slow charging is widely used, its longer charging times lead to inconvenience, which has led to the increasing development of DC fast charging in the market. Charging rate, a key metric for charging speed, is defined as the ratio of charging current to the battery’s nominal capacity, with DC fast-charging rates typically ranging from 1 to 2C. The charging requirements for inner-regional and inter-regional heavy truck operations vary, with the latter often necessitating DC fast charging exceeding 350 kW, and sometimes up to 1 MW, to achieve shorter idle periods [46,47]. This study selects a 2C charging rate for charging stations, considering the efficiency needs of long-distance heavy trucks.
The investment in fixed equipment at charging stations primarily involves the cost of charging piles. Fast-charging piles are relatively expensive. Zhu et al. provided estimates for the cost of fast-charging piles in the Chinese market, with a 2C rate charging pile priced at 69 USD/kW [29]. The number of charging piles at a station is based on the capacity required to charge the vehicles. Additionally, the integration of charging stations into the power grid necessitates grid expansion costs due to the impact of charging electric vehicles on the grid infrastructure.
2.4.3. Battery Swapping Station
In addition to charging pile and grid expansion costs, the fixed equipment investment in battery swap stations also includes battery swapping equipment and backup batteries. Under the vehicle–battery separation model, vehicle owners rent batteries from BSSs, which need a sufficient supply of vehicle batteries. The number of vehicle batteries corresponds to the maximum service capacity per hour, and backup batteries are kept to meet demand during peak charging times. The calculation for the minimum number of spare batteries is determined based on these operational requirements [48].
where is the charging rate of the charger in the battery swap station, which is set to 0.5 in this study; is the battery swap time (minutes), which is set to 8 min in this study; is the number of swapping equipment, which is set to one in this study. The total number of batteries in the BSS is the sum of vehicle batteries and backup batteries.
The three types of stations feature unique modes of energy replenishment, necessitating variations in the specialized equipment deployed. Figure 5 illustrates the differences in the systematic diagram of the three types of replenishing stations.
3. Results
3.1. TCO Results
By integrating vehicle performance metrics and renewable energy electricity pricing into the TCO model established by this study, we systematically generate the corresponding ton-kilometer TCO outcomes. The TCO results displayed in Figure 6 show a breakdown of costs for heavy-duty trucks across different vehicle sizes of 16 t, 25 t, and 49 t from 2023 to 2035. The costs are divided into three categories: vehicle, energy, and maintenance. The results indicate that, across all vehicle classes, vehicle costs constitute the highest expenditure, followed by energy and maintenance costs. As the GVW increases, the proportion of vehicle costs also appears to increase. A noticeable trend of decreasing costs over time emerges, resulting from decreases in energy prices and improvements in vehicle technology.
For fuel cell heavy trucks, the primary cost comes from the high price of hydrogen, significantly affecting energy costs. In contrast, for battery electric heavy trucks, the major cost is the vehicle itself, especially with increased driving ranges due to expensive batteries required for longer mileage. Battery swapping trucks generally exhibit better economic performance, but this advantage diminishes when compared to battery electric trucks with shorter ranges. Future trends suggest a potential reduction in hydrogen energy and power battery costs, which might reduce the cost gap among these truck types. Fuel cell vehicles are less impacted by driving range variations in cost compared to battery electric vehicles, indicating a smaller cost difference with increased range.
3.2. Vehicle Cost Results
As depicted in Figure 7, vehicle cost is broken down into different components including the glider cost, energy storage cost, powertrain cost, and residual value. A declining trend in energy storage and powertrain costs can be observed, due to technological advancements and economies of scale. The glider costs are assumed to remain the same across the years. The residual value appears to be a minor component of the overall cost. The total vehicle cost, which is the sum of all these components, shows a decreasing trend over time, suggesting that new energy heavy-duty vehicles in this study are becoming more economically viable.
The BET-BS presents the lowest upfront cost by transferring the battery purchase expense to a leasing model during the usage phase, excluding the battery from the initial acquisition cost. For both FCTs and BETs-BC, the vehicle costs are derived from the powertrain and energy storage systems. Moreover, as the driving range extends, the variation in purchase costs for FCTs is less pronounced compared to BETs-BC. For example, for a 16 ton model in 2023, as the range expands from 500 km to 800 km, the vehicle cost for an FCT increases from $91,345 to $103,295 USD, whereas for a BET-BC, it escalates from $60,954 to $113,493, a trend consistent across other vehicle categories, indicating the higher sensitivity of the BET-BC’s costs to driving range.
Further analysis reveals that at lower driving ranges, the purchase cost for BETs-BC is initially lower than that for FCTs. However, as the range increases and with it, the battery capacity, the cost associated with the battery system surges significantly more than the cost for hydrogen storage in FCTs, gradually narrowing this cost differential. With the anticipated decrease in hydrogen storage and fuel cell system costs in the coming years, and a decrease that is expected to outpace that of battery systems, the cost of owning a fuel cell heavy-duty truck is projected to become lower than that of a battery electric counterpart.
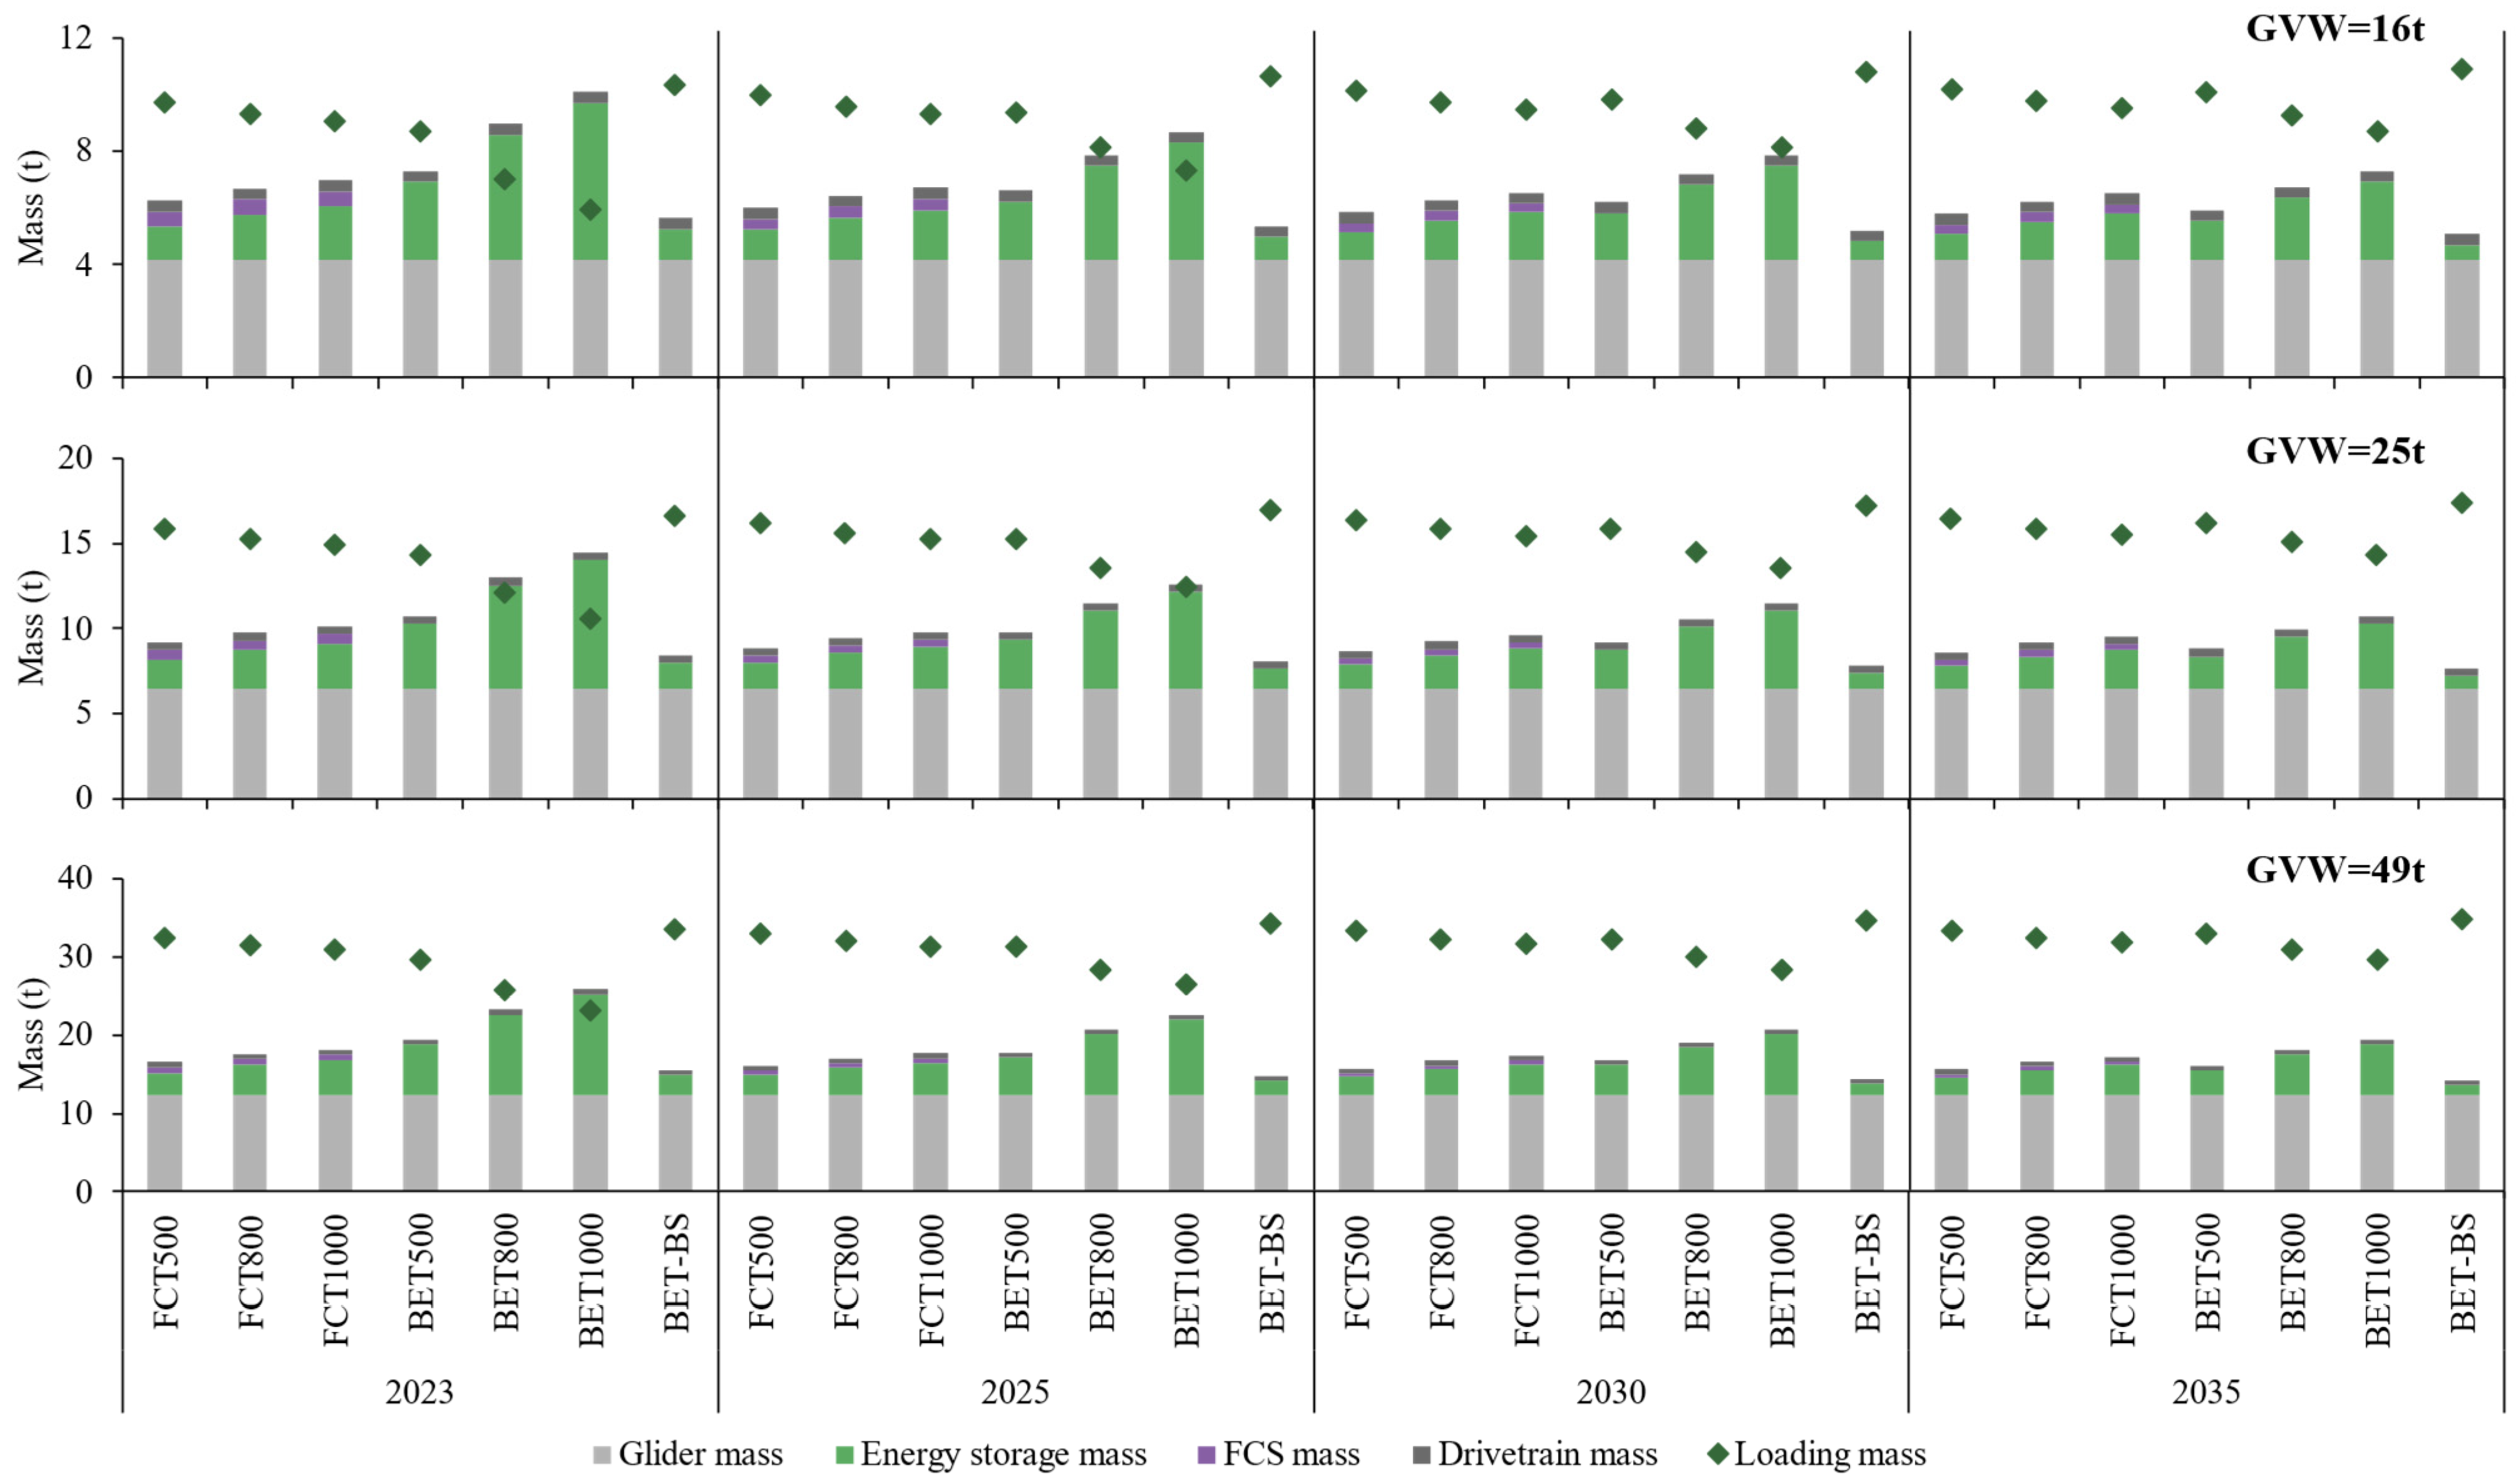
3.3. Loading Mass Evaluation
Figure 8 illustrates how the curb weight distribution of different vehicle components affects the load capacity of FCTs and BETs across various weight classes and driving ranges. BETs show a more significant decrease in load capacity with an increased driving range due to the surging weight of batteries. In contrast, FCTs, with their high-energy-density hydrogen storage, exhibit only a slight change in load capacity across varying ranges. As the energy density of batteries improves, BETs could achieve the same short-range load capacity of FCTs, but FCTs are expected to outperform at longer ranges due to energy density limitations. Battery swapping trucks maintain the highest load capacity due to their unchanged small battery size.
3.4. LCOR Results
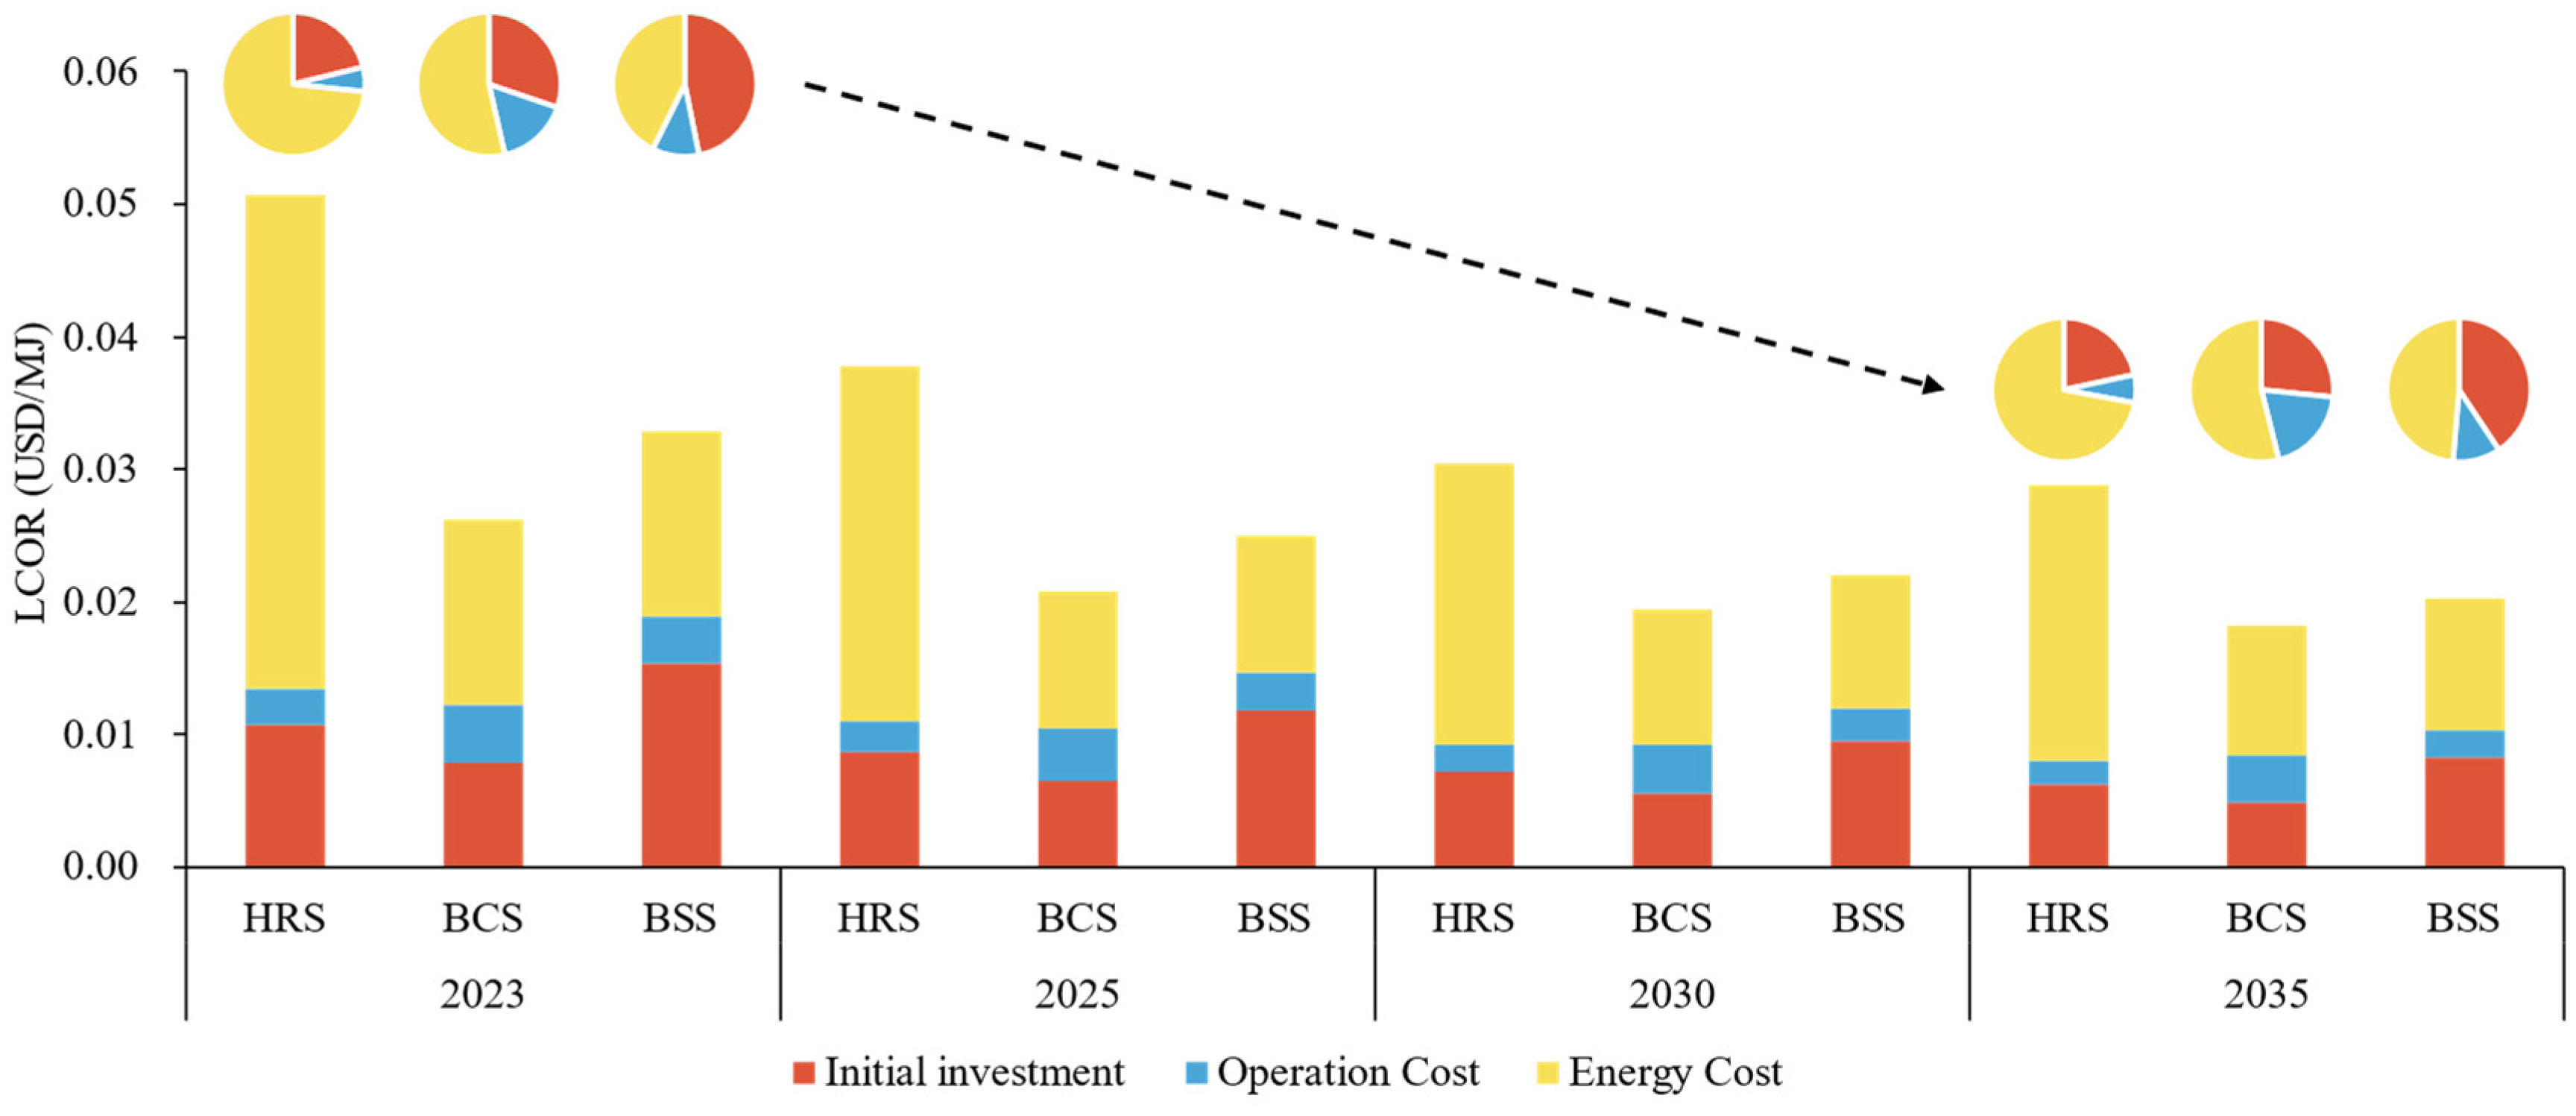
Figure 9 shows the LCOR associated with hydrogen refueling stations (HRSs), battery charging stations (BCSs), and battery swapping stations (BSSs) from 2023 to 2035. For HRSs, the cost of hydrogen constitutes the largest portion, reaching 69–73%. For BCSs and BSSs, while electricity costs represent a significant share, initial investments are also prominent, especially for battery swapping stations where they are almost on par with energy costs. Thus, the key factors in reducing refueling costs are primarily the price of externally purchased energy, followed by the investment in refueling station equipment.
The LCOR for all station modes shows a downward trend over time and it can be seen that initial investment and energy input costs are the main contributors. Operational costs are relatively stable across the years. Hydrogen refueling consistently presents the highest costs for truck owners, primarily due to high hydrogen production and transport expenses. The cost associated with battery swapping stations is generally higher than that of charging stations, attributable to the additional investment in swap equipment and backup batteries. BSSs have the lowest energy costs, while HRSs start with the highest energy costs, which decrease substantially by 2035 resulting from a reduction in hydrogen prices.
3.5. Results Validation
To validate our research, we compared the results with similar existing studies. Figure 10 provides a nuanced comparative analysis between the findings of this study and those of existing studies [8,9,12,23]. Given that the literature predominantly focuses on heavy vehicles exceeding 25 tons without considering the loading mass in TCO evaluations, this research recalibrates the ton-kilometer results for 25 ton and 49 ton models into per kilometer TCO metrics for direct comparison with earlier studies. The TCO outcomes identified in this investigation are positioned towards the lower to middle range of the spectrum reported in the existing literature. As detailed in previous analyses, the set prices for electricity and hydrogen significantly influence the TCO. In this context, the renewable energy electricity prices designated for 2025 and 2035, which are comparatively lower than those referenced in other studies, result in the observed lower TCO figures. This methodological approach enhances the credibility of the TCO model developed in this study, demonstrating its accuracy and effectiveness in evaluating the economic aspects of heavy vehicle electrification.
3.6. Key Parameter Analysis
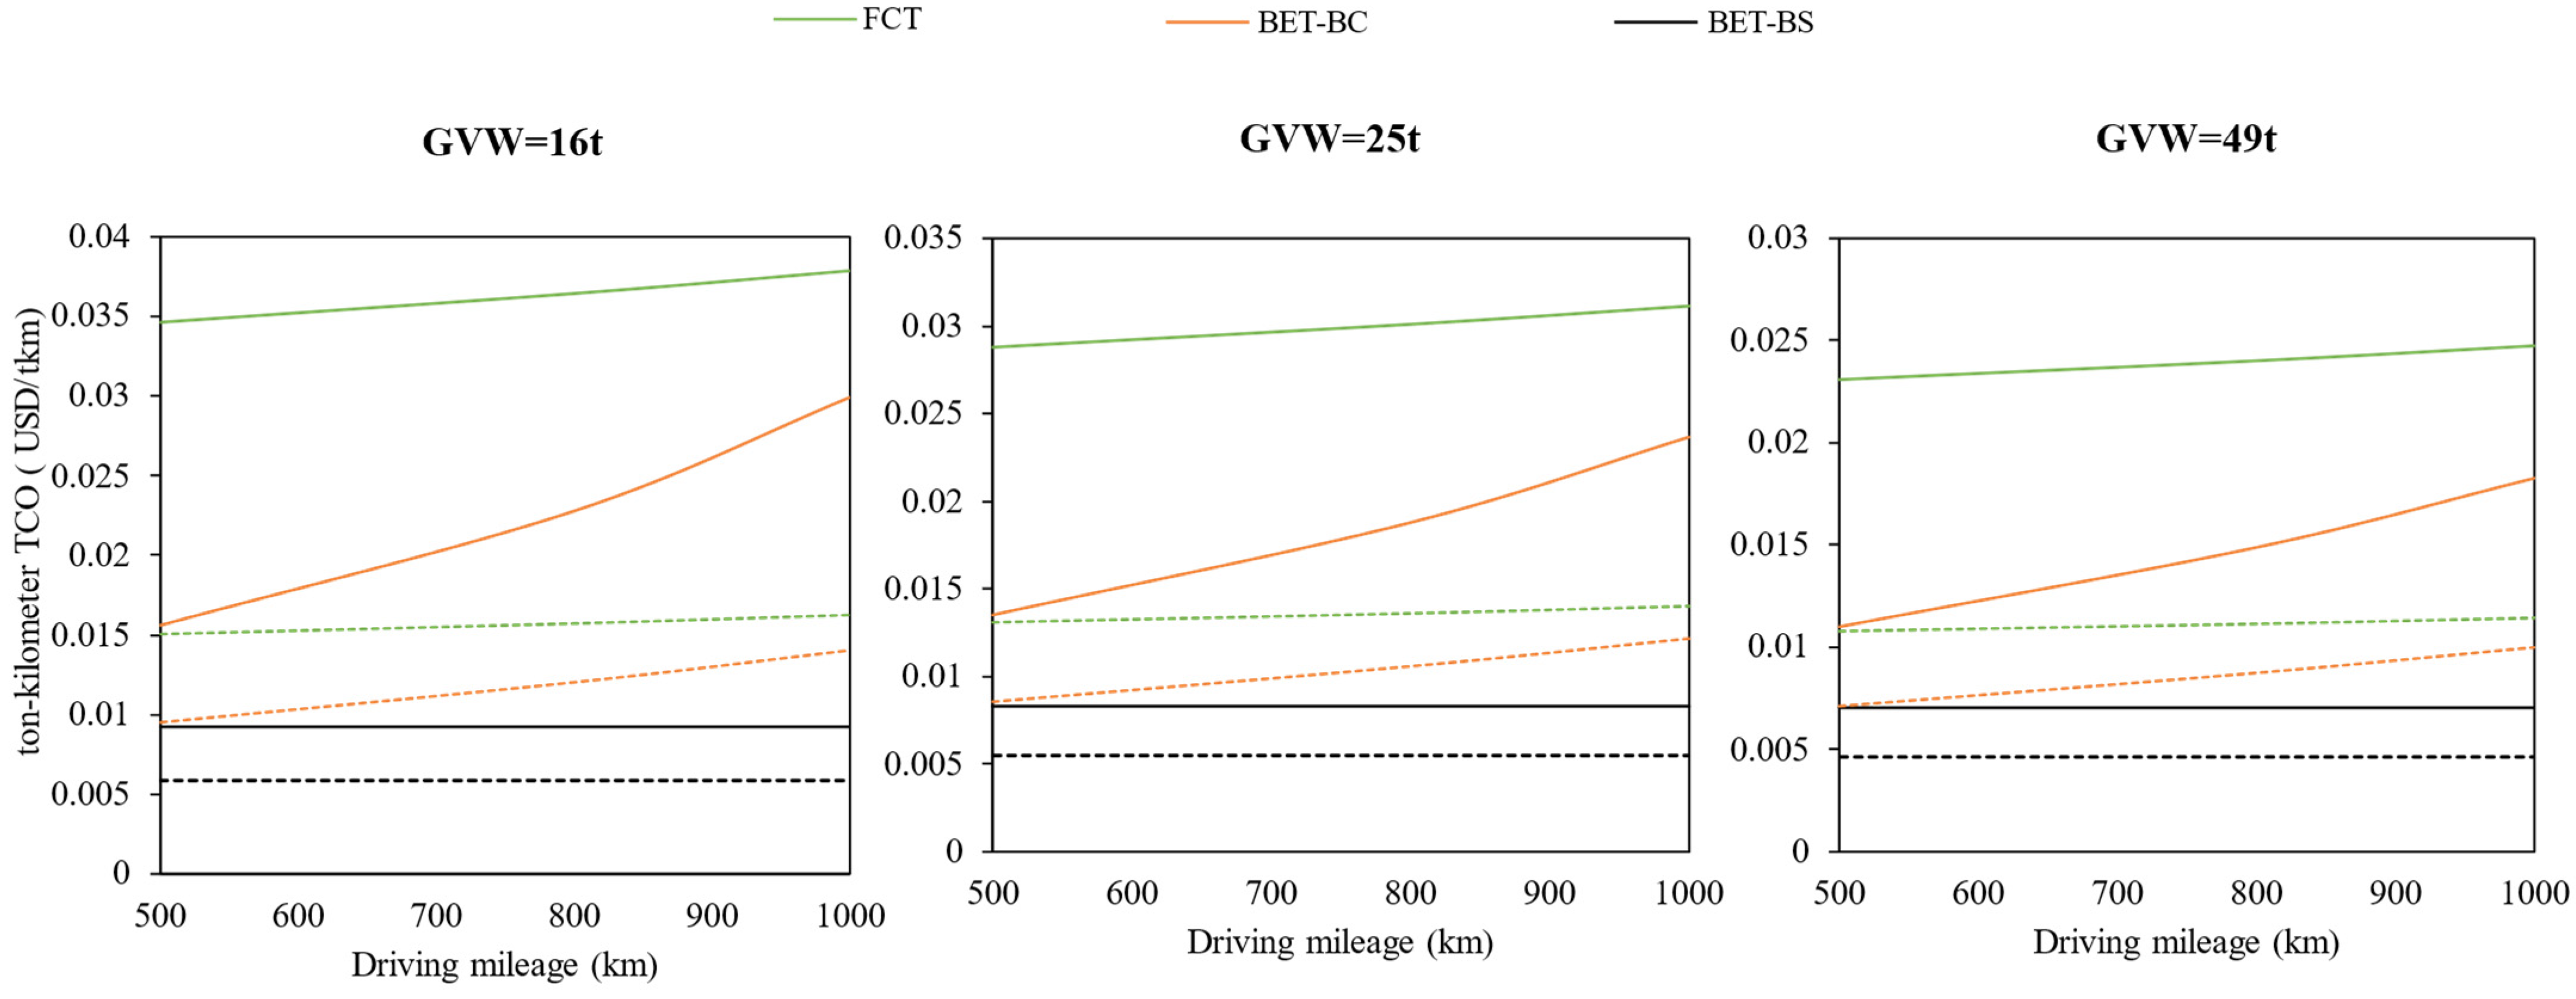
The examination reveals that the driving range and energy price are pivotal in the TCO for heavy-duty trucks. The analysis, therefore, concentrates on these determinants to evaluate the economic viability of FCTs and BETs at a range of 1000 km, with a forward-looking perspective to 2035.
Figure 11 graphically represents the TCO for various vehicle models, delineating the correlation with driving range. The current data are depicted by solid lines, with projections for 2035 represented by dotted lines. Within the 500–1000 km driving range, BETs, particularly those utilizing battery swapping, demonstrate a lower TCO than FCTs. Notably, the trajectory of the TCO increase for FCTs is less steep than for BETs, indicating a potential equilibrium in costs at extended driving ranges. The TCO of FCTs and BETs are expected to converge by 2035, with technological advancements and subsequent cost efficiencies.
Figure 12 elucidates the relationship between the driving range and the TCO, indicating that FCTs and BETs reach a cost parity at approximately 1890 km. With a driving range over 1890 km, BETs demonstrate a cost edge over FCTs, whereas trucks with battery swapping exhibit the lowest TCO consistently across all ranges.
Figure 13 delineates how the TCO is influenced by renewable energy electricity price. In 2035, assuming a standard price of 0.035 USD/kWh, a 10% decrease in electricity prices corresponds to TCO reductions of 4.1% for FCTs, 1.9% for BETs-BC, and 2.2% for BETs-BS. A more substantial 47% decrease in renewable energy prices, to 0.022 USD/kWh, is required to bring FCTs and BETs-BC to cost parity, while the TCO for battery-swapping trucks remains consistently lower across these variations.
4. Conclusions
In the context of China’s renewable energy expansion and truck electrification, this study scrutinizes the total cost of ownership for China’s fuel cell heavy trucks and battery electric heavy trucks from the perspective of the vehicle owner. This study innovatively starts from two important sub-modules, vehicle and energy, and builds the corresponding cost models to ensure the consistency of the TCO assessment boundaries of heavy trucks with different powertrains. The model developed in this study can be used for a cost comparison between FCTs and BETs with the arbitrary provision of vehicle performance parameters and renewable energy tariffs.
This TCO analysis for heavy-duty trucks in China, considering a timeframe up to 2035 and a driving range up to 1000 km, indicates that BETs currently exhibit superior economic performance compared to FCTs. However, a gradual narrowing of this cost disparity can be noted, attributed to advancements in fuel cell technology and associated systems. For a 16 ton truck with a 500 km range, the TCO for FCTs stands at 0.034 USD/ton-kilometer, marking a 122% increase relative to its BET counterpart with comparable battery capacity. Conversely, for a 49 ton truck engineered for a 1000 km range, the TCO for FCTs is quantified at 0.024 USD/ton-kilometer, representing a 36% premium over the BET model. The forecasted TCO for FCTs in the 16 ton truck category is expected to reduce to 0.016 USD/ton-kilometer, which is still 58% above BETs, while for the 49 ton truck variant, the TCO is projected to decrease to 0.012 USD/ton-kilometer, narrowing the gap to a marginal 4.5% when juxtaposed with BETs. The conclusions are drawn as follows.
- (1)
- In the TCO analysis of FCTs, the hydrogen energy price emerges as a crucial economic factor due to its significant contribution to the overall costs. For BETs, vehicle costs, especially those associated with the battery, become predominant as the size class and driving range increase. Thus, cost reduction strategies for FCTs should focus on hydrogen fuel prices, while for BETs, the emphasis should be on reducing vehicle-related expenses. Consequently, policy measures in emerging markets should be tailored to address these distinct areas for FCTs and BETs, with subsidies and R&D investments directed accordingly.
- (2)
- As the driving range extends, the TCO disparity between FCTs and BETs diminishes, reaching parity beyond 1000 km. This study forecasts a cost-equivalent range of 1180 km by 2035, a distance achievable by current diesel trucks, positioning fuel cell technology as a more cost-effective option for long-haul heavy-duty transportation. The price of renewable electricity significantly impacts the economic feasibility of both FCTs and BETs. This study projects that by 2035, if the cost of renewable energy electricity falls to 0.022 USD/kWh, FCTs and BETs with a 1000 km range will reach cost parity, highlighting the crucial role of energy pricing in the competitiveness of these technologies.
- (3)
- Throughout the various scenarios in this study, battery-swapping heavy trucks consistently exhibit optimal economic performance. However, this does not account for infrastructure considerations. The efficiency gain from quick battery swaps in heavy-duty trucks is counterbalanced by the necessity for more frequent battery swapping stations due to the 200 km driving mileage limit. This requirement places greater emphasis on the development and deployment of battery swapping station infrastructure for long-distance transportation.
In the heavy truck sector, both fuel cell and battery electric technologies have distinct strengths and limitations. FCTs excel in long-haul heavy-duty applications, whereas BETs are more suited for shorter ranges and smaller sizes. The transition’s success will hinge on market dynamics, technological progress, and policy support. This study emphasizes the need for ongoing innovation and policy initiatives to ensure this transition is both economically feasible and environmentally sustainable.
Future work to improve the modeling and analysis of the TCO should encompass a broader scope of research subjects, such as hybrid fuel cell heavy trucks that integrate both electric and fuel cell technologies. The current study delineates the cost implications of fuel cells in heavy-duty trucks vis-à-vis battery electric heavy trucks, underscoring the influence of the fuel cell as a standalone power source. It opts for a configuration where the fuel cell serves as the primary power generator. Nonetheless, in real-world applications, hybrid configurations combining fuel cells and batteries could significantly affect the economic viability and efficiency of fuel cell heavy trucks. Investigating such hybrid technological pathways could unveil a wider array of scenarios for the application of FCTs, potentially offering deeper insights into their operational and economic benefits.
Author Contributions
Conceptualization, F.Z. and H.H.; methodology, Z.M. and F.B.; software, Z.M.; validation, F.Z., H.H. and Z.L.; formal analysis, Z.M.; investigation, Z.M.; resources, F.Z.; data curation, F.B.; writing—original draft preparation, Z.M.; writing—review and editing, F.B.; visualization, Z.M.; supervision, F.Z. and H.H.; project administration, Z.L.; funding acquisition, H.H. All authors have read and agreed to the published version of the manuscript.
Funding
This research was funded by the National Natural Science Foundation of China, with the funding account number of 52272371.
Data Availability Statement
All the data adopted in this article are from public resources and have been cited with references accordingly.
Conflicts of Interest
The authors declare no conflicts of interest.
Nomenclature
| BCS | Battery charging stations |
| BET | Battery electric truck |
| BETs-BS | Battery electric trucks with battery swapping |
| BETs-BC | Battery electric trucks with battery charging |
| BSS | Battery swapping station |
| FCT | Fuel cell truck |
| GHG | Greenhouse gas |
| GVW | Gross Vehicle Weight |
| HDT | Heavy-duty truck |
| HRS | Hydrogen refueling station |
| ICE | Internal combustion engine |
| LCOE | Levelized cost of electricity |
| LCOR | Levelized cost of replenishing |
| M&R | Maintenance and Repair |
| RV | Residual value |
| TCO | Total cost of ownership |
References
- SAE-China. Annual Report on Automotive Industry in China (2020); Social Sciences Academic Press: Beijing, China, 2020. [Google Scholar]
- Xue, L.; Liu, D. Decarbonizing China’s Road Transport Sector: Strategies toward Carbon Neutrality; WRI: Beijing, China, 2022. [Google Scholar]
- Lattanzio, R.K. Heavy-Duty Vehicles, Air Pollution, and Climate Change; CRS: Washington, DC, USA, 2023.
- European Commission CO2 Emission Standards for Heavy-Duty Vehicles. Available online: https://ec.europa.eu/commission/presscorner/detail/en/qanda_23_763 (accessed on 14 January 2024).
- Barbosa, F.C. Heavy Duty Diesel Emission Standards Regulation Evolution Review—Current Outcomes and Future Perspectives; SAE Technical Paper; SAE: Warrendale, PA, USA, 2020. [Google Scholar]
- Zhang, X.; Hao, X.; Liu, Y.; Wu, R.; Shan, X.; Li, S. Contribution of Potential Clean Trucks in Carbon Peak Pathway of Road Freight Based on Scenario Analysis: A Case Study of China. J. Clean. Prod. 2022, 379, 134669. [Google Scholar] [CrossRef]
- Ledna, C.; Muratori, M.; Yip, A.; Jadun, P.; Hoehne, C. Decarbonizing Medium- & Heavy-Duty On-Road Vehicles: Zero-Emission Vehicles Cost Analysis; National Renewable Energy Lab: Golden, CO, USA, 2022; p. 1854583.
- Burke, A.F.; Zhao, J.; Miller, M.R.; Sinha, A.; Fulton, L.M. Projections of the Costs of Medium- and Heavy-Duty Battery-Electric and Fuel Cell Vehicles (2020–2040) and Related Economic Issues. Energy Sustain. Dev. 2023, 77, 101343. [Google Scholar] [CrossRef]
- Basma, H.; Buysse, C.; Zhou, Y.; Rodríguez, F. Total Cost of Ownership of Alternative Powertrain Technologies for Class 8 Long-Haul Trucks in the United States; International Council on Clean Transportation: Washington, DC, USA, 2023. [Google Scholar]
- Noll, B.; del Val, S.; Schmidt, T.S.; Steffen, B. Analyzing the Competitiveness of Low-Carbon Drive-Technologies in Road-Freight: A Total Cost of Ownership Analysis in Europe. Appl. Energy 2022, 306, 118079. [Google Scholar] [CrossRef]
- Basma, H.; Rodríguez, F. A Total Cost of Ownership Comparison of Truck Decarbonization Pathways in Europe; International Council on Clean Transportation: Washington, DC, USA, 2023. [Google Scholar]
- Basma, H.; Zhou, Y.; Rodríguez, F. Fuel-Cell Hydrogen Long-Haul Trucks in Europe: A Total Cost of Ownership Analysis; International Council on Clean Transportation: Washington, DC, USA, 2022. [Google Scholar]
- Wang, Z.; Acha, S.; Bird, M.; Sunny, N.; Stettler, M.E.J.; Wu, B.; Shah, N. A Total Cost of Ownership Analysis of Zero Emission Powertrain Solutions for the Heavy Goods Vehicle Sector. J. Clean. Prod. 2024, 434, 139910. [Google Scholar] [CrossRef]
- Mao, S.; Basma, H.; Ragon, P.-L.; Zhou, Y.; Rodríguez, F. Total Cost of Ownership for Heavy Trucks in China: Battery Electric, Fuel Cell, and Diesel Trucks; International Council on Clean Transportation: Washington, DC, USA, 2021. [Google Scholar]
- Wang, B.; Li, Z.; Zhou, J.; Cong, Y.; Li, Z. Technological-Economic Assessment and Optimization of Hydrogen-Based Transportation Systems in China: A Life Cycle Perspective. Int. J. Hydrogen Energy 2023, 48, 12155–12167. [Google Scholar] [CrossRef]
- Zhang, X.; Lin, Z.; Crawford, C.; Li, S. Techno-Economic Comparison of Electrification for Heavy-Duty Trucks in China by 2040. Transp. Res. Part D Transp. Environ. 2022, 102, 103152. [Google Scholar] [CrossRef]
- Zhao, D.; Ren, H.; Chen, C.; Li, Y.; Jin, Y.; Liu, J.; Lv, L. Commercial Vehicles’ Total Cost of Ownership in China, Compared with the U.S.; Energy Foundation China: Beijing, China, 2022. [Google Scholar]
- Basma, H.; Saboori, A.; Rodríguez, F. Total Cost of Ownership for Tractor-Trailers in Europe: Battery Electric versus Diesel; International Council on Clean Transportation: Washington, DC, USA, 2021. [Google Scholar]
- Nair, V.; Stone, S.; Rogers, G.; Pillai, S. Medium and Heavy-Duty Electrification Costs for MY 2027–2030; Environmental Defense Fund, ROUSH: New York, NY, USA, 2022. [Google Scholar]
- Phadke, A.; Khandekar, A.; Abhyankar, N.; Wooley, D.; Rajagopal, D. Why Regional and Long-Haul Trucks Are Primed for Electrification Now; Lawrence Berkeley National Laboratory: Berkeley, CA, USA, 2021.
- Ballard. Fuel Cell Electric Trucks: An Analysis of Hybrid Vehicle Specifications for Regional Freight Transport; North American Council for Freight Efficiency: Fort Wayne, IN, USA, 2020. [Google Scholar]
- Fiquet, F.; King, A.; Skipton-Carter, A.; Bulut, Ö. Future heavy truck propulsion system solutions including their impact on total cost of ownership. In Heavy-Duty-, On-Und Off-Highway-Motoren 2020; Liebl, J., Ed.; Springer Fachmedien Wiesbaden: Wiesbaden, Germany, 2021; pp. 43–65. [Google Scholar]
- Burke, A.; Sinha, A. Technology, Sustainability, and Marketing of Battery Electric and Hydrogen Fuel Cell Medium-Duty and Heavy-Duty Trucks and Buses in 2020–2040; National Center for Sustainable Transportation: Long Beach, CA, USA, 2020. [Google Scholar]
- ITF. Decarbonising Europe’s Trucks: How to Minimise Cost Uncertainty; OECD: Paris, Italy, 2022. [Google Scholar]
- Rout, C.; Li, H.; Dupont, V.; Wadud, Z. A Comparative Total Cost of Ownership Analysis of Heavy Duty On-Road and Off-Road Vehicles Powered by Hydrogen, Electricity, and Diesel. Heliyon 2022, 8, e12417. [Google Scholar] [CrossRef] [PubMed]
- Gilleon, S.; Penev, M.; Hunter, C. Powertrain Performance and Total Cost of Ownership Analysis for Class 8 Yard Tractors and Refuse Trucks; National Renewable Energy Laboratory: Golden, CO, USA, 2022.
- Hao, X.; Ou, S.; Lin, Z.; He, X.; Bouchard, J.; Wang, H.; Li, L. Evaluating the Current Perceived Cost of Ownership for Buses and Trucks in China. Energy 2022, 254, 124383. [Google Scholar] [CrossRef]
- Wang, Z.; Liu, Y.; Lin, Z.; Hao, H.; Li, S. Techno-Economic Comparison on Charging Modes of Battery Heavy-Duty Vehicles in Short-Haul Delivery: A Case Study of China. J. Clean. Prod. 2023, 425, 138920. [Google Scholar] [CrossRef]
- Zhu, F.; Li, L.; Li, Y.; Li, K.; Lu, L.; Han, X.; Du, J.; Ouyang, M. Does the Battery Swapping Energy Supply Mode Have Better Economic Potential for Electric Heavy-Duty Trucks? eTransportation 2023, 15, 100215. [Google Scholar] [CrossRef]
- Hunter, C.; Penev, M.; Reznicek, E.; Lustbader, J.; Birky, A.; Zhang, C. Spatial and Temporal Analysis of the Total Cost of Ownership for Class 8 Tractors and Class 4 Parcel Delivery Trucks; National Renewable Energy Lab (NREL): Golden, CO, USA, 2021.
- SinoSynergy Products and Technology. Available online: https://www.sinosynergypower.com/ (accessed on 18 January 2024).
- SinoHytec Hydrogen Fuel Cell System. Available online: https://www.sinohytec.com/ (accessed on 18 January 2024).
- Marcinkoski, J.; Vijayagopal, R.; Adams, J.; James, B.; Kopasz, J. Hydrogen Class 8 Long Haul Truck Targets; DOE Advanced Truck Technologies; DOE: Washington, DC, USA, 2019.
- NEDO. FCV-HDV Fuel Cell Technology Roadmap; Hydrogen and Fuel Cell Strategy Council: Beijing, China, 2023. [Google Scholar]
- China SAE. Energy-Saving and New Energy Vehicle Technology Roadmap 2.0; China Society of Automotive Engineers: Shanghai, China, 2020. [Google Scholar]
- GUOFUHEE Hydrogen Products. Available online: https://en.guofuhee.com/site/products (accessed on 18 January 2024).
- Chen, S.; Xiao, Y.; Zhang, C.; Lu, X.; He, K.; Hao, J. Cost Dynamics of Onshore Wind Energy in the Context of China’s Carbon Neutrality Target. Environ. Sci. Ecotechnol. 2023, 19, 100323. [Google Scholar] [CrossRef] [PubMed]
- Yang, F.; Xu, C.; Sun, J. Design and Analysis of Parallel Hybrid Electric Vehicles for Heavy-Duty Truck Applications in a Total Cost of Ownership Framework; SAE Technical Paper; SAE: Warrendale, PA, USA, 2018. [Google Scholar]
- Wang, G.; Miller, M.; Fulton, L. Estimating Maintenance and Repair Costs for Battery Electric and Fuel Cell Heavy Duty Trucks; University of California: Berkeley, CA, USA, 2022. [Google Scholar]
- Yunzhe, J.; Chengbin, S.; Yibo, Z.; Wei, Z. Technical and Economic Analysis of Battery Replacement Heavy Truck in Typical Scenarios. J. Ind. Technol. Econ. 2022, 41, 154–160. [Google Scholar]
- China Federation of Logistics and Purchasing Employment Status of Truck Drivers in 2022. Available online: http://www.chinawuliu.com.cn/lhhzq/202304/07/603134.shtml (accessed on 24 December 2023).
- Chu, Y. Leading Cities for New Energy Urban Logistics Vehicles; International Council on Clean Transportation: Washington, DC, USA, 2023. [Google Scholar]
- Ji, R. Optimal Design and Energy Management of Power System for Full-Power Fuel Cell Vehicle. Master’s Thesis, Jilin University, Changchun, China, 2020. [Google Scholar]
- Wang, X. Lifecycle Cost Pricing Method of Hydrogen Energy Considering Carbon Emission. Master’s Thesis, Tsinghua University, Beijing, China, 2023. [Google Scholar]
- Xuan, Z.; Xinye, F.; Zhenyu, W.; Lijun, Z. Hydrogen energy supply chain cost analysis and suggestions. Chem. Ind. Eng. Prog. 2022, 41, 2364–2371. [Google Scholar] [CrossRef]
- Abramson, E.; McFarlane, D. United States EV Fast-Charging Corridor Road Map; Carbon Solutions LLC: Singapore, 2023. [Google Scholar]
- Suzan, S. Unlocking Electric Trucking in the EU: Recharging along Highways; Transport & Environment: Brussels, Belgium, 2021. [Google Scholar]
- Liang, Y. Charge and Battery Swap Pricing Model and Polices of Electric Vehicles. Ph.D. Dissertation, North China Electric Power University, Beijing, China, 2018. [Google Scholar]
Figure 1.
Framework of this TCO analysis.

Figure 2.
Powertrain architecture for FCTs and BETs.

Figure 3.
Relationship between energy consumption rate and GVW.

Figure 4.
Levelized cost of replenishing model.

Figure 5.
Systematic diagram of three types of energy replenishing stations.

Figure 6.
Total cost of ownership under different GVWs and driving ranges.

Figure 7.
Vehicle cost under different GVWs and driving ranges.

Figure 8.
Loading mass evaluation.

Figure 9.
Levelized cost of replenishing.

Figure 10.
TCO results in comparison with existing research.

Figure 11.
Variation in the TCO relative to the driving mileage. (The solid line represents the TCO value for 2023, and the dotted line represents projections for 2035).
Figure 11.
Variation in the TCO relative to the driving mileage. (The solid line represents the TCO value for 2023, and the dotted line represents projections for 2035).

Figure 12.
Impact of driving range variability on total cost of ownership.

Figure 13.
Impact of renewable electricity pricing on total cost of ownership.


Table 1.
Overview of TCO research of HDTs.
| Regions | TCO Components | Energy Price Assumptions | Main Findings |
|---|---|---|---|
| US [7] | Truck purchase; Fuel; O&M | Charging: 0.18 USD/kWh Hydrogen: 4 USD/kg | The cost of BETs and FCTs can still be equivalent to ICE counterparts by 2035 even without policy intervention. |
| US [8] | Truck purchase; Fuel; O&M | Charging: 0.27 USD/kWh Hydrogen: 7 USD/kg | BETs will achieve TCO parity with their ICE counterparts by 2025. FCTs will achieve TCO parity with their ICE counterparts by 2030. |
| US [9] | Truck purchase; Fuel; O&M; Taxes; Insurance | Charging: 0.17–0.30 USD/kWh Hydrogen: 11 USD/kg | By 2030, the TCO for long-haul BETs is expected to be more advantageous, while FCTs might not reach cost parity with conventional trucks until after 2040. |
| EU [10] |
Truck purchase; Fuel; O&M; Tolls; Insurance | - | BETs have already achieved TCO parity with ICE counterparts with supportive policies including toll reductions and purchase subsidies. |
| EU [11] | Truck purchase; Fuel; O&M; Tolls; CO2 Charges; Insurance | Charging: 0.21 EUR/kWh Hydrogen: 10.3 EUR/kg | BETs are expected to become the most cost-effective decarbonization route for trucks in Europe and are likely to achieve parity with diesel trucks by 2030. |
| EU [12] | Truck purchase; Fuel; O&M; Taxes | Hydrogen: 3.50–7.95 EUR/kg | In Europe, the TCO of long-haul FCTs can be equivalent to diesel trucks by 2030, provided that the price of green hydrogen drops to around 4 EUR/kg. |
| UK [13] | Truck purchase; Fuel; O&M; Taxes; Insurance | Charging: 0.177 GBP/kWh; Hydrogen: 5.80 GBP/kg | For short-haul transportation, BETs are more competitive in the market, while FCTs may be more suitable for long-haul transportation. |
| China [14] | Truck purchase; Fuel; O&M; Incentives | Charging: 0.80–1.20 RMB/kWh Hydrogen: 49.6–75.7 RMB/kg | By 2035, BETs could achieve cost parity with diesel trucks in all segmented markets; by 2040, the TCO of FCTs will be almost equivalent to diesel trucks. |
| China [15] | Truck purchase; Fuel; O&M; Insurance; Environmental cost | Hydrogen: 30 RMB/kg | With the reduction in hydrogen fuel costs, FCTs will become a more economically viable option. |
| China [16] | Truck purchase; Fuel; O&M; Insurance; Environmental cost | Charging: 0.51–0.77 RMB/kWh Hydrogen: 31.81 RMB/kg | The cost of FCTs has decreased the most, but they are still expected to have the highest cost by 2040. |
Table 2.
Key assumptions for vehicle purchase and operation.
| Vehicle Type | Unit | Rigid | Articulated | |
|---|---|---|---|---|
| Gross Vehicle Weight | kg | 16,000 | 25,000 | 49,000 |
| Driving mileage | km | 500/800/1000 | ||
| Vehicle lifespan | yrs | 5 | ||
| Daily operation time | hrs | 20 | ||
| Average speed | km/h | 60 | ||
| Working days per year | days | 260 | ||
| Glider cost | USD | 7065 | 18,000 | 34,487 |
| Drivetrain cost | USD/kW | 11 | ||
| FCT special | ||||
| Current | 2035 | |||
| FCS cost | USD/kW | 368 | 74 | |
| HSS cost | USD/kg | 662 | 294 | |
| HV battery cost | USD/kWh | 176 | 118 | |
| BET special | ||||
| Battery system cost | USD/kWh | 147 | 95 | |
Table 3.
Parameters of the FCHDVs.
| Parameter | Unit | Value | ||
|---|---|---|---|---|
| 16 t | 25 t | 49 t | ||
| Vehicle parameters | ||||
| Gross mass | kg | 16,000 | 25,000 | 49,000 |
| Number of axles | 2 | 3 | 2 + 4 | |
| Windward area | m2 | 7.7 | 7.76 | 7.8 |
| Rolling resistance | 0.01 | |||
| Drag coefficient | 0.9 | |||
| Performance indicators (full load) | ||||
| Maximum speed | km/h | 110 | 110 | 110 |
| Maximum gradient | rad | 20 | 20 | 20 |
| Acceleration time | s | 20 | 20 | 20 |
Table 4.
Key assumptions for energy replenishing stations.
| Parameter | Unit | Value |
|---|---|---|
| Maximum number of vehicles served | Vehicles/hour | 8 |
| Daily operation time | hrs | 24 |
| Working days per year | days | 300 |
| Station lifespan | yrs | 10 |
| Station utilization rate | 50% | |
| Grid capacity expansion (for BCSs, BSSs) | USD/MW | 147,059 |
| Initial equipment cost for HRSs | ||
| Hydrogen storage | USD/kg | 882 |
| Hydrogen compression | USD | 294,118 |
| Hydrogen dispenser and cooling | USD | 441,176 |
| Other | USD | 147,059 |
| Initial equipment cost for BCSs | ||
| Charging rate | C | 2 |
| Number of charging pile | 5 | |
| Price of charging pile | USD | 257,059 |
| Initial equipment cost for BSSs | ||
| Price of battery swapping equipment | USD | 441,176 |
| Number of backup batteries | 32 | |
Disclaimer/Publisher’s Note: The statements, opinions and data contained in all publications are solely those of the individual author(s) and contributor(s) and not of MDPI and/or the editor(s). MDPI and/or the editor(s) disclaim responsibility for any injury to people or property resulting from any ideas, methods, instructions or products referred to in the content. |
© 2024 by the authors. Licensee MDPI, Basel, Switzerland. This article is an open access article distributed under the terms and conditions of the Creative Commons Attribution (CC BY) license (https://creativecommons.org/licenses/by/4.0/).
Share and Cite
MDPI and ACS Style
Mu, Z.; Zhao, F.; Bai, F.; Liu, Z.; Hao, H. Evaluating Fuel Cell vs. Battery Electric Trucks: Economic Perspectives in Alignment with China’s Carbon Neutrality Target. Sustainability 2024, 16, 2427. https://doi.org/10.3390/su16062427
AMA Style
Mu Z, Zhao F, Bai F, Liu Z, Hao H. Evaluating Fuel Cell vs. Battery Electric Trucks: Economic Perspectives in Alignment with China’s Carbon Neutrality Target. Sustainability. 2024; 16(6):2427. https://doi.org/10.3390/su16062427
Chicago/Turabian StyleMu, Zhexuan, Fuquan Zhao, Fanlong Bai, Zongwei Liu, and Han Hao. 2024. "Evaluating Fuel Cell vs. Battery Electric Trucks: Economic Perspectives in Alignment with China’s Carbon Neutrality Target" Sustainability 16, no. 6: 2427. https://doi.org/10.3390/su16062427
Note that from the first issue of 2016, this journal uses article numbers instead of page numbers. See further details here.