
Social Life Cycle Assessment of Laser Weed Control System: A Case Study

Institute for Ecology of Industrial Areas, Kossutha 6 St., 40-844 Katowice, Poland
*
Author to whom correspondence should be addressed.
Sustainability 2024, 16(6), 2590; https://doi.org/10.3390/su16062590
Submission received: 5 February 2024
/
Revised: 13 March 2024
/
Accepted: 19 March 2024
/
Published: 21 March 2024
(This article belongs to the Special Issue Intelligent Agricultural Technologies and Corresponding Equipment)
Abstract
:Agriculture is an important sector of the European Union in social, economic and environmental terms. To ensure the sustainability of the sector, improvements are needed in key operations. Weeding is one of the most important activities affecting farm productivity, farmer safety, food safety and security, and the state of the environment. New technical and organizational solutions are needed to achieve the goals of the EU policy for sustainable agriculture. One of the advanced techniques is laser-based weed control. It is important to fully understand the impact of the introduction of these techniques on markets and agricultural practices in the context of sustainability. For this reason, a social life cycle analysis (S-LCA) was carried out. The method applied in the study was based on a participatory approach. The assessment was carried out from three perspectives: the general society, the farmers and the business perspective in relation to agriculture. Expert interviews based on questionnaires and workshops were conducted to gather opinions on the impact of new laser technology on specific aspects of its implementation. The results show generally positive effects from all perspectives, especially from the farmers’ perspective. From the farmers’ point of view, the most favored factors influencing the widespread introduction of WLAT are the economic consequences, the most important of which are the production costs associated with the introduction of the new technology. According to business experts, the perspective of business development, with particular emphasis on new prospects for businesses and development, is the most important factor. The quality of life and the environment are most valued by society.
1. Introduction
Agriculture faces many challenges in the second decade of the second millennium. These are of an ecological, social and economic nature. Agriculture must become more productive due to the growing population and limited agricultural land. At the same time, there are serious environmental threats related to climate change (droughts, floods) and the impacts that need to be reduced, such as the reduction in greenhouse gas emissions, biodiversity loss, and soil erosion and pollution. In economic terms, the rising costs of agricultural production are an important factor for the future development of agriculture [1].
Weed control is an important part of agricultural production that has an impact on farm yields. Weeds are the most important biotic constraints. In general, weeds represent the greatest potential yield loss for crops [2]. Weeds compete with crops for sunlight, water, nutrients and space. They also harbor insects and pathogens that attack crops. The need for new, more effective weed control solutions is driven by factors such as the following: (1) strict regulations on chemical pesticides, (2) highly herbicide-resistant weeds, (3) lower production costs in the long term.
There are many factors, including EU policy, that determine the need for new weed control solutions. This is particularly true for the use of chemicals, including herbicides, in weed control. European policy tends to reduce or eliminate their use in agriculture. The use of herbicides on organic farms is already banned or being reduced in Europe [1,3,4,5], stimulating changes in the cultivation systems. In addition, consumer habits, expectations and concerns about food safety are constantly increasing. Changes in production systems are needed to meet these demands. Herbicide resistance, environmental concerns and stricter regulatory requirements are increasing the need for more precise and site-specific weed control strategies.
To meet the challenges, new technological opportunities are emerging in the agricultural sector, including weed control. There have been significant advances in agricultural technology and the development of new techniques. The integration of these techniques with machine learning approaches enables the use of innovative tools to control weeds more effectively in a site-specific approach [6,7]. These are both mechanical tools and laser-based techniques that use high energies and are an alternative to the use of chemicals to meet the challenges of sustainable production. The innovative precision solutions are designed to detect, identify and successfully control problematic weed species. They make it possible to maximize the effectiveness of weed control while reducing the potential impact on the environment [8].
One of the newly developed weed control methods is laser-based weed control systems. Proof of concept dates back to the 1970s [9]. A laser beam directed at weeds can be an effective method of weed control, providing an alternative to herbicides [10]. A laser is a device that emits light by optical amplification based on the stimulated emission of electromagnetic radiation. Collimated laser beams can be focused on extremely small spots, resulting in a very high irradiance. The divergence and shape of the beam can be adjusted using optics to enable more precise energy delivery for weed control. A laser beam directed at a weed plant heats the plant tissue, increases the temperature of the water in the plant cells and thereby damages or kills the plant [11]. Different types of lasers were used for experiments on weed control: the carbon dioxide laser (CO2 laser), the diode laser and the fiber laser [6]. With both CO2 and fiber lasers, the light energy is strongly absorbed on the surface of the plant, leading to fatal damage. Special attention has been paid to the high-power thulium fiber laser. For weed control, a thulium-doped fiber laser emitting at a wavelength of 2 μm is more advantageous, as the radiation penetrates deeper into the plant tissue through the epidermis [11].
To achieve the high efficiency of a laser system, identification of the targeted weed plants is essential. Artificial intelligence-based recognition tools make it possible to distinguish between weeds and crops in agricultural environments in real-time [12]. With more advanced technologies, the meristem can be recognized with the help of high-resolution cameras, and the positioning can be controlled with precise laser scanners [11].
The use of autonomous mobile platforms also increases the possibilities for more robust solutions. Research into laser weeding technology has increased, and some field robots are now entering the market (e.g., https://carbonrobotics.com/ (accessed on 4 February 2024)).
The widespread adoption of innovative tools such as laser-based weeding equipment in agriculture may have far-reaching impacts on society on the one hand, and socio-economic barriers to their adoption may occur on the other. New agricultural technologies can bring potential economic and environmental benefits, but advanced disruptive approaches aimed at applying new technologies can also be expected to have societal impacts [13,14,15,16].
To fully understand and implement these novel strategies for weed control in agriculture, various issues need to be explored, as innovation encompasses many aspects: technical, environmental, social and economic. It is important to understand how certain solutions need to be combined in an efficient way; what impact they have on the environment, society and economy; and how effective they are in controlling weeds. In addition, technological innovation affects organizational structures by disrupting markets, changing the relative importance of resources, challenging the learning capacity of organizations and changing the terms of competition [17]. Technological innovation brings benefits to society, but at a cost, as it is seen as an important factor in problems such as climate change, ecological imbalance and increasing pollution, as well as an effective means of solving environmental and sustainable development problems [18]. In addition, the diffusion of technological innovations in agriculture should be better understood for specific agricultural solutions. Diffusion of innovation is a process by which new agricultural technologies, inventions and achievements spread from the source of innovation to the surrounding environment and are adopted and utilized by most farmers and agricultural enterprises [19]. In contrast to technological innovation in industry, the object of agricultural innovation has the characteristics of public goods or quasi-public goods, the process of agricultural innovation has discontinuity and relative independence of innovation relations, and the user system of agricultural innovation has unique characteristics [20].
Therefore, the introduction of innovations and technologies in the agricultural sector is a complex mechanism [21]. The process of technology diffusion comprises several phases: awareness, interest, evaluation, trial, adoption and confirmation. Technology diffusion encompasses the creation, accumulation and dissemination of technological knowledge through interaction between different actors. The process of innovation and technology diffusion takes into account the aspects of community structure, culture and farmer capacity [22]. Innovations include not only explicit, formal knowledge but also tacit knowledge from learning by doing and the use [23]. According to Rogers’ ‘Technology Diffusion Model’ and ‘Technology Adoption Life Cycle’, five ‘ideal types’ of the social system are distinguished: innovators, early adopters, early majority, late majority and laggards [24]. For the introduction of a new technique, the importance of relative advantage for a new product or technology is indicated, as well as overall compatibility, relative ease of understanding and adaptation, observable and tangible status, and ability to pass a product test [25]. The pattern and trajectory of innovation are recognized as sector-specific and even country-specific [23].
Technology transfer only brings an expansion of knowledge between companies, institutions and farmers with the transfer or exchange of technologies [26]. Technology transfer in agriculture plays a crucial role in increasing farmers’ productivity and income generation. It refers to the marketability of technology, the development of new technologies and their commercialization [27]. The introduction of innovative weed control methods depends on ecological, environmental and social aspects, among others [28].
Diffusion and transfer of innovation are hampered by barriers to the introduction of technologies. The main obstacle is of an economic nature and is related to the costs of introduction and the subsequent training and implementation costs [29]. For example, larger farmers are more likely to adopt a particular innovation and there is a positive correlation between farm profits and adoption, emphasizing the potential for cost reduction [30]. In addition to economic barriers, there are also socio-economic, organizational, institutional and behavioral barriers [31]. Innovation can be influenced by socio-economic factors such as the user’s age, level of education, gender and degree of information [32]. Barriers to adoption are also technical issues related to equipment and software, access to services and the lack of compatibility of equipment with existing farming practices. The institutional context itself may be important [33]. There are also physical barriers related to the agro-ecological conditions of technology use. Cultural barriers (i.e., habits, consumer choices, market uncertainty), as well as limited institutional support, can also be important [30]. Subsidies, as well as more indirect measures such as support through information, can lead to increased adoption of new technologies [30]. Obstacles related to the cognitive sphere should also be considered, emphasizing the importance of the farmer’s perception [18,28,31,34,35].
New agricultural technologies generally and, in certain cases, have potential ecological and environmental benefits. The advantages for farmers lie in the productivity and profitability of the farm. The automation of machinery improves comfort and reduces the environmental impact of agricultural activities [36]. It can influence demographic change in the sector [15,37], have an impact on development opportunities in rural areas and improve the public image of agriculture. Innovation offers farmers the opportunity to adapt better to the political requirements of environmental protection [16].
There is little research on the introduction of precision technologies in a broader context [38,39]. The impact of this new agricultural model, which is based on a shift from traditional to intelligent farming methods, has yet to be fully explored [13]. Issues related to farmers’ social and business perspectives need to be clarified as part of the implementation into wider agricultural practice. Further research is needed to understand group behavior and collective action [30]. The socio-economic aspects of the introduction of crop robots are not yet well-researched in this area. The growing interest in the use of agricultural robots requires proper assessment to better understand the societal impacts, including potential hazards and benefits. The complexity of agricultural sustainability requires holistic assessments to understand the dynamic interactions between agriculture, the economy, society and the environment [40]. Innovation is widely recognized as a factor for sustainable development [36]. Therefore, a better understanding of the impact of new technologies on sustainability is also needed [41].
To assess the level of sustainability, a number of tools have been developed to evaluate different types of impacts resulting from the life cycles of goods and services. There are many methods to analyze the impact of new technologies in agriculture on the different dimensions of sustainability—economic, social and environmental. A comprehensive overview of the methods was conducted by Barrientos-Fuentes and Berg [42]. In principle, sustainability in agriculture must be considered within the framework of life cycle thinking (LCT) [43].
Within this framework, the social life cycle analysis (S-LCA) enables the assessment of social impacts. It can be combined with life cycle assessment (LCA), which is applicable to environmental goods and services, and life cycle costing (LCC), which is used to analyze all relevant costs expressed in monetary terms.
The methodology of S-LCA is not standardized, as is the case with the environmental and economic methods: life cycle assessment (E-LCA or LCA) and life cycle costing (LCC). There is neither consensus on the methods of social impact assessment nor clarity on the underlying concepts of social sustainability. As a result, many different methods have been proposed, with different objectives focusing on different aspects [44]. Some of the methodological approaches of the S-LCA are based on the knowledge of the experts and their active participation [45]. This is due to the social effects, which depend not only on the production processes themselves but often also on the behavior of the actors and the specific contexts.
In this study, we conducted a social life cycle assessment to analyze the impact on sustainability and identify the barriers and opportunities for laser-based weed control methods. The aim of the study was to determine the impact of the use of laser-based techniques in a broad social context on the sustainability of weed control in agriculture from a life cycle perspective. It was carried out in accordance with the UNEP guidelines for S-LCA: The Life Cycle Initiative of the United Nations Environment Program and the Society for Environmental Toxicology and Chemistry (UNEP-SETAC) [46]. In this study, we proposed a specific approach in which multi-criteria tools were used in an S-LCA application based on expert knowledge in a qualitative and participatory way.
2. Materials and Methods
The subject of the study is a general concept for laser-based autonomous systems. Laser-based weed control robots are being developed, and some are already commercialized [11].
In the study, we used the prototype of the WeLASER technology as an example and proof of concept. The invention was developed, integrated and tested as part of the HORIZON 2020 project “Sustainable weed management in agriculture with laser-based autonomous tools—WeLASER”. It consists of a mobile autonomous platform, a laser weeding device and supporting components. The WeLASER weeder is an autonomous mobile robot that uses a high-power laser for weed control. It is a complex solution that uses autonomous systems, artificial intelligence (AI) and advanced geo-positioning. As part of the WeLASER project, a weed control system with two lasers was tested to achieve Technology Readiness Level 7 (TRL 7). In order to be marketed, the product must reach Technology Readiness Level 9 (TRL 9) in further development.
We used the social life cycle assessment (S-LCA) in the study as a method that can be applied to assess the social and sociological aspects of products and their actual and potential positive and negative impacts along the life cycle. It considers the extraction and processing of raw materials, production, distribution, use, reuse, maintenance, recycling and final disposal. The S-LCA uses general and site-specific data, which can be quantitative, semi-quantitative or qualitative. Although the S-LCA follows the ISO 14040 [47] framework, some aspects differ, are more common or are expanded at each stage of the study.
We followed the UNEP guidelines, prepared by the United Nations Environment Program Life Cycle Initiative—Society for Environmental Toxicology and Chemistry [46,48] in relation to S-LCA, to define the general framework of the study. The UNEP guidelines propose a methodology for the preparation of life cycle inventories ([email protected]). It should be noted that there is no agreed S-LCIA methodology for the selection of impact categories and the measurement of indicators [49]. The UNEP guidelines proposed a top-down approach to S-LCIA. Despite the importance of including social aspects in LCA studies, no consensus has yet been reached on a specific methodology for S-LCA. Different and sometimes divergent theoretical and practical approaches have been proposed [49,50]. Publications dealing with the social aspects of crop robots focus heavily on technology and programming. Publications dealing with ecological or socio-economic aspects are rare despite the overall growing interest in crop robots [51].
Therefore, in the current study, we considered a more robust approach, consistent with the conceptual framework of LCT, which enables the prediction of the social consequences of decisions related to the production, use and recycling of products [50]. A hybrid approach combining top-down and bottom-up methods to determine the indicators was applied following some authors [52]. In addition, we integrated a participatory approach into the S-LCA [53,54] in order to obtain the opinions of the various interest groups and identify relevant impact indicators on this basis. The applied approach to use a unique assessment tool is based on two steps of an S-LCA [49], which are as follows: (1) selecting groups of affected actors, categories, subcategories and their relationship to each other; (2) determining the importance of each category and subcategory for a certain number of different stakeholders. We used Multi-criteria decision analysis (MCDA) to assess the impacts. The categories and subcategories were weighted based on calculations performed using the analytic hierarchy process (AHP) approach. The study was conducted in the years 2021–2023.
2.1. Methodological Concept
The methodological approach was structured according to the general scheme of S-LCA in four steps: (1) definition of goal and scope; (2) life cycle inventory; (3) life cycle impact assessment; (4) interpretation [55]. The expert-based methodology applied has a semi-quantitative character with specific methods used for each step. The overview of the method used in the study is shown in the following figure (Figure 1). The S-LCA of laser-based weed control technology is as follows:
- Based on the general LCA framework [47];
- Integrates a participatory approach and multi-criteria analysis tools;
2.1.1. Goal and Scope Definition
To determine the key elements of the S-LCA, including its objective, scope key categories and subcategories of assessment, a literature review on the application of innovative techniques in agriculture was conducted, and an interaction with stakeholders was carried out in a participatory approach.
The overall objective of the study was to determine the potential impact of the widespread adoption of laser-based techniques in agriculture, taking into account the context of societal sustainability in their implementation from a life cycle perspective. The study focused on the well-being and quality of life of farmers, society and businesses. The WeLASER technique was used in the study as an example of the specific class of weeding laser-based autonomous tools.
A literature review formed the information base on which the specific methodology tailored to the purpose of the study was developed. The review included peer-reviewed literature from scientific journals and officially published literature, analyzing current statistics and literature relevant to the contexts studied, as well as personal interaction with precision agriculture experts.
Focus groups were formed to combine the expert knowledge with the opinions of representatives of farmers, consultants, agricultural advisors, business representatives (machinery dealers, food industry, and farming service providers), NGOs and public administration. The aim was to involve representatives of different interest groups from three perspectives: farmers, society and business in the process of identifying key areas of impact assessment.
Four Focus Group Interviews (FGI) workshops were held as part of the WeLASER project in the years 2021 and 2022. The workshops were organized online at the European level and in three regional contexts: Poland, Belgium and Spain. Each of the groups was attended by 15–25 representatives of business, non-governmental organizations, public administration, farmers and farmers’ associations and research institutions (D1.3 available at www.welaser.eu). The FGI workshops consisted of two parts: (1) structured discussion and (2) SWOT analysis. The results of the SWOT analysis are presented and analyzed in Tran et al. [56].
At the events, strengths, weaknesses, opportunities and threats of implementing laser-based weed control systems in relation to specific stakeholder groups, societal sectors, barriers, opportunities and benefits were identified, characterized and assessed. Unpublished results from the structured discussion part of the workshops were also used in the current study. Both sources provided valuable information for structuring the assessment hierarchy. These were evaluated in conjunction with the results of the literature review and formed the basis for the elaboration of the methodological details of the S-LCA approach.
In our assessment, we assumed that laser-based weed control technologies (unmanned, autonomous weed control with laser energy) will be widely used in agricultural practice in Europe. Weed control was considered an activity in the whole cycle of crop production that enables the crop to be produced at a sufficient level according to current agricultural practice. The scope of the assessment covered all potential applications of laser-based weed control technology in agricultural cropping systems—to the best of the experts’ knowledge.
In our analysis, we considered social, ecological and economic aspects within the framework of three social perspectives. According to [57], S-LCA considers “human well-being” as an overarching social dimension. We defined three specific dimensions (perspectives) related to the use of agricultural machinery in crop production: societal quality of life, well-being from the farmer’s perspective, and corporate performance related to economic interest and corporate responsibility within the life cycle of laser-based weed control systems. The perspectives were unique to a specific group of stakeholders, and the assessment was conducted separately for each perspective (Figure 1).
In qualitative terms, we focused our evaluation on the two elements that form the system boundary:
- The life cycle phases of the machine robot, including production (need for critical materials, use and disassembly of the robot);
- Crop life cycle (crop production and quality of processed food—consumer perspective).
2.1.2. Inventory and Characterization Analysis
Based on the defined objective, scope and key questions identified in the previous step, we conducted further analysis using qualitative (if available, statistical data) and quantitative data. Direct measures were developed to conduct an assessment through questionnaires with open-ended questions with evaluation metrics (5 scales). Secondary sources were used in the development of the questionnaire and as structured background material for the interviewer to moderate the discussion during the interviews. We developed questionnaires as a basis for direct expert interviews. Interview scenarios were prepared to organize the discussion with the invited experts (Table 1).
Three expert groups were formed using a qualitative technique to include experts in specified areas of experience. Taking into account the system boundaries of this study, the following groups of experts were formed in accordance with the recommendations of UNEP-SETAC [1]:
- Farmers and farm workers: people who cultivate their own and other people’s crops.
- Society: local community and European society representatives.
- Institutions that support the business sector in rural areas: business organizations and support institutions that improve the knowledge and skills of farmers.
The structure of the expert groups is described in Table 2.
2.2. Approach to Impact Assessment and Interpretation of Results
As part of the WeLASER project, we conducted face-to-face surveys on the market introduction of the weeding laser autonomous tools (WLAT), i.e., weed control systems based on the application of laser technology, precise positioning, artificial intelligence and an autonomous mobile platform. They took place in the year 2023. The aim of the assessment was to evaluate the impact of the market introduction of WLAT on different fields and domains of life, which were evaluated by experts from three perspectives. In addition, the study aimed to determine the strength of the experts’ preferences between the fields and domains, which was used in assessing the strength of the evaluated impact. The weights calculated by the experts were used to re-estimate the evaluated impacts of WLAT on the analyzed domains and perspectives. The perspectives included in the study are as follows: farmers (P1), business (P2) and society (P3). Fifteen experts participated in the study, five of whom represented each perspective.
The first perspective, P1, included farmers working on the farm.
The second perspective, P2, included a sales representative of companies; an innovation facilitator in the agricultural extension center; a representative of the fruit and vegetable processing sector; a representative of the company engaged in consulting, research and development activities, training, and support for farmers; and a representative of the consulting company providing best agricultural practices.
The third perspective included the coordinator of the organic food systems program and a representative of the research organization, a representative of the NGO (network) and the research organization, a representative of the Chamber of Agriculture (board), a member of the board of the European organization working in the field of organic food and farming, and a representative of the NGO.
Experts from these perspectives were asked about the topics relevant to them. The topics were divided into fields, which represented specific questions, and domains, which represented a set of questions. Thus, we have a 3-level structure of analysis.
The farmer’s perspective (P1) consists of 3 domains (D11, D12, D13).
Domain D11. Health and working conditions contain four following fields: F111. The farmer’s working time; F112. Comfort of work; F113. Work safety and accidents; F114. Health conditions.
Domain D12. Economic consequences contain four following fields: F121. Good quality agricultural products that meet customers’ needs; F122. Farms’ productivity per hectare; F123. Demand on seasonal/temporary workers; F124. Production costs.
Domain D13. Risk for farm operations contains three following fields: F131. Risks related to unexpected functional limitations of the device; F132. Farmers’ liability for damage to third-party property caused by the device; F133. Risk of theft or damaging the device.
The business perspective (P2) consists of 4 domains (D21, D22, D23, D24).
Domain D21. Profitability contains three following fields: F211. Profits of companies producing the machines; F212. Profits of agri-food and food processing industry; F213. Profits of agricultural producers/farmers/producers groups.
Domain D22. Business risks contain three following fields: F221. Manufacturer’s responsibility for product malfunctions (complaints, service); F222. Manufacturer’s responsibility for the damage to the user or third-party property caused by the device; F223. Manufacturer’s risk for the supply chain interruption in manufacturing processes.
Domain D23. Environmental performance of companies contains three following fields: F231. Demand on critical resources; F232. Manufacturer’s responsibility for waste management of devices in its post-consumption phase; F233. Production’s pressure on the environment.
Domain D24. Perspectives of business development contain three following fields: F241. Creation of new jobs; F242. New prospects for the company’s development; F243. Strengthening competencies of organizations, companies and workers.
The perspective of society (P2) consists of 3 domains (D31, D32, D33).
Domain D31. Quality of life and environment contains three following fields: F311. Quality and safety of agricultural products; F312. State of the environment; F313. Affordability of agricultural products for the society.
Domain D32. Demographic consequences contain three following fields: F321. Young people’s interest in running a farm; F322. Women’s interest in working in agriculture; F323. The demand for low-skilled labor.
Domain D33. Just agriculture transformation contains three following fields: F331. The agrarian structure of agriculture; F332. Development of ecological (organic) farms; F333. Economic diversification of rural areas.
The experts were asked to assess the impact of the weeding laser autonomous tools (WLAT) on a given field, rating the impact on a five-point ordinal scale. The scale started with 1 point for very negative impact, 2 points for negative impact, 3 points for neutral impact, 4 points for positive impact and ended with 5 points for very positive impact.
Based on the results of the impact evaluation of 5 experts, the average impact on a given field was calculated in the form of the arithmetic mean using the following formula:
where n is the number of individual assessments (n equals 5), xi is the assessment of the impact by one of the five experts.
Based on the average impact on the fields, the average impact on a specific domain was calculated. Consequently, based on the average impact on the domains, the average impact on a particular perspective was calculated.
In these calculations, n in Formula (1) stands for the number of fields in a particular domain (first case) or for the number of domains in a particular perspective (second case).
When assessing the average impact (fields, domains or perspectives), the following ranges were used to classify the results obtained: (i) 1.0 < < 1.5—very negative impact; (ii) 1.5 ≤ < 2. 5—negative impact; (iii) 2.5 ≤ < 3.5—neutral impact; (iv) 3.5 ≤ < 4.5—positive impact; and (v) 4.5 ≤ < 5.0—very positive impact.
The general approach of the analytic hierarchy process (AHP) [129,130,131,132] was used to evaluate the experts’ preferences (priorities) expressed in weights (Figure 3).
For two hierarchical levels, domains and fields, the weights were calculated using pairwise comparisons. A narrower and more detailed scale was used, as it was assumed that irrelevant domains and fields were excluded before the survey was conducted. The scale of preferences and the corresponding scores are shown in Table 3.
When calculating the weights, a consistency factor was calculated to ensure logical consistency between the preferences. Each expert had to express their preference by pairwise comparison of fields of a certain domain and by pairwise comparison of domains of a certain perspective. The weights themselves were calculated automatically in Excel according to the procedure developed by the authors. In this way, the importance of a particular field and domain for a particular expert was determined.
The weights calculated by the experts expressing the importance of a particular field or domain were averaged. Formula (1) was used for these calculations.
After calculating the weights, let us call them expert weights, the next step was to calculate the relative differences in the weighting values according to the formula:
where are the expert weights, and are the initial values of the weights, calculated according to the following formula:
where is the number of fields (F) in a given domain (D) or the number of domains (D) in a given perspective (P).
Standardized differences in the weighting values were used to assess the strength of the evaluated impacts. These standardized differences were calculated using the formula:
where is the arithmetic mean of the differences in the weighting values calculated for a particular perspective, and is the standard deviation of the differences in the weighting values also calculated for a particular perspective.
It was assumed that if < −1, it means that it is a weak evaluation; if > 1, it means that it is a strong evaluation; otherwise, it means a normal strength of evaluation.
The weights calculated by pairwise comparison were also used to check whether the introduction of preferences affects the evaluated impacts. The weighted means of the impacts () were calculated according to the formula:
where is the score of evaluated impact, and is the calculated weighting for particular field or domain. In this case, is the number of fields in the domain or the number of domains in the given perspective.
All calculations were performed with MS EXCEL 2019.
3. Results
The results relate to the three main objectives. Since the changes in the weights were used to assess the strength of the impact evaluation, the description of the results begins with the analysis of the weights and their changes. Thus, the first set of results refers to the average preferences (weights) of the three perspectives for each domain and field, representing individual questions and groups of questions. In Table 4, Table 5 and Table 6, we used the symbols from Formula (2), i.e., denotes the initial weights, is the expert weights and is the relative differences in the weights.
3.1. Experts’ Preferences between Domains and Fields in Three Perspectives
From the farmer’s perspective, the most important domain is the economic consequences (D12). It has increased in importance by about 20% compared to the baseline (Table 4). Problems related to health and working conditions (D11) have not changed significantly in importance (loss of about 2%), and the least favored domain in this perspective is risk to farm operations (D13). It lost about 18% in importance.
In the first domain (D11) of this perspective, the most preferred field (problem) is work safety and accidents (F113). Its importance has increased by 16%. Health conditions (F114) have gained 9.5% in importance and are in second place in this group. Interestingly, comfort of work (F112) is considered the least important, having lost 13.7% of its importance.
In the second domain (D12), production costs (F124) are considered most important. With the recalculated weights, they have gained 35% in importance, which represents the highest increase in this perspective. The highest loss of importance in this perspective (26.5%) concerns the productivity of farms per hectare (F122) and is also the highest loss in perspective P1.
In the last domain (D13) of this perspective, the highest increase in importance is recorded for risks in connection with unexpected functional limitations of the device (F131) (around 20%). The greatest decrease in importance relates to the farmer’s liability for damage to third-party property caused by the device (F132) (approx. 15%).
Table 5 shows the original weights, the weights of the experts representing the preferences from the business perspective (P2) and the percentage changes between the two weights.
From a business perspective, perspectives of business development—D24 (approx. 32% increase in importance) and profitability—D21 (approx. 15%) are more favorable domains, while business risk—D22 (approx. 23% decrease) and environmental performance of companies—D23 (24% decrease in importance) are less favorable.
Within the first domain (D21), the most important field (problem) is the profit of companies that manufacture machinery—F211 (approx. 45% increase in importance), and the least important is the profit of the agricultural and food processing industry—F212 (58% decrease in importance). These two values represent the biggest change in the importance of the field in perspective P2.
In the second domain (D22) of this perspective, it can be observed that the highest increase in importance relates to the manufacturer’s responsibility for the product’s malfunctions (complaints, service)—F222. This field has increased in importance by 32.5%. On the other hand, the manufacturer’s risk for supply chain interruption in manufacturing processes has lost the most importance—F223 (minus 22.4%).
In the third domain (D23), the changes in importance are the smallest in this perspective (P2). The highest increase in importance (7.9%) is observed for the manufacturer’s responsibility for waste management of devices in its post-consumption phase (F232). The highest decrease in importance (approx. 10%) relates to the demand for critical resources (F231).
In the last domain (D24) of perspective P2, we also observe considerable changes in the importance of particular fields (problems). We note that in this domain, the most important field is new prospects for company development—F242 (increase in importance by 40.5%), and the least important issue is the creation of new jobs—F241 (decrease in importance by 36.5%).
The third table (below) contains the initial weights; the expert weights, which represent the preferences from the perspective of society (P3); and the percentage changes between the initial weights and the expert weights (Table 6).
Within the third society perspective (P3), the domain of quality of life and environment (D31) is rated as the most important. It has gained 25.5% in importance. The domain of demographic consequences is the least important. Its importance has decreased by 32.4%.
Within the first domain (D31), the state of the environment is the most important and has increased in importance by around 9.2%. The field (problem) of quality and safety of agricultural products recorded the sharpest decline in importance in this domain at 12%.
Within the second domain (D32), the most important topic (field) is young people’s interest in running a farm (F321), which is reflected in a 25.2% increase in importance. The largest decrease in importance (by 24.4%) concerns the demand for low-skilled labor (F323).
In the last, third domain (F33) of the society perspective, the greatest increase in importance (by 32.5%) was recorded for the development of ecological (organic) farms (F332). The greatest decrease in importance relates to the agrarian structure of agriculture—F331 (decrease of 23.4%).
The highest average change in importance within the perspectives, calculated on the basis of absolute values of changes in the importance of domains and fields, relates to the business perspective (P2) and is 23.5%. The average change in preference within the society perspective (P3) is 17.0%, and the smallest average change was calculated for the farmer’s perspective—P1 (14.4%).
Of the domains, the highest average change in field preferences relates to profitability (D21) and is 38.7%, while the second highest change relates to perspectives of business development (D24) and is 27%; both domains belong to the business’s perspective.
3.2. Impact Assessment of Lunch of Weeding Laser Autonomous Tools (WLAT)
3.2.1. Farmers’ Perspectives on the Impact of the Introduction of WLAT on the Market
The score represents the average impact assessment based on the answers of five respondents. In this perspective, 11 questions (on 11 fields) were asked, divided into three domains. The table shows the average score for the impact, the evaluation of the impact and the rating of the strength of a particular opinion in a particular domain and field (Table 7).
Table 7 shows that farmers rate the effects of the weeding laser autonomous tools on economic consequences (D12) and health and working conditions (D11) positively. The average ratings for these two factors are 4.375 and 4.35, respectively. In terms of risk to farming operations, farmers rate the impact of WLAT as positive to neutral (3.52), with a slight bias towards positive (Table 7).
We can see that, from this perspective, respondents were consistently positive about the impact of the WLAT lunch on the market. Two fields were rated very positively: comfort of work—F112 (4.6) and demand for seasonal/temporary workers—F123 (5.0), and the strength of the rating is normal in both cases. Out of 11 fields, 2 were rated as positive and strong, namely production costs—F124 (3.6) and risks related to unexpected functional limitations of the device—F131 (3.7). The only field that was rated neutral is the risk of theft or damage to the device—F133 (2.9).
Interestingly, farm productivity per hectare (F122), which was rated at 4.5, meaning a positive to very positive impact, is simultaneously rated as weak in the opinion strength assessment. This means that the experts expect a strong positive impact of WLAT on this field, but this seems to be rather unimportant for them.
3.2.2. Business Perspective on Impact of the WLAT Introduction on the Market
In the case of this perspective, the score represents the average impact assessment based on the answers of five respondents to 12 fields divided into four domains, each domain comprising 3 fields (Table 8). The experts, from a business perspective, expect the WLAT to have a positive impact on profitability (score 4.03) and perspectives of business development (score 3.93). On the other hand, they expect negative effects on business risk (2.0). The impact of WLAT on the environmental performance of companies is rated as neutral (score 2.7).
Analyzing Table 8, we see that from the business point of view (perspective), the only very positive impact of WLAT is evaluated on the profits of the companies that manufacture the machines (F211). The opinion for this field was rated as strong, which means that from a business perspective, the experts firmly believe that WLAT will have a very positive impact on this field.
All fields of the perspectives of the business development domain (D34) were assessed as having a positive impact. Of these, only the impact assessment on the new perspectives for the company development (F242), which was rated 4.0, was assessed with great conviction by the experts.
The experts in this perspective (P2) are also firmly convinced that WLAT will have a negative impact on the manufacturer’s responsibility for product malfunctions (complaints, service); it received a score of 1.8.
3.2.3. Society Perspective on Impact of the WLAT Introduction on the Market
In the case of the societal perspective (P3), the score represents the average impact score based on the responses of five experts on the impact of WLAT on nine fields, divided into three domains (Table 9). The experts representing the societal perspective expect WLAT to have positive impacts on quality of life and the environment (D31), demographic consequences—D32 (scores of 3.93 and 3.67, respectively), and neutral impacts on the fair transformation of agriculture—D33 (3.47).
In perspective P3, only the impact of WLAT on the state of the environment (F312) was rated as very positive (score 4.8). There are no negative ratings from the social perspective. We also observed a strong opinion from the experts on the positive impact of WLAT on young people’s interest in running a farm (F321) and the development of ecological (organic) farms (F332), which were rated 3.8 and 4.0, respectively. It is worth noting that the experts believe that WLAT will also have a positive impact on women’s interest in working in agriculture—F322 (score 4.0). Interestingly, according to the experts, the introduction of WLAT will have a neutral impact on the demand for low-skilled labor—F323 (score 3.2), and at the same time, the importance of this field is not very high for the experts.
3.3. Changes in Impact Assessment after Applying Experts’ Preferences
In our work, we worked with ordinal data (in the Likert scale) to which numbers were assigned. Moreover, due to the limited number of fields in a domain, which is three or four, it is difficult to perform further statistical analysis. We have, therefore, limited our analysis to average values (Table 10, Table 11 and Table 12).
3.3.1. Farmers’ Perspective: New Impact Assessment after Application of Expert Weights
The average score for WLAT’s impact assessment for this perspective based on the results for domains is 4.08. This means that the impact from the farmer’s perspective is assessed as positive (Table 10).
In the case of perspective P1, the application of the expert weights does not lead to any changes in the impact assessment (compare Table 7 with Table 10). However, there are some changes in the impact scores obtained. The score for health and working conditions (D11) decreased slightly from 4.350 to 4.341, the score for economic consequences (D12) also decreased slightly from 4.375 to 4.287 (decrease of 1.8%), while the score for risk for farm operations (D13) increased from 3.517 to 3.522 (Figure 4).
The overall score for this perspective, calculated using two levels of expert weights (field and domain), increased slightly from 4.08 to 4.10 (0.4%).
3.3.2. Business Perspective: New Impact Assessment after Application of Expert Weights
The average rating of the impact of the WLAT from a business perspective based on the results for the domains is 3.17. This means that the impact from the business perspective is rated as neutral (Table 11).
In the case of perspective P2, the application of the expert weights does not lead to any changes in the impact assessment (compare Table 8 with Table 11). Applying the two levels of expert weights increases the impact assessment score for the entire business perspective. The score increased by 0.246, which corresponds to an increase of 7.8% compared to the baseline.
We can observe changes in the calculated averages (Figure 5). The score for profitability (D21) increased from 4.033 to 4.231 (about a 5% increase); the score for environmental performance of companies (D23) and perspectives of business development (D24) also increased from 2.700 to 2.714 and from 3.933 to 3.958, respectively, while the score for business risk (D22) decreased from 2.000 to 1.963 (1.8%).
3.3.3. Society Perspective: New Impact Assessment after Application of Expert Weights
The average score of impact assessment of the laser weed control system for society perspective (P3) based on results for domains is 3.69. It means that from perspective P3, the impact is assessed as positive.
The average score of the WLAT impact assessment for the society perspective (P3) based on the results for the domains is 3.69. This means that the impact from the P3 perspective is assessed as positive.
If we analyze the table above (Table 12), we can see that the weighted averages are greater than the arithmetic averages in all cases. The inclusion of expert weights in the evaluation leads to a slight change in the calculated domain impacts. The average change in score is 0.049, which is 1.4%.
However, this was enough to change the impact evaluation on just agricultural transformation (D33) from neutral to positive. The score increased from 3.467 to 3.553, exceeding the threshold for a positive rating (Figure 6).
The impact score for perspective P3 in terms of points increased slightly from 3.689 to 3.754, and in terms of impact evaluation, it remained the same (Table 12).
4. Discussion and Conclusions
Precise agricultural tools, if used wisely, can form the core of agricultural sustainability. Sustainability in agriculture concerns the impact of production processes, materials, energy, machinery and services so that they can be made more environmentally friendly, economically profitable and socially acceptable [49].
Therefore, there is a need to develop more sustainable weed control means. Autonomous vehicles equipped with lasers could be used as a sustainable alternative method.
The results of the S-LCA assessment for a broad implementation of the weed laser autonomous tools in practice in Europe are overall positive. They are consistent with the views that demonstrate the benefits of precision agriculture [58,60,76].
The WLAT has specific characteristics related to laser application, including risks, operational requirements, life cycle characteristics, skills and competencies.
Comparing the results of the evaluation of the broad adoption of WLAT in agriculture from the three perspectives, the evaluation from the farmer’s perspective is the most positive. The least positive evaluation was observed from the business perspective.
From the farmers’ perspective, the impacts were rated positively in all areas examined. Farmers rated the impact of the laser weeding system positively in the categories of economic impact and health and working conditions. In terms of risk to the farm, farmers rated the impact of the WLAT as positive to neutral, with a slight bias towards positive. This shows that the potential risks are manageable depending on the specific agricultural conditions.
The experts were particularly positive about the impact of WLAT implementation on the health and safety of farmers’ work and, to a lesser extent, on working comfort. They believe that the impact on health due to the elimination of chemicals will be very positive. However, it should be emphasized that the laser used in the technology may pose certain health risks according to the literature. An important aspect is the replacement of human labor by a robot, especially that performed by seasonal or temporary workers, so that the problem of labor shortage can be solved. From a farmer’s perspective, production costs are likely to have a positive impact. The experts assessed the effects from a long-term perspective and expected a future decrease in investment costs. It also appears that the use of WLAT does not increase the risks associated with unexpected functional limitations of agricultural machinery. The risk of theft or damage to the equipment is assessed as neutral.
From a societal perspective, the laser weed control system is expected to have a positive impact on the quality of life and the environment. In this section, the evaluation of the very positive effects of WLAT is assigned to the state of the environment. According to experts, there will be a significant improvement in environmental conditions in agriculture and biodiversity in the long term. In addition, experts believe that the introduction of innovative weed control technologies will improve the quality and safety of agricultural products by eliminating chemical residues in agricultural products. The impact on the affordability of agricultural products for society is seen as neutral.
In the demographic consequences section, a positive impact of the WLAT on young people’s interest in running a farm and on women’s interest in working in agriculture is noted. The WLAT will have a neutral effect on the demand for low-skilled workers, i.e., it will neither stimulate nor reduce the demand for this type of labor. In view of this, the changes will not have a significant impact on unemployment.
In the section on the just transformation of agriculture in a societal context, we can see that the introduction of WLAT to the market can also contribute significantly to the development of organic farming. The effects on the agricultural structure of farming and the ecological diversification of rural areas are assessed as neutral. It can be assumed that the use of this advanced technology will not favor large farms and give them a significant competitive advantage.
The overall result from the business perspective of the WLAT is considered to have a generally neutral impact on the market of the four analyzed sections.
From the business perspective, a positive impact of the broad introduction of the WLAT on the market is expected in the profitability section.
The impact on the profits of the companies manufacturing the machines was considered to be very strongly positive, and the assessment of this opinion is strong. On the other hand, the introduction of the laser weed control system is expected to have a negative impact on business risk, particularly the risk associated with the manufacturer’s responsibility for product malfunction and responsibility for machine maintenance. It was also considered that farmers and agricultural producers would potentially benefit from the introduction of the WLAT.
The technology should bring profits to WLAT producers and have a positive impact on the economy in general. It is expected that the market launch of the WLAT will create new jobs and increase the skills of employees in production, service, consultants, consulting companies, sales and users.
According to experts, the environmental impact of the production phase of the device could be higher than the production of the mechanical cultivators currently in use, but it is considered neutral in the overall assessment. In addition, the demand for rare earth metals will increase. The experts are concerned about the potentially high investment costs of the device, which is why they point to the need to provide financial support and consider the introduction of new business models. Waste disposal for manufacturers and pressure on the environment were assessed as neutral but, at the same time, important factors of business activities related to WLAT.
The evaluation of the importance of the selected factors by the experts made it possible to weigh and revise the experts’ assessment of the effects. From the farmers’ point of view, the most preferred factors influencing the widespread introduction of WLAT are the economic consequences, the most important of which are the production costs associated with the introduction of the new technology. According to business experts, the perspective of business development, with particular emphasis on new prospects for businesses and development, is the most important factor. The quality of life and the environment are most valued by society.
Author Contributions
Conceptualization, J.K. and B.M.-G.; methodology, J.K., B.M.-G. and J.B.; validation, J.B.; formal analysis, J.B.; investigation, B.M.-G.; resources, B.M.-G.; data curation, J.B.; writing—original draft preparation, J.K. and J.B.; writing—review and editing, J.K.; supervision, J.K.; project administration, J.K. All authors have read and agreed to the published version of the manuscript.
Funding
We are thankful for the funding of the WeLASER project (Sustainable Weed Management in Agriculture with Laser-based Autonomous Tools, Grant Agreement ID 101000256—WeLASER—H2020-SFS-2018-2020/H2020-SFS-2020-1 by the European Commission under H2020-EU.3.2.1.1). Further, all sources of this paper have been cited and adequately referenced.
Institutional Review Board Statement
The study was conducted in accordance with internal rules of the Institute for Ecology of Industrial Areas and appropriate regulations related to research in Poland and EU.
Informed Consent Statement
Informed consent was obtained from all subjects involved in the study.
Data Availability Statement
The raw data supporting the conclusions of this article will be made available by the authors without undue reservation.
Acknowledgments
We are thankful to all stakeholders participating in the study, including FGI workshops and experts participating in the S-LCA interviews.
Conflicts of Interest
The authors have no conflicts of interest to declare that are relevant to the content of this article.
References
- Kovacs, B. (Ed.) Sustainable Agriculture, Forestry and Fisheries in the Bioeconomy—A Challenge for Europe 4th SCAR Foresight; Societal Challenge 2; European Commission Directorate-General for Research and Innovation Horizon 2020; EU Publications Office: Luxembourg, 2015.
- Oerke, E.-C. Crop losses to pests. J. Agric. Sci. 2006, 144, 31–43. [Google Scholar] [CrossRef]
- EU. EU Authorisation Processes of Plant Protection Products from a Scientific Point of View; Group of Chief Scientific Advisors: Scientific Opinion 5 (Supported by SAPEA Evidence Review Report No. 3): Brussels, 4 June 2018; EU: Brussels, Belgium, 2018.
- European Union. Directive 2009/128/EC of the European Parliament and of the Council of 21 October 2009 Establishing a Framework for Community Action to Achieve the Sustainable Use of Pesticides. Off. J. Eur. Union 2009, 309, 71–86. [Google Scholar]
- Report from the Commission to the European Parliament and the Council On the Experience Gained by Member States on the Implementation of National Targets Established in Their National Action Plans and on Progress in the Implementation of Directive 2009/128/EC on the Sustainable Use of Pesticides. COM (2020) 204 Final. Available online: https://food.ec.europa.eu/system/files/2020-05/pesticides_sud_report-act_2020_en.pdf (accessed on 9 December 2023).
- Coleman, G.R.Y.; Stead, A.; Bigter, M.P.; Xu, Z.; Johnson, D.; Broker, G.M.; Sukkarieh, S.; Walsh, M.J. Using energy requirements to compare the suitability of alternative methods for broadcast and site-specific weed control. Weed Technol. 2019, 33, 633–650. [Google Scholar] [CrossRef]
- Sharma, G.; Singh Veer, B.; Kumar, N.; Saikanth, D.R.K. Advanced Technologies and Modern Tool for Weed Management Modern Agriculture: Exploring Current Trends; BS Global Publication House: Mathura, India, 2023. [Google Scholar]
- Moond, V.; Panotra, N.; Ashoka, P.; Saikanth, D.R.K.; Singh, G.; Prabhavathi, N.; Verma, B.G. Strategies and Technologies in Weed Management: A Comprehensive Review. Curr. J. Appl. Sci. Technol. 2023, 42, 20–29. [Google Scholar] [CrossRef]
- Marx, C.; Barcikowski, S.; Hustedt, M.; Haferkamp, H.; Rath, T. Design and application of a weed damage model for laser-based weed control. Biosyst. Eng. 2012, 113, 148–157. [Google Scholar] [CrossRef]
- Mathiassen, S.K.; Bak, T.; Christensen, S.; Kudsk, P. The Effect of Laser Treatment as a Weed Control Method. Biosyst. Eng. 2006, 95, 497–505. [Google Scholar] [CrossRef]
- Andreasen, C.; Scholle, K.; Saberi, M. Laser Weeding with Small Autonomous Vehicles: Friends or Foes? Front. Agron. Sec. Weed Manag. 2022, 4, 841086. [Google Scholar] [CrossRef]
- Rakhmatulin, I. Deep Neural Networks to Detect Weeds from Crops in Agricultural Environments in Real-Time: A Review. Remote Sens. 2021, 13, 4486. [Google Scholar] [CrossRef]
- Wolfert, S.; Verdouw, C.; van Wassenaer, L.; Dolfsma, W.; Klerkx, L. Digital innovation ecosystems in agri-food: Design principles and organizational framework. Agric. Syst. 2023, 204, 103558. [Google Scholar] [CrossRef]
- Bazargani, K.; Deemyad, T. Automation’s Impact on Agriculture: Opportunities, Challenges, and Economic Effects. Robotics 2024, 13, 33. [Google Scholar] [CrossRef]
- Silveira de, F.; Barbedo, J.G.A.; da Silva, S.L.C.; Gonçalves Amaral, F. Proposal for a framework to manage the barriers that hinder the development of agriculture 4.0 in the agricultural production chain. Comput. Electron. Agric. 2023, 214, 108281. [Google Scholar] [CrossRef]
- Gil, G.; Casagrande, D.E.; Cortés, L.P.; Verschae, R. Why the low adoption of robotics in the farms? Challenges for the establishment of commercial agricultural robots. Smart Agric. Technol. 2023, 3, 100069. [Google Scholar] [CrossRef]
- Baum, J.A.C. International Encyclopedia of the Social & Behavioral Sciences; Elsevier: Amsterdam, The Netherlands, 2001. [Google Scholar]
- Majerník, M.; Chovancová, J.; Drábik, P.; Štofková, Z. Environmental Technological Innovations and the Sustainability of their Development. Ecol. Eng. Environ. Technol. 2023, 24, 245–252. [Google Scholar]
- Lybæk, R.; Christensen, T.B.; Kjær, T. Governing innovation for sustainable development in the Danish biogas sector–a historical overview and analysis of innovation. Sustain. Dev. 2013, 21, 171–182. [Google Scholar] [CrossRef]
- Chen, X.; Li, T. Diffusion of Agricultural Technology Innovation: Research Progress of Innovation Diffusion in Chinese Agricultural Science and Technology Parks. Sustainability 2022, 14, 15008. [Google Scholar] [CrossRef]
- Vecchio, Y.; De Rosa, M.; Pauselli, G.; Masi, M.; Adinolfi, F. The leading role of perception: The FACOPA model to comprehend innovation adoption. Agric. Econ. 2022, 10, 5. [Google Scholar] [CrossRef]
- Ainissyifa, H.; Wulan, E.R.; Muhyiddin, A.; Ramdhani, M.A. Innovation and technology diffusion in agricultural sector. IOP Conf. Ser. Mater. Sci. Eng. 2018, 434, 012247. [Google Scholar] [CrossRef]
- Park, Y.-T. Technology diffusion policy: A review and classification of policy practices. Technol. Soc. 1999, 21, 275–286. [Google Scholar] [CrossRef]
- Rogers, E.M. Diffusion of Innovations, 3rd ed.; Routledge: London, UK, 2014. [Google Scholar]
- Rivera, M.; Rogers, E. Innovation Diffusion, Network Features, and Cultural Communication Variables. Probl. Perspect. Manag. 2006, 4, 126–135. [Google Scholar]
- Robinson, S. Integrated Research Sub-Project (IRSP) I—The Role of Technology Companies in Promoting Surveil-lance Internationally Innovation Diffusion and Technology Transfer. May 2009. Available online: https://www.surveillance-studies.ca/sites/sscqueens.org/files/2009-05-Robinson-ABII.pdf (accessed on 4 February 2024).
- Flórez Gómez, L.Y.; Pico Mendoza, J.; Guerrero, C.D.; Carreño, A.E. Technology Transfer Model for Small-Scale Farms. Sustainability 2023, 15, 5320. [Google Scholar] [CrossRef]
- Rizzo, G.; Migliore, G.; Schifani, G.; Vecchio, R. Key factors influencing farmers’ adoption sustainable innovations: A systematic literature review and research agenda. Org. Agric. 2023, 1–28. [Google Scholar] [CrossRef]
- Feder, G.; Just, R.E.; Zilberman, D. Adoption of agricultural innovations in developing countries: A survey. Econ. Dev. Cult. Change 1985, 32, 255–298. [Google Scholar] [CrossRef]
- Masi, M.; Di Pasquale, J.; Vecchio, Y.; Capitanio, F. Precision Farming: Barriers of Variable Rate Technology Adoption in Italy. Land 2023, 12, 1084. [Google Scholar] [CrossRef]
- Vecchio, Y.; De Rosa, M.; Adinolfi, F.; Bartoli, L.; Masi, M. Adoption of precision farming tools: A context-related analysis. Land Use Policy 2020, 94, 104481. [Google Scholar] [CrossRef]
- Capitanio, F.; Coppola, A.; Pascucci, S. Indications for drivers of innovation in the food sector. Br. Food J. 2009, 111, 820–838. [Google Scholar] [CrossRef]
- Pedersen, S.M.; Fountas, S.; Blackmore, B.S.; Gylling, M.; Pedersen, J.L. Adoption and perspectives of precision farming in Denmark. Acta Agric. Scand. Sect. B Soil. Plant Sci. 2004, 54, 2–8. [Google Scholar] [CrossRef]
- Sui, Y.; Gao, Q. Farmers’ Endowments, Technology Perception and Green Production Technology Adoption Behavior. Sustainability 2023, 15, 7385. [Google Scholar] [CrossRef]
- Cavallo, E.; Ferrari, E.R.; Bollani, L.; Coccia, M. Attitudes and behaviour of adopters of technological innovations in agricultural tractors: A case study in Italian agricultural system. Agric. Syst. 2014, 130, 44–54. [Google Scholar] [CrossRef]
- Blakeney, M. Agricultural Innovation and Sustainable Development. Sustainability 2022, 14, 2698. [Google Scholar] [CrossRef]
- Gebbers, R.; Adamchuk, V.I. Precision Agriculture and Food Security. Science 2010, 327, 828–831. [Google Scholar] [CrossRef] [PubMed]
- Ancín, M.; Pindado, E.; Sánchez, M. New trends in the global digital transformation process of the agri-food sector: An exploratory study based on Twitter. Agric. Syst. 2022, 203, 103520. [Google Scholar] [CrossRef]
- Daum, T.; Baudron, F.; Birner, R.; Qaim, M.; Grass, I. Addressing agricultural labour issues is key to biodiversity-smart farming. Biol. Conserv. 2023, 284, 110165. [Google Scholar] [CrossRef]
- Talukder, B.; Blay-Palmer, A.; van Loon, G.W.; Hipel, K.W. Towards complexity of agricultural sustainability assessment: Main issues and concerns. Environ. Sustain. Indic. 2020, 6, 100038. [Google Scholar] [CrossRef]
- Bongiovanni, R.J. Lowenberg-Deboer Precision Agriculture and Sustainability. Precis. Agric. 2004, 5, 359–387. [Google Scholar] [CrossRef]
- Barrientos-Fuentes, J.; Berg, E. Impact assessment of agricultural innovations: A review. Agron. Colomb. 2013, 31, 120–130. [Google Scholar]
- Nazir, N. Understanding Life Cycle Thinking and its Practical Application to Agri-Food System. Int. J. Adv. Sci. Eng. Inf. Technol. 2017, 7, 1861. [Google Scholar] [CrossRef]
- Iofrida, N.; Strano, A.; Gulisano, G.; De Luca, A.I. Why social life cycle assessment is struggling in development? Int. J. Life Cycle Assess. 2018, 23, 201–203. [Google Scholar] [CrossRef]
- De Luca, A.I.; Iofrida, N.; Strano, A.; Falcone, G.; Gulisano, G. Social life cycle assessment and participatory approaches: A methodological proposal applied to citrus farming in Southern Italy. Integr. Environ. Assess. Manag. 2013, 11, 383–396. [Google Scholar] [CrossRef]
- United Nations Environment Programme–UNEP; Society of Environmental Toxicology and Chemistry (SETAC). Guidelines for Social Life Cycle Assessment of Products; UNEP: Nairobi, Kenya, 2009. [Google Scholar]
- ISO 14040:2006; Environmental Management, Life Cycle Assessment. ISO: Geneva, Switzerland, 2006.
- United Nations Environment Programme–UNEP; Society of Environmental Toxicology and Chemistry (SETAC). The Methodological Sheets for Subcategories in Social life Cycle Assessment (S-LCA); UNEP: Nairobi, Kenya, 2013. [Google Scholar]
- Jørgensen, A. Social LCA—A way ahead? Int. J. Life Cycle Assess. 2013, 18, 296–299. [Google Scholar] [CrossRef]
- Macombe, K.; Leskinen, P.; Feschet, P.; Antikainen, R. Social life cycle assessment of biodiesel production at three levels: A literature review and development needs. J. Clean. Prod. 2014, 52, 205–216. [Google Scholar] [CrossRef]
- Spykman, O.; Gabriel, A.; Ptacek, M.; Gandorfer, M. Farmers’ perspectives on field crop robots–Evidence from Bavaria, Germany. Comput. Electron. Agric. 2021, 186, 106176. [Google Scholar] [CrossRef]
- Dong, Y.H.; Ng, S.T. A social life cycle assessment model for building construction in Hong Kong. Int. J. Life Cycle Assess. 2015, 20, 1166–1180. [Google Scholar] [CrossRef]
- Mathé, S. Integrating participatory approaches into social life cycle assessment: The SLCA participatory approach. Int. J. Life Cycle Assess. 2014, 19, 1506–1514. [Google Scholar] [CrossRef]
- Estévez, R.A.; Walshe, T.; Burgman, M.A. Capturing social impacts for decision-making: A Multicriteria Decision Analysis perspective. Divers. Distrib. 2013, 19, 608–616. [Google Scholar] [CrossRef]
- Bouillass, G.; Blanc, I.; Perez-Lope, P. Step-by-step social life cycle assessment framework: A participatory approach for the identification and prioritization of impact subcategories applied to mobility scenarios. Int. J. Life Cycle Assess. 2021, 26, 2408–2435. [Google Scholar] [CrossRef]
- Tran, D.; Schouteten, J.J.; Degieter, M.; Krupanek, J.; Jarosz, W.; Areta, A.; Emmi, L.; De Steur, H.; Gellynck, X. European stakeholders’ perspectives on implementation potential of precision weed control: The case of autonomous vehicles with laser treatment. Precis. Agric. 2023, 24, 2200–2222. [Google Scholar] [CrossRef] [PubMed]
- Reitinger, C.; Dumke, M.; Barosevcic, M.; Hillerbrand, R. A conceptual framework for impact assessment within SLCA. Int. J. Life Cycle Assess. 2011, 16, 380–388. [Google Scholar] [CrossRef]
- Von Veltheim, F.R.; Theuvsen, L.; Heise, H. German farmers’ intention to use autonomous field robots: A PLS-analysis. Precis. Agric. 2022, 23, 670–697. [Google Scholar] [CrossRef]
- von Veltheim, F.R.; Heise, H. German farmers’ attitudes on adopting autonomous field robots: An empirical survey. Agriculture 2021, 11, 216. [Google Scholar] [CrossRef]
- Sparrow, R.; Howard, M. Robots in agriculture: Prospects, impacts, ethics, and policy. Precis. Agric. 2020, 22, 818–833. [Google Scholar] [CrossRef]
- Communication EU A Farm to Fork Strategy (COM (2020) 381 Final). Available online: https://eur-lex.europa.eu/resource.html?uri=cellar:ea0f9f73-9ab2-11ea-9d2d-01aa75ed71a1.0001.02/DOC_1&format=PDF (accessed on 9 December 2023).
- Ait Sidhoum, A. Assessing the contribution of farmers’ working conditions to productive efficiency in the presence of uncertainty, a nonparametric approach. Environ. Dev. Sustain. 2023, 25, 8601–8622. [Google Scholar] [CrossRef]
- Martin, T.; Gasselin, P.; Hostiou, N.; Feron, G.; Laurens, L.; Purseigle, F.; Ollivier, G. Robots and transformations of work in farm: A systematic review of the literature and a research agenda. Agron. Sustain. Dev. 2022, 42, 66. [Google Scholar] [CrossRef]
- Marinoudi, V.; Sørensen, C.G.; Pearson, S.; Bochtis, D. Robotics and labour in agriculture. A context consideration. Biosyst. Eng. 2019, 184, 111–121. [Google Scholar] [CrossRef]
- Shutske, J.M. Agricultural Automation & Autonomy: Safety and Risk Assessment Must Be at the Forefront. J. Agromed. 2023, 28, 5–10. [Google Scholar] [CrossRef]
- Aby, G.R.; Issa, S.F. Safety of Automated Agricultural Machineries: A Systematic Literature Review. Safety 2023, 9, 13. [Google Scholar] [CrossRef]
- França, D.M.Z.R.; Lacerda, A.B.M.; Lobato, D.; Ribas, A.; Dias, K.Z.; Leroux, T.; Fuente, A. Adverse effects of pesticides on central auditory functions in tobacco growers. Int. J. Audiol. 2017, 56, 233–241. [Google Scholar] [CrossRef]
- Benos, L.; Bechar, A.; Bochtis, D. Safety and ergonomics in human-robot interactive agricultural operations. Biosyst. Eng. 2020, 200, 55–72. [Google Scholar] [CrossRef]
- Hamsan, H.; Ho, Y.B.; Zaidon, S.Z.; Hashim, Z.; Saari, N.; Karami, A. Occurrence of commonly used pesticides in personal air samples and their associated health risk among paddy farmers. Sci. Total Environ. 2017, 603–604, 381–389. [Google Scholar] [CrossRef]
- Treiber, M.; Hillerbrand, F.; Bauerdick, J.; Bernhardt, H. On the current state of agricultural robotics in crop farming chances and risks. In Proceedings of the 47th Symposium “Actual Tasks on Agricultural Engineering”, Opatija, Croatia, 5–7 March 2019. [Google Scholar]
- Portela de-Assis, M.; Barcella, R.C.; Padilha, J.C.; Pohl, H.H.; Frantz Krug, S.B. Health problems in agricultural workers occupationally exposed to pesticides. Rev. Bras. Med. Trab. 2020, 18, 352–363. [Google Scholar] [CrossRef]
- Brühl, C.A.; Zaller, J.G. Biodiversity Decline as a Consequence of an Inappropriate Environmental Risk Assessment of Pesticides. Front. Environ. Sci. Opin. 2019, 7, 177. [Google Scholar] [CrossRef]
- Kingsley Nwosu, O.; John, A. Chemical Pesticides and Food Safety [Internet]. In Insecticides-Impact and Benefits of Its Use for Humanity; IntechOpen: London, UK, 2022. [Google Scholar] [CrossRef]
- Steingoltz, M.; Picciola, M.; Wilson, R. Consumer Health Claims 3.0: The Next Generation of Mindful Food Consumption. Exec. Insights 2018, 20, 1–6. [Google Scholar]
- Lowenberg-DeBoer, J.; Huang, I.Y.; Grigoriadis, V.; Blackmore, S. Economics of robots and automation in field crop production. Precis. Agric. 2020, 21, 278–299. [Google Scholar] [CrossRef]
- EPRS European Parlimentary Research Service, Scientific Foresight Unit (STOA) PE 581.892. Precision agriculture and the Future of Farming in Europe Scientific Foresight Study. IP/G/STOA/FWC/2013-1/Lot 7/SC5, December 2016. Available online: https://op.europa.eu/en/publication-detail/-/publication/40fe549e-cb49-11e7-a5d5-01aa75ed71a1/language-en (accessed on 4 February 2024).
- Joint Research Centre (JRC) of the European Commission; Monitoring Agriculture ResourceS (MARS) Unit H04; Zarco-Tejada, P.J. Neil Hubbard and Philippe Loudjan, Precision Agriculture: An Opportunity for EU Farmers–Potential Support with the CAP 2014–2020; European Parliament: Strasbourg, France, 2014. [Google Scholar]
- Baio, F.H.R.; da Silva, S.P.; Camolese, H.d.S.; Neves, D.C. Financial analysis of the investment in precision agriculture techniques on cotton crop. Eng. Agríc. 2017, 37, 838–847. [Google Scholar] [CrossRef]
- Petrova Beluhova-Uzunova, R.; Dunchev, D.M. Precision farming–concepts and perspectives. Probl. Agric. Econ. 2019, 3, 142–155. [Google Scholar] [CrossRef]
- Troiano, S.; Carzedda, M.; Marangon, F. Better richer than environmentally friendly? Describing preferences toward and factors affecting precision agriculture adoption in Italy. Agric. Food Econ. 2023, 11, 16. [Google Scholar] [CrossRef]
- Joint Research Centre (JRC) of the European Commission; Monitoring Agriculture Resource S (MARS). Directorate-General For Internal Policies Policy Department B: Structural and Cohesion Policies Agriculture and Rural Development Precision Agriculture: An Opportunity for Eu Farmers-Potential Support with The Cap 2014–2020. 2014. Available online: https://www.europarl.europa.eu/RegData/etudes/note/join/2014/529049/IPOL-AGRI_NT%282014%29529049_EN.pdf (accessed on 4 February 2024).
- Carbonell, I.M. The ethics of big data in big agriculture. Internet Policy Rev. 2016, 5. Available online: https://policyreview.info/articles/analysis/ethics-big-data-big-agriculture (accessed on 20 January 2024). [CrossRef]
- Visser, O.; Sippel, S.R.; Thiemann, L. Imprecision farming? Examining the (in)accuracy and risks of digital agriculture. J. Rural. Stud. 2021, 86, 623–632. [Google Scholar] [CrossRef]
- European Parliament; Directorate-General for Parliamentary Research Services; Kritikos, M. Precision Agriculture in Europe–Legal, Social and Ethical Considerations; European Parliament: Strasbourg, France, 2017. [Google Scholar]
- Firbank, L.G. Towards the sustainable intensification of agriculture—A systems approach to policy formulation. Front. Agric. Sci. Eng. 2020, 7, 81–89. [Google Scholar] [CrossRef]
- He, Q.; Sun, Y.; Yi, M.; Huang, H. How to promote agricultural enterprises to reduce the use of pesticides and fertilizers? An evolutionary game approach Agrochemicals in agricultural and non-agricultural settings: Fate, distribution, and potential human and environmental health hazards. Front. Sustain. Food Syst. Sec. Agro-Food Saf. 2023, 7, 1238683. [Google Scholar] [CrossRef]
- Andreasen, C.; Vlassi, E.; Johannsen, K.S.; Jensen, S.M. Side-effects of laser weeding: Quantifying off-target risks to earthworms (Enchytraeids) and insects (Tenebrio molitor and Adalia bipunctata). Front. Agron. 2023, 5, 1198840. [Google Scholar] [CrossRef]
- Shoji, N. Precision Agriculture Creates New Business Opportunities, Mitsui Global Strategic Studies Institute Monthly Report June 2017. Available online: https://www.mitsui.com/mgssi/en/report/detail/__icsFiles/afieldfile/2017/10/06/170606q_shoji_e.pdf (accessed on 4 February 2024).
- Sánchez-Bayo, F.; Wyckhuys, K.A.G. Worldwide decline of the entomofauna: A review of its drivers. Biol. Conserv. 2019, 232, 8–27. [Google Scholar] [CrossRef]
- European Commission. Communication from the Commission to the European Parliament, the European Council, the Council, the European Economic and Social Committee and the Committee of the Regions the European Green Deal, COM/2019/640 Final. Available online: https://eur-lex.europa.eu/legal-content/EN/TXT/?uri=COM%3A2019%3A640%3AFIN (accessed on 4 February 2024).
- Communication EU Biodiversity Strategy for 2030 (COM (2020) 380 Final). Available online: https://eur-lex.europa.eu/legal-content/EN/TXT/?uri=celex%3A52020DC0380 (accessed on 9 December 2023).
- Global Network for the Right to Food and Nutrition. State of the Right to Food And Nutrition Report Swiss Agency for Development and Cooperation (SDC) and Brot für die Welt. 2021. Available online: https://www.righttofoodandnutrition.org/state-right-food-and-nutrition-report-2021 (accessed on 4 February 2024).
- De Baerdemaeker, J.; Saey, W. Good Agricultural Practices, Quality, Traceability, and Precision Agriculture. In Precision Agriculture Technology for Crop Farming; CRC Press: Boca Raton, FL, USA, 2015; pp. 279–298. [Google Scholar] [CrossRef]
- Pitla, S.; Bajwa, S.; Bhusal, S.; Brumm, T.; Brown-Brandl, T.M. Ground and Aerial Robots for Agricultural Production: Opportunities and Challenges Biological Systems Engineering; CAST: Ames, IA, USA, 2020. [Google Scholar]
- Wubale, T.; Marcus, P.S.; Hjorth, L.K.M. Farm and operator characteristics affecting adoption of precision agriculture in Denmark and Germany. Acta Agric. Scand. Sect. B—Soil Plant Sci. 2018, 68, 349–357. [Google Scholar] [CrossRef]
- Capelli, R.; Montobbio, F.; Morrison, A. Unemployment resistance across EU regions: The role of technological and human capital. J. Evol. Econ. 2021, 31, 147–178. [Google Scholar] [CrossRef]
- Kołodziejczak, W. Hidden unemployment in Polish Agriculture in 1995–2015. J. Agribus. Rural. Dev. 2016, 42, 4. [Google Scholar] [CrossRef]
- Communication EU a long-Term Vision for the EU’s Rural Areas-Towards Stronger, Connected, Resilient and Prosperous Rural Areas by 2040 (COM(2021) 345 Final). Available online: https://eur-lex.europa.eu/resource.html?uri=cellar:6c924246-da52-11eb-895a-01aa75ed71a1.0003.02/DOC_1&format=PDF (accessed on 9 December 2023).
- Kleven, H.; Landais, C. Gender inequality and economic development: Fertility, education and norms. Economica 2017, 84, 180–209. [Google Scholar] [CrossRef]
- Matuszewska-Janica, A. Men and women wage differences in Spain and Poland. Montenegrin J. Econ. 2018, 14, 45–52. [Google Scholar] [CrossRef]
- Balezentis, T.; Morkunas, M.; Volkom, A.; Ribasauskiene, E. Are women neglected in the EU agriculture? Evidence from Lithuanian young farmers. Land Use Policy. 2021, 101, 105129. [Google Scholar] [CrossRef]
- Fisher, M.; Kandiwa, V. Can agricultural input subsidies reduce the gender gap in modern maize adoption? Evidence from Malawi. Food Policy 2014, 45, 101–111. [Google Scholar] [CrossRef]
- Vivarelli, M. Innovation, Employment and Skills in Advanced and Developing Countries: A Survey of Economic Literature. J. Econ. Issues 2014, 48, 123–154. [Google Scholar] [CrossRef]
- O’Kane, G. What is the real cost of our food? Implications for the environment, society and public health nutrition. Public Health Nutr. 2012, 15, 268–276. [Google Scholar] [CrossRef]
- Hackfort, S. Patterns of Inequalities in Digital Agriculture: A Systematic Literature Review. Sustainability 2021, 13, 12345. [Google Scholar] [CrossRef]
- Daberkow, S.G.; Mc Bride, W.D. Farm and Operator Characteristics Affecting the Awareness and Adoption of Precision Agriculture Technologies in the US. Precis. Agric. 2003, 4, 163–177. [Google Scholar] [CrossRef]
- Channarayappa, C.; Biradar, D.P. Organic Farming and Precision Agriculture for Sustainable Farming chapter in Soil Basics, Management, and Rhizosphere. In Soil Basics, Management and Rhizosphere Engineering for Sustainable Agriculture; CRC Press: Boca Raton, FL, USA, 2018; pp. 279–313. [Google Scholar] [CrossRef]
- Duff, H.; Hegedus, P.B.; Loewen, S.; Bass, T.; Maxwell, B.D. Precision Agroecology. Sustainability 2022, 14, 106. [Google Scholar] [CrossRef]
- European Union. Council Regulation (EC) No 834/2007 of 28 June 2007 on organic production and labelling of organic products and repealing. Regulation (EEC) No 2092/91. Off. J. Eur. Union 2007, 8, 139–161. [Google Scholar]
- Rotzc, S.; Gravely, E.; Mosby, I.; Duncan, E.; Finnis, E.; Horgan, M.; LeBlanca, J.; Ralph Martin, R.; Neufeld, H.T.; Nixon, A.; et al. Automated pastures and the digital divide: How agricultural technologies are shaping labour and rural communities. J. Rural. Stud. 2019, 68, 112–122. [Google Scholar] [CrossRef]
- The Aspen Institure, Future Work. 2019 (U.S. Bureau of Labor Statistics. “Farmers, Ranchers, and Other Agricultural Managers”. Occupational Outlook Handbook. 2019. Available online: https://www.bls.gov/ooh/management/farmers-ranchers-and-other-agricultural-managers.htm (accessed on 4 February 2024).
- Moller, B.; Voglhuber-Slavinsky, A.; Dönitz, E. Three Scenarios for Europe’s Food Sector in 2035; Fraunhofer Institute for Systems and Innovation Research ISI: Karlsruhe, Germany, 2020. [Google Scholar]
- Pretty, J. Social Capital and Connectedness: Issues and Implications for Agriculture, Rural Development and Natural Resource Management in ACP Countries; CTA Working Document Number 8032; 2003. Available online: https://cgspace.cgiar.org/bitstream/handle/10568/63614/social%20capital%20wd8032.pdf?sequence=1 (accessed on 4 February 2024).
- Rodriguez, J.M.; Molnar, J.J.; Fazio, R.A.; Sydnor, E.; Lowe, M.J. Barriers to adoption of sustainable agriculture practices: Change agent perspectives. Renew. Agric. Food Syst. 2009, 24, 11–15. [Google Scholar] [CrossRef]
- European Parliament; Directorate-General for Parliamentary Research Services; Schrijver, R.; Kempenaar, C.; Quinn, J. Precision Agriculture and the Future of Farming in Europe–Annex 1–Technical Horizon Scan; European Parliament: Strasbourg, France, 2016; Available online: https://data.europa.eu/doi/10.2861/763030 (accessed on 4 February 2024).
- Liu, W.; Wei, S.; Wang, S.; Lim, M.K.; Wang, Y. Problem identification model of agricultural precision management based on smart supply chains: An exploratory study from China. J. Clean. Prod. 2022, 352, 131622. [Google Scholar] [CrossRef]
- EU. Machinery Regulation (Regulation (EU) 2023/1230) published on 29 June 2023. Available online: https://eur-lex.europa.eu/eli/reg/2023/1230/oj (accessed on 4 February 2024).
- EU Directive 2006/42/EC of the European Parliament and of the Council of 17 May 2006 on Machinery, and Amending Directive 95/16/EC (Recast) (Text with EEA Relevance) Text with EEA Relevance. Available online: https://eur-lex.europa.eu/legal-content/EN/TXT/?uri=CELEX%3A32006L0042 (accessed on 4 February 2024).
- Yaqot, M.; Menezes, B.C.; Al-Ansari, T. Roadmap to Precision Agriculture Under Circular Economy Constraints. J. Inf. Knowl. Manag. 2023, 22, 2250092. [Google Scholar] [CrossRef]
- Szczepański, M. Future Shocks 2023: De-Risking Europe’s Global Critical Supply Chains, EPRS Strategic Foresight and Capabilities Unit/18 August 2023, Electronic Document. Available online: https://epthinktank.eu/2023/08/18/future-shocks-2023-de-risking-europes-global-critical-supply-chains/ (accessed on 20 September 2023).
- Attinasi, M.G.; Ioannou, D.; Lebastard, L.; Morris, R. Global Production and Supply Chain Risks: Insights from a Survey of Leading Companies, European Central Bank, ECB Economic Bulletin, Issue 7/2023. Electronic Document. Available online: https://www.ecb.europa.eu/pub/economic-bulletin/focus/2023/html/ecb.ebbox202307_01~2a0bcf0b48.en.html (accessed on 10 September 2023).
- European Commission. Critical Materials for Strategic Technologies and Sectors in the EU—A Foresight Study; European Commission: Brussels, Belgium, 2020. [Google Scholar]
- COM(2023) 165 Final Communication from the Commission to the European Parliament, the Council, the European Economic and Social Committee and the Committee of the Regions, Brussels, 16.3.2023 a Secure and Sustainable Supply of Critical Raw Materials in Support of the Twin Transition. Available online: https://data.consilium.europa.eu/doc/document/ST-7551-2023-INIT/en/pdf (accessed on 4 February 2024).
- COM/2020/98 Final Communication from the Commission to The European Parliament, the Council, the European Economic and Social Committee and the Committee of the Regions a New Circular Economy Action Plan for a Cleaner and More Competitive Europe. Available online: https://www.eea.europa.eu/policy-documents/com-2020-98-final-a (accessed on 4 February 2024).
- Liu, Y. Impact of industrial robots on environmental pollution: Evidence from China. Sci. Rep. 2023, 13, 20769. [Google Scholar] [CrossRef]
- Luan, F.; Yang, X.; Chen, Y.; Regis, P.J. Industrial robots and air environment: A moderated mediation model of population density and energy consumption. Sustain. Prod. Consum. 2022, 30, 870–888. [Google Scholar] [CrossRef]
- Roland Berger Strategy Consultants GmbH. Business Opportunities in Precision Farming: Will Big Data Feed the World in the Future? Roland Berger Strategy Consultants GmbH: Munich, Germany, 2015. [Google Scholar]
- Shibusawa, S. A Systems Approach to Community-Based Precision Agriculture. In Precision Agriculture Technology For Crop Farming; Zhang, Q., Ed.; CRC Press Francis Taylor Group: Boca Raton, FL, USA, 2016; pp. 213–230. [Google Scholar]
- Saaty, T.L. What Is the Analytic Hierarchy Process? Springer: Berlin/Heidelberg, Germany, 1988; pp. 109–121. [Google Scholar]
- Saaty, T.L. Rank, normalization and idealization in the Analytic Hierarchy Process. In Proceedings of the 7th International Symposium on Analytic Hierarchy Process, Bali, Indonesia, 7–9 August 2003; pp. 57–63. [Google Scholar]
- Malczewski, J. GIS and Multicriteria Decision Analysis; John Wiley & Sons: New York, NY, USA, 1999. [Google Scholar]
- Malczewski, J. Multicriteria analysis. In Reference Module in Earth Systems and Environmental Sciences; Elsevier: Amsterdam, The Netherlands, 2018. [Google Scholar]
Figure 1.
Outline of the S-LCA process applied in the study.

Figure 2.
Analyzed perspectives and impacted domains.

Figure 3.
General scheme of the applied analytical hierarchy process.
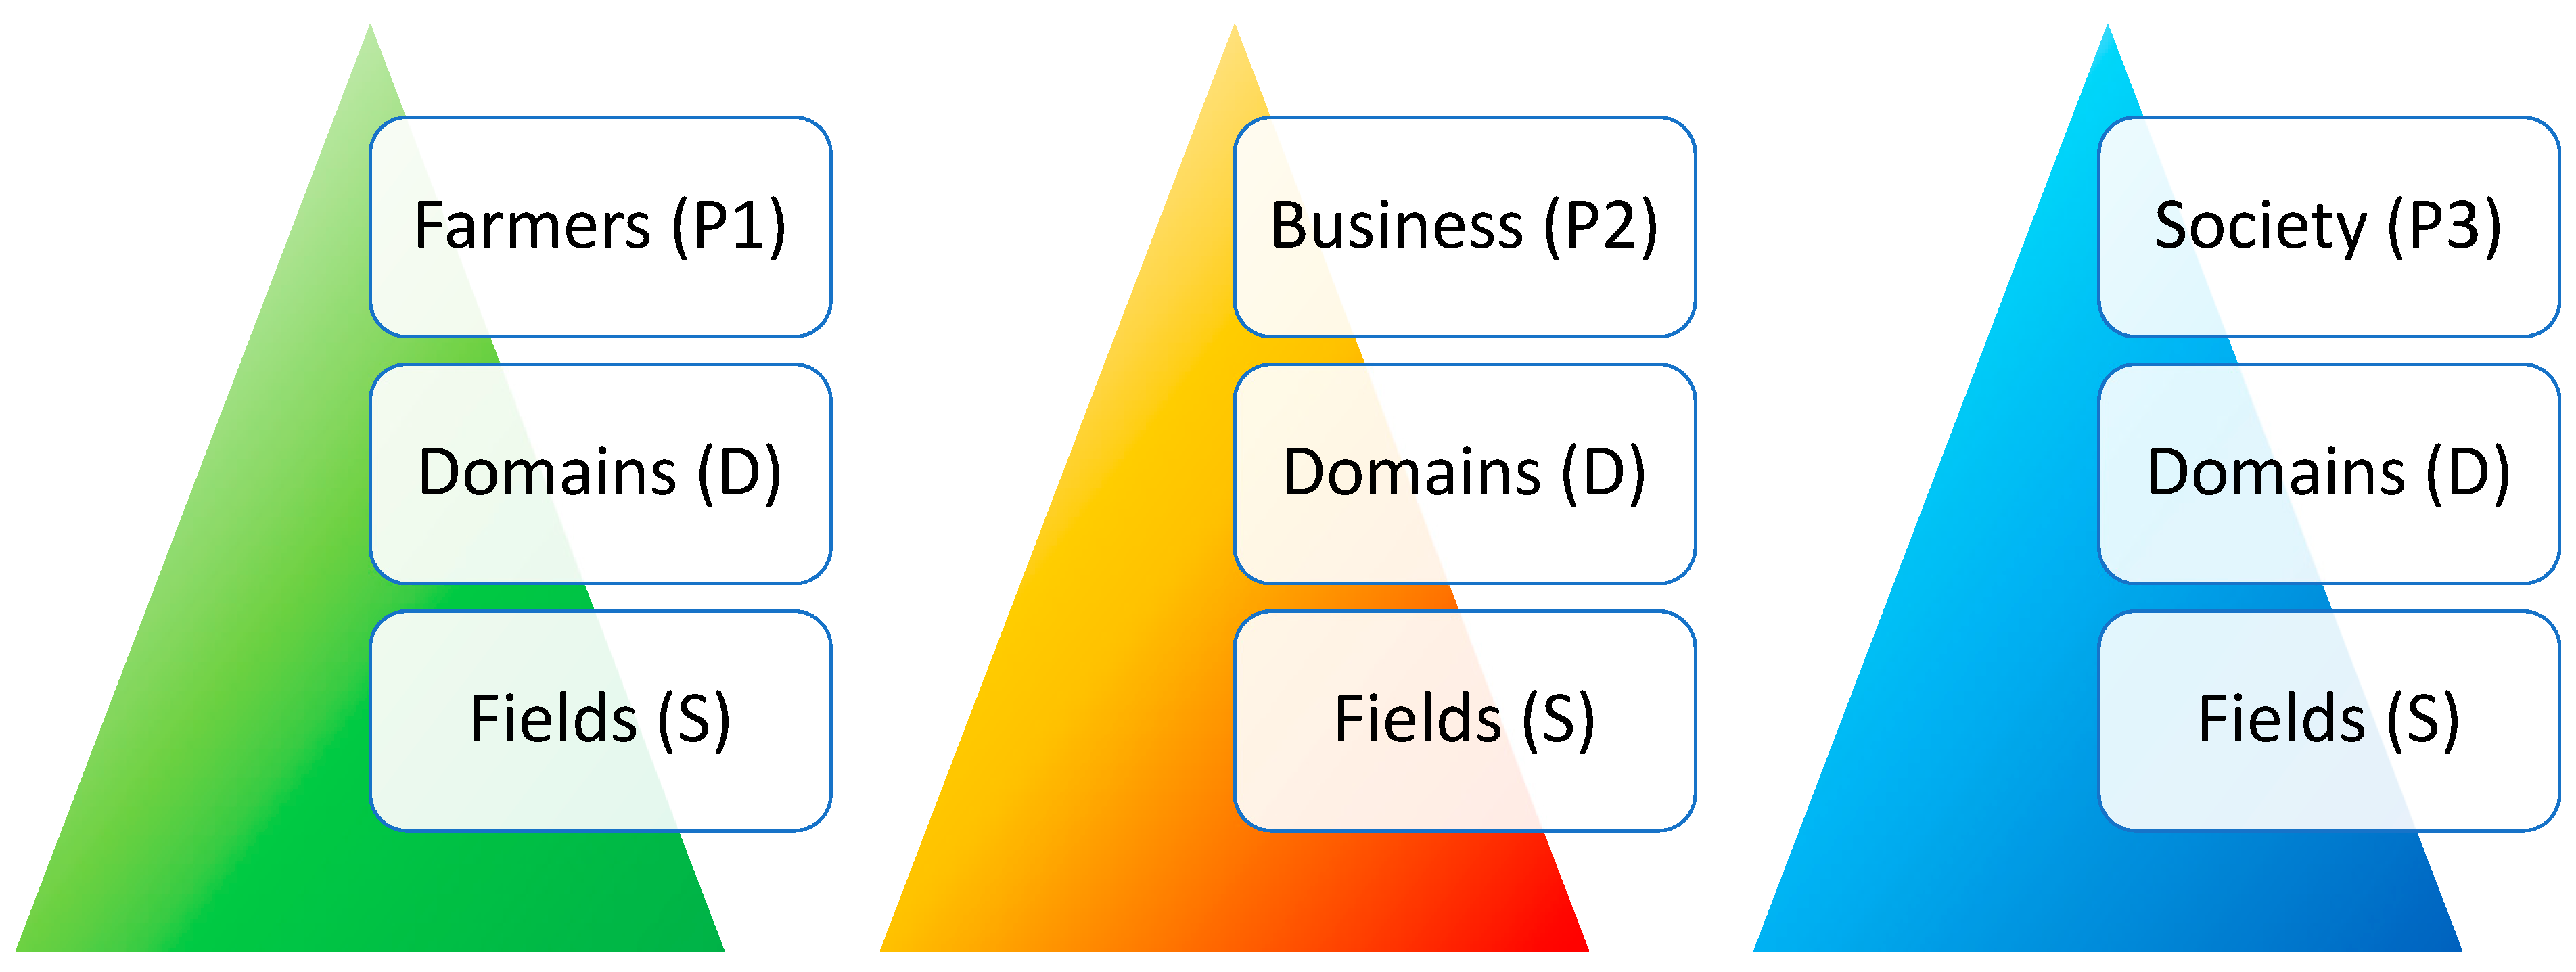
Figure 4.
Changes in the impact assessment of perspective P1.

Figure 5.
Changes in the impact assessment of perspective P2.
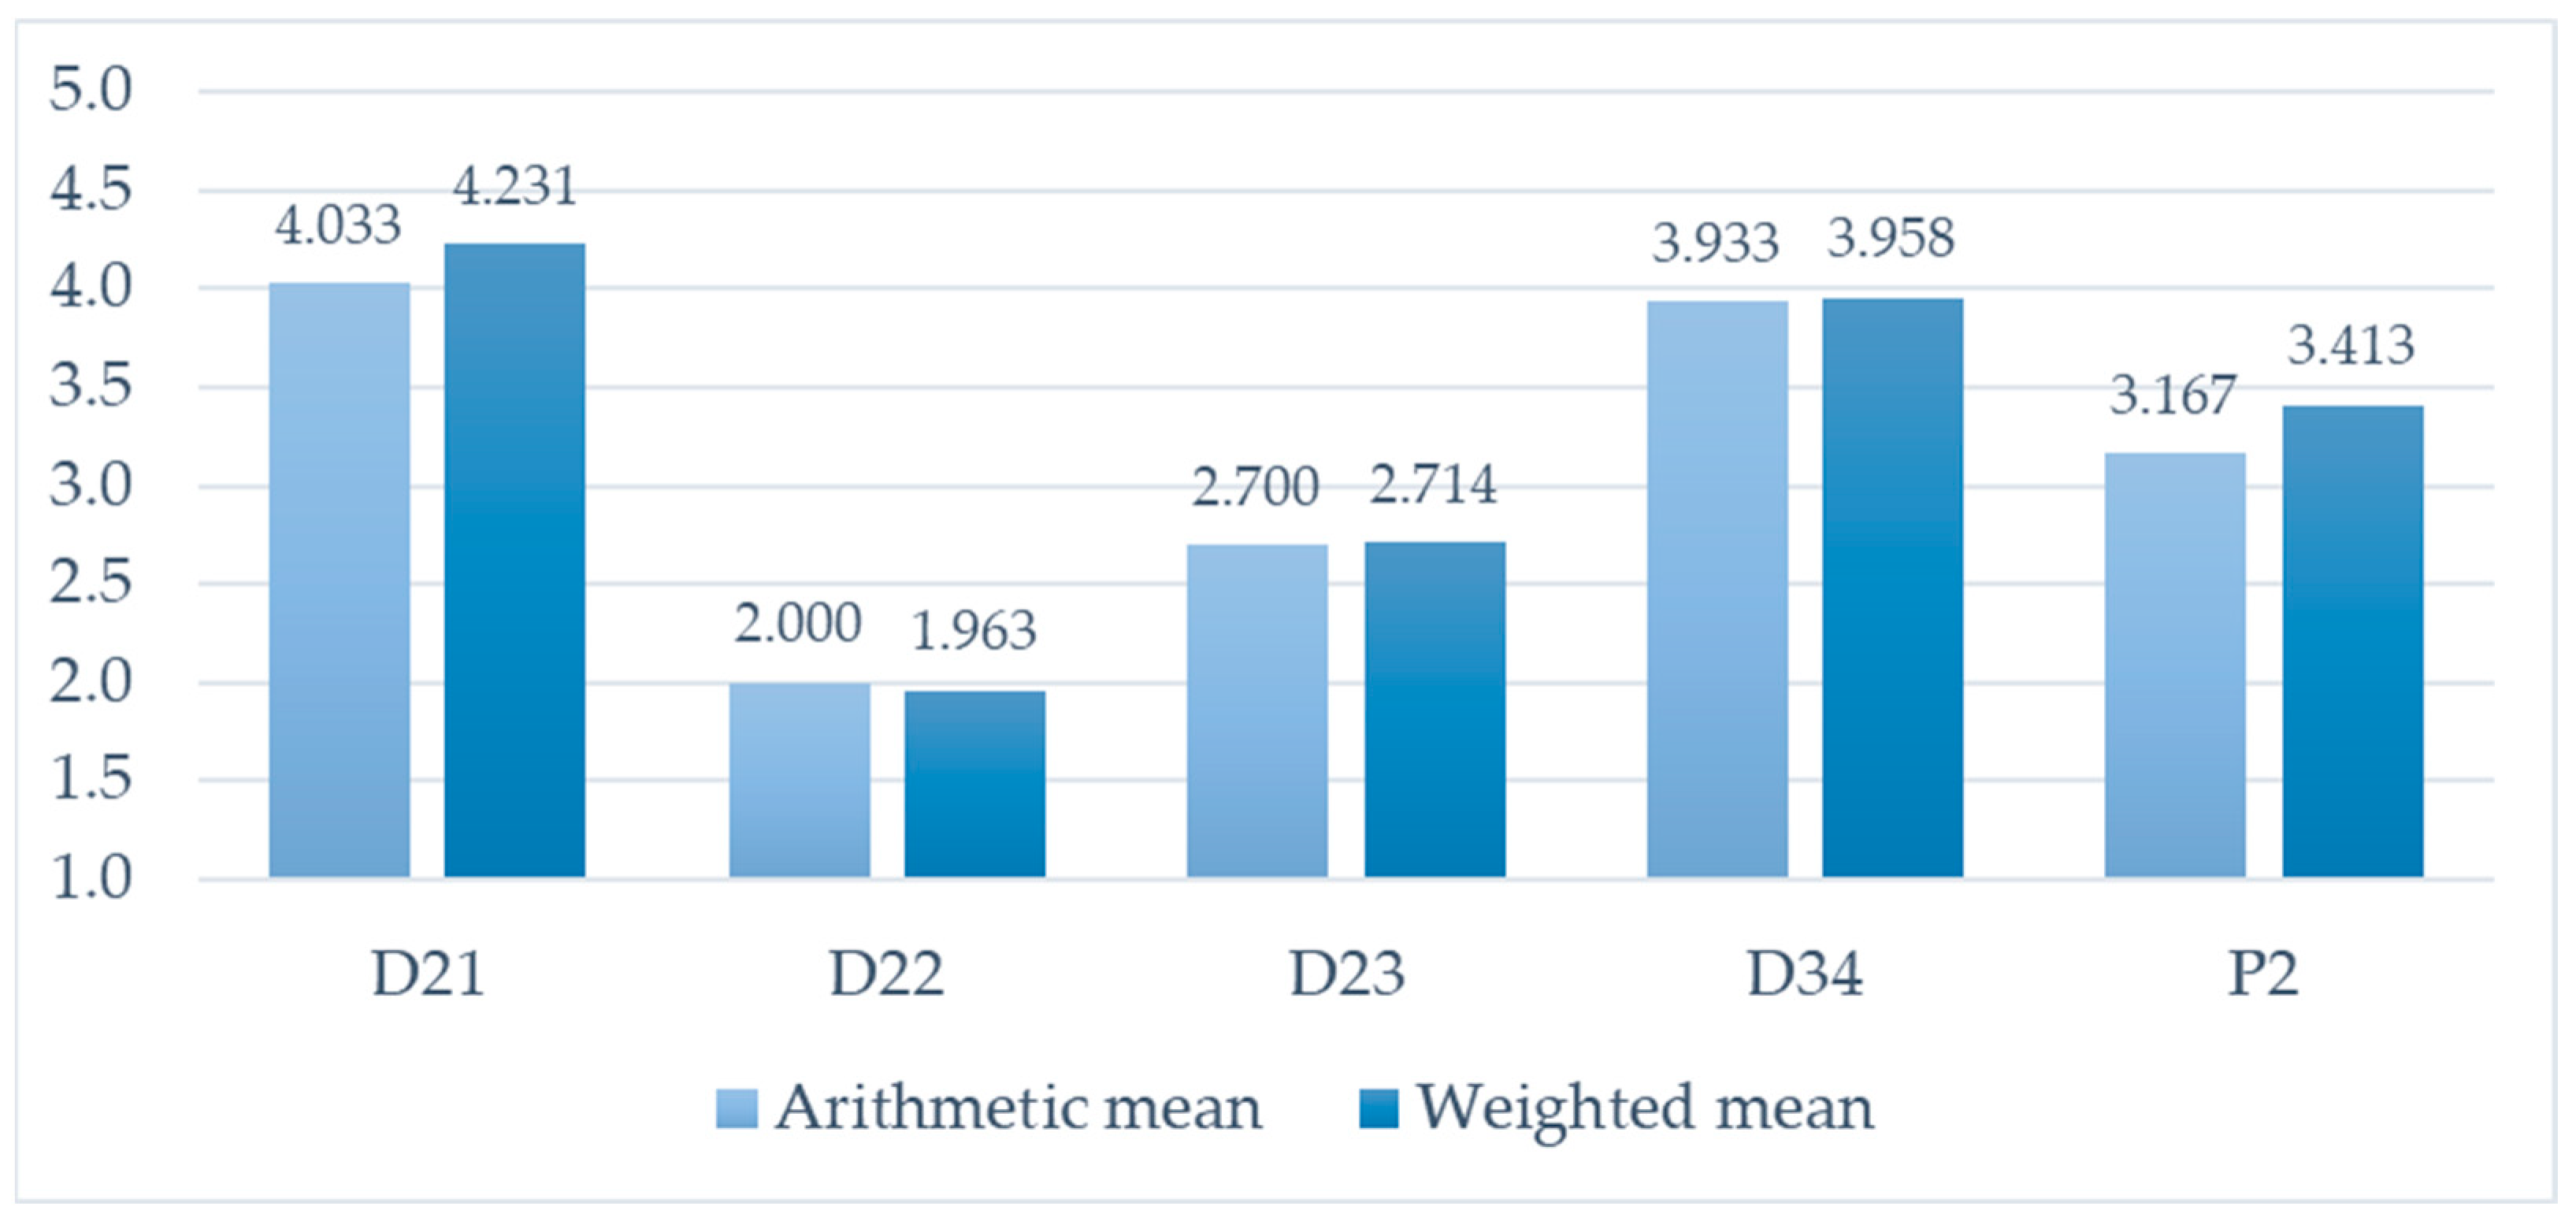
Figure 6.
Changes in the impact assessment of perspective P3.
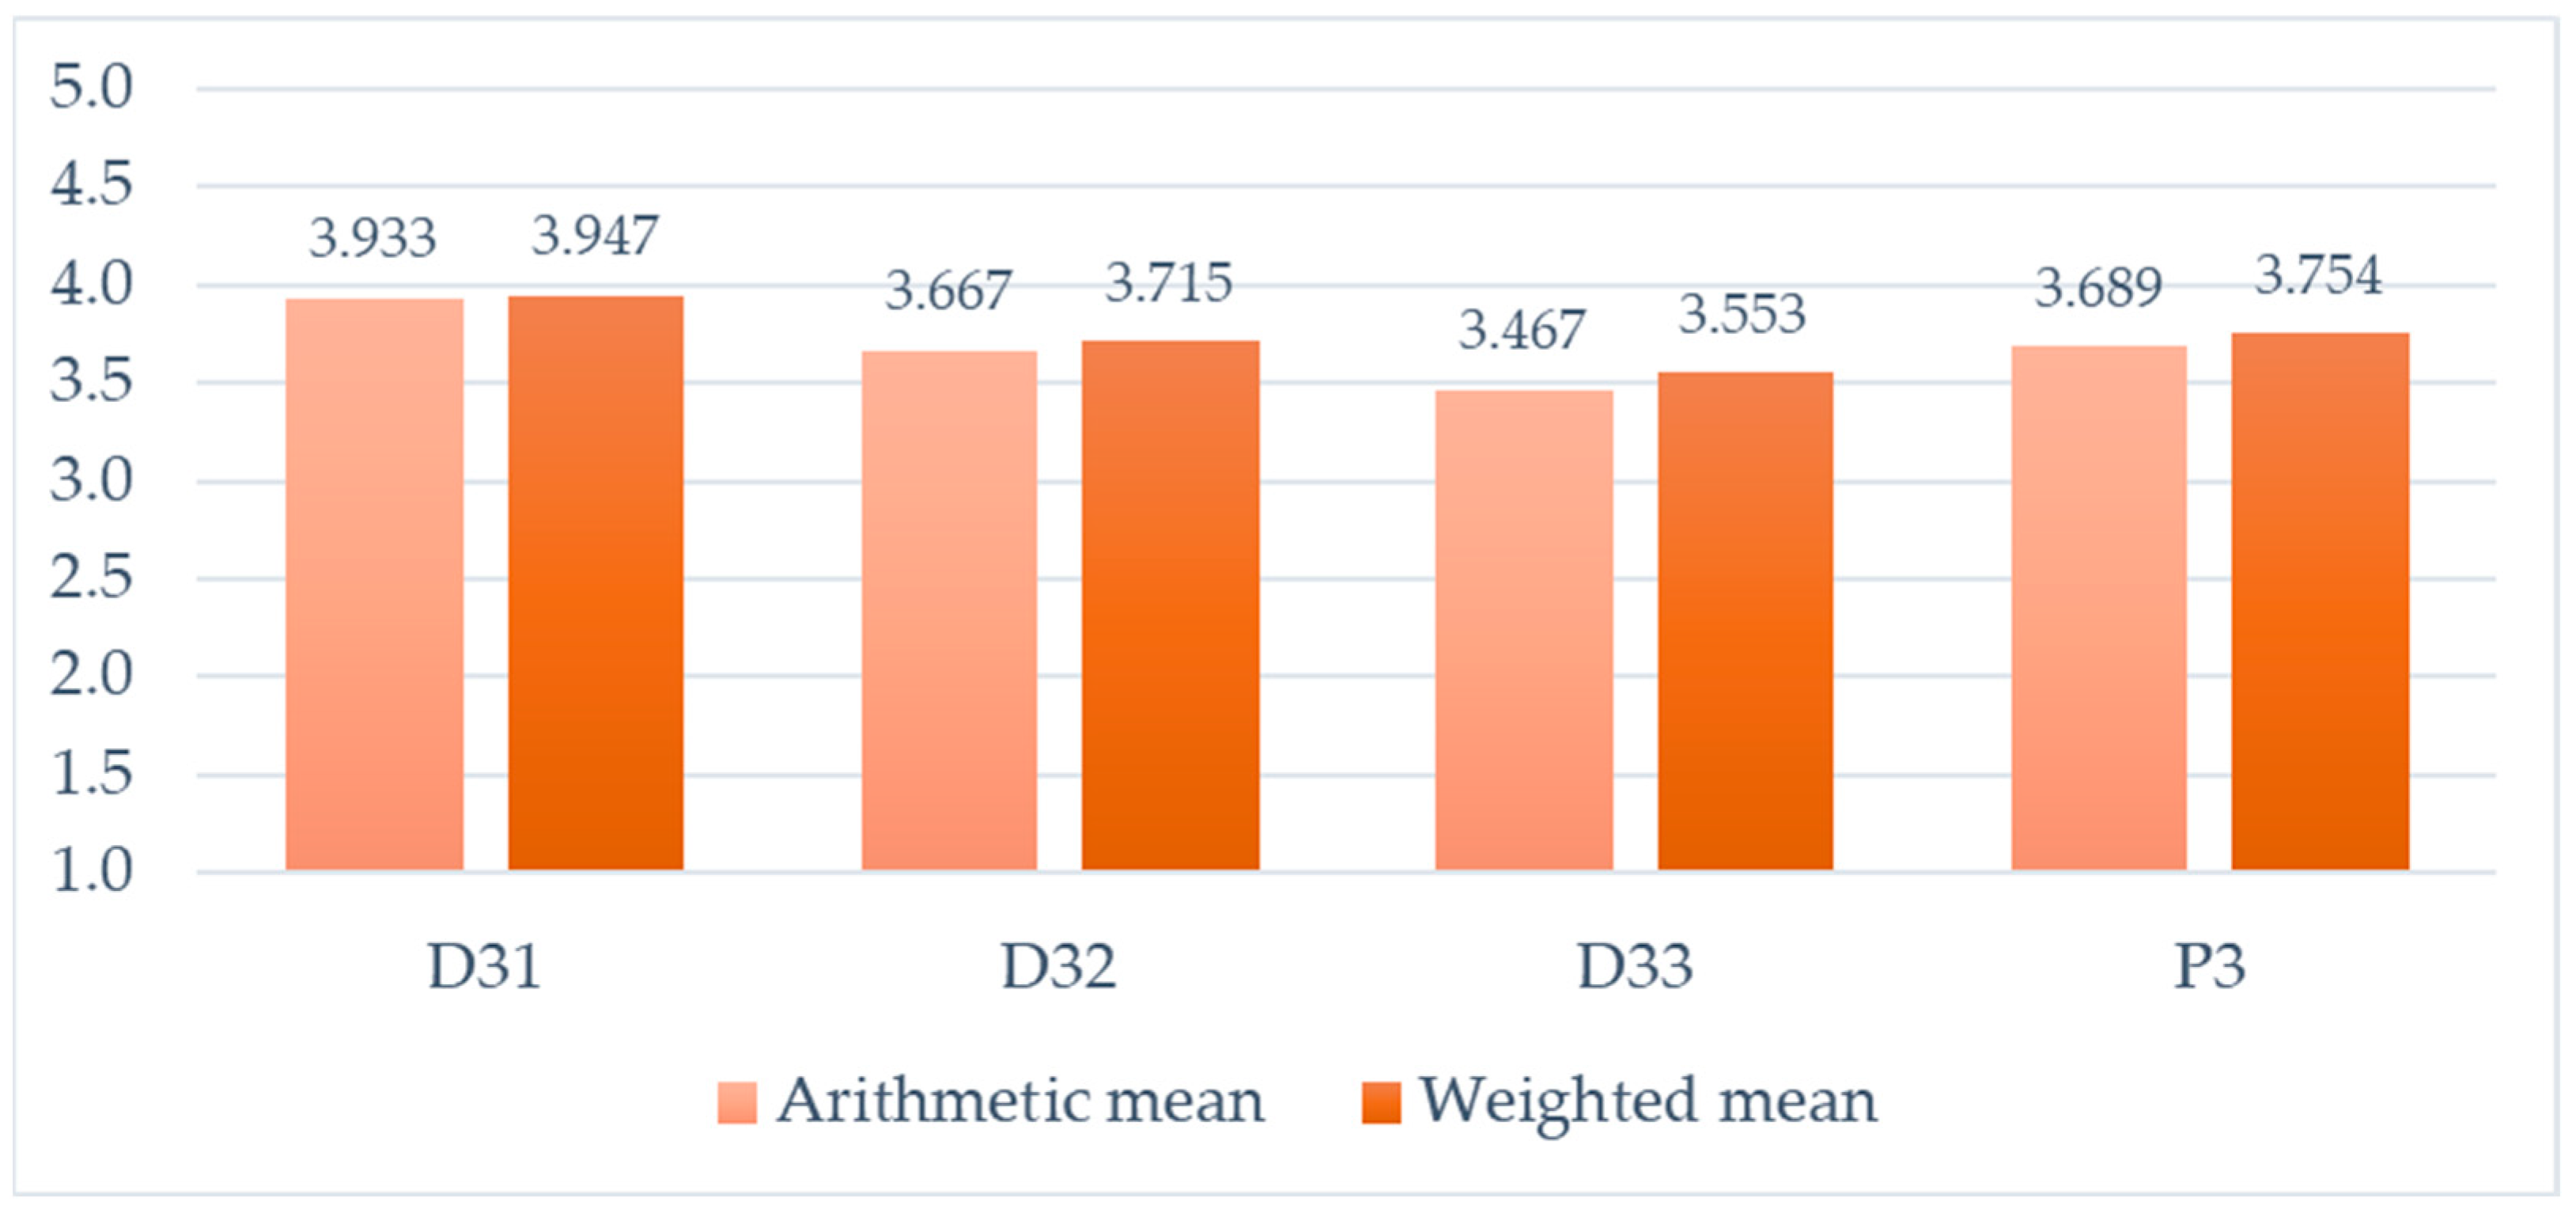

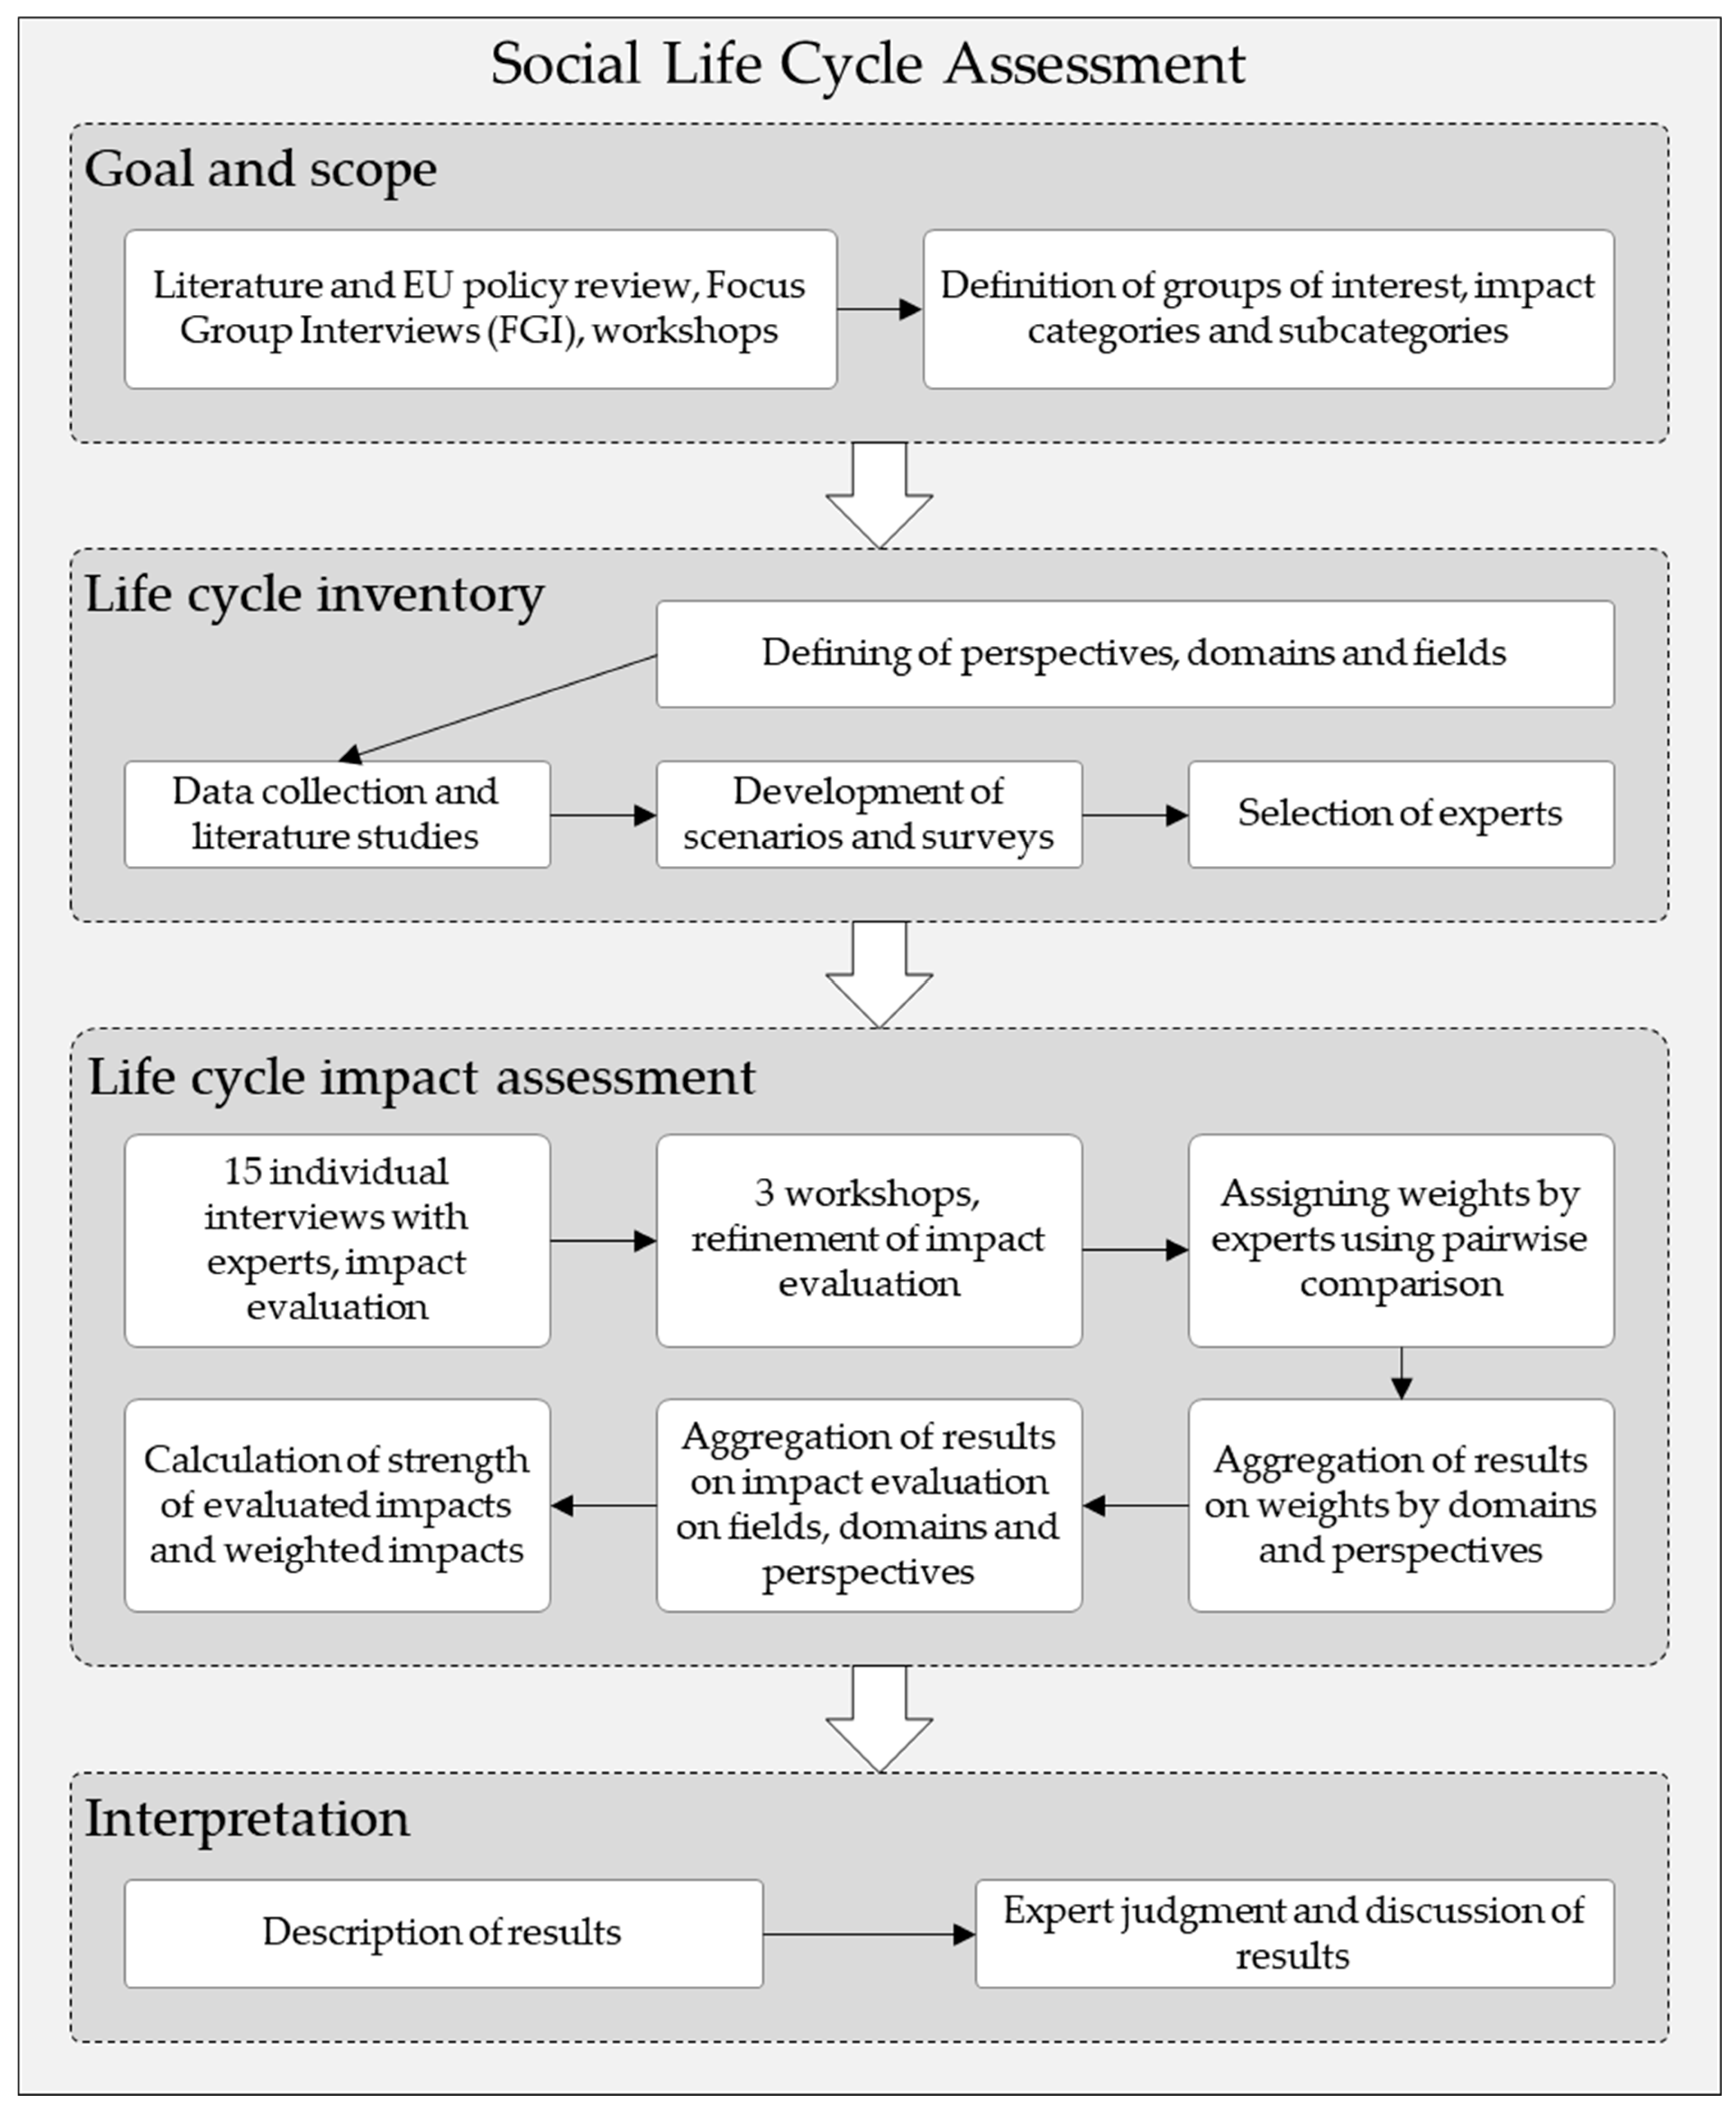
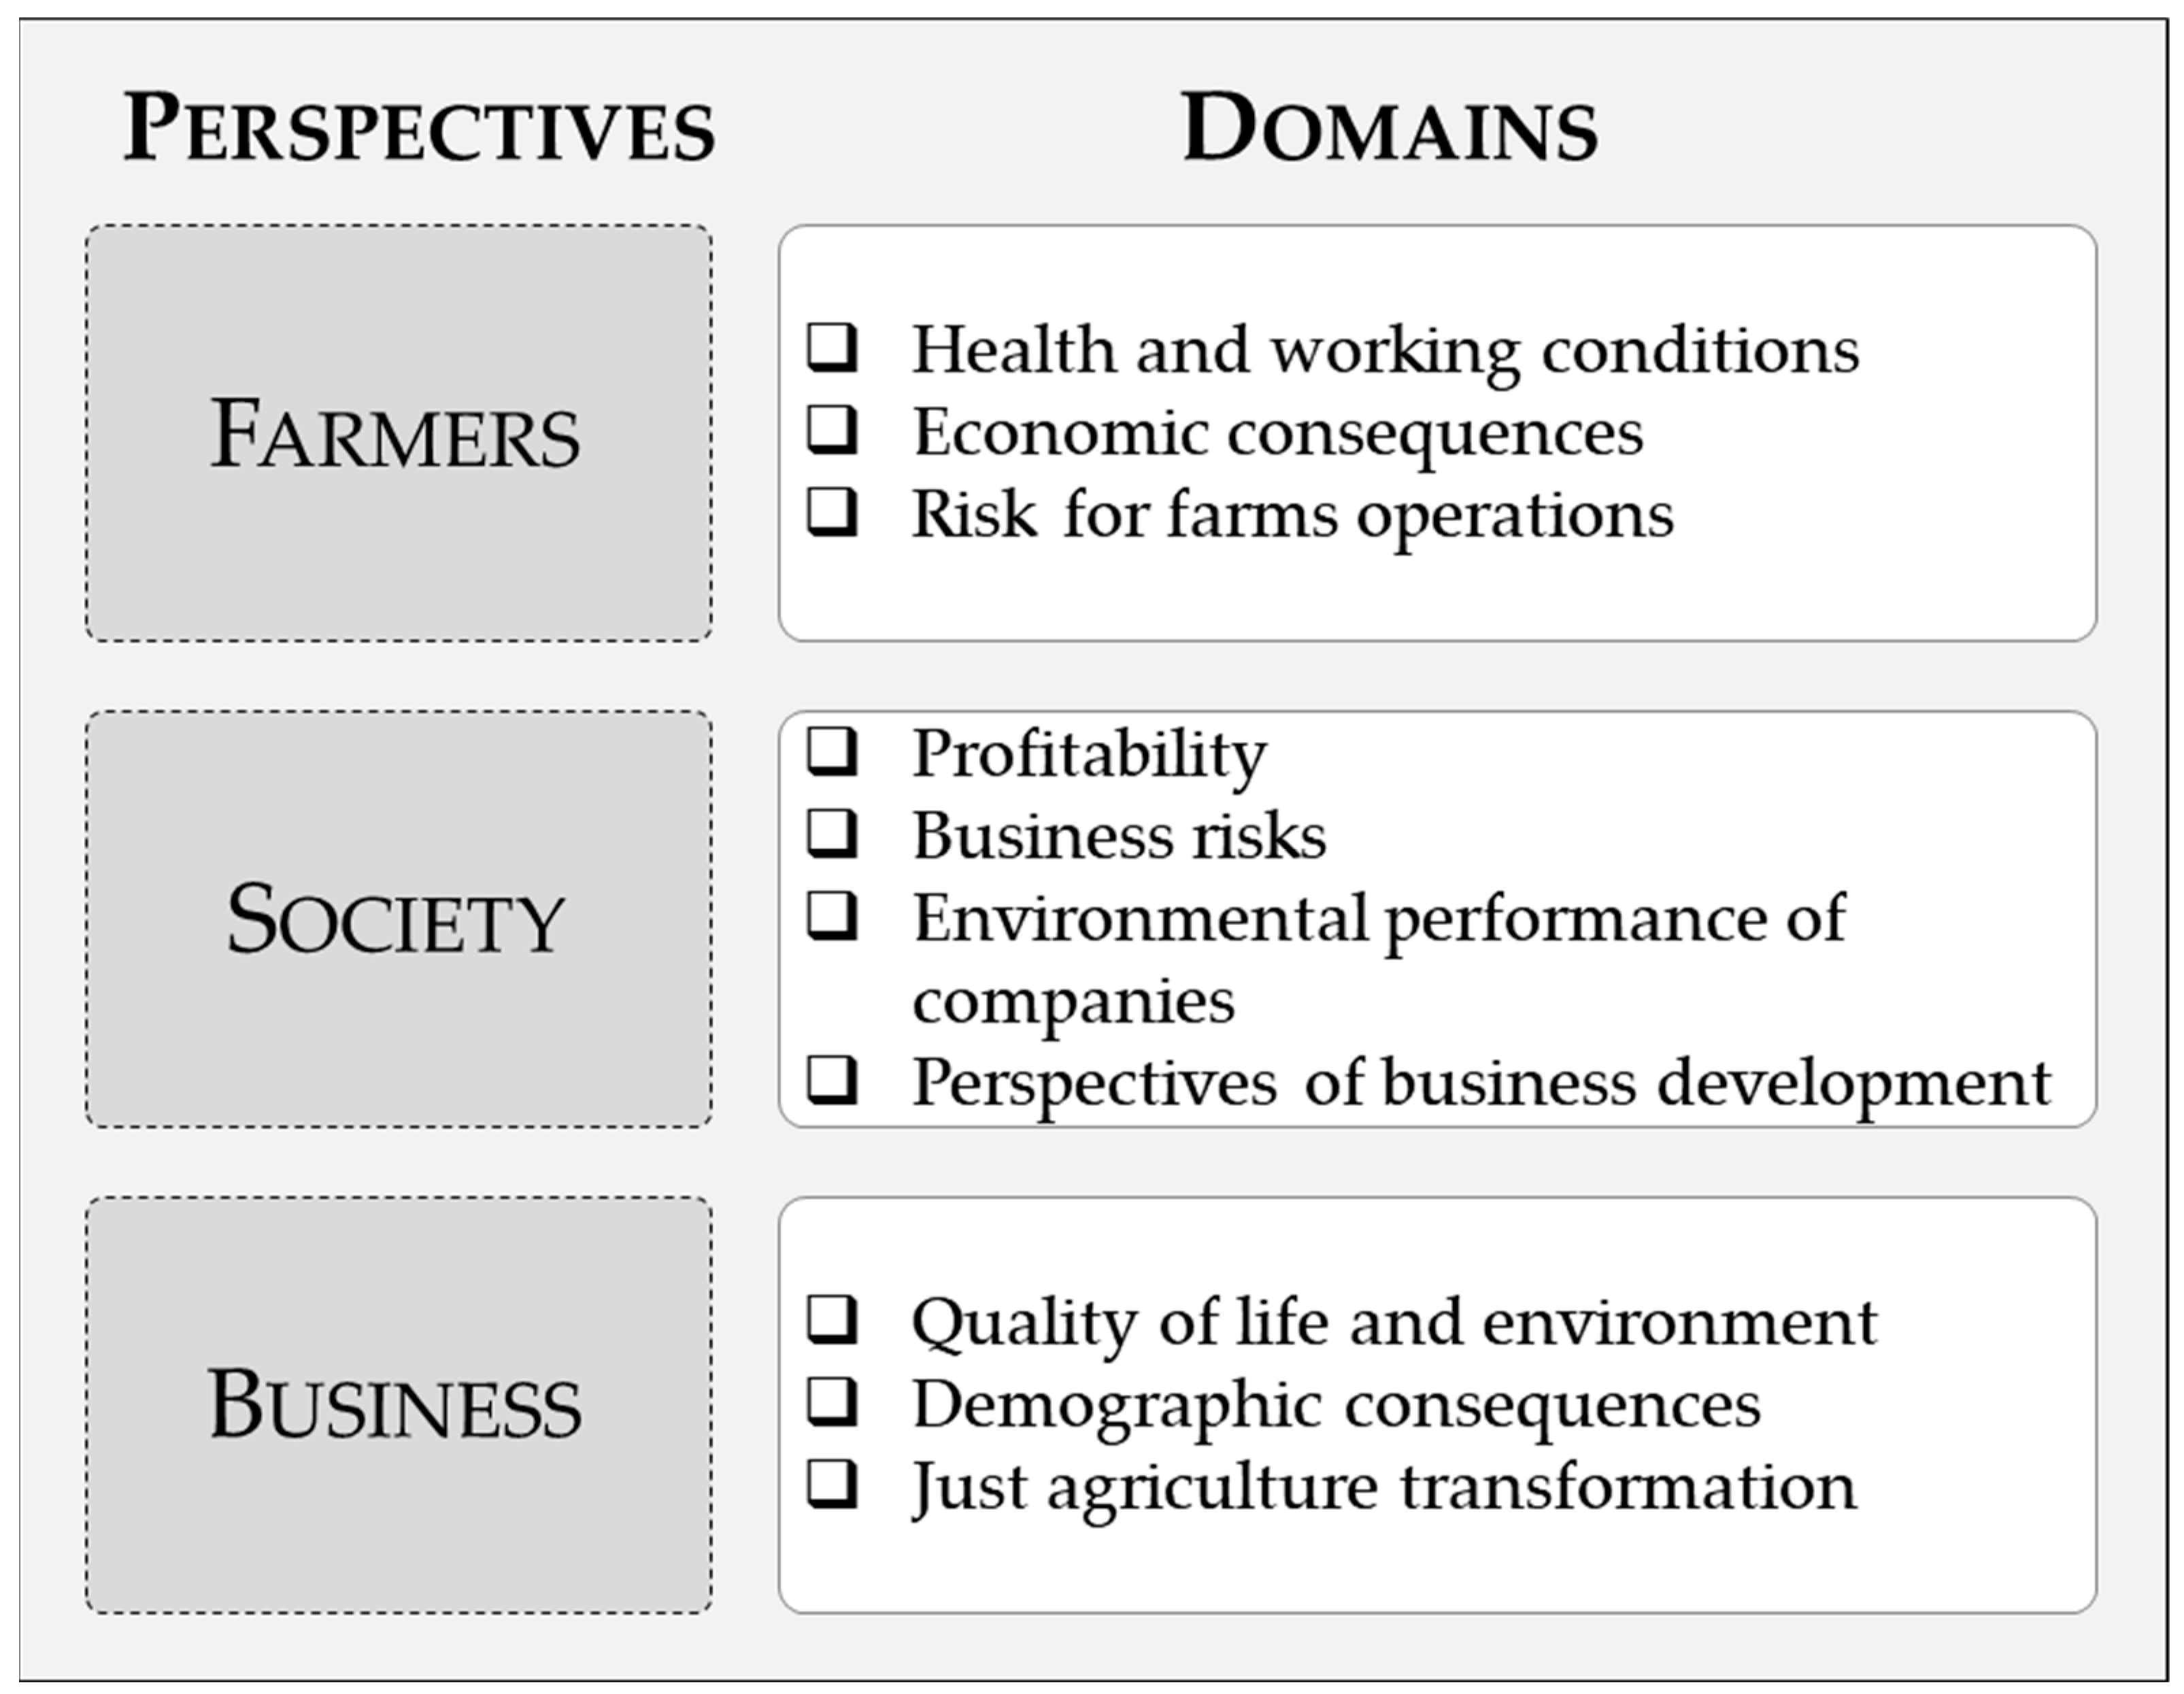
Table 1.
Questionnaire structure with justification of its formulation.
| Perspective | Category (Domain) Subcategory (Field) | Literature | FGI | EU Policy |
|---|---|---|---|---|
| Farmers | Category: Health and working conditions | |||
| Subcategories: What impact will the use of devices such as an autonomous laser weeder have on: | ||||
| The farmer’s working time? | [51,58,59,60] | X | [61] | |
| Comfort of work? | [51,58,59,62,63] | X | [61] | |
| Work safety and accidents? | [11,62,64,65,66] | X | [61] | |
| Health conditions (chemical hazards caused by the use of chemical plant protection products, back problems due to manual weeding)? | [58,59,62,67,68,69,70,71,72] | X | [61] | |
| Category: Economic consequences | ||||
| Subcategories: What impact will the use of devices such as an autonomous laser weeder have on: | ||||
| Good quality agricultural products that meet customers’ needs? | [73,74] | X | [61] | |
| Farms’ productivity per hectare? | [58,59,63,75] | X | [61] | |
| Demand for seasonal/temporary workers? | [76] | X | [61] | |
| Production costs | [14,77,78,79,80,81] | X | [61] | |
| Category: Risk for farm operation | ||||
| Subcategories: What impact will the implementation/purchase/rental of devices such as an autonomous laser weeder have on: | ||||
| Risks related to unexpected functional limitations of the device? | [65,66,82,83,84] | X | - | |
| Farmers’ liability for damage to third-party property caused by the device? | [65,84] | X | - | |
| Risk of theft or damaging the device? | - | X | - | |
| Society | Category: Quality of life and environment | |||
| Subcategories: What impact will the use of devices such as an autonomous laser weeder have on values determining the quality of life due to the limitation of methods used so far (including current weeding practices based on chemical plant protection products)? | ||||
| Quality and safety of agricultural products? | [73,85,86] | X | [61] | |
| State of the environment | [72,87,88,89] | X | [90,91] | |
| Affordability of agricultural products for the society | [92,93] | X | [61] | |
| Category: Demographic consequences | ||||
| Subcategories: What will be the impact of the availability of devices such as an autonomous laser weeder on the following demographic groups compared to the existing practice of weeding: | ||||
| Young people’s interest in running a farm? | [94,95,96,97] | X | [98] | |
| Women’s interest in working in agriculture? | [31,60,94,99,100,101,102] | X | [98] | |
| The demand for low-skilled labor? | [14,60,70,103] | X | [98] | |
| Category: Just agriculture transition | ||||
| Subcategories: What impact will the widespread use of devices such as an autonomous laser weeder have on the following aspects of rural transformation in the long term perspective compared to the existing practice of weeding: | ||||
| The agrarian structure of agriculture? | [31,104,105,106] | - | [98] | |
| Development of ecological (organic) farms? | [107,108] | X | [109] | |
| Economic diversification of rural areas? | [60,110,111] | X | [98] | |
| Business | Category: Profitability | |||
| Subcategories: What impact will the widespread use of devices such as an autonomous laser weeder have on profits of the following branches in the value chain compared to the existing practice of weeding: | ||||
| Profits of companies producing the machines | [70] | - | - | |
| Profits of agri-food and food processing industry? | [112] | - | [61] | |
| Profits of agricultural producers/farmers/producers groups? | [112,113,114,115] | X | [61] | |
| Category: Business risks | ||||
| Subcategories: What impact will the production of devices such as an autonomous laser weeder have on the following risks for the manufacturers with regard to the producers of alternative weeding machines | ||||
| Manufacturer’s responsibility for product malfunctions (complaints, service)? | [116,117] | X | [118] | |
| Manufacturer’s responsibility for the damage to the user or third-party property caused by the device? | [94] | X | [119] | |
| Manufacturer’s risk for the supply chain interruption in manufacturing processes? | [120,121] | - | - | |
| Category: Environmental performance of companies | ||||
| Subcategories: What impact will the wide-scale production of devices such as autonomous laser weeders have on the following environmental aspects with regard to alternative weeding machines? | ||||
| Demand for critical resources? | [122] | - | [123] | |
| Manufacturer’s responsibility for waste management of devices in its post-consumption phase? | [119] | - | [124] | |
| Production pressure on the environment? | [125,126] | - | [90] | |
| Category: Perspectives of business development | ||||
| Subcategories: What impact will the production and wide use of laser weeder have on perspectives of business development: | ||||
| Creation of new jobs? | [76,83] | X | [1,61] | |
| New prospects for the company’s development? | [76,88,127] | X | [1,61] | |
| Strengthening competencies of organizations, companies and workers? | [76,128] | - | [61] | |
X—issue indicated by the FGI participants as important.
Table 2.
Description of expert group and experts taking part in the process of assessment.
| Perspective | Description of Expert Group | Expert NO | Experts Description |
|---|---|---|---|
| Farmers | The experts are both farmers who run farms (organic and/or conventional) and people who collaborate and share experiences with research institutions, industry, farmers and the local community, who are members of producer groups and/or perform various functions, including an international network dedicated to innovation-driven research in the field of smart agriculture. | 1 | Polish farmer (organic) |
| 2 | Researcher, coordinator of the European network dedicated to the promotion of smart farming technologies | ||
| 3 | Danish Farmer (conventional) | ||
| 4 | Polish farmer (organic) | ||
| 5 | Farmer, representative of the Polish agricultural production group. | ||
| Society | The experts are local activists, representatives of NGOs and research organizations involved in the development of cooperation networks for the development of rural areas, as well as European organizations. The experts are committed to supporting sustainable rural development, modernization and the introduction of technologies and practices aimed at improving high-quality and safe agricultural and food products. They work with organizations that promote agricultural practices that have a positive impact on the environment. | 1 | researcher, representative of the International Center for Research in Organic Agriculture. |
| 2 | Researcher, coordinator of the European network dedicated to sustainable rural development. | ||
| 3 | President of the Regional Chamber of Agriculture in Poland | ||
| 4 | Member of European organization focused on organic farming, participant of international working groups, local activist. | ||
| 5 | Manager of the Polish NGO whose activities are focused on agricultural development | ||
| Business | The experts are representatives of companies that provide innovative technological solutions for farmers; advice on agricultural crops and applied techniques and technologies, including agricultural machinery; and training for farmers. Some of them carry out research and development work for the implementation of innovative technologies in agricultural practice. | 1 | Representative of the company of European coverage focused on the cultivation and sale of agricultural produce. |
| 2 | Innovation broker, representative of innovation network for Polish agriculture. | ||
| 3 | Representative of a Danish company providing service and advice to farmers and business operators. | ||
| 4 | Representative of a Polish company dedicated to precision agriculture implementation. | ||
| 5 | Sales representative of the Danish company dealing with innovative agricultural robots. |
Table 3.
The assignment of numerical rates to the preference scale.
| Numerical Rate | Scale of Preferences |
|---|---|
| 1 | Equal preference |
| 1 1/2 | Intermediate preferences |
| 2 | Equal to moderate preference |
| 2 1/2 | Intermediate preferences |
| 3 | Moderately preference |
| 3 1/2 | Intermediate preferences |
| 4 | Moderately to strong preference |
| 4 1/2 | Intermediate preferences |
| 5 | Strong preference |
Table 4.
Preferences from farmers’ perspective (P1).
| Code | Domains and Fields | |||
|---|---|---|---|---|
| D11 | Health and working conditions | 1/3 | 0.3257 | −2.29% |
| D12 | Economic consequences | 1/3 | 0.4006 | 20.17% |
| D13 | Risk for farm operations | 1/3 | 0.2738 | −17.87% |
| F111 | The farmer’s working time | 1/4 | 0.2204 | −11.83% |
| F112 | Comfort of work | 1/4 | 0.2157 | −13.73% |
| F113 | Work safety and accidents | 1/4 | 0.2900 | 16.01% |
| F114 | Health conditions | 1/4 | 0.2739 | 9.55% |
| F121 | Good quality agricultural products that meet customers’ needs | 1/4 | 0.2483 | −0.66% |
| F122 | Farms’ productivity per hectare | 1/4 | 0.1838 | −26.50% |
| F123 | Demand on seasonal/temporary workers | 1/4 | 0.2307 | −7.74% |
| F124 | Production costs | 1/4 | 0.3373 | 34.90% |
| F131 | Risks related to unexpected functional limitations of the device | 1/3 | 0.4009 | 20.26% |
| F132 | Farmers’ liability for damage to third-party property caused by the device | 1/3 | 0.2816 | −15.52% |
| F133 | Risk of theft or damaging the device | 1/3 | 0.3176 | −4.73% |
Source: Authors’ calculation on the base of WeLASER project data.
Table 5.
Preferences from business perspective (P2).
| Code | Domains (D) and Fields (F) | |||
|---|---|---|---|---|
| D21 | Profitability | 1/4 | 0.2868 | 14.72% |
| D22 | Business risks | 1/4 | 0.1935 | −22.60% |
| D23 | Environmental performance of companies | 1/4 | 0.1907 | −23.72% |
| D24 | Perspectives of business development | 1/4 | 0.3290 | 31.60% |
| F211 | Profits of companies producing the machines | 1/3 | 0.4839 | 45.17% |
| F212 | Profits of agri-food and food processing industry | 1/3 | 0.1398 | −58.06% |
| F213 | Profits of agricultural producers/farmers/producers groups | 1/3 | 0.3762 | 12.86% |
| F221 | Manufacturer’s responsibility for product malfunctions (complaints, service) | 1/3 | 0.4417 | 32.51% |
| F222 | Manufacturer’s responsibility for the damage to the user or third-party property caused by the device | 1/3 | 0.2995 | −10.15% |
| F223 | Manufacturer’s risk for the supply chain interruption in manufacturing processes | 1/3 | 0.2588 | −22.36% |
| F231 | Demand on critical resources | 1/3 | 0.2992 | −10.24% |
| F232 | Manufacturer’s responsibility for waste management of devices in its post-consumption phase | 1/3 | 0.3597 | 7.91% |
| F233 | Production’s pressure on the environment | 1/3 | 0.3412 | 2.36% |
| F241 | Creation of new jobs | 1/3 | 0.2115 | −36.55% |
| F242 | New prospects for the company development | 1/3 | 0.4684 | 40.52% |
| F243 | Strengthening competencies of organizations, companies and workers | 1/3 | 0.3201 | −3.97% |
Source: Authors’ calculation on the base of WeLASER project data.
Table 6.
Preferences from society’s perspective (P3).
| Code | Domains (D) and Fields (F) | |||
|---|---|---|---|---|
| D31 | Quality of life and environment | 1/3 | 0.4183 | 25.49% |
| D32 | Demographic consequences | 1/3 | 0.2254 | −32.38% |
| D33 | Just agriculture transformation | 1/3 | 0.3563 | 6.89% |
| F311 | Quality and safety of agricultural products | 1/3 | 0.2922 | −12.34% |
| F312 | State of the environment | 1/3 | 0.3639 | 9.17% |
| F313 | Affordability of agricultural products for the society | 1/3 | 0.3439 | 3.17% |
| F321 | Young people’s interest in running a farm | 1/3 | 0.4173 | 25.19% |
| F322 | Women’s interest in working in agriculture | 1/3 | 0.3308 | −0.76% |
| F323 | The demand for low-skilled labour | 1/3 | 0.2520 | −24.40% |
| F331 | The agrarian structure of agriculture | 1/3 | 0.2550 | −23.50% |
| F332 | Development of ecological (organic) farms | 1/3 | 0.4412 | 32.36% |
| F333 | Economic diversification of rural areas | 1/3 | 0.3038 | −8.86% |
Source: Authors’ calculation on the base of WeLASER project data.
Table 7.
Farmers’ perspective. Impact assessment and evaluation of opinion strength.
| Code | Domains (D) and Fields (F) | Impact Scores | Impact Evaluation | Rating of Strength |
|---|---|---|---|---|
| D11 | Health and working conditions (average) | 4.350 | positive | normal |
| D12 | Economic consequences (average) | 4.375 | positive | strong |
| D13 | Risk for farm operations (average) | 3.517 | positive | weak |
| F111 | The farmer’s working time | 4.200 | positive | normal |
| F112 | Comfort of work | 4.600 | very positive | normal |
| F113 | Work safety and accidents | 4.200 | positive | normal |
| F114 | Health conditions | 4.400 | positive | normal |
| F121 | Good quality agricultural products that meet customers’ needs | 4.400 | positive | normal |
| F122 | Farms’ productivity per hectare | 4.500 | positive | weak |
| F123 | Demand on seasonal/temporary workers | 5.000 | very positive | normal |
| F124 | Production costs | 3.600 | positive | strong |
| F131 | Risks related to unexpected functional limitations of the device | 3.750 | positive | strong |
| F132 | Farmers’ liability for damage to third-party property caused by the device | 3.900 | positive | normal |
| F133 | Risk of theft or damaging the device | 2.900 | neutral | normal |
Source: Authors’ calculation on the base of WeLASER project data.
Table 8.
Business perspective. Impact assessment and opinion evaluation strength.
| Code | Domains (D) and Fields (F) | Impact Scores | Impact Evaluation | Rating of Strength |
|---|---|---|---|---|
| D21 | Profitability (average) | 4.033 | positive | normal |
| D22 | Business risks (average) | 2.000 | negative | normal |
| D23 | Environmental performance of companies (average) | 2.700 | neutral | normal |
| D34 | Perspectives of business development (average) | 3.933 | positive | strong |
| F211 | Profits of companies producing the machines | 4.700 | very positive | strong |
| F212 | Profits of agri-food and food processing industry | 3.500 | neutral | weak |
| F213 | Profits of agricultural producers/farmers/producers groups | 3.900 | positive | normal |
| F221 | Manufacturer’s responsibility for product malfunctions (complaints, service) | 1.800 | negative | strong |
| F222 | Manufacturer’s responsibility for the damage to the user or third-party property caused by the device | 2.000 | negative | normal |
| F223 | Manufacturer’s risk for the supply chain interruption in manufacturing processes | 2.200 | negative | normal |
| F231 | Demand on critical resources | 2.400 | negative | normal |
| F232 | Manufacturer’s responsibility for waste management of devices in its post-consumption phase | 2.800 | neutral | normal |
| F233 | Production’s pressure on the environment | 2.900 | neutral | normal |
| F241 | Creation of new jobs | 3.800 | positive | weak |
| F242 | New prospects for the company development | 4.000 | positive | strong |
| F243 | Strengthening competencies of organizations, companies and workers | 4.000 | positive | normal |
Source: Authors’ calculation on the base of WeLASER project data.
Table 9.
Society perspective. Impact assessment and evaluation of opinion strength.
| Code | Domains (D) and Fields (F) | Impact Scores | Impact Evaluation | Rating of Strength |
|---|---|---|---|---|
| D31 | Quality of life and environment (averages) | 3.933 | positive | strong |
| D32 | Demographic consequences (averages) | 3.667 | positive | weak |
| D33 | Just agriculture transformation (averages) | 3.467 | neutral | normal |
| F311 | Quality and safety of agricultural products | 4.000 | positive | normal |
| F312 | State of the environment | 4.800 | very positive | normal |
| F313 | Affordability of agricultural products for the society | 3.000 | neutral | normal |
| F321 | Young people’s interest in running a farm | 3.800 | positive | strong |
| F322 | Women’s interest in working in agriculture | 4.000 | positive | normal |
| F323 | The demand for low-skilled labor | 3.200 | neutral | weak |
| F331 | The agrarian structure of agriculture | 3.200 | neutral | weak |
| F332 | Development of ecological (organic) farms | 4.000 | positive | strong |
| F333 | Economic diversification of rural areas | 3.200 | neutral | normal |
Source: Authors’ calculation on the base of WeLASER project data.
Table 10.
Farmers’ perspective. New impact assessment based on weighted means.
| Code | Domains | Arithmetic Mean | Weighted Mean | New Evaluation |
|---|---|---|---|---|
| D11 | Health and working conditions | 4.350 | 4.341 | positive |
| D12 | Economic consequences | 4.375 | 4.287 | positive |
| D13 | Risk for farm operations | 3.517 | 3.522 | positive |
| P1 | Farmers perspective | 4.081 | 4.095 | positive |
Source: Authors’ calculation on the base of WeLASER project data.
Table 11.
Business perspective. New impact assessment based on weighted means.
| Code | Domains | Arithmetic Mean | Weighted Mean | New Evaluation |
|---|---|---|---|---|
| D21 | Profitability | 4.033 | 4.231 | positive |
| D22 | Business risks | 2.000 | 1.963 | negative |
| D23 | Environmental performance of companies | 2.700 | 2.714 | neutral |
| D34 | Perspectives of business development | 3.933 | 3.958 | positive |
| P2 | Business perspective | 3.167 | 3.413 | neutral |
Source: Authors’ calculation on the base of WeLASER project data.
Table 12.
Society perspective. New impact assessment based on weighted means.
| Code | Domains | Arithmetic Mean | Weighted Mean | New Evaluation |
|---|---|---|---|---|
| D31 | Quality of life and environment | 3.933 | 3.947 | positive |
| D32 | Demographic consequences | 3.667 | 3.715 | positive |
| D33 | Just agriculture transformation | 3.467 | 3.553 | positive |
| P3 | Society perspective | 3.689 | 3.754 | positive |
Source: Authors’ calculation on the base of WeLASER project data.
Disclaimer/Publisher’s Note: The statements, opinions and data contained in all publications are solely those of the individual author(s) and contributor(s) and not of MDPI and/or the editor(s). MDPI and/or the editor(s) disclaim responsibility for any injury to people or property resulting from any ideas, methods, instructions or products referred to in the content. |
© 2024 by the authors. Licensee MDPI, Basel, Switzerland. This article is an open access article distributed under the terms and conditions of the Creative Commons Attribution (CC BY) license (https://creativecommons.org/licenses/by/4.0/).
Share and Cite
MDPI and ACS Style
Michaliszyn-Gabryś, B.; Bronder, J.; Krupanek, J. Social Life Cycle Assessment of Laser Weed Control System: A Case Study. Sustainability 2024, 16, 2590. https://doi.org/10.3390/su16062590
AMA Style
Michaliszyn-Gabryś B, Bronder J, Krupanek J. Social Life Cycle Assessment of Laser Weed Control System: A Case Study. Sustainability. 2024; 16(6):2590. https://doi.org/10.3390/su16062590
Chicago/Turabian StyleMichaliszyn-Gabryś, Beata, Joachim Bronder, and Janusz Krupanek. 2024. "Social Life Cycle Assessment of Laser Weed Control System: A Case Study" Sustainability 16, no. 6: 2590. https://doi.org/10.3390/su16062590
Note that from the first issue of 2016, this journal uses article numbers instead of page numbers. See further details here.