
Accounting for Greenhouse Gas Emissions in the Agricultural System of China Based on the Life Cycle Assessment Method


School of Public Administration and Law, Northeast Agricultural University, Harbin 150030, China
*
Author to whom correspondence should be addressed.
Sustainability 2024, 16(6), 2594; https://doi.org/10.3390/su16062594
Submission received: 12 January 2024
/
Revised: 13 March 2024
/
Accepted: 19 March 2024
/
Published: 21 March 2024
(This article belongs to the Section Air, Climate Change and Sustainability)
Abstract
:Agricultural systems contribute nearly one-third of global anthropogenic GHG emissions and are an important source of GHGs globally. The clarification of the GHG emission pattern from agriculture is of paramount importance in the establishment of an agricultural emission reduction mechanism and the realization of China’s dual-carbon target. Based on the life cycle assessment method (LCA), this paper comprehensively quantifies the greenhouse gas emissions from the agricultural system in China, encompassing rice, wheat, and corn cultivation as well as animal husbandry including cows, horses, donkeys, mules, camels, pigs, and sheep. The analysis covers the period 2000–2020 and examines the spatial distribution, temporal trends, and structural changes in the greenhouse gas emissions within China’s agriculture sector. The main results are as follows: (1) from 2000 to 2020, China witnessed a consistent upward trajectory in its total agricultural GHG emissions, exhibiting an average annual growth rate of 0.73%. Notably, methane (CH4) emissions emerged as the largest contributor, displaying an overall fluctuating pattern. Carbon dioxide (CO2) emissions demonstrated intermittent increases with a noteworthy annual growth rate of 3%, signifying the most rapid expansion within this context. Conversely, nitrous oxide (N2O) emissions experienced decline over the specified period. (2) GHG emissions from cultivation demonstrate an upward trajectory, primarily driven by the CH4 emissions originating from rice cultivation and CO2 resulting from straw incineration. Conversely, GHG emissions stemming from animal husbandry declined, with the primary source being CH4 emissions arising from animal enteric fermentation. Agricultural N2O emissions predominantly arise due to manure management and nitrogen fertilizer application. (3) Agricultural greenhouse gas emissions exhibit significant variations in spatial distribution, gradually concentrating towards the North China Plain, the middle and lower reaches of the Yangtze River, and the northeast. Specifically, agricultural CH4 emissions are progressively concentrated in China’s pivotal rice-growing regions, encompassing the middle and lower reaches of the Yangtze River Plain, as well as livestock breeding areas like Inner Mongolia. Agricultural CO2 emissions primarily concentrate in dryland crop production zones such as North China and Northeast China. Meanwhile, Agricultural N2O emissions predominantly occur in Inner Mongolia and the North China Plain. China’s agricultural greenhouse gas emissions in 2020 show a significant spatial clustering effect, with hotspots primarily concentrated in Shandong, Anhui, Henan, and other regions and cold spots focused in the western and southern areas. The emission patterns of agricultural GHGs are closely intertwined with farming practices, regional development levels, and national policy; hence, tailored measures for emission reduction should be formulated based on specific crop types, livestock categories, agricultural production activities, and regional development characteristics.
1. Introduction
Global warming, one of the major challenges facing mankind today [1], has garnered significant global attention. Greenhouse gas emissions play a significant role in climate warming, with CO2, N2O, and CH4, serving as the primary greenhouse gases that contribute significantly to the intensified greenhouse effect [2]. In response to the temperature control target in the 2016 Paris Agreement [3], nations have committed implementing impactful measures aimed at mitigating greenhouse gas emissions. China also declared, during the 75th United Nations General Assembly, its commitment to strive for achieving a carbon peak prior to 2030 and attaining carbon neutrality before 2060, with the ultimate goal of effectively mitigating greenhouse gas emissions. According to the assessment conducted by the Intergovernmental Panel on Climate Change (IPCC), the rise in greenhouse gas concentration in the atmosphere resulting from human activities stands as a primary factor contributing to the amplification of the natural greenhouse effect [4]. This in turn leads to a heightened occurrence of extreme weather events and poses significant peril to both the survival and development of humanity [5]. Global agriculture and its associated activities contribute to approximately one-third of anthropogenic greenhouse gas emissions [6]. As one of the world’s leading agricultural nations, China’s agricultural production plays a significant role in contributing to greenhouse gas emissions [7]. Studies have indicated that China’s agricultural greenhouse gas emissions are persistently increasing at an annual rate of 5% [8]. However, the agricultural sector possesses substantial potential for emission reduction [9]. Consequently, it is imperative to accurately quantify agricultural greenhouse gas emissions and analyze their spatial and temporal dynamics. This will provide a scientific foundation for mitigating these emissions and decelerating climate warming.
Numerous scholars have conducted extensive research on agricultural greenhouse gas emissions, mainly focusing on emission accounting, driving factors, and measures for emission reduction. Regarding emission accounting, it has been predominantly developed through diverse research methodologies, target subjects, and geographical regions. For instance, some researchers have employed the carbon emission factor method [10] and IPCC method [11,12] to assess China’s plantation industry in terms of carbon sources and agricultural GHG emissions. Another study utilized life cycle assessment methodology to quantify the greenhouse gas (GHG) emissions from rice production in California, USA [13]. In terms of research scope, several scholars have independently assessed the carbon footprints of rice [14], wheat, and corn [15], as well as animal husbandry practices [16]. Additionally, there are researchers who have evaluated the carbon footprints of five agricultural commodities across various farming scales and cultivation methods [17]. Regarding geographical focus, these investigations primarily encompass national levels [18,19] and provincial levels [20,21] as well as county-level analyses [22,23]. With the increasing depth of the research, there has been a growing focus on investigating the driving factors of agricultural greenhouse gas emissions [24,25,26,27]. For instance, Pang Li et al. conducted an analysis on China’s current agricultural carbon emissions and their underlying driving factors. Their findings revealed that the level of agricultural economic development plays a pivotal role in influencing the growth of agricultural carbon emissions [28]. Currently, there is an increasing emphasis on research related to the reduction of greenhouse gas emissions in agriculture, specifically focusing on investigating strategies for mitigating emissions [29,30] and estimating the potential for reducing emissions [31].
In summary, the existing studies have significantly contributed to enhancing the theoretical framework of China’s agricultural greenhouse gas emissions. They provide a solid theoretical basis and serve as valuable references for subsequent research. However, there are certain limitations that need to be addressed. Currently, most of the agricultural GHG emission accounting studies primarily rely on the emission factor method recommended by the IPCC. This approach only considers emissions from specific agricultural activities, resulting in a less comprehensive assessment. Moreover, these studies tend to focus solely on one or a few types of crops or livestock without considering the plantation industry and animal husbandry as an integrated system. Additionally, most research efforts concentrate on national or provincial scales, with limited coverage of greenhouse gases at a national level [32,33], and use only relatively short study periods. Therefore, this paper will adopt the life cycle assessment methodology to comprehensively and accurately quantify greenhouse gas emissions from crops and livestock throughout their entire growth process. It aims to assess the greenhouse gas emissions of China’s plantation and livestock industries during 2000–2020, elucidating the spatial, temporal, and structural evolution of agricultural greenhouse gas emissions in China. The objective is to precisely comprehend the trends in agricultural greenhouse gas changes and the current situation of China’s agricultural environment, while providing theoretical guidance for scientifically formulating measures to reduce agricultural greenhouse gas emissions. This study not only enhances the research framework of agricultural greenhouse gas emissions but also offers valuable insights for future investigations. It fosters innovation in agricultural technology and provides essential data to support the development of emission reduction policies. Additionally, it enhances the international attention to the issue of agricultural greenhouse gas emissions, promotes international cooperation and exchanges, and collectively contributes to achieving China’s and other nations’ targets for reducing agricultural greenhouse gas emissions, thereby making a positive impact on addressing the challenges of global climate change.
2. Materials and Methods
2.1. Definition of the Study Area
The scope of this paper is confined to 31 provinces in the interior of China, excluding Hong Kong, Macao, and Taiwan. The scope of agriculture includes four key sectors: planting, forestry, animal husbandry, and fisheries. According to the China Statistical Yearbook from 2000 to 2020, the average contribution of China’s plantation, forestry, animal husbandry, and fishery industries to the total agricultural output value is as follows: 52.73%, 3.96%, 30.19%, and 9.95%, respectively. It is evident that the cumulative proportion of plantation and animal husbandry exceeds 80%, making it the dominant sector in China’s agricultural economy. However, precise quantitative statistics for forestry are challenging, as it primarily serves as a carbon sink. Similarly, data the fishery industry lack precision. In the main crop planting structure within the planting industry, grain crops account for an average of over 69%. Rice, wheat, and corn constitute the largest sown area and serve as significant sources of CH4 and N2O emissions [34], contributing to a high carbon footprint [35]. Therefore, this paper focuses on the plantation and livestock industries within the agricultural system as research objects. The plantation industry mainly includes three major food crops: rice, wheat and corn. Meanwhile, the livestock industry includes seven types of animals: cows, horses, donkeys, mules, camels, pigs, and sheep. Poultry was excluded from the study due to its relatively minor contribution to GHG emissions from enteric fermentation and manure management. Furthermore, considering data availability and continuity factors, the years 2000–2020 were chosen for analysis purposes.
2.2. Life Cycle Assessment Methodology
Since its emergence in the late 1960s [36], the life cycle assessment method has been extensively applied across various fields. This method effectively assesses the environmental impacts and resource use throughout a product or service’s entire lifespan [37], offering comprehensive insights into its sustainability performance. Notably, this approach boasts advantages such as comprehensiveness and consideration of the entire process. Currently, the research results of this method in the agriculture sector in China have been steadily increasing [38,39], thereby providing data support for mitigating in greenhouse gas emissions in agriculture.
The system boundary of this study (Figure 1) was established based on the PAS 2050 (2008 Specification for the Evaluation of Greenhouse Gas Emissions from Goods and Services over the Life Cycle) protocol [40] as well as the life cycle assessment methodology. The methodology encompasses various phases including raw material extraction, agricultural materials production, crop production, livestock enteric fermentation, and manure management. The selected functional units for this study were GHG emissions per acre of food crops during their life cycle and GHG emissions per head of livestock from enteric fermentation and manure management.
2.3. Carbon Footprint Accounting Methods
A carbon footprint is a quantification of greenhouse gas emissions [41], including the direct and indirect carbon emissions associated with the entire life cycle of a product or service activity [42]. Referring to the global warming potential (GWP) values stated in the Fifth IPCC Bulletin, CO2, N2O, and CH4 emissions are converted to CO2-eq units, where their respective GWP values are 1, 28, and 265.
- (1)
- The carbon footprints of rice, wheat, and corn are calculated by considering various agricultural materials such as seeds, nitrogen fertilizers, phosphorus fertilizers, potash fertilizers, compound fertilizers, pesticides, and agricultural films. Additionally, the energy emissions include the diesel fuel consumed by agricultural machinery and electricity used for irrigation. It is important to note that CO2 emissions from the direct consumption of fossil fuels and electricity during raw material extraction are not counted twice, since the emission factor accounts for this portion in the direct energy consumption of the agricultural production process.
CFT,i,j = CFin,i,j + CFpro,i,j
CFin,i,j = ∑jADi,k × EFk

Table 1.
Carbon emission factors for various agricultural inputs.
| Carbon Sources | Carbon Emission Coefficients | Unit | Coefficient Source |
|---|---|---|---|
| Seeds | Rice: 1.84 Wheat: 0.58 Corn: 1.93 | kgCO2-eq/kg | ecoinvent 2.2 [43] |
| Nitrogen fertilizers | 1.53 | CLCD 0.7 [44] | |
| Phosphorus fertilizers | 1.63 | ||
| Potash fertilizers | 0.65 | ||
| Compound fertilizers | 1.77 | ||
| Pesticides | 18.09 | [45] | |
| Agricultural films | 22.72 | CLCD 0.7 [44] | |
| Diesel fuel burning | 0.89 | ||
| Electricity for irrigation | Northwestern: 0.97 | kgCO2-eq/3.6 MJ | |
| North China: 1.23 | |||
| South China: 0.82 |
Note: In the carbon emission factor for irrigation electricity consumption, Northwest China includes Shaanxi, Gansu, Ningxia, Xinjiang, Qinghai, and Tibet; North China includes Hebei, Shanxi, Inner Mongolia, Liaoning, Jilin, Heilongjiang, Shandong, Henan, Beijing, Shanghai, and Tianjin; and South China includes Jiangsu, Anhui, Hubei, Guangxi, Chongqing, Sichuan, Guizhou, Yunnan, Zhejiang, Fujian, Hunan, Jiangxi, Guangdong, and Hainan.
CFpro,i,j = CFM,i,j + CFN2O,i,j + CFStraw,i,j + CFCH4,j
CFM,i,j = ADDies,i,j × EFDies
CFN2O,i,j = CFDirect,i,j + CFIndirect,i,j
CFDirect,i,j = (ADN,i,j + ADstraw,i,j) × EFDirect,j × 44/28 × 265
In this case, the formula for calculating the amount of nitrogen input for straw return is as follows:
where Mi,j denotes the crop seed yield of crop i in area j; ∂i denotes the economic coefficient of crop i; βi denotes the straw return rate of crop i; Ki denotes the nitrogen content of straw of crop i; and Li denotes the root–crown ratio of crop i. The values of specific parameters are shown in Table 3:
ADstraw,i,j = (Mi,j/∂i − Mi,j) × βi × Ki + Mi,j/∂i × Li × Ki
CFIndirect,i,j = IN,i,j × 0.1 × EH + (ADN,i,j + ADstraw,i,j) × 0.2 × EL] × 44/28 × 256
In the formula, CFIndirect,i,j denotes the carbon footprint of N2O indirect emissions from the agricultural land of crop i in area j and EH and EL are the coefficients of N2O indirect emissions from agricultural land for nitrogen volatilization and nitrogen leaching and runoff, respectively. According to the “Guidelines for the Preparation of Provincial-level Greenhouse Gas Inventories (Trial),” the rate of volatilization of nitrogen inputs is 0.1 and the ratio of nitrogen leaching and runoff is 0.2.
CFStraw,i,j = AIi,j × δi,j × ηi × EFStraw
In the formula, CFStraw,i,j denotes the carbon footprint produced by the crop burning of crop i in area j; AIi,j shows the straw yield of crop i in area j, which is calculated by the economic yield and the ratio of grass to grain; δi,j denotes the ratio of straw burning of crop i in area j; ηi denotes the efficiency of straw burning of crop i; and EFStraw denotes the emission coefficient of crop straw burning. In this paper, we mainly calculate the emission of CO2 and CH4 produced by straw burning.
where CFCH4,j denotes the carbon footprint produced by rice in area j; ARj denotes the sown area of rice in area j; and EFj denotes the CH4 emission factor of rice in area j (Table 4).
CFCH4,j = ARj × EFj × 28
- (2)
- Formula for calculating CH4 emissions from enteric fermentation in animals:
CFCH4,enteric = ∑EFCH4,enteric,i × APi × 28
Formula for calculating the CH4 emissions from animal manure management:
where CFCH4,manure is the total CH4 emissions from animal manure management and EFCH4,manure,i is the CH4 emission factor for manure management of the i animal (Table 6).
CFCH4,manure = ∑EFCH4,manure,i × APi × 28
Formula for calculating the N2O emissions from animal manure management:
where CFN2O,manure is the total N2O emissions from animal manure management and EFN2O,manure,i is the emission factor for N2O from the manure management of the i animal.
CFN2O,manure = ∑EFN2O,manure,i × APi × 256
2.4. Data Sources
The data on agricultural materials from 2000 to 2020 in this paper are mainly from the National Compendium of Agricultural Product Costs and Benefits. The price data involved predominantly derive from the China Price Yearbook, while the data on the sown area of rice, wheat, and corn, as well as their production, are mainly from the China Rural Statistical Yearbook and various local statistical yearbooks. The year-end stock of each livestock comes from the China Livestock Statistics Yearbook. In this paper, the emission factor data used mainly refers to reputable sources such as the IPCC national GHG emission inventory or guidelines for the preparation of provincial greenhouse gas inventories (trial), along with references to reliable databases like the China Life Cycle Basis Database and published literature.
3. Results
3.1. Time-Series Characterization of Agricultural Greenhouse Gas Emissions
China’s agricultural greenhouse gas emissions showed a fluctuating upward trajectory from 2000 to 2020 (Figure 2), witnessing a rise in total emissions from 910,047,100 tons of CO2-eq to 1,043,352,200 tons of CO2-eq. The growth rate of agricultural greenhouse gas emissions from 2000 to 2005 reached a significant high of 11.72%, with an average annual growth rate of 2.3%. This surge can be attributed primary to China’s prioritization of agricultural development during that period and gradual implementation of the “two reductions, three subsidies” policy, which effectively incentivized farmers to increase food production but also let to a notable rise in greenhouse gas emissions. From 2005 to 2010, there was a significant reduction agricultural GHG emissions, with a low growth rate of −3.3%. The No. 1 Central Document from 2006 onwards emphasized the promotion of resource-emphasized and sustainable development in agricultural technology, curbing high-emission and high-pollution inputs. Additionally, the State Council’s Opinions on Promoting the Sustainable and Healthy Development of the Animal Husbandry Industry in 2007 underscored the need for restructuring this industry, leading to a decrease in the livestock breeding scale and ultimately resulting in reduced emissions [49]. From 2010 to 2015, agricultural greenhouse gas emissions experienced a resumption of growth, with an average annual growth rate of 2.5%, which was driven by the expansion of agricultural production. As a result of the implementation of various stimulus packages by countries in response to the 2008 financial crisis aimed at improving the economic situation, there has been a shift in the rural labor force towards non-agricultural sectors. This has resulted in an increase in agricultural input factors to compensate for labor shortages and ensure an adequate supply of crucial agricultural products, consequently leading to a rise in greenhouse gas emissions from agriculture. From 2015 to 2020, agricultural greenhouse gas emissions experienced a decline, primarily attributed to the No. 1 Central Document’s increased focus on sustainable agriculture development and environmental management since 2014. The subsequent introduction of the rural revitalization strategy in 2017, with ecological livability as its cornerstone, further propelled green development initiatives within the agricultural sector. This concerted effort effectively demonstrated the efficacy of emission reduction concepts and policies, resulting in a notable decrease in agricultural greenhouse gas emissions during this period.
A comparison of the total agricultural GHG emissions by province from 2000 to 2020 (Table 7) indicates that the high-emission areas continue to be concentrated in large agricultural provinces such as Henan, Hunan, Sichuan, Anhui, and Heilongjiang. The extensive use of agricultural inputs and the high level of mechanization in these provinces have contributed to their sustained position as national leaders in agricultural GHG emissions. In contrast, agricultural GHG emissions in urban areas such as Beijing, Shanghai, and Tianjin have remained relatively low. These three cities have rapid economic development and their industrial structure has become highly industrialized and service-oriented, with a relatively small-scale agriculture industry. Additionally, these cities have implemented stricter norms and standards in agricultural production and management that have effectively reduced agricultural GHG emissions.
In terms of the emissions of three different types of GHGs, namely CH4, CO2, and N2O (Figure 2), during the period from 2000 to 2020 the agricultural CH4 emissions were significantly higher than those for other GHGs, accounting for more than 50% of the total GHG emissions annually. CO2 emissions ranked the second highest, with a progressively increasing share since 2005. On the other hand, N2O emissions made a relatively minor contribution. The CH4 emissions in the years between 2000 and 2020 show a fluctuating trend. The growth rate of CH4 emissions was its highest during the period 2000–2005, reaching an impressive 21.58%, and emissions peaked in 2005 at staggering volume of 655,491,100 tons of CO2-eq. Agricultural CO2 emissions exhibited an overall fluctuating growth trend from 2000 to 2020. Following a minor decline between 2000 and 2005, CO2 emissions continued their upward trajectory, exhibiting more substantial increases during the periods of 2005–2010 (27.39%) and 2010–2015 (26.64%). The lowest and fluctuating decreasing trend of agricultural N2O emissions was observed between 2000 and 2020. It decreased from 137,246,300 tons of CO2-eq to 120,612,100 tons of CO2-eq in two decades. Overall, the annual growth rates of the three types of GHG emissions (CH4, CO2, and N2O) from 2000 to 2020 were 0.09%, 3%, and −0.61%, respectively. CH4, although released in the greatest amounts, had a smoother growth trend, while CO2 showed the largest growth and N2O showed a negative growth.
3.2. Characterization of the Structure of Greenhouse Gas Emissions from Agriculture
3.2.1. Characterization of the Emission Structure of Diverse Food Crops and Livestock Species
In terms of the GHG emissions from various grain crops and livestock species (Figure 3), rice, non-cows, and pigs are the primary sources of methane (CH4), which is the largest GHG emission in the agricultural system. Rice accounts for the highest share of emissions, with an average contribution of 33.7% to agricultural CH4 emissions between 2000 and 2020 and an overall increasing trend. Non-cow ruminants follow closely behind, with an average share of 33.65%, but display a decreasing trend due to their larger-scale farming, resulting in higher CH4 emissions compared to non-ruminant animals.
CO2 is the second largest GHG emitted from agricultural activities, primarily origination from rice, wheat, and maize cultivation. Among these crops, rice accounts for the highest CO2 emissions. However, between 2000 and 2020 there was a consistent decline in the proportion of CO2 emissions attributed to rice production annually. In contrast, the contributions of wheat and maize remained relatively stable during this period. From 2000 to 2005, wheat exhibited higher CO2 emissions compared to corn. However, after 2005, the escalating practice of burning corn stover led to maize surpassing wheat as the second largest contributor to agricultural CO2 emissions. Consequently, its emission share has progressively increased over time.
The main sources of agricultural N2O include rice, corn, and pigs. From 2000 to 2020, the proportion of N2O emissions from rice gradually declined, averaging at 22.35%, while there was an upward trend in N2O emissions from pigs and other animal sources such as non-dairy cows. Conversely, due to the relatively limited scale of animal farming involving donkeys, mules, and camels, their contribution to overall agricultural N2O emissions remains comparatively low.
3.2.2. Characterizing the Emissions Structure Arising from Diverse Agricultural Production Activities
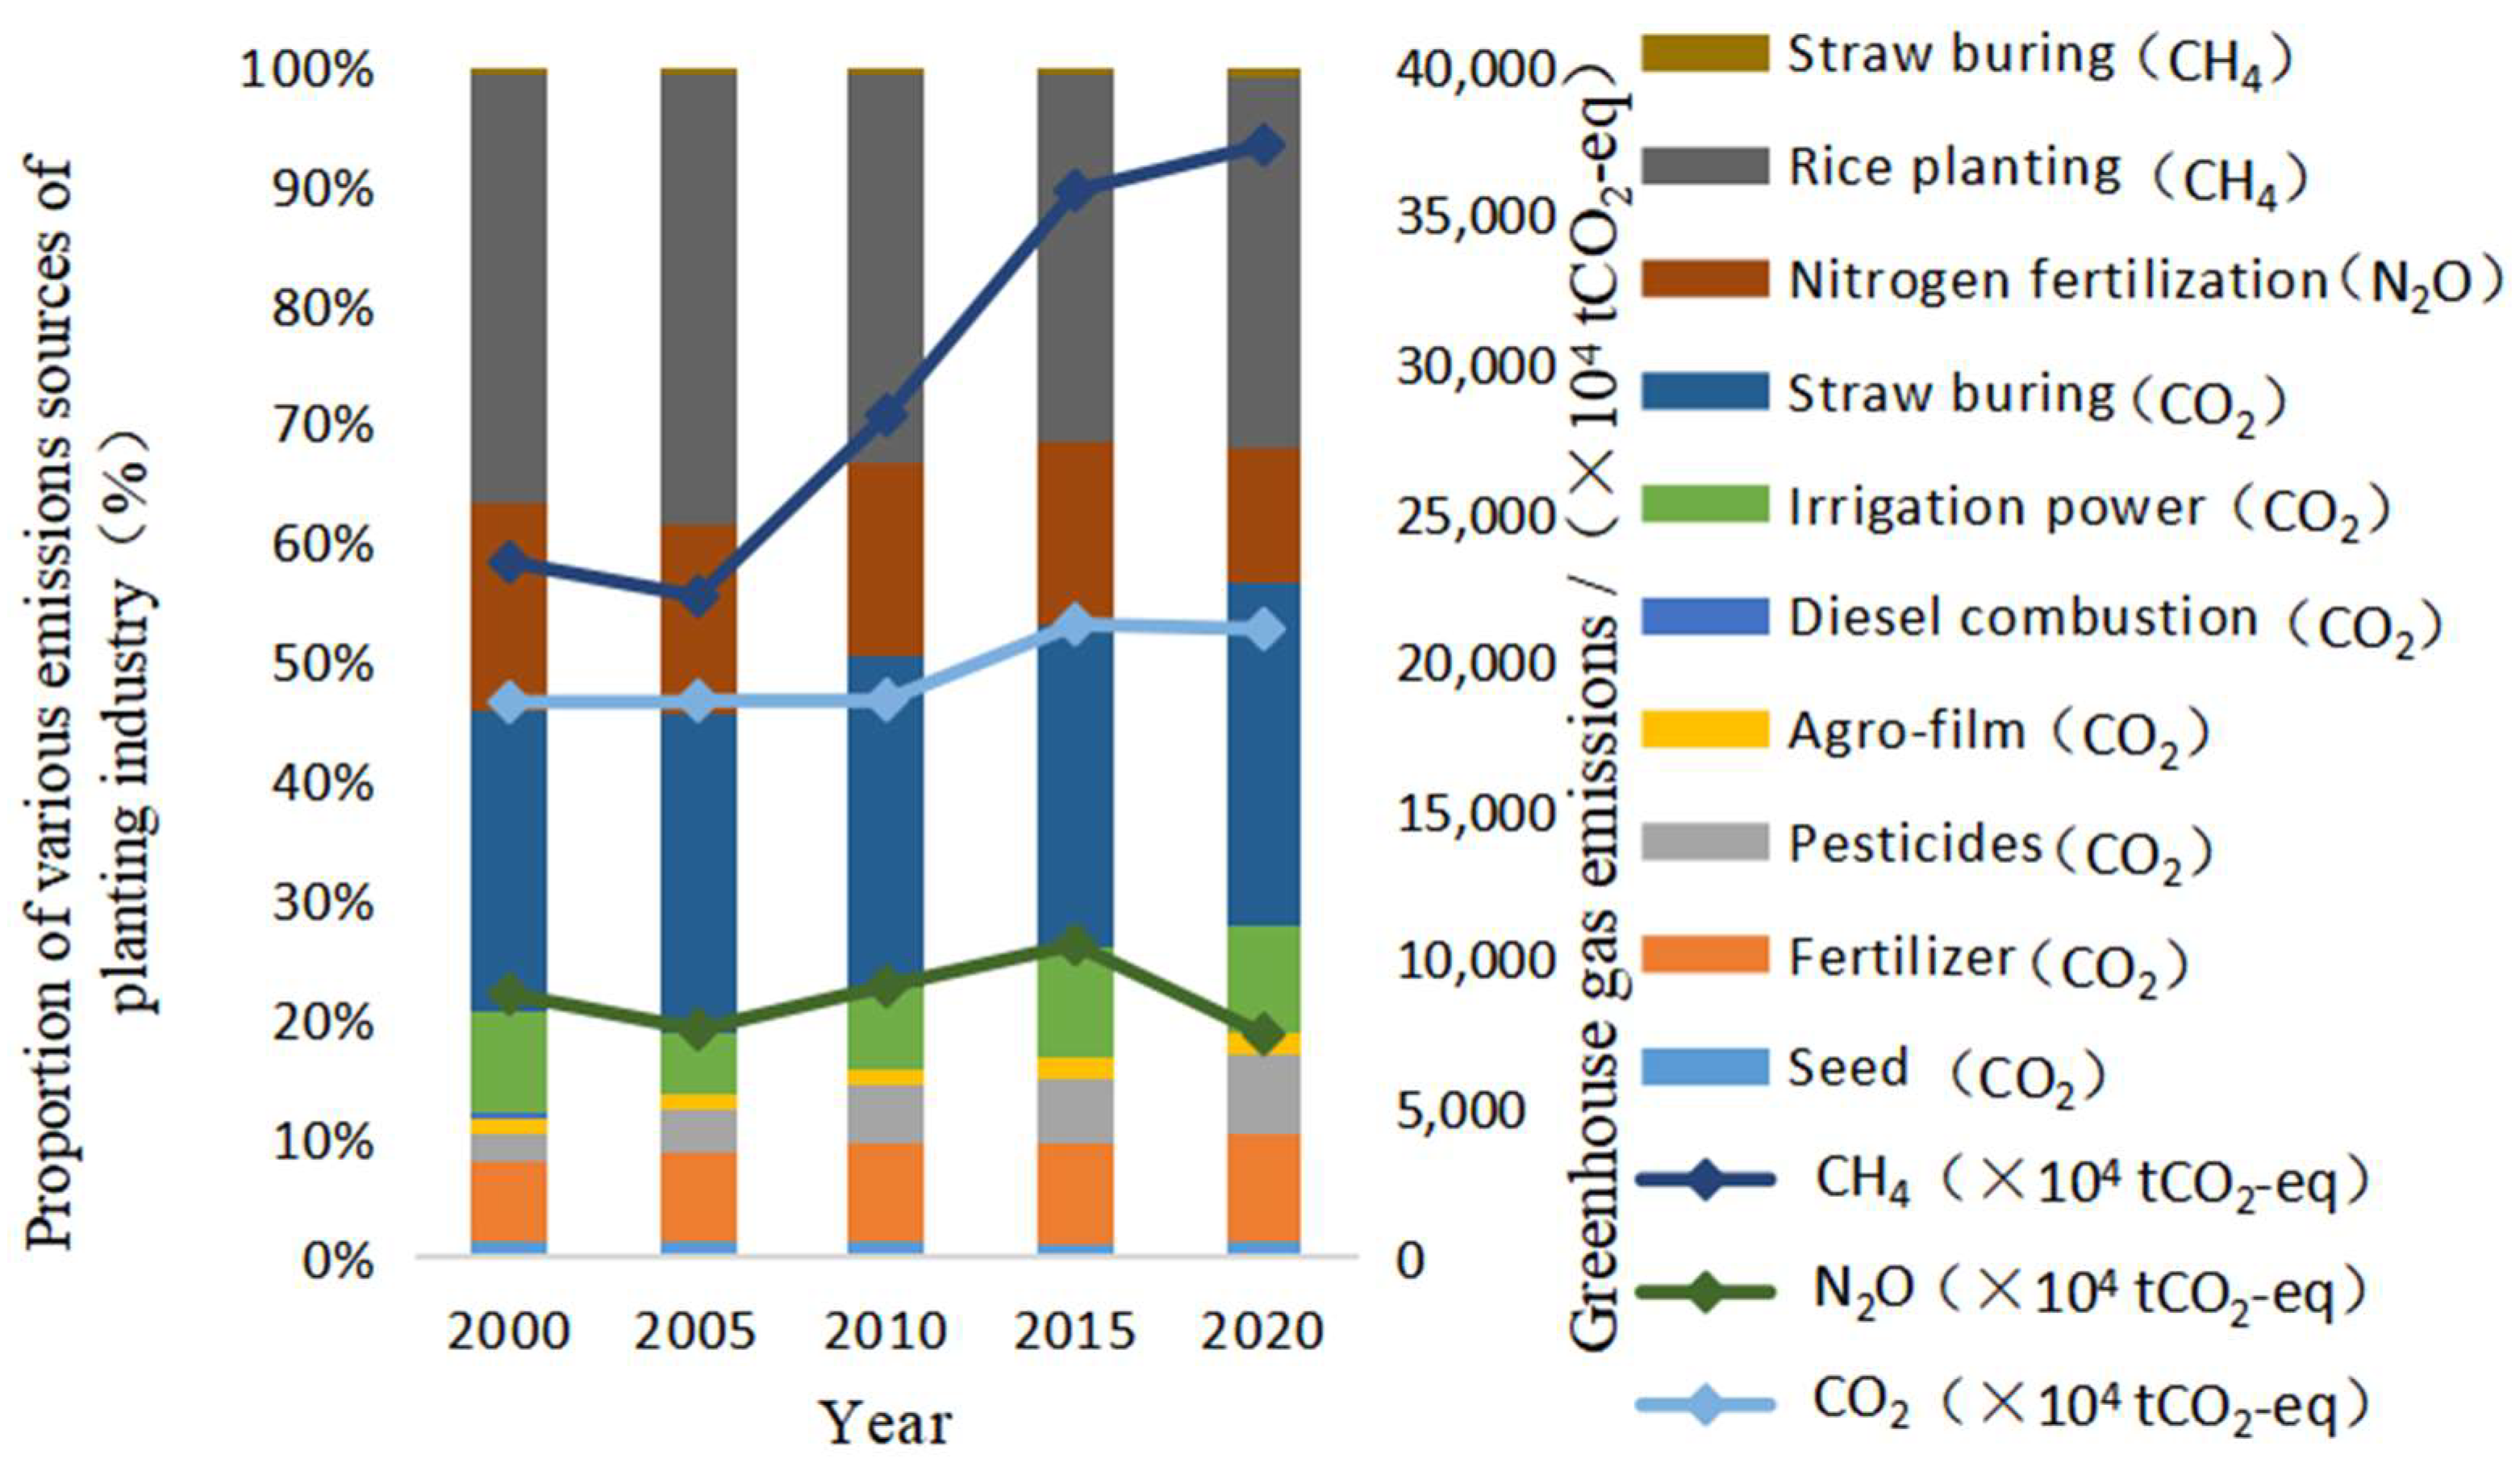
From the perspective of various agricultural production activities that generate greenhouse gases (Figure 4), animal enteric fermentation emerges as the primary contributor to agricultural greenhouse gases emissions, followed by the CH4 produced through rice cultivation and CO2 released from straw burning post-harvest. From 2000 to 2020, the proportion of CH4 emissions from enteric fermentation showed a fluctuating downward trajectory, reaching its peak at 38.10% in 2005. Conversely, the proportion of CH4 emissions stemming from rice cultivation demonstrated an overall downward trend. The CO2 emissions resulting from straw burning exhibit a substantial increase. Although agricultural inputs such as pesticides and agricultural films contribute to GHG emissions only to a relatively minor extent, their emissions have been consistently rising each year.
3.2.3. Characterizing the Emissions Structure Arising from Cultivation and Animal Husbandry
The primary greenhouse gases emitted by the plantation industry comprise CO2, N2O, and CH4 (Figure 5), with the CH4 emissions from rice cultivation being the most significant, followed by CO2 emissions resulting from straw burning. In 2000, the CH4 emissions from rice cultivation constituted 36.06% of the total greenhouse gas emissions generated by the plantation industry. Between 2000 and 2005, the implementation of a subsidy policy incentivizing farmers to cultivate grains resulted in an expansion of rice paddy areas, consequently leading to an increase in CH4 emissions associated with rice cultivation. From 2005 to 2010, stringent measures were implemented to regulate the use of high-pollution and high-emission agricultural inputs, which subsequently impacted the planting area and contributed to a reduction in CH4 emissions stemming from rice cultivation.
Since 2010, there has been a significant focus on enhancing the security of agricultural product supply and expanding the rice cultivation area, resulting in a persistent rise in CH4 emissions from grain crop. From 2000 to 2020 there was a continuous rise in CO2 resulting from the increased burning of straw. The plantation sector primarily contributes N2O emissions through nitrogen fertilizer application, which shows an overall declining trend during the period 2000–2020. In general, GHG emissions originating from the plantation industry show an upward trajectory throughout the mentioned time frame.
The primary GHGs generated by the livestock sector consist of N2O and CH4, as depicted in Figure 6. These emissions primarily originate from animal enteric fermentation and manure management. Among these sources, CH4 emissions resulting from enteric fermentation contribute significantly, accounting for over 70% of the annual GHG emissions from animal husbandry. Subsequently, the CH4 emissions arising from manure management follow suit in terms of magnitude. The primary source of N2O emissions in animal husbandry is from manure management. Between 2000 and 2005, these was an upward trend observed in CH4 emissions from enteric fermentation and N2O emissions from manure management, leading to a rise in GHG emissions associated with animal husbandry. From 2005 to 2010, as a result of the restructuring and expansion of animal husbandry coupled with the implementation of the grassland grazing regulation system, there was a noticeable decline GHG emissions originating from animal husbandry.
From 2010 to 2015, specific measures were implemented to the standardize animal husbandry and expand the scale of livestock farming, resulting in a slight increase in GHG emissions from this sector. Subsequently, between 2015 and 2020, China intensified the management of the environmental regulations pertaining to livestock and poultry farming. Gradually transitioning towards ecological farming operation, the 2018 Amendment to the Law of the People’s Republic of China on Prevention and Control of Air Pollution (Amendment) mandates that livestock and poultry farms implement comprehensive measures for collecting, storing, clearing, and managing manure in an environmentally friendly manner. With the advancement of manure management technologies, this regulation further encourages the implementation of biogas projects to effectively manage livestock waste while conserving energy resources. Consequently, these initiatives have significantly contributed to reducing greenhouse gas emissions within the animal husbandry industry. Overall, the livestock sector has witnessed a decline in greenhouse gas emissions, primarily attributed to the adoption of standardized management practices and the implementation of the large-scale production of livestock production. However, it is important to note that external factors such as outbreaks of livestock epidemics also exert an influence on the overall magnitude of the greenhouse gases produced by livestock farming.
3.3. Spatial Distribution of Agricultural Greenhouse Gas Emissions
According to the spatial distribution of changes in China’s agricultural greenhouse gas emissions from 2000 to 2020 (Figure 7), there was a noticeable shift observed towards the middle and lower reaches of the Yangtze River Plain, the North China Plain, and the northeast regions. After analyzing the fluctuations in agricultural greenhouse gases emissions across Chinese provinces over a span of two decades, it is evident that more than 50% of the provinces have witnessed an upward trajectory in agricultural greenhouse gas emissions. Notably, the growth rates in Heilongjiang and Anhui provinces reached as high as 88.37% and 92.61%, respectively. Conversely, certain regions such as Beijing, Fujian, and Shanghai have made significant strides in reducing their emissions. Remarkably, Beijing has successfully achieved a remarkable reduction rate of 61.58%.
In terms of changes in emissions, significant alterations have been observed in the North China Plain, the middle and lower reaches of the Yangtze River, and the northeast region, making them prominent areas of concern. The North China Plain, being a traditionally important grain production area in China, primary focuses on the cultivation of winter wheat and corn. In this area, winter wheat exhibits a strong scale preference for large-scale farming [50], leading to intensified land use and a more typical agriculture landscape. Consequently, these factors contribute to elevated greenhouse gas emissions. The middle and lower reaches of the Yangtze River constitute the primary rice production areas in China. Rice cultivation serves as the predominant contributor to CH4 emissions within China’s agricultural GHGs inventory. Consequently, with an escalation in rice production within this area, there is a corresponding increase in CH4 emissions. The north-eastern region of China serves as a significant hub for grain production, boasting flat topography, fertile soil, advanced mechanization, and large-scale operations. Consequently, the region exhibits high grain yields that contribute to elevated emissions levels.
In 2020, the spatial clustering analysis of China’s agricultural GHG emissions (Figure 8) reveals a Moran’s I index of 0.30 with a significant p-value of 0.003, indicating a significant positive correlation in spatial distribution. The eastern regions, such as Shandong, Henan, and Anhui, are identified as hotspot areas with a significant agglomeration of high-emission regions, while the western and southern regions are characterized as cold spots.
In terms of the spatial distribution of different GHGs (Figure 8, Figure 9 and Figure 10), for agricultural CH4 emissions (Figure 9), the regions with high emission levels are mainly situated in Inner Mongolia, the Pearl River Basin, and the middle and lower sections of the Yangtze River. Rice cultivation and enteric fermentation are important contributors to CH4 emissions in agriculture, particularly in the middle and lower plains of the Yangtze River as well as the Pearl River Basin. These regions, being crucial rice-producing areas in China, exhibit larger rice cultivation areas and higher levels of agricultural CH4 emissions. Inner Mongolia serves as a prominent hub for livestock breeding in China, exhibiting a higher concentration of ruminants and consequently resulting in elevated CH4 emissions from enteric fermentation. Between 2000 and 2005, there was a substantial surge in CH4 emissions across North China and Southwest China, especially in Henan, Hebei, and Shandong. From 2015 to 2020, CH4 emissions decreased but remained high in areas such as Sichuan and Hunan.
For CO2 emissions (Figure 10), China’s agricultural CO2 emission hotspots are mainly concentrated in the Northeast China and North China Plain regions, with an overall distribution pattern characterized by higher emissions in the central and eastern parts of the country and lower emissions in the western region. Agricultural CO2 emissions mainly arise from straw combustion and agricultural inputs. The North China Plain region boasts advanced production methods, higher dryland crop yields, greater waste straw quantities, and higher agricultural CO2 emissions. Northeast China is a crucial grain production area in China, with high grain output and primary dryland crop cultivation. However, the low utilization rate of straw, coupled with its substantial high residual amount, results in high agricultural CO2 emissions. From 2010 to 2015, there was a significant increase in CO2 emissions in Northwest China; the spatial distribution pattern of emissions in 2015 and 2020 exhibits similarities, as the regions with high emissions gradually concentrate in the North China Plain and the northeastern region.
For N2O emissions (Figure 11), the main sources of agricultural N2O emissions are animal manure management and nitrogen fertilizer application to grain crops. Notably, regions such as the Inner Mongolia Plateau and Xinjiang, which serve as important livestock breeding areas in China, exhibit higher levels of N2O emissions. Important grain-producing areas in China, including the North China Plain as well as the northeast, exhibit higher levels of agricultural inputs, nitrogen fertilizer application, and N2O emissions. The Sichuan Province has a high level of N2O emissions within the region, primarily attributed to its population of pigs for farming, which is the highest nationally. Notably, the N2O emissions from pigs contribute 14.67% of the total agricultural N2O emissions, ranking second only to rice and corn. From 2000 to 2005, there was a noticeable upward trend in N2O emissions observed in the North China Plain. From 2010 to 2015, Heilongjiang, Sichuan, and other regions still continued to exhibit high emissions levels. Jiangsu and Xinjiang and other regions are experiencing a significant upward trajectory in terms of growth. From 2015 to 2020, agricultural N2O emissions have been gradually concentrated in Northeast China and the North China Plain.
4. Discussion
Given the global attention garnered by the issue of climate warming resulting from greenhouse gas emissions, nations have initiated discussions and research on reducing such emissions. There is an urgent need to mitigate the adverse impacts caused by these emissions. However, agricultural production activities generate a large amount of greenhouse gases and contribute significantly to anthropogenic greenhouse gas emissions. As China is a major agricultural country, the effectiveness of reducing agricultural greenhouse gas emissions remains inadequate. Furthermore, there is a dearth of corresponding data and theoretical support in this regard. Therefore, it is imperative to enhance research on accounting for and mitigating greenhouse gas emissions from the agricultural system. Such efforts can provide valuable support for the advancement of low-carbon agriculture. According to the data in China’s Third National Communication on Climate Change, China’s agricultural GHG emissions amounted to 828 million tons of CO2-eq in 2010. However, this paper reports a higher figure of 980 million tons due to its inclusion of the CO2 emissions from crop energy consumption and agricultural inputs using the life cycle assessment method. Comparing with the findings of domestic scholars’ research [19], China’s agricultural activities in 2020 resulted in GHG emissions generating 970 million tons of CO2-eq, indicating a 6% increase compared to the results presented in this paper for the year 2010. Furthermore, scholars such as Zhang Guangsheng [51] have also accounted for China’s total agricultural carbon emissions and their results demonstrate a similar trend to that observed in this study—an initial increase followed by a subsequent decrease during the period from 2000 to 2010. Both studies reveal the dynamic nature of China’s agricultural carbon emissions.
Based on the research results of this paper, the following suggestions are made:
- (1)
- Reducing CH4 emissions is the central focus of the United Nations Framework Convention on Climate Change (UNFCCC) in 2021. Given that CH4 is the primary greenhouse gas emitted by agricultural activities, addressing its reduction entails improving rice varieties and optimizing the rice production layout in China, especially in the middle and lower reaches of the Yangtze River plains and other major rice-growing areas. This involves selecting and breeding adapted rice varieties, reasonably managing paddy field moisture, and adopting intermittent irrigation instead of flooding to alleviate the pressure of CH4 emissions resulting from rice cultivation [52]. Meanwhile, CH4 emissions from animal enteric fermentation are mainly influenced by factors such as the animal’s body weight, type, and age, along with feed quality and the intake level [53]. Ruminants exhibit high levels of CH4 emissions through enteric fermentation. Therefore, it is recommended to improve feed quality and emphasize a balanced combination of coarse and fine feeds in their diet to effectively mitigate animal-derived methane emissions [54].
- (2)
- Crop straw burning is a major contributor to agricultural CO2 emissions, as highlighted in the Circular of the State Council on the Action Program for Carbon Peak by 2030 issued in 2021. To effectively address this issue, it is imperative to enhance the comprehensive utilization of agricultural straw. Particularly, emphasis should be placed on elevating straw utilization levels in dryland crop-dominated regions such as Northeast China and North China, with the aim of minimizing straw burning and achieving substantial reductions in agricultural CO2 emissions.
- (3)
- Agricultural N2O mainly originates from the application of nitrogen fertilizer to crops and the management of animal manure. To mitigate greenhouse gas emissions resulting from excessive fertilizer usage, it is recommended to strictly regulate the amount of nitrogen fertilizer applied, enhance nitrogen fertilizer utilization efficiency through a rational nutrient distribution ratio, and elevate scientific fertilization practices. In addition, it is imperative for the Inner Mongolia Plateau, Xinjiang, and other important livestock breeding areas in China to strengthen their manure management and optimize appropriate management measures. This includes prioritizing the establishment of biogas projects as an alternative to the conventional accumulation of animal waste for centralized treatment and recycling. Additionally, continuous efforts should be made to promote the expansion of large-scale animal husbandry operations, thereby effectively mitigating greenhouse gas emissions.
- (4)
- In terms of the spatial distribution of planting and livestock species, it is advisable to ensure a rational allocation of agricultural resources and strategically plan crop cultivation and livestock breeding based on local conditions. The main grain-producing regions should enhance soil moisture management and optimize the efficiency of straw utilization, with a primary focus on soil preservation. In addition, for livestock breeding areas like Inner Mongolia in China, it is crucial to scientifically plan the scale of livestock production while emphasizing the quality and quantity of animal feed intake. These measures aim to propel China’s agricultural sector towards sustainable development and effectively mitigate greenhouse gas emissions in agriculture. In the future, when formulating emission reduction policies, it is crucial to fully consider the spatial agglomeration characteristics of different regions. For regions with high emissions concentration, such as the North China Plain, emphasis should be placed on optimizing the agricultural structure, enhancing the efficiency of resource utilization, reducing unnecessary energy consumption and emissions, and strengthening the research and development, as well as the promotion of agricultural production technologies. It is essential to strengthen interregional cooperation and exchanges while sharing experiences in emission reduction in order to jointly promote national agricultural GHG emission reduction.
The findings of this paper provide valuable insights for enhancing China’s agricultural GHG emission accounting system. However, there are still have some limitations in the accounting results: Firstly, this study substitutes the missing data on agricultural inputs in some provinces with the national average of the current year, which may result in a larger or smaller actual agricultural GHG volume compared to the accounting results. Secondly, the accounting results might underestimate the true value as they only consider three major food crops (rice, wheat, and corn) in the plantation industry and seven major livestock species (cattle, horses, donkeys, mules, camels, pigs, and sheep) in animal husbandry industry as sources of agricultural GHG emissions. Future studies should account for a more comprehensive range of emission sources to obtain more accurate conclusions. Additionally, it is also important to conduct an in-depth analysis on the correlation between the characteristics of agricultural GHG emissions and national policies or agricultural production methods that could potentially influence them.
5. Conclusions
- (1)
- From 2000 to 2020, China’s total agricultural GHG emissions generally show a fluctuating upward trajectory. Notably, CH4 emissions from the agricultural sector constituted the largest share but had a relatively gradual growth rate. Agricultural CO2 emissions ranked as the second largest in magnitude and experienced the most rapid increase over time. Conversely, agricultural N2O emissions were comparatively smaller and showed a decreasing trend. There exists a strong correlation between the trend of agricultural GHG emissions and a series of pertinent national policies and events (Table 8) that have played a significant role in either promoting or inhibiting agricultural GHG emissions.
- (2)
- In terms of the composition of GHG emissions, there has been an overall upward trend in GHG emissions from cultivation between 2000 and 2020. CH4 emissions from rice cultivation have emerged as the largest contributor. The livestock sector has witnessed a decline in GHG emissions due to improved management techniques and increased adoption of large-scale production methods. The primary sources of GHG emissions in the sector include enteric fermentation and manure management.
- (3)
- The spatial distribution of agricultural GHG emissions exhibits substantial variations that are closely associated with both the level of regional development and production methods. Areas with high agricultural CH4 emissions are mainly concentrated in China’s key rice-growing regions, including the middle and lower plains of the Yangtze River and the Pearl River Basin. Additionally, these emissions are prevalent in livestock breeding areas such as Inner Mongolia.
- (4)
- The primary source of agricultural CO2 emission stems from burning of crop straw, thus rendering Northeast China and the North China plains, renowned for their dryland crop production, as regions with elevated agricultural CO2 emission. The areas characterized by substantial agricultural N2O emissions areas are gradually concentrated within China’s livestock breeding zones, such as Inner Mongolia, and major grain-producing areas, such as the North China Plain.
Author Contributions
Conceptualization, J.N. and C.Z.; methodology, J.N., C.Z. and M.H.; software, M.H.; validation, C.Z. and M.H.; formal analysis, T.S.; investigation, T.S.; resources, T.S.; data curation, C.Z.; writing—original draft preparation, C.Z. and J.N.; writing—review and editing, J.N. and C.Z.; visualization, C.Z. and J.N.; supervision, J.N.; project administration, J.N.; funding acquisition, J.N. All authors have read and agreed to the published version of the manuscript.
Funding
This research was funded by the National Natural Science Foundation of China, grant numbers 41971217 and 42171246 and the National Key R&D Program of China, grant number 2021YFD1500101.
Institutional Review Board Statement
Not applicable.
Informed Consent Statement
Not applicable.
Data Availability Statement
All the data included in this study are available from the corresponding author on reasonable request.
Conflicts of Interest
The authors declare no conflicts of interest.
References
- Wu, P.; Zhao, X. Impact of Climate Change on Agricultural Water Use and Food Production in China. Trans. CSAE 2010, 26, 1–6. [Google Scholar]
- Kiehl, J.; Trenberth, K. Earth’s Annal Global Mean Energy Budget. Bull. Am. Meteorol. Soc. 1997, 78, 197–208. [Google Scholar] [CrossRef]
- Sun, Y.; Zhang, X.; Shi, X. Voluntary cooperation mechanism of global climate governance and China’s participation strategy—Taking article 6 of the Paris Agreement as an example. Tianjin Soc. Sci. 2022, 4, 93–99. [Google Scholar] [CrossRef]
- Ofipcc, W. Climate Change 2013: The Physical Science Basis. Contrib. Work. 2013, 43, 866–871. [Google Scholar] [CrossRef]
- IPCC. Climate Change 2021: The Physical Science Basis Available. Available online: https://www.ipcc.ch/report/ar6/wg1/ (accessed on 11 January 2024).
- Tubiello, F.N.; Salvatore, M.; Rossi, S.; Ferrara, A.; Fitton, N.; Smith, P. The FAOSTAT database of greenhouse gas emissions from agriculture. Environ. Res. Lett. 2013, 8, 015009. [Google Scholar] [CrossRef]
- Ministry of Ecology and Environment of the People’s Republic of China. The People’s Republic of China Third National Communication on Climate Change. Available online: https://www.mee.gov.cn/ywgz/ydqhbh/wsqtkz/201907/P020190701762678052438.pdf (accessed on 10 January 2024).
- Ran, G.; Wang, J.; Wang, D. Study on the changing trend of carbon emissions in modern agricultural production in China. Issues Agric. Econ. 2011, 32, 32–38+110–111. [Google Scholar] [CrossRef]
- Tian, Y.; Zhang, J. Regional differentiation research on net carbon effect of agricultural production in China. J. Nat. Resour. 2013, 28, 1298–1309. [Google Scholar]
- Li, B.; Zhang, J.; Li, H. Empirical study on China’s agriculture carbon emissions and economic development. J. Arid. Land Resour. Environ. 2011, 25, 8–13. [Google Scholar] [CrossRef]
- Tan, Q. Greenhouse gas emission in China’s agriculture: Situation and challenge. China Popul. Resour. Environ. 2011, 21, 69–75. [Google Scholar]
- Min, J.; Hu, H. Calculation of greenhouse gases emission from agricultural production in China. China Popul. Resour. Environ. 2012, 22, 21–27. [Google Scholar]
- Brodt, S.; Kendall, A.; Mohammadi, Y.; Arslan, A.; Yuan, J.; Lee, I.-S.; Linquist, B. Life cycle greenhouse gas emissions in California rice production. Field Crops Res. 2014, 169, 89–98. [Google Scholar] [CrossRef]
- Wang, X.; Zhao, X.; Wang, Y.; Xue, J.; Zhang, H. Assessment of the carbon footprint of rice production in China. Resour. Sci. 2017, 39, 713–722. [Google Scholar] [CrossRef]
- Wang, Y.Q.; Pu, C.; Zhao, X.; Wang, X.; Liu, S.; Zhang, H. Historical dynamics and future trends of carbon footprint of wheat and maize in China. Resour. Sci. 2018, 40, 1800–1811. [Google Scholar] [CrossRef]
- Hu, X.; Wang, J. Estimation of greenhouse gas emissions from livestock and poultry in China. Trans. CSAE 2010, 26, 247–252. [Google Scholar]
- Al-Mansour, F.; Jejcic, V. A model calculation of the carbon footprint of agricultural products: The case of Slovenia. Energy 2017, 136, 7–15. [Google Scholar] [CrossRef]
- Tian, Y.; Zhang, J.B.; Yin, C.J.; Wu, X. Distributional dynamics and trend evolution of China’s agricultural carbon emissions—An analysis on panel data of 31 provinces from 2002 to 2011. China Popul. Resour. Environ. 2014, 24, 91–98. [Google Scholar] [CrossRef]
- Fan, Z.; Qi, X.; Zeng, L.; Wu, F. Accounting of Greenhouse Gas Emissions of Agricultural System in China in Recent 40 Years. Acta Ecol. Sin. 2022, 42, 9470–9482. [Google Scholar]
- Zhang, M.; Li, W.; Zhang, J.; Huang, H.; Che, X. The accounting of agriculture greenhouse gas emissions in Hainan province. China Popul. Resour. Environ. 2014, 24, 19–23. [Google Scholar]
- Huang, Z.; Mi, S. Study on Agricultural Carbon Footprint—A Case Study of Zhejiang Province. Issues Agric. Econ. 2011, 32, 40–47+111. [Google Scholar]
- Kang, T.; Yang, H.; Guo, R. Accounting of Agricultural Greenhouse Gas Emissions in Chongming County. Resour. Environ. Yangtze Basin 2012, 21, 102–108. [Google Scholar]
- Yao, B.; Zheng, Y.; Hu, D.; Nie, L.; Fu, S.; Hu, Q. Temporal and Spatial Dynamics of Agricultural Carbon Emissions in Counties of Jiangxi Province and Its Influencing Factors. Resour. Environ. Yangtze Basin 2014, 23, 311–318. [Google Scholar]
- Chen, H.; Fu, G.; Liu, Y. Agricultural Greenhouse Gas Emissions in Counties of Jiangsu Province: Temporal and Spatial Differences and Trend Evolution. Resour. Sci. 2018, 40, 1084–1094. [Google Scholar]
- Wu, X.; Zhang, J. Agricultural carbon emissions in China province: Growth leading effect and decoupling effect of emission reduction. J. Agrotech. Econ. 2017, 5, 27–36. [Google Scholar] [CrossRef]
- He, Y.; Dai, X. Phase characteristics and regional differences in agriculture carbon emissions in China. Resour. Sci. 2016, 38, 1780–1790. [Google Scholar] [CrossRef]
- Rochette, P.; E Worth, D.; Huffman, E.C.; A Brierley, J.; McConkey, B.G.; Yang, J.; Hutchinson, J.J.; Desjardins, R.L.; Lemke, R.; Gameda, S.; et al. Estimation of N2O emissions from agricultural soils in Canada. II. 1990–2005 inventory. Can. J. Soil Sci. 2008, 88, 655–669. [Google Scholar] [CrossRef]
- Pang, L. Analysis on Regional Differences and Influencing Factors of Agricultural Carbon Emissions in China. J. Arid Land Resour. Environ. 2014, 28, 1–7. [Google Scholar]
- Li, H.; Qiu, J.; Wang, L.; Ren, T. The characterization of greenhouse gases fluxes from croplands of China and mitigation technologies. Ecol. Environ. Sci. 2012, 21, 159–165. [Google Scholar] [CrossRef]
- Jiang, Z.; Yin, S.; Zhang, X.; Li, C.; Shen, G.; Zhou, P.; Liu, C. Research and Development of a DNDC Online Model for Farmland Carbon Sequestration and GHG Emissions Mitigation in China. Int. J. Environ. Res. Public Health 2017, 14, 1493. [Google Scholar] [CrossRef] [PubMed]
- Wu, X.R.; Zhang, J.B.; Tian, Y.; Li, P. Research on China’s provincial agricultural carbon emissions performance index and its influencing factors. Resour. Sci. 2014, 36, 129–138. [Google Scholar]
- Zhang, X.; Wang, J.; Zhang, T.; Li, B.; Yan, L. N2O Emission Assessment and Low-carbon Measures of Agricultural System in China. Jiangsu J. Agric. Sci. 2021, 37, 1215–1223. [Google Scholar]
- Zhang, F.; Xuan, X.; Jin, G.; Wu, F. Non-carbon dioxide greenhouse gas emissions from agricultural sources and scenario simulation. Acta Geogr. Sin. 2023, 78, 35–53. [Google Scholar]
- Xia, L.; Ti, Z.; Zhu, C.; Zhang, G.; Wei, Z.; Yan, X. Greenhouse gas emission reduction strategy and carbon neutrality path of grain production in China. Acta Pedol. Sin. 2023, 60, 1277–1288. Available online: http://kns.cnki.net/kcms/detail/32.1119.P.20230927.1802.002.html (accessed on 24 November 2023).
- Xia, L.; Yan, X. Research progress and prospect of greenhouse gas emissions from the life-cycle production of food crops in China. J. Agro-Environ. Sci. 2020, 39, 665–672. [Google Scholar]
- Liu, G.; Müller, D.B. Addressing sustainability in the aluminum industry: A critical review of life cycle assessments. J. Clean. Prod. 2012, 35, 108–117. [Google Scholar] [CrossRef]
- Klüppel, H.-J. ISO 14041: Environmental management—Life cycle assessment—Goal and scope definition—Inventory analysis. Int. J. Life Cycle Assess. 1998, 3, 301. [Google Scholar] [CrossRef]
- Wang, M.; Wu, W.; Xia, X. Life cycle environmental impact assessment of summer maize in high-yield grain areas of North China. Acta Sci. Circumstantiae 2010, 30, 1339–1344. [Google Scholar] [CrossRef]
- Li, Z.; Wang, X.; Gao, Z.; Ma, W. Life cycle assessment of environmental impact of wheat fertilization resources in different regions of China. J. Agro-Environ. Sci. 2010, 29, 1417–1422. [Google Scholar]
- Institutioni, B. Specification for the assessment of the life cycle greenhouse gas emissions of goods and services. Bsi Br. Stand. Isbn 2011, 978, 580. [Google Scholar]
- Shi, M.; Wang, Y.; Zhang, Z.; Zhou, X. Carbon Footprint and Spatial Transfer of Carbon Emissions in Provinces of China. Acta Geogr. Sin. 2012, 67, 1327–1338. [Google Scholar]
- Liu, X.H.; Xu, W.W.; Li, Z.J.; Chu, Q.Q.; Yang, X.L.; Chen, B. Carbon Footprint Method of Farmland Ecosystem: Misunderstanding, Improvement and Application—Analysis of Carbon Efficiency of Intensive Farming in China. Chin. J. Agric. Resour. Reg. Plan. 2013, 34, 1–11. [Google Scholar]
- Ecoinvent Database [EB/OL]. Available online: https://www.ecoinvent.ch/ (accessed on 11 January 2024).
- Liu, X.; Wang, H.; Chen, J.; He, Q.; Zhang, H.; Jiang, R.; Chen, X.; Hou, P. Establishment method and basic model of China life cycle reference database. Acta Sci. Circumstantiae 2010, 30, 2136–2144. [Google Scholar] [CrossRef]
- Zhi, J.; Gao, J. Comparative Analysis of Carbon Emissions from Food Consumption of Urban and Rural Residents in China. Prog. Geogr. 2009, 28, 429–434. [Google Scholar]
- Luan, J.; Chou, H.; Jing, Y.; Liao, S.; Han, W. Decomposition of the reasons for the continuous growth of China’s fertilizer application and trend prediction. Resour. Sci. 2013, 28, 1869–1878. [Google Scholar]
- Li, F.; Fu, G.; Mei, Q.; Li, W.; Wang, C. Distribution characteristics of main crop straw resources and current situation of field returning in Hubei Province. J. Yangtze Univ. 2016, 13, 47–51+4. [Google Scholar] [CrossRef]
- Jiang, W.; Zhang, H.; Li, N.; Di, Z.; Cui, Z. Crop straw utilization and equipment status in Shandong Province. J. Chin. Agric. Mech. 2019, 40, 169–174. [Google Scholar] [CrossRef]
- Wu, Y.; Feng, K. Spatialtemporal differentiation features and correlation effects of provincial agricultural carbon emissions in China. Environ. Sci. Technol. 2019, 42, 180–190. [Google Scholar] [CrossRef]
- Luo, D.; Li, W.; Chen, J. Moderate scale of grain production and management: Two-dimensional perspective of output and benefit. J. Manag. World 2017, 1, 78–88. [Google Scholar] [CrossRef]
- Zhang, G.; Wang, S. China’s agricultural carbon emissions:structure, efficiency and its determinants. Issues Agric. Econ. 2014, 35, 18–26+110. [Google Scholar] [CrossRef]
- Wang, Z.; Xu, Y.; Li, Z.; Guo, Y.; Ding, Y.; Wang, Z. Methane emission from paddy fields and its control. Crops 1998, 3, 10–11. [Google Scholar]
- Dong, H.; Li, Y.E.; Tao, X.; Peng, X.; Li, N.; Zhu, Z. China greenhouse gas emissions from agricultural activities and its mitigation strategy. Trans. CSAE 2008, 24, 269–273. [Google Scholar]
- Dong, H.; Lin, E.; Yang, Q. Methane emitted from ruminants in China and the mitigation technologies. Rural Eco-Environ. 1995, 3, 4–7. [Google Scholar]
Figure 1.
System boundary.
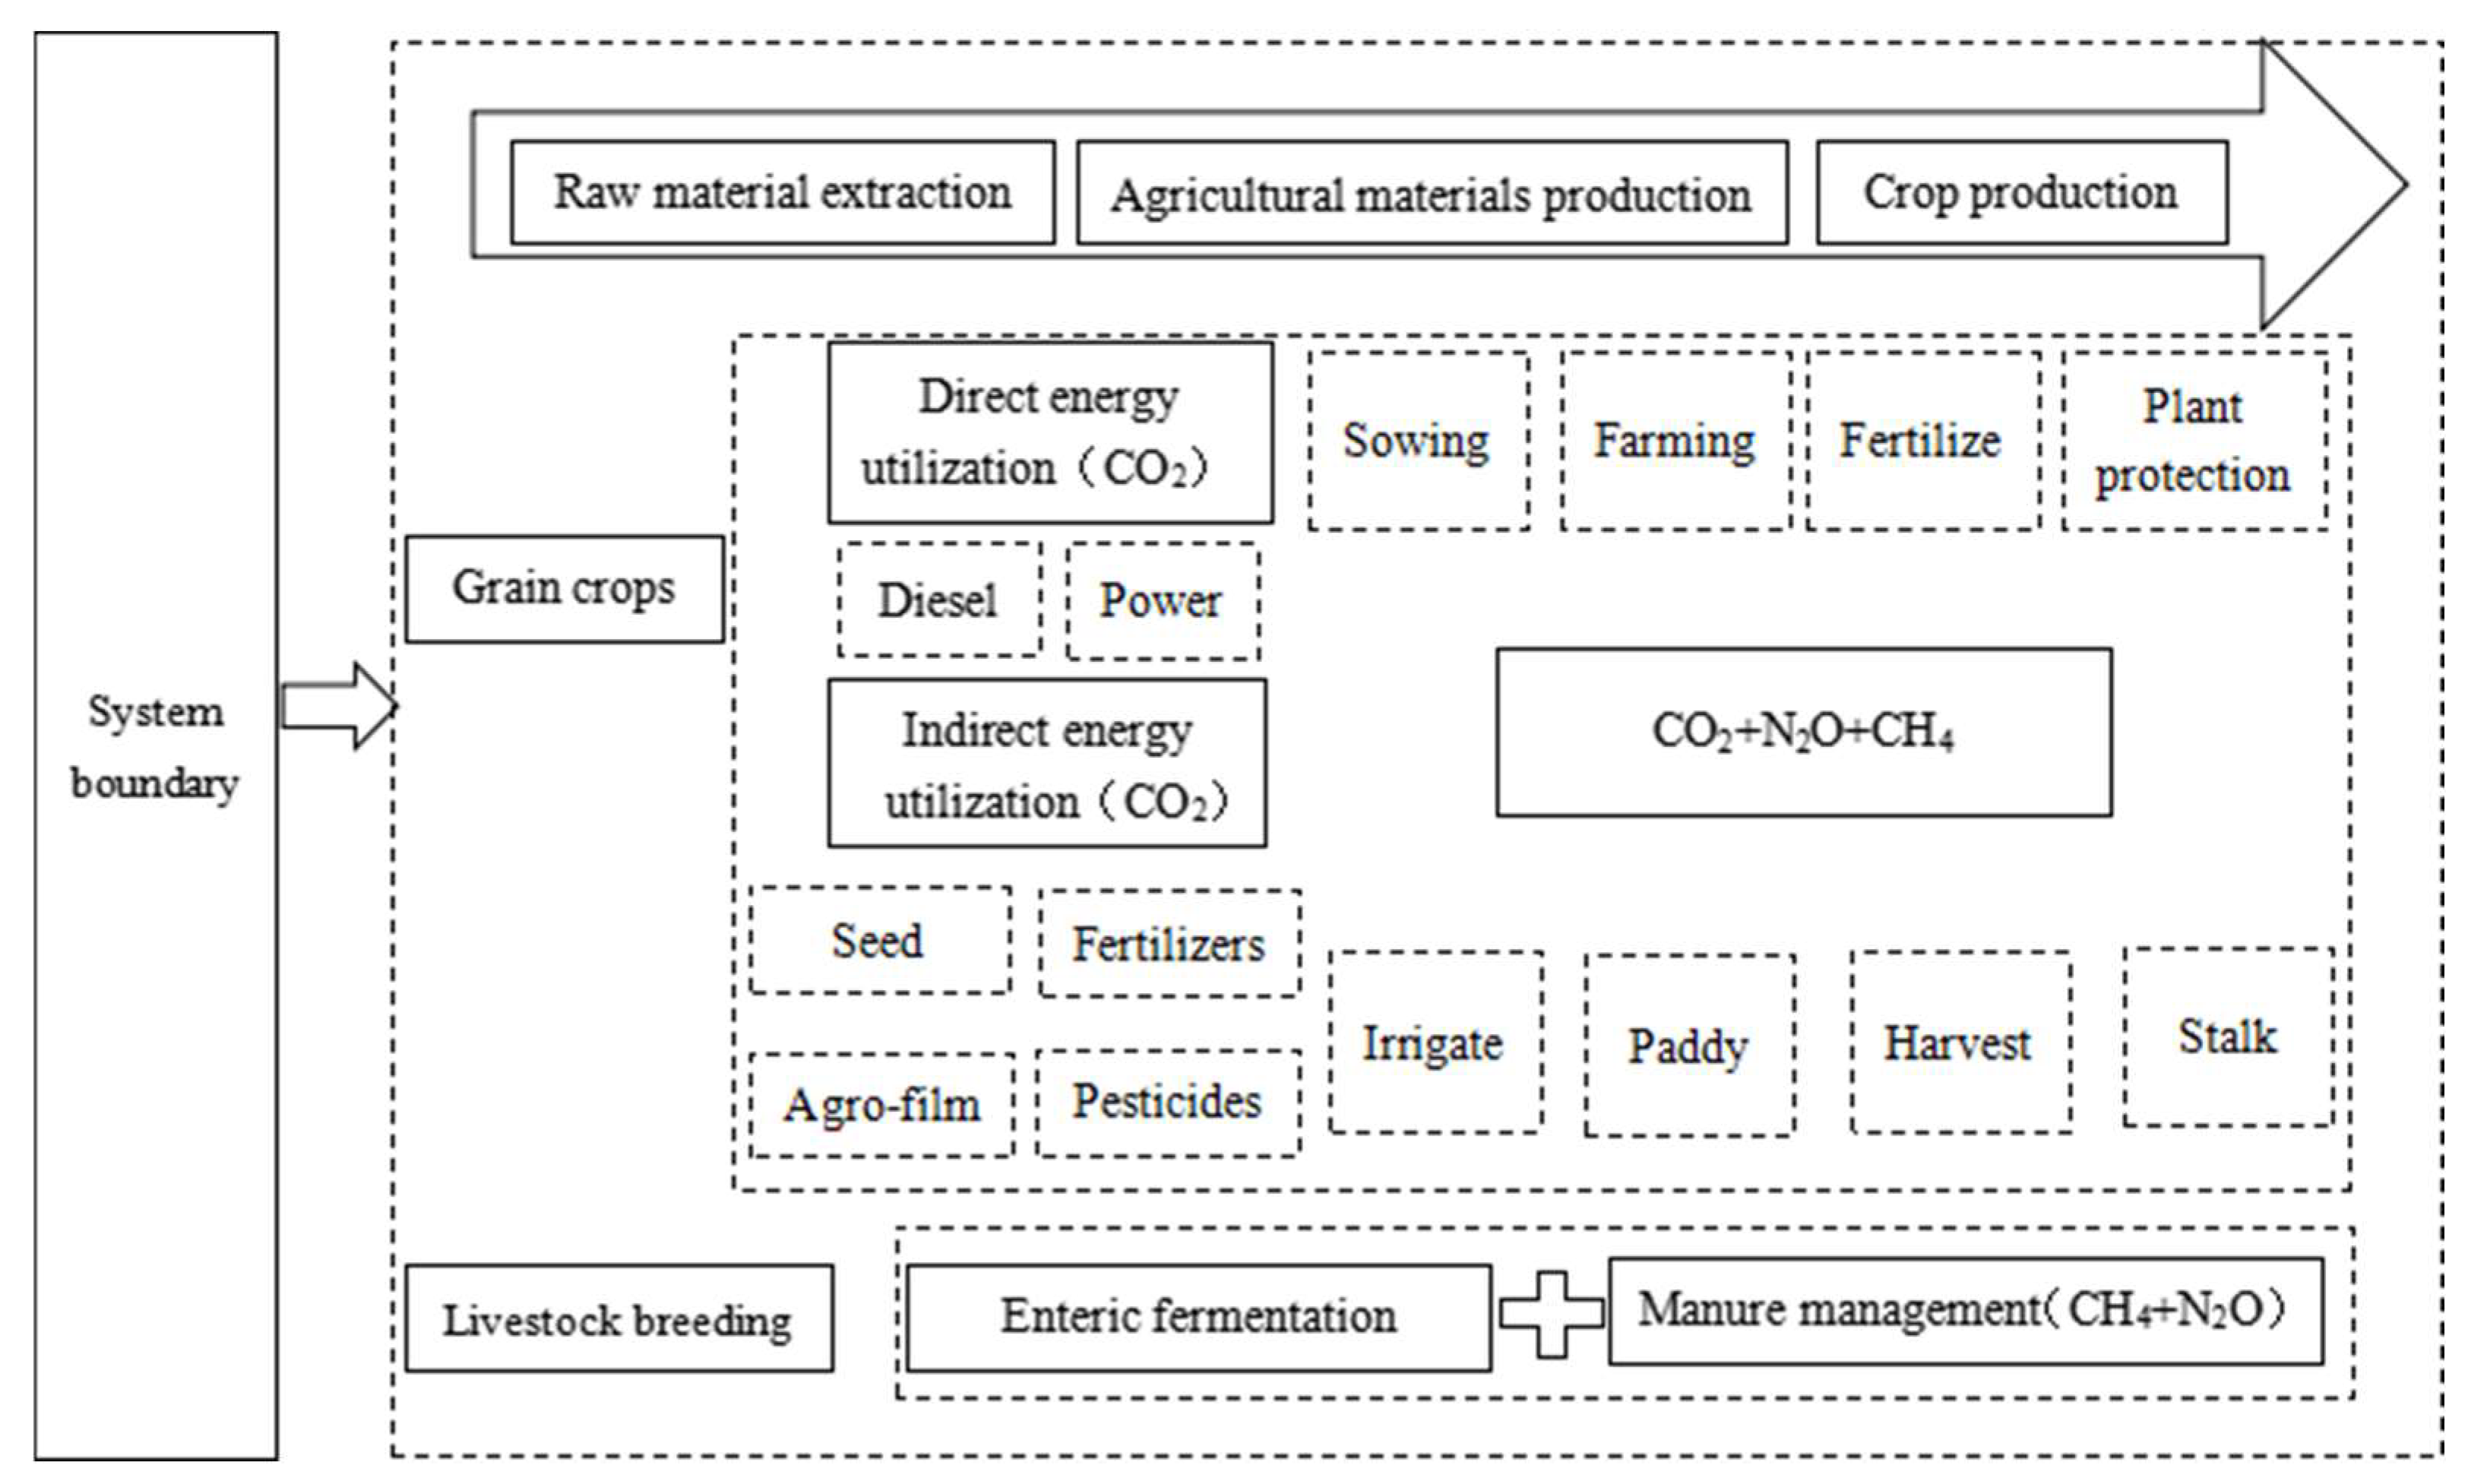
Figure 2.
Agricultural greenhouse gas emissions in China, 2000–2020.
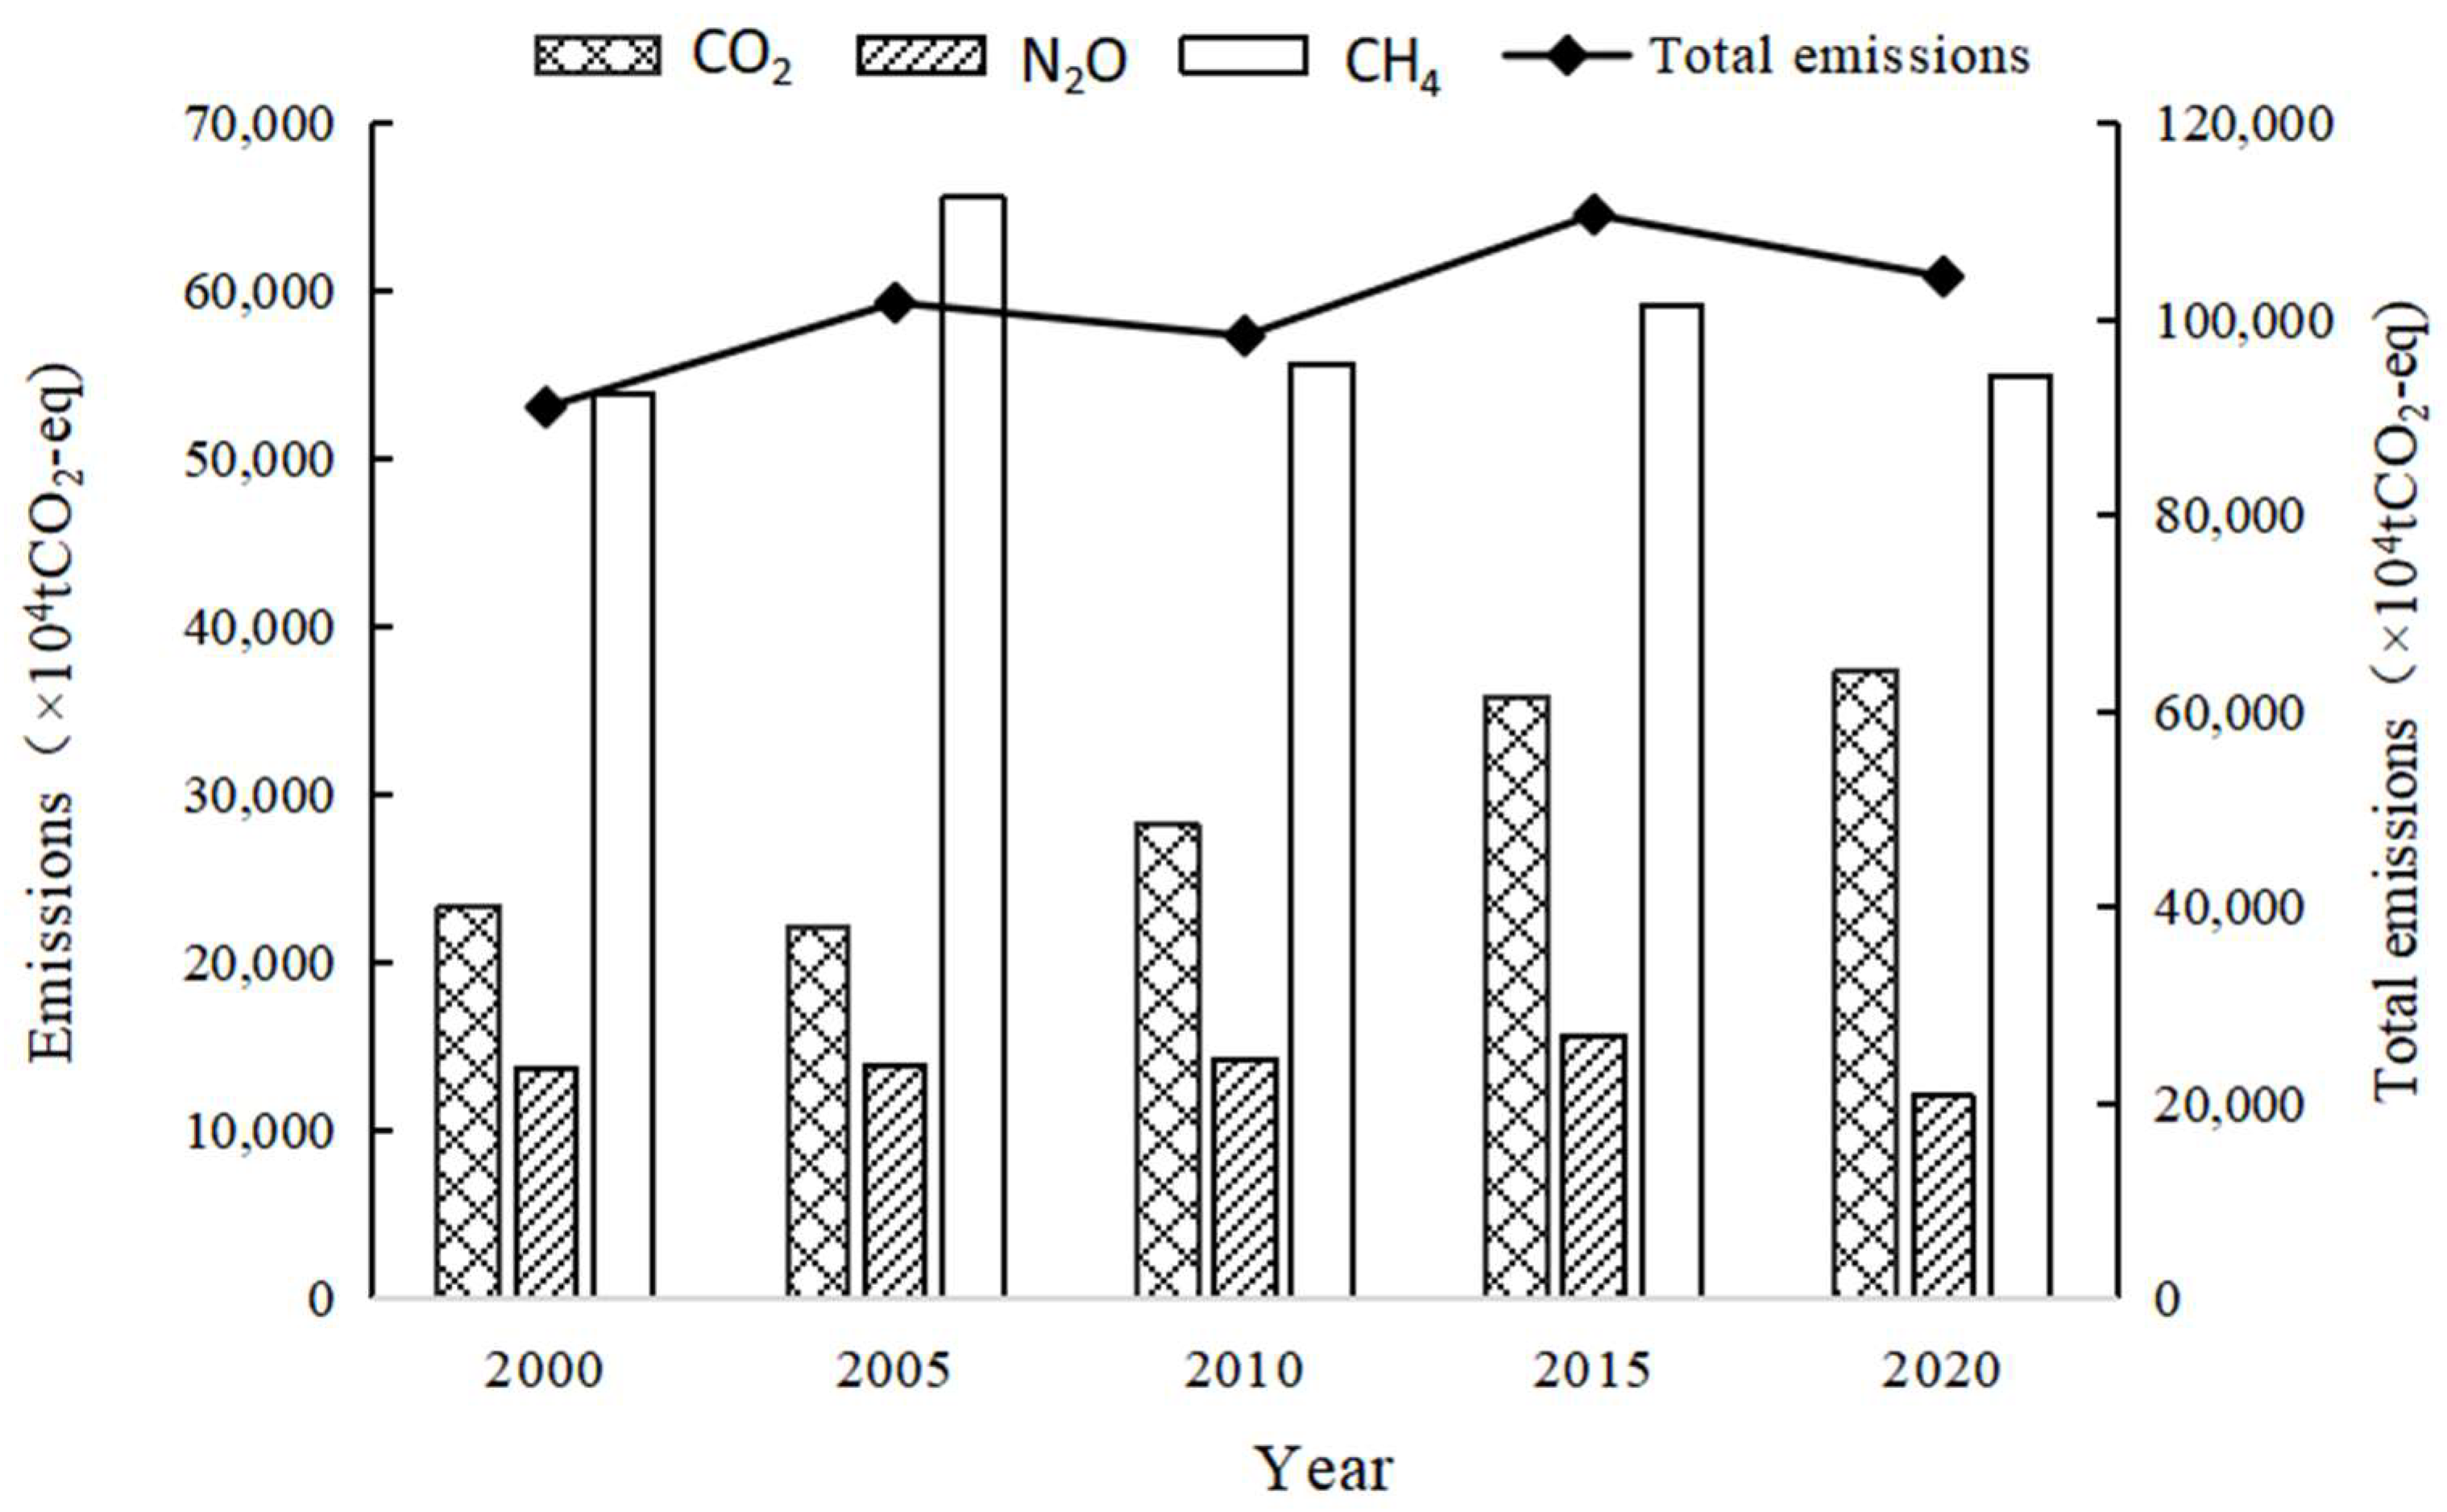
Figure 3.
Greenhouse gas emission structure of different crops and livestock from 2000 to 2020.
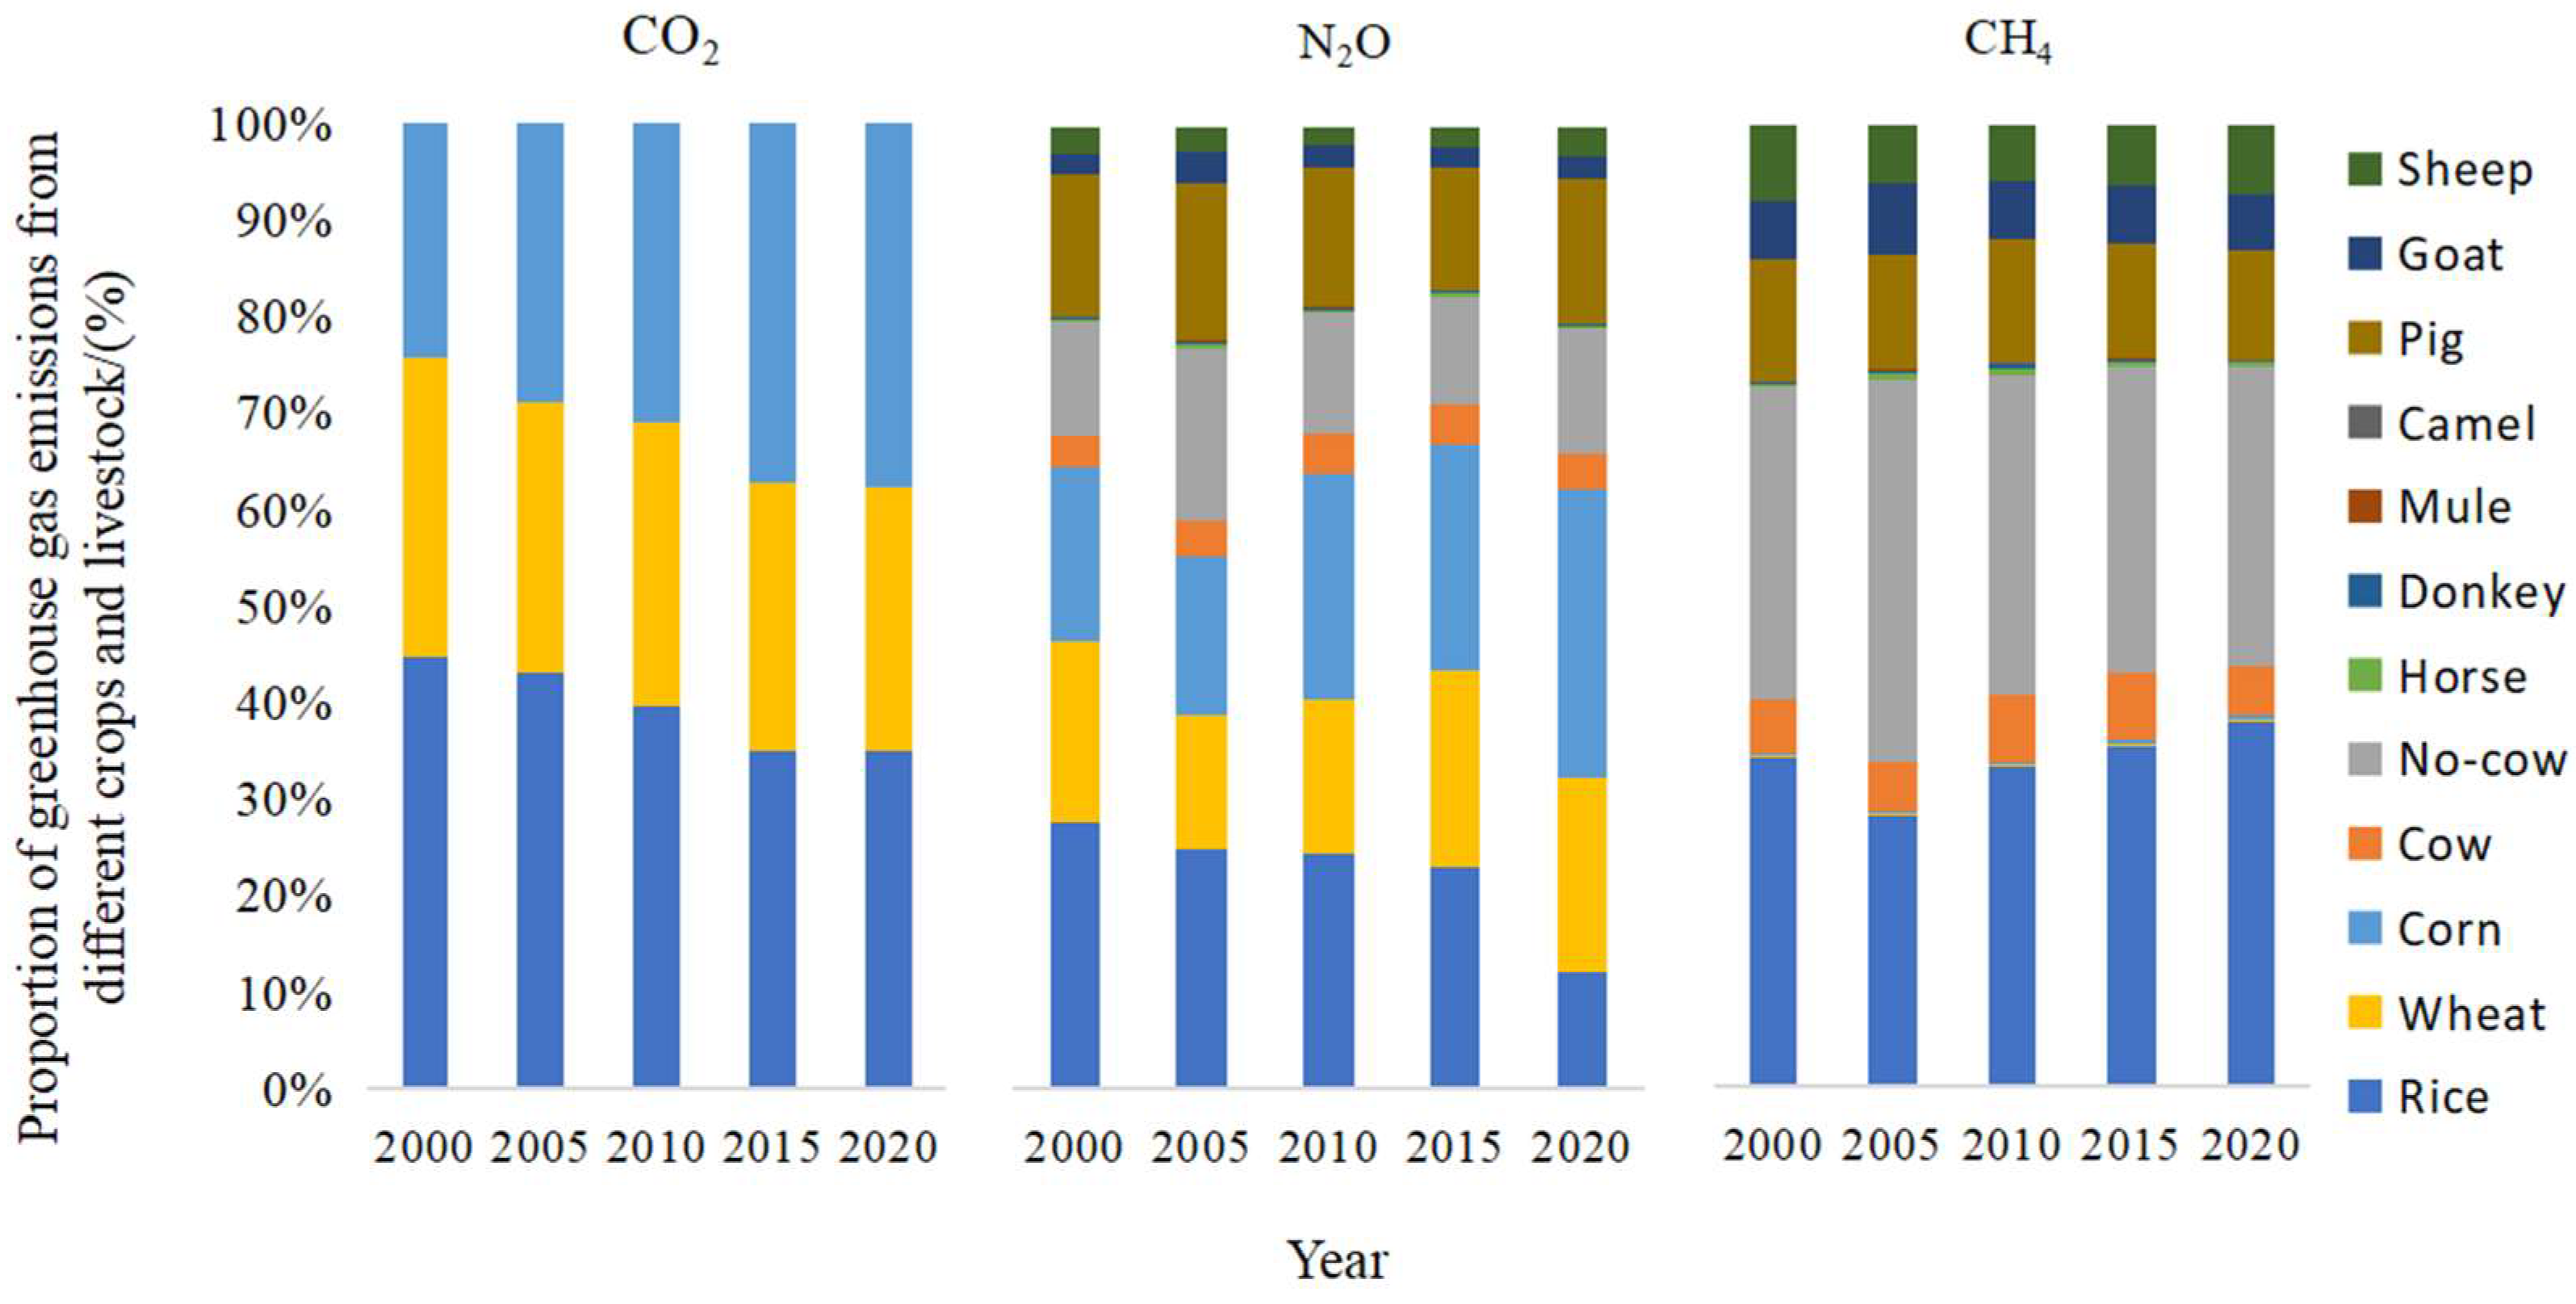
Figure 4.
Greenhouse gas emission structure of different agricultural production activities from 2000 to 2020.
Figure 4.
Greenhouse gas emission structure of different agricultural production activities from 2000 to 2020.
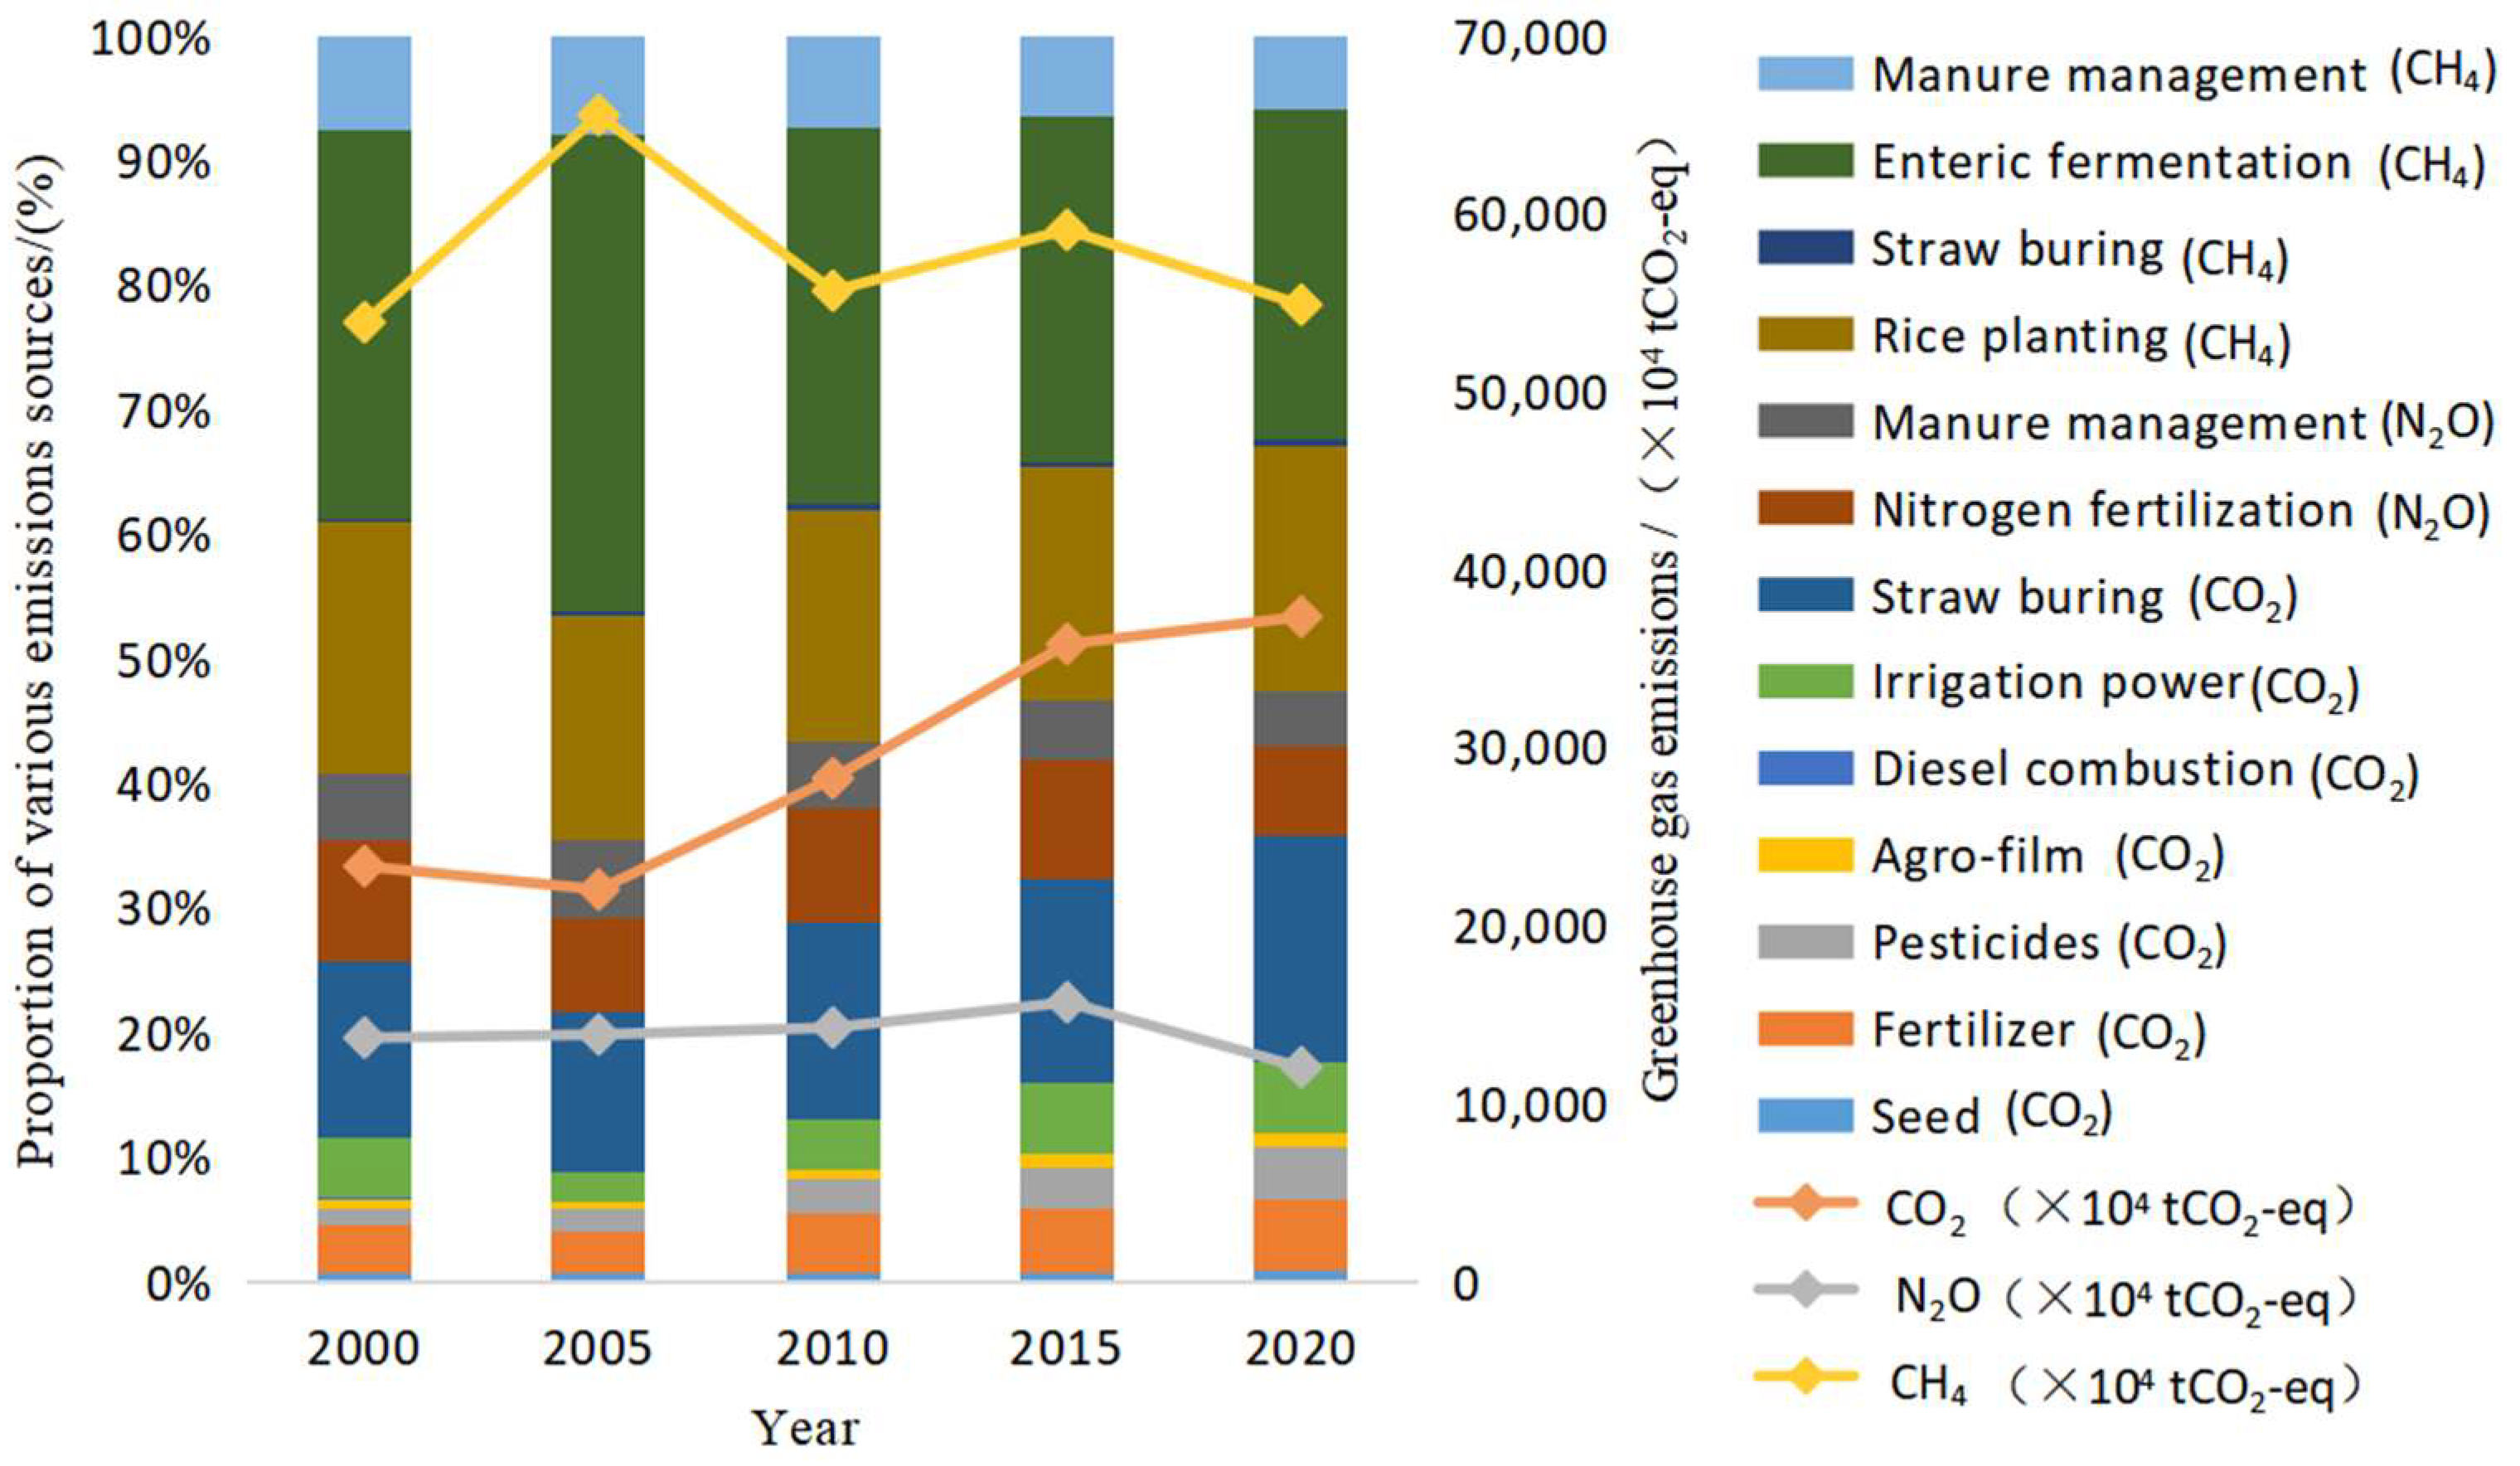
Figure 5.
Greenhouse gas emission structure of planting industry in China, 2000–2020.

Figure 6.
Greenhouse gas emission structure of livestock breeding industry in China, 2000–2020.
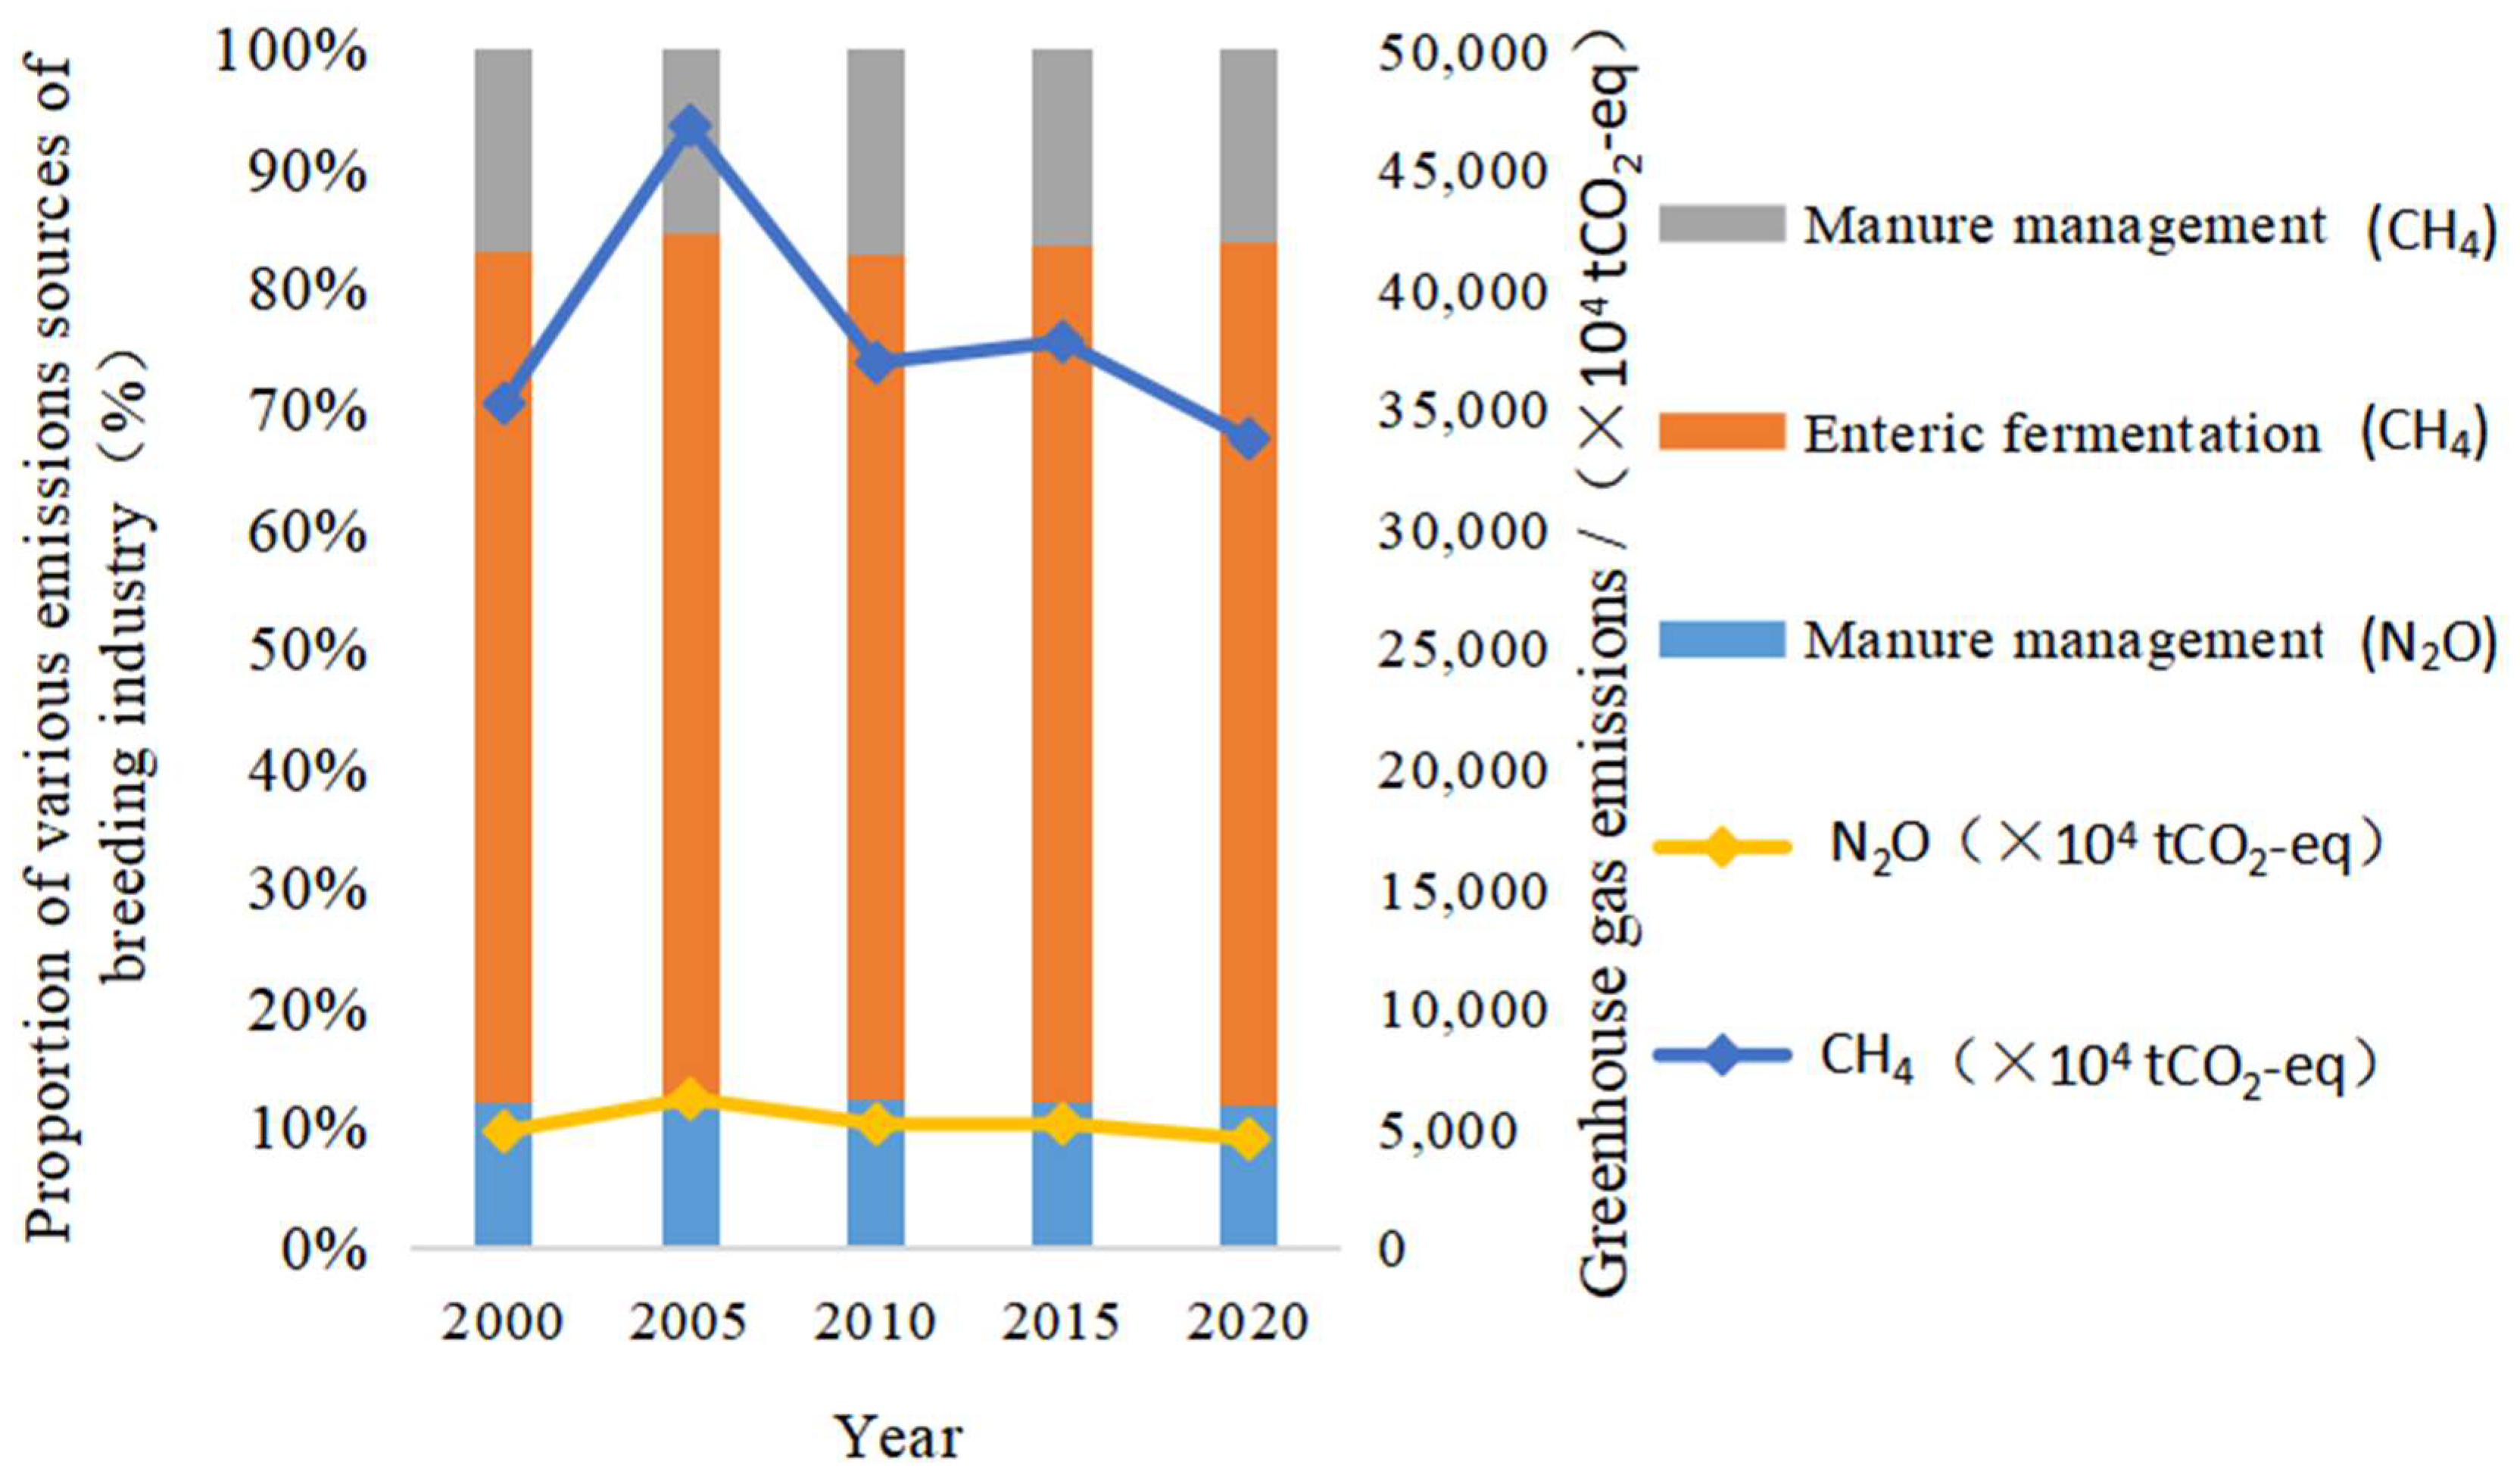
Figure 7.
Change in total agricultural greenhouse gas emissions in China, 2000–2020. Note: The map has been generated using the unaltered standard map with review number GS (2019) 1822, obtained from the Standard Map Service website of the State Administration of Surveying, Mapping and Geographic Information. The same as below.
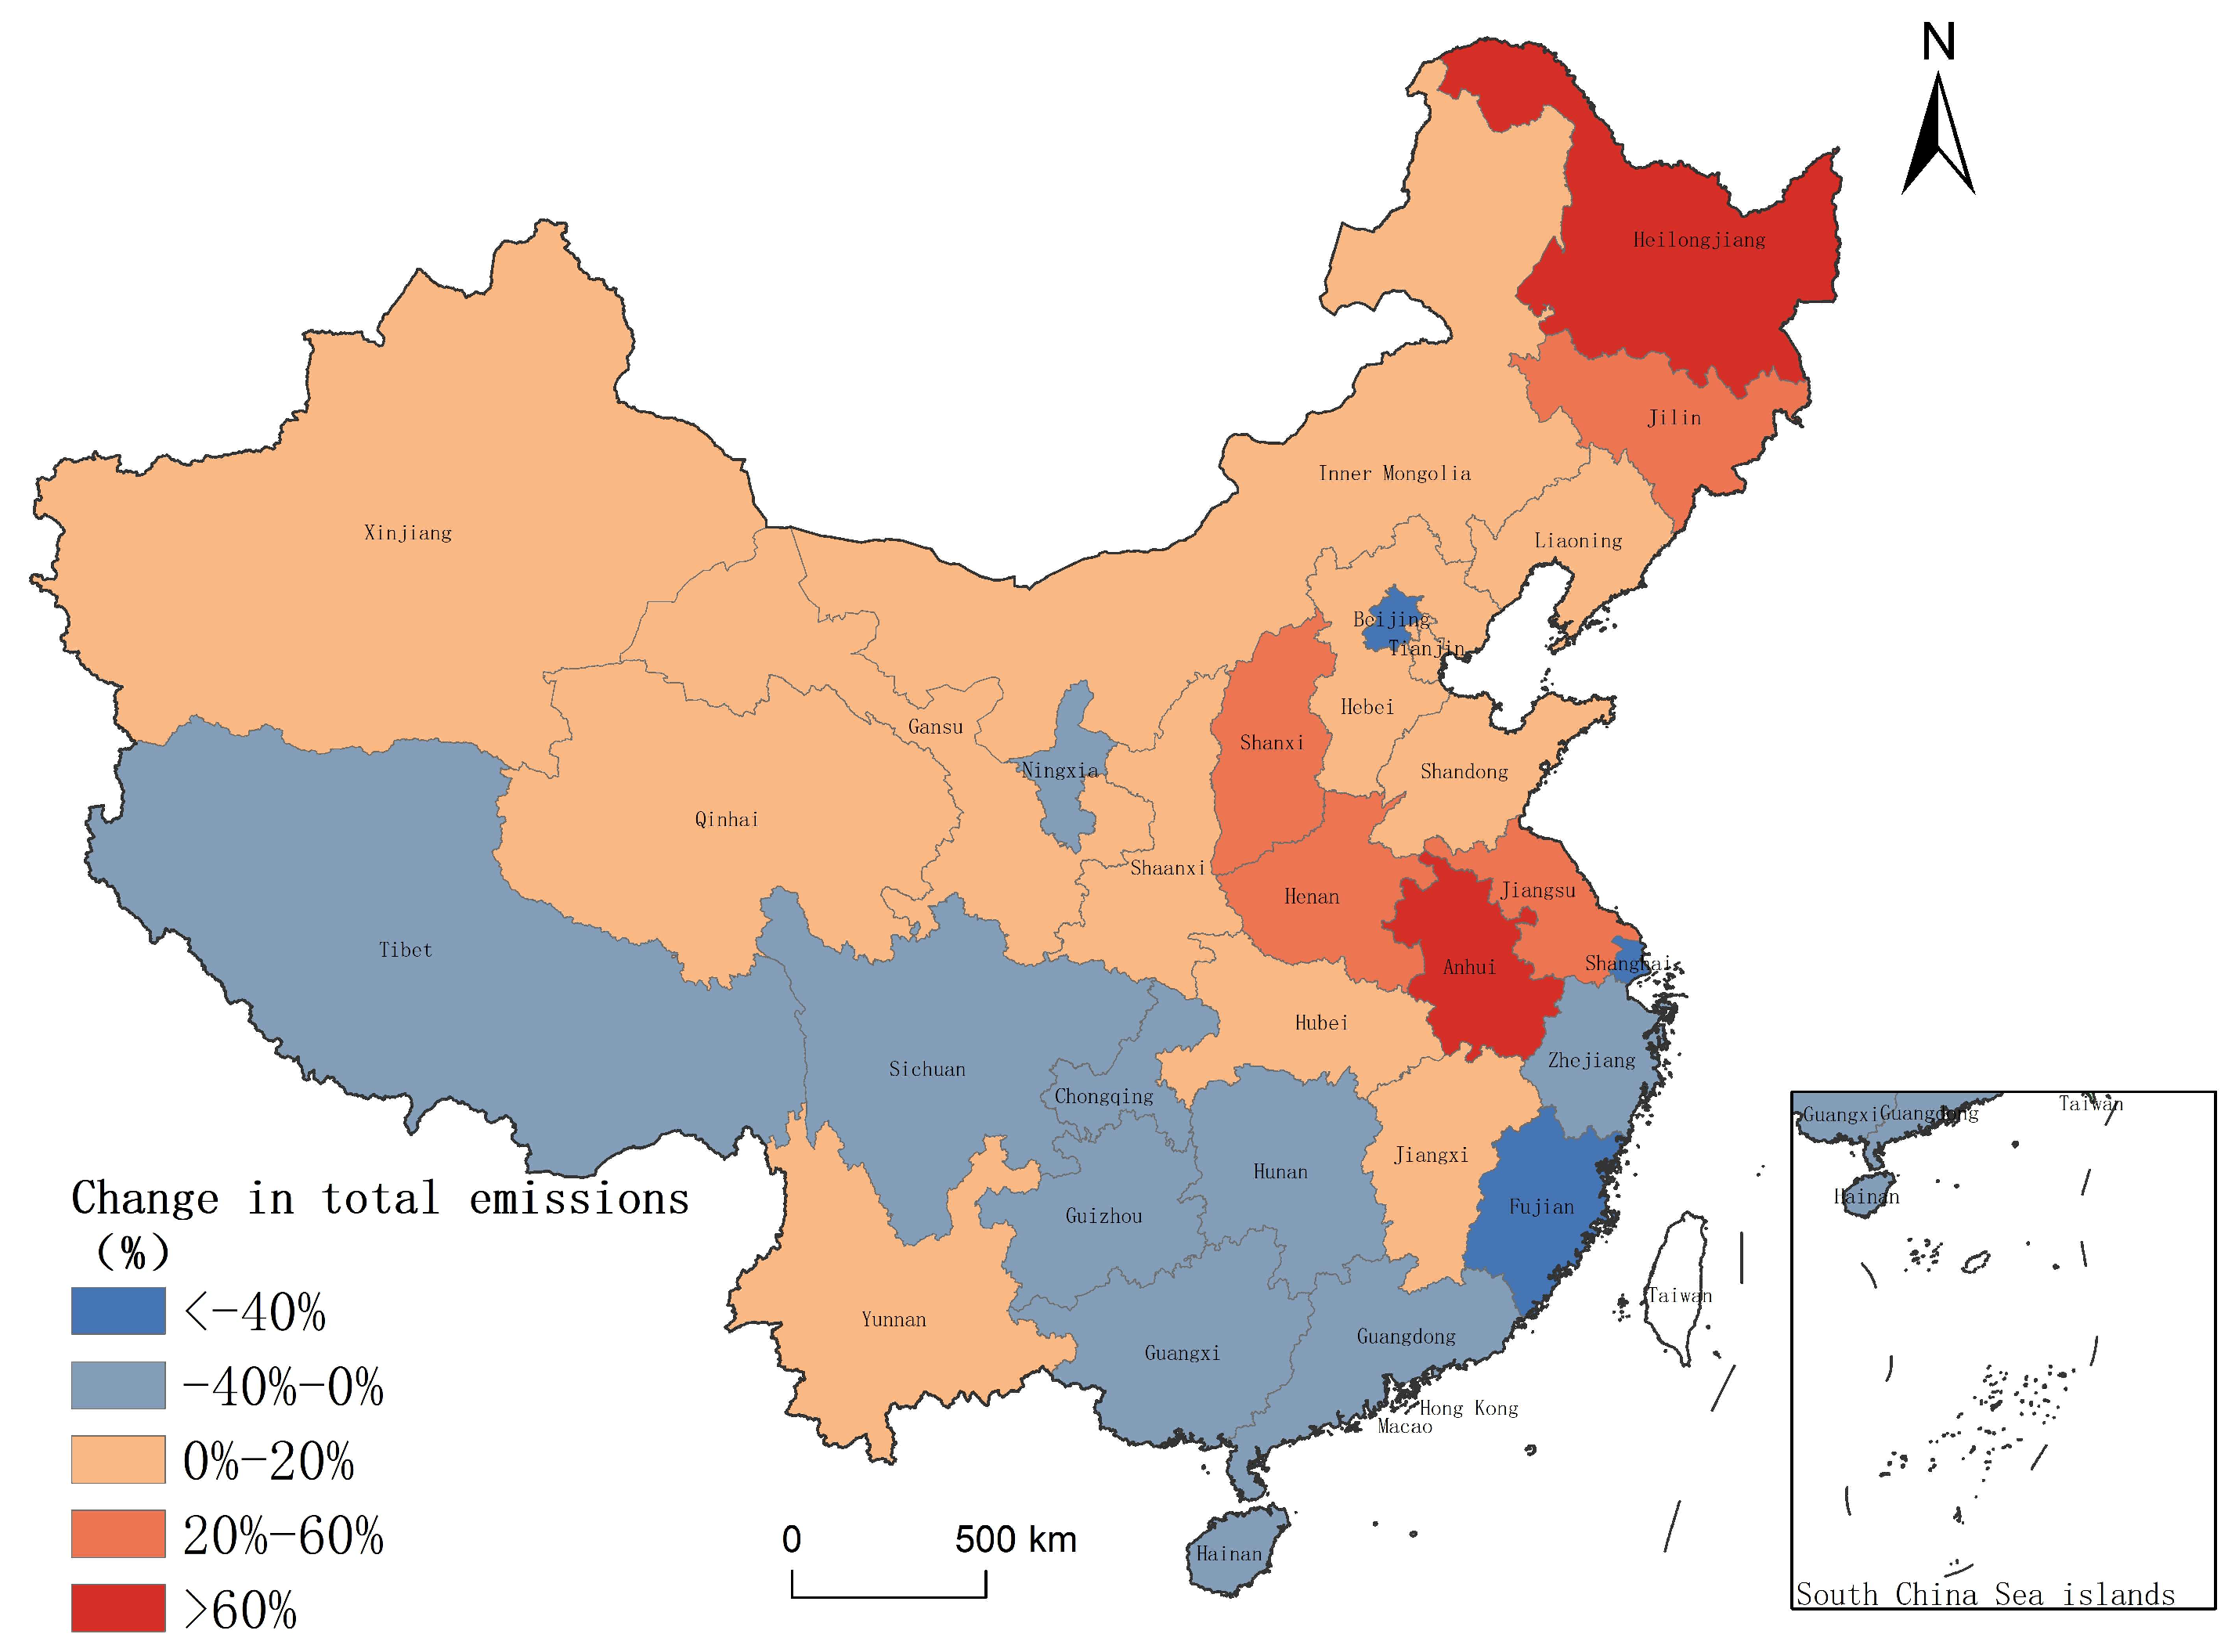
Figure 8.
Cold spot–hotspot analysis of China’s agricultural greenhouse gas emissions in 2020.
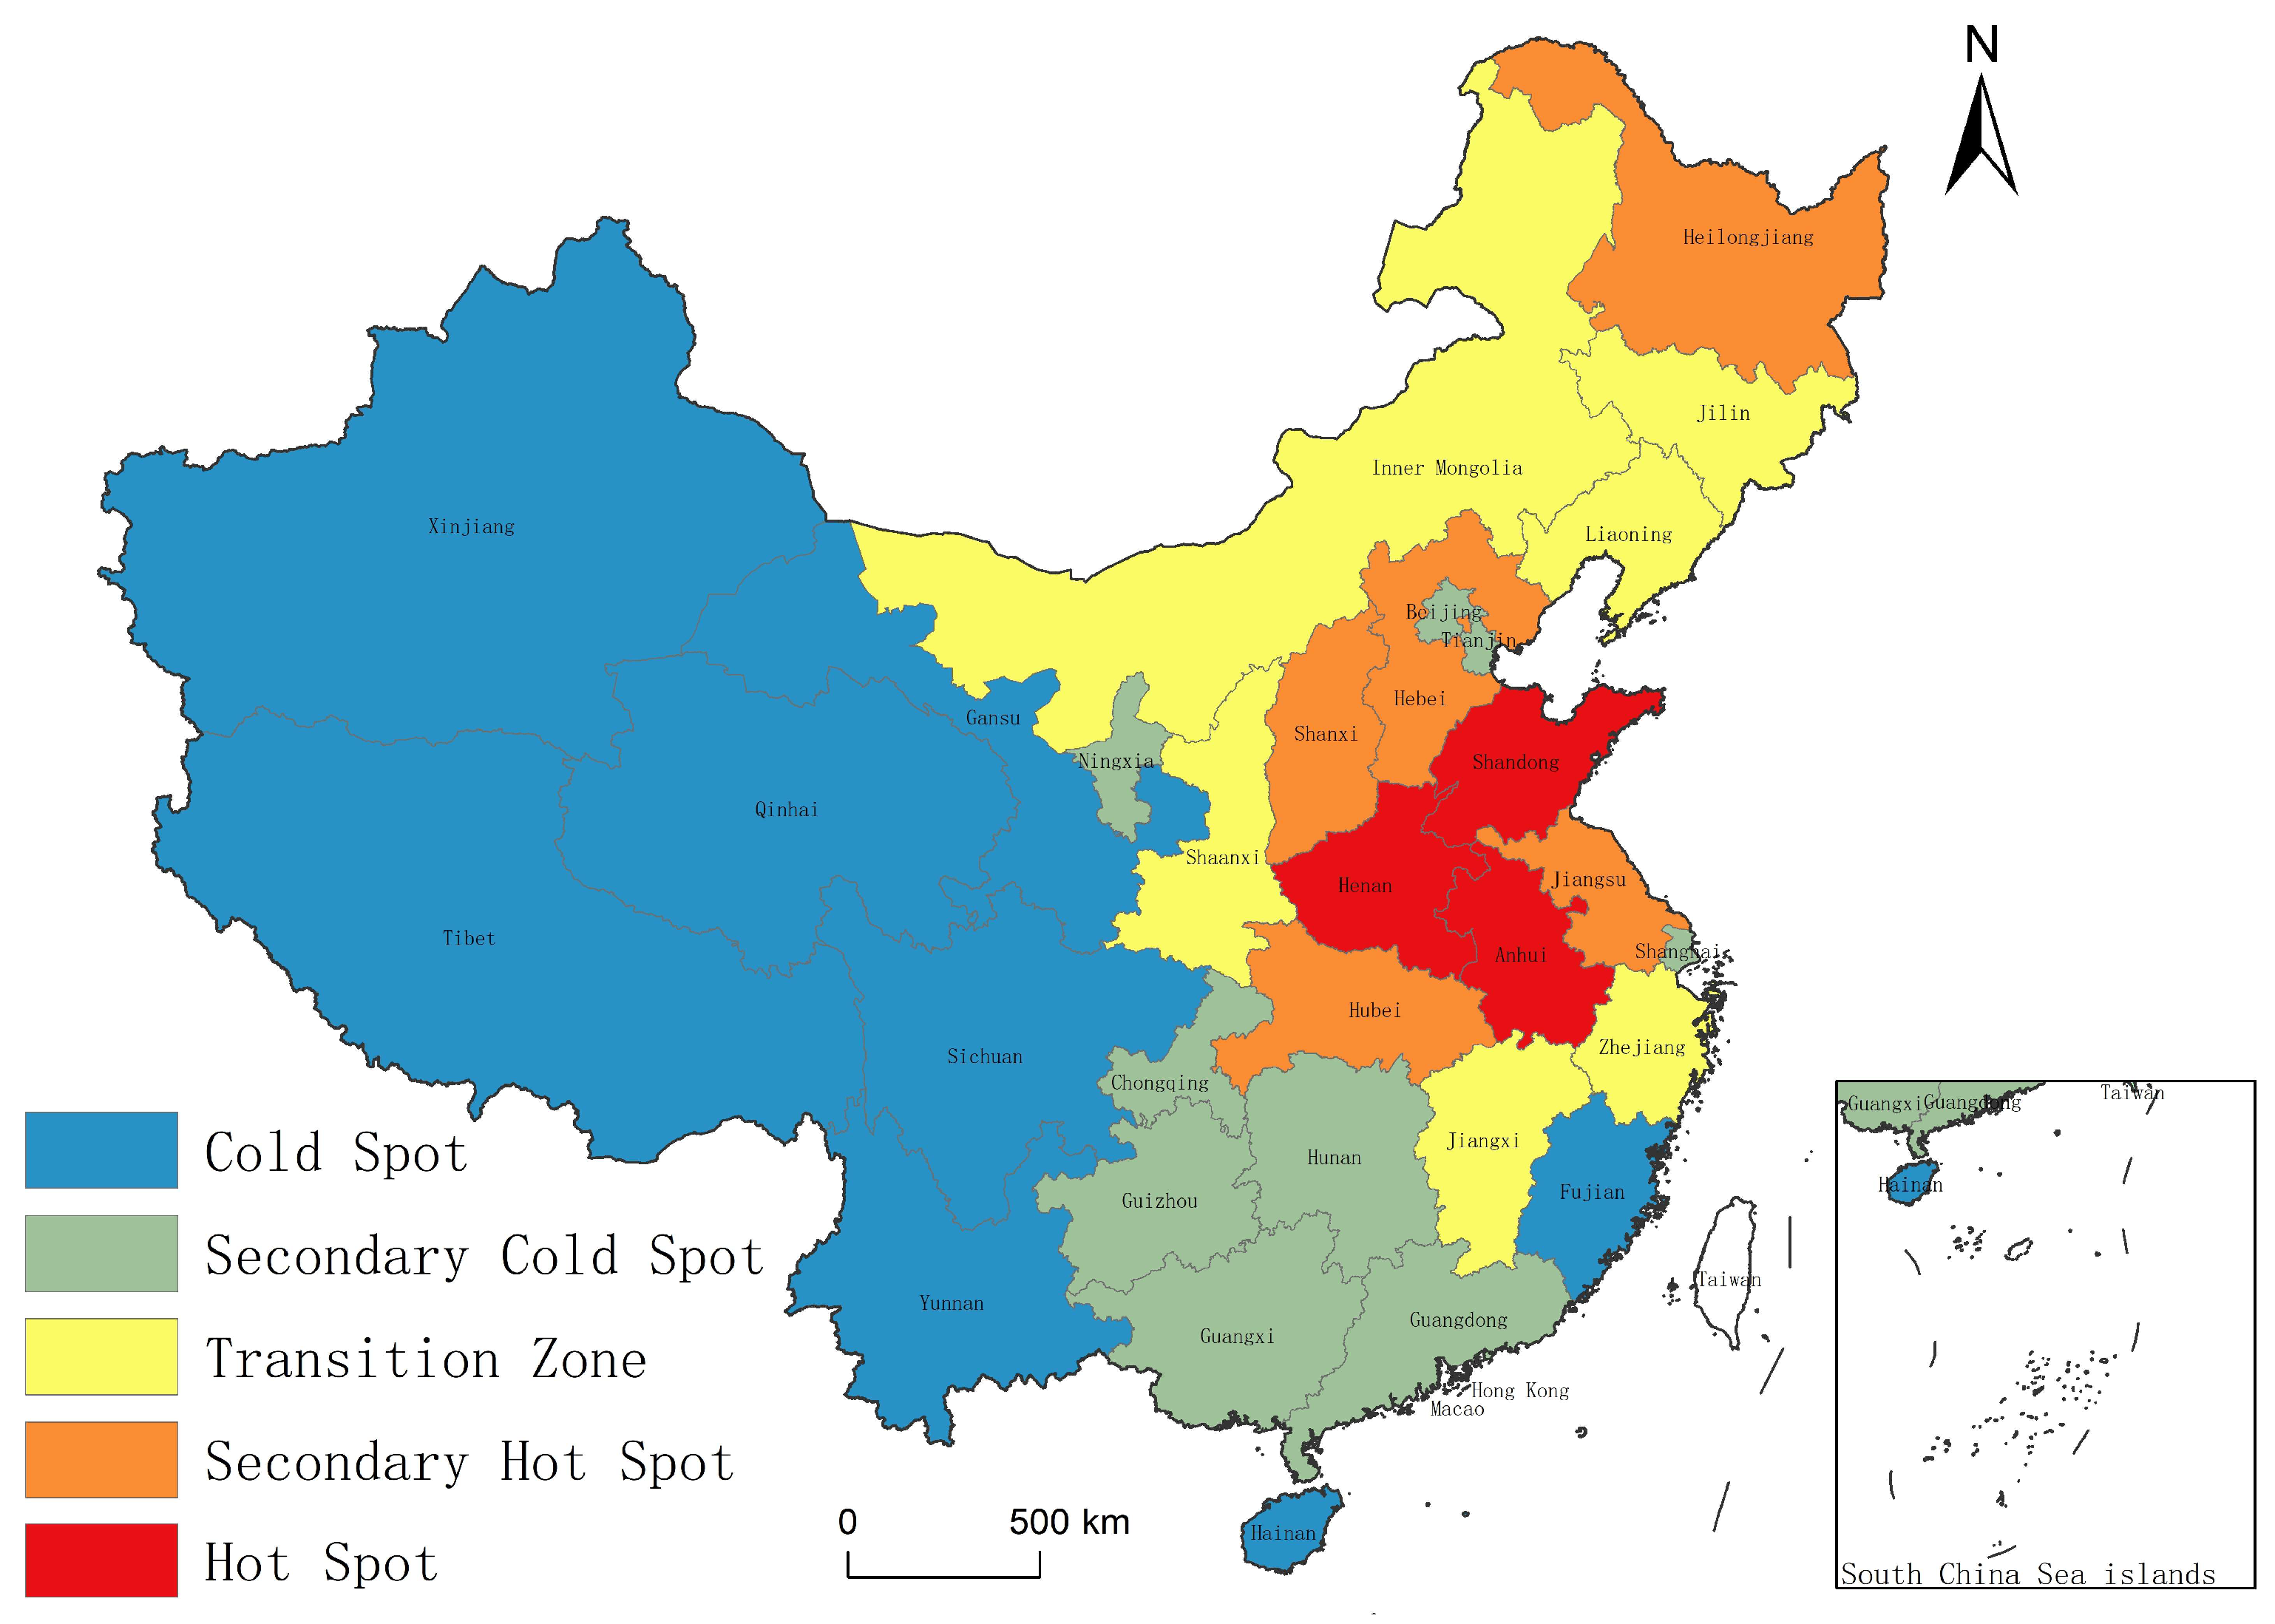
Figure 9.
Spatial distribution of agricultural CH4 emissions in China, 2000–2020.
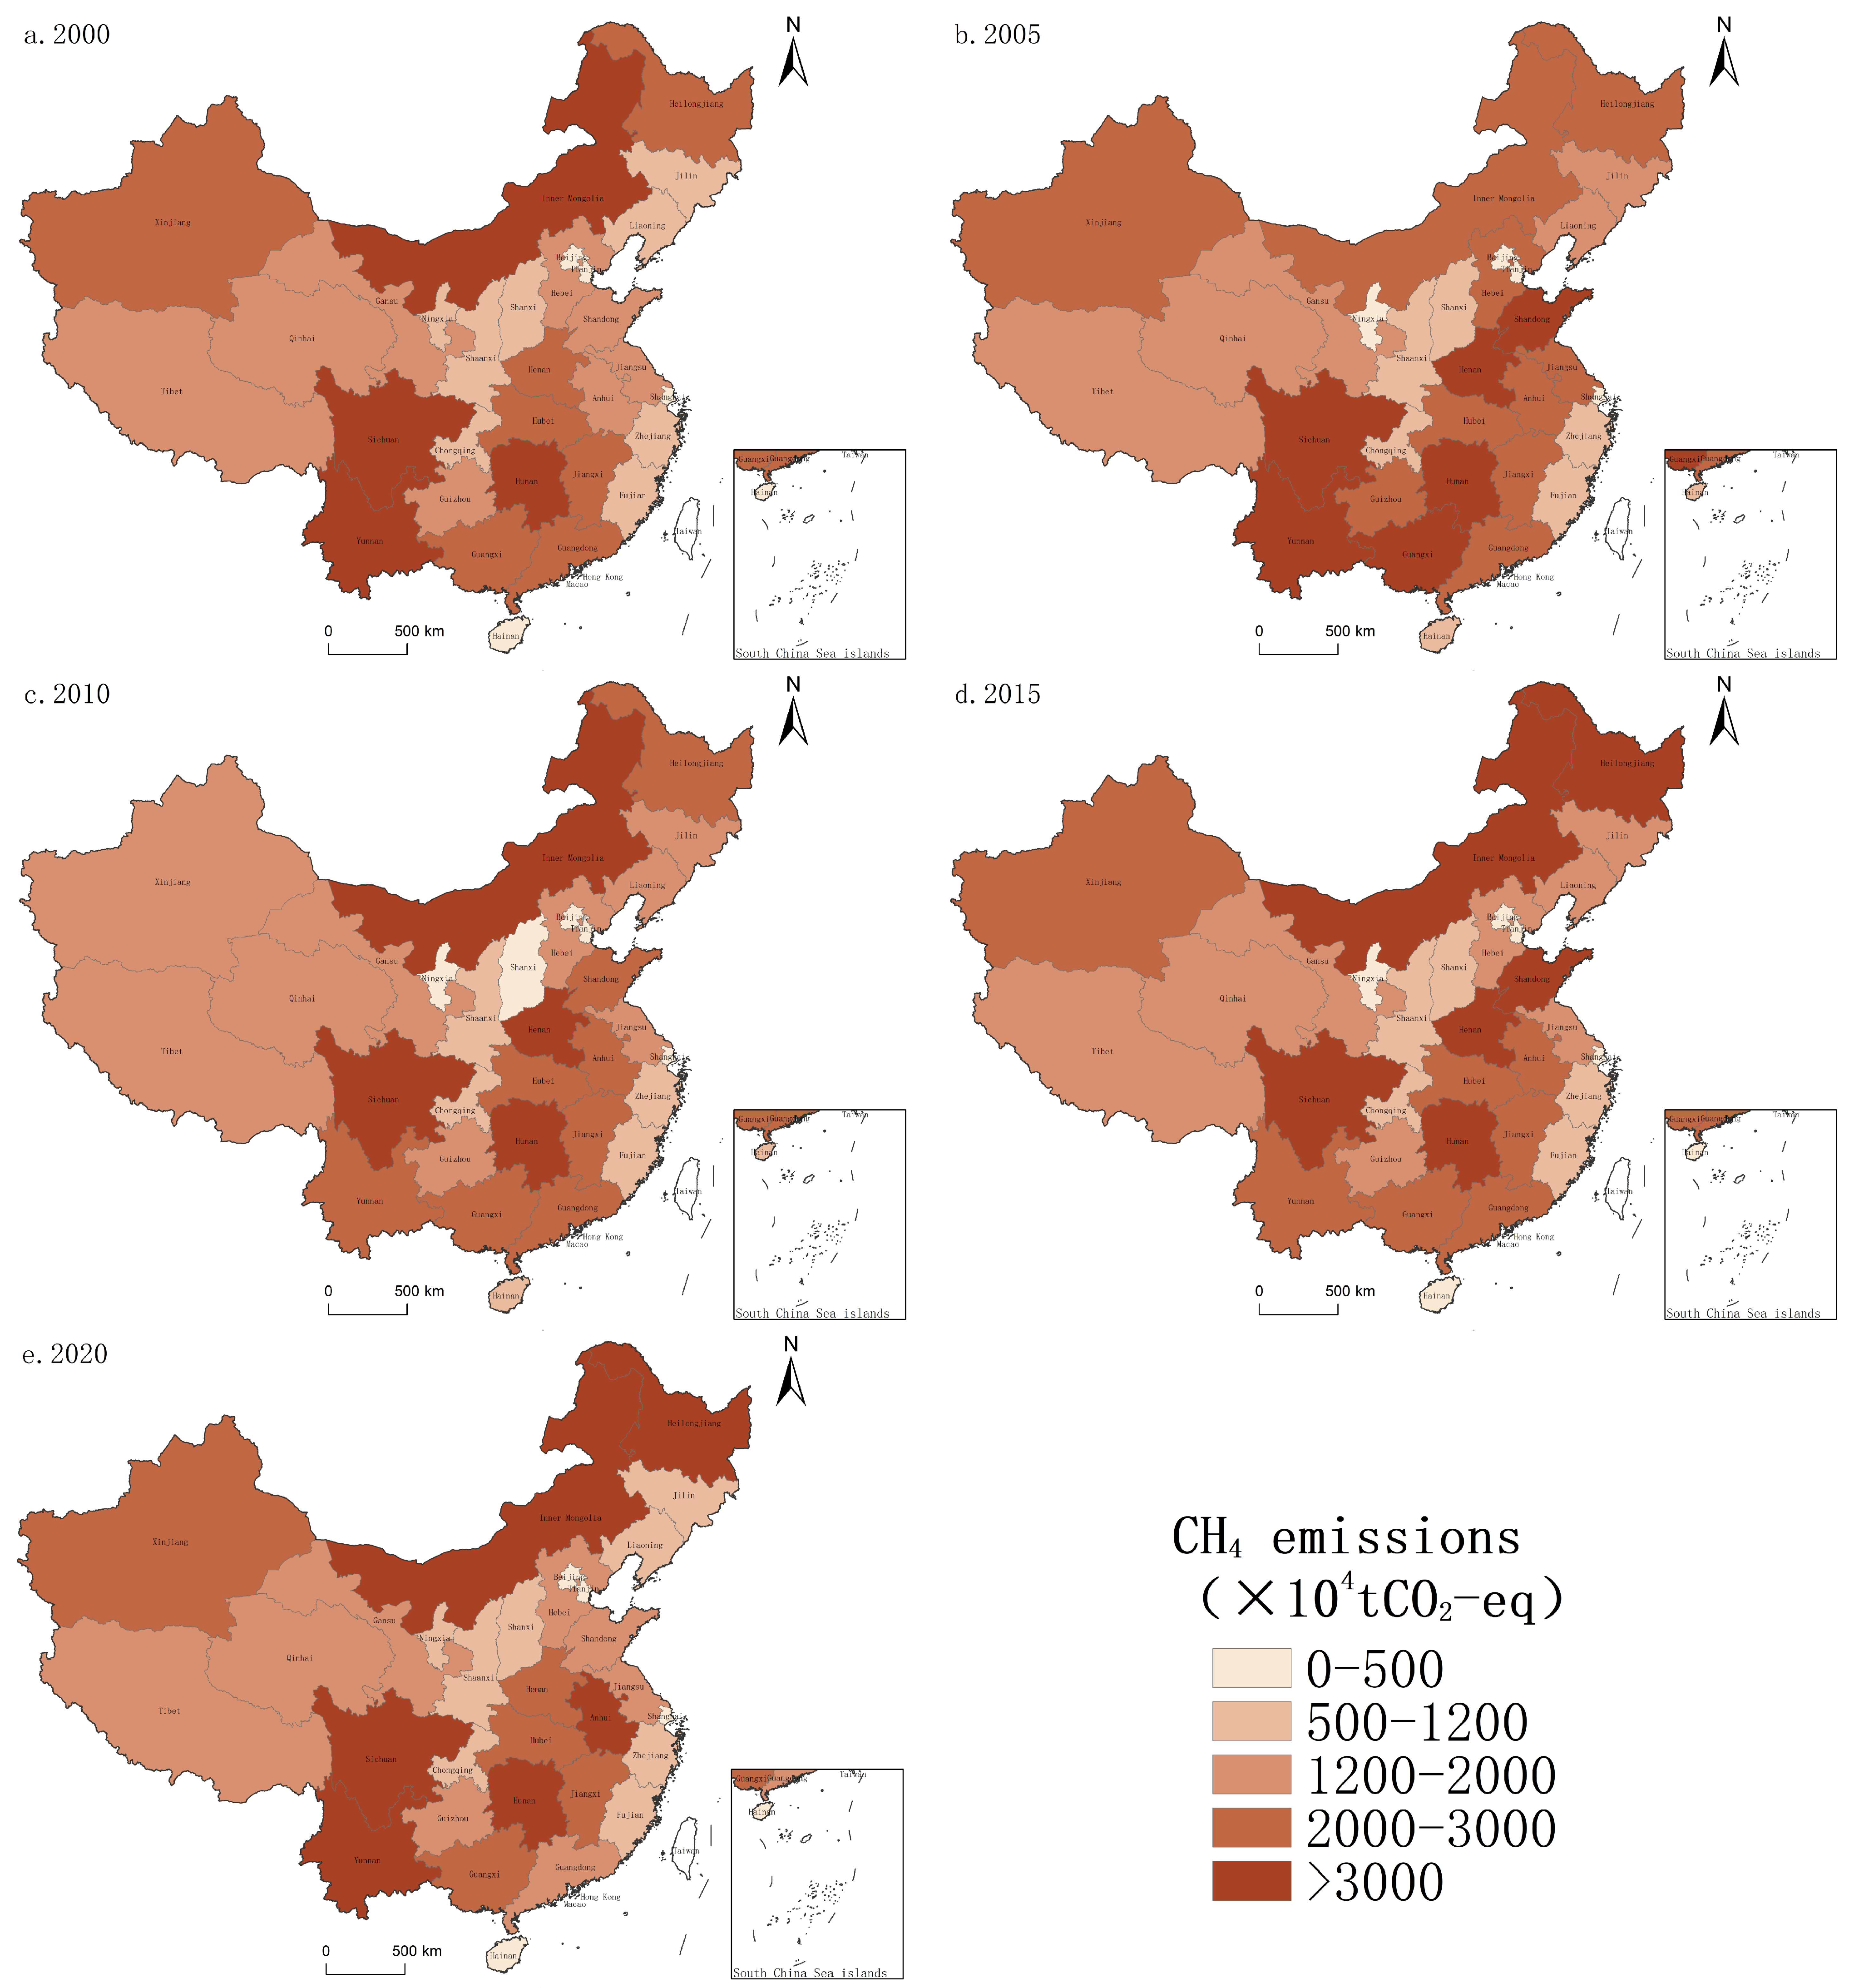
Figure 10.
Spatial distribution of agricultural CO2 emissions in China, 2000–2020.
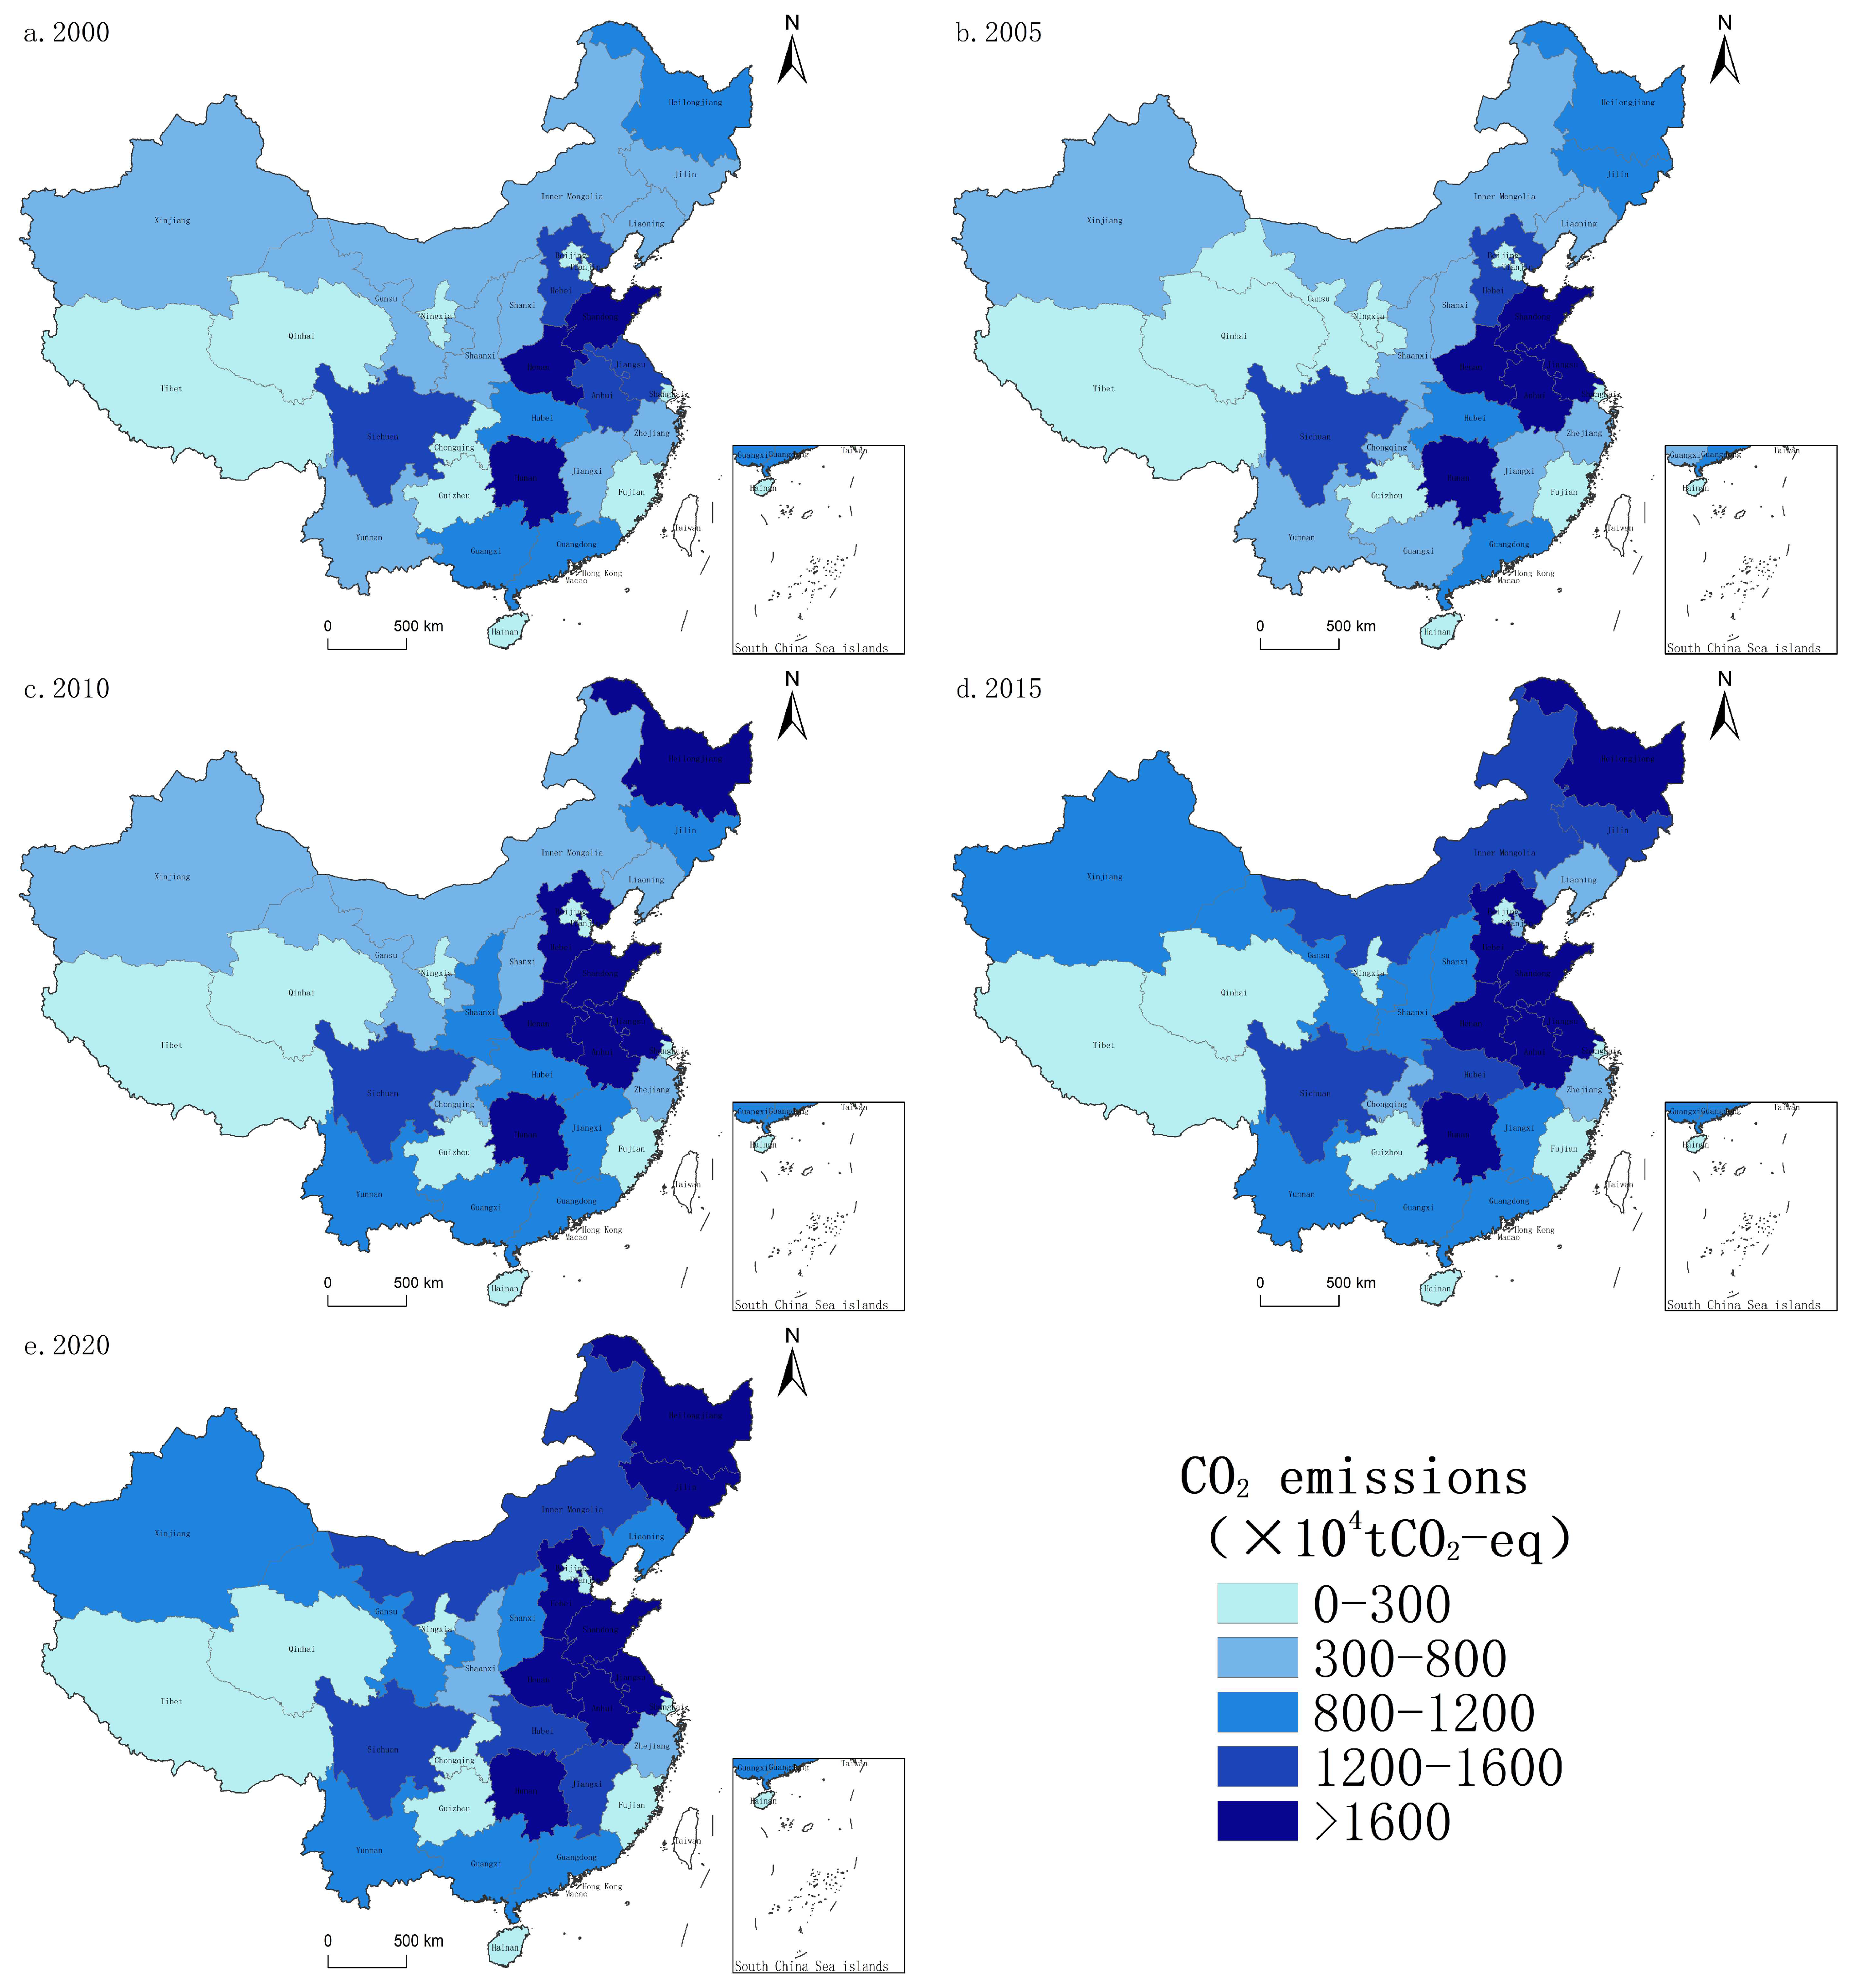
Figure 11.
Spatial distribution of agricultural N2O emissions in China, 2000–2020.
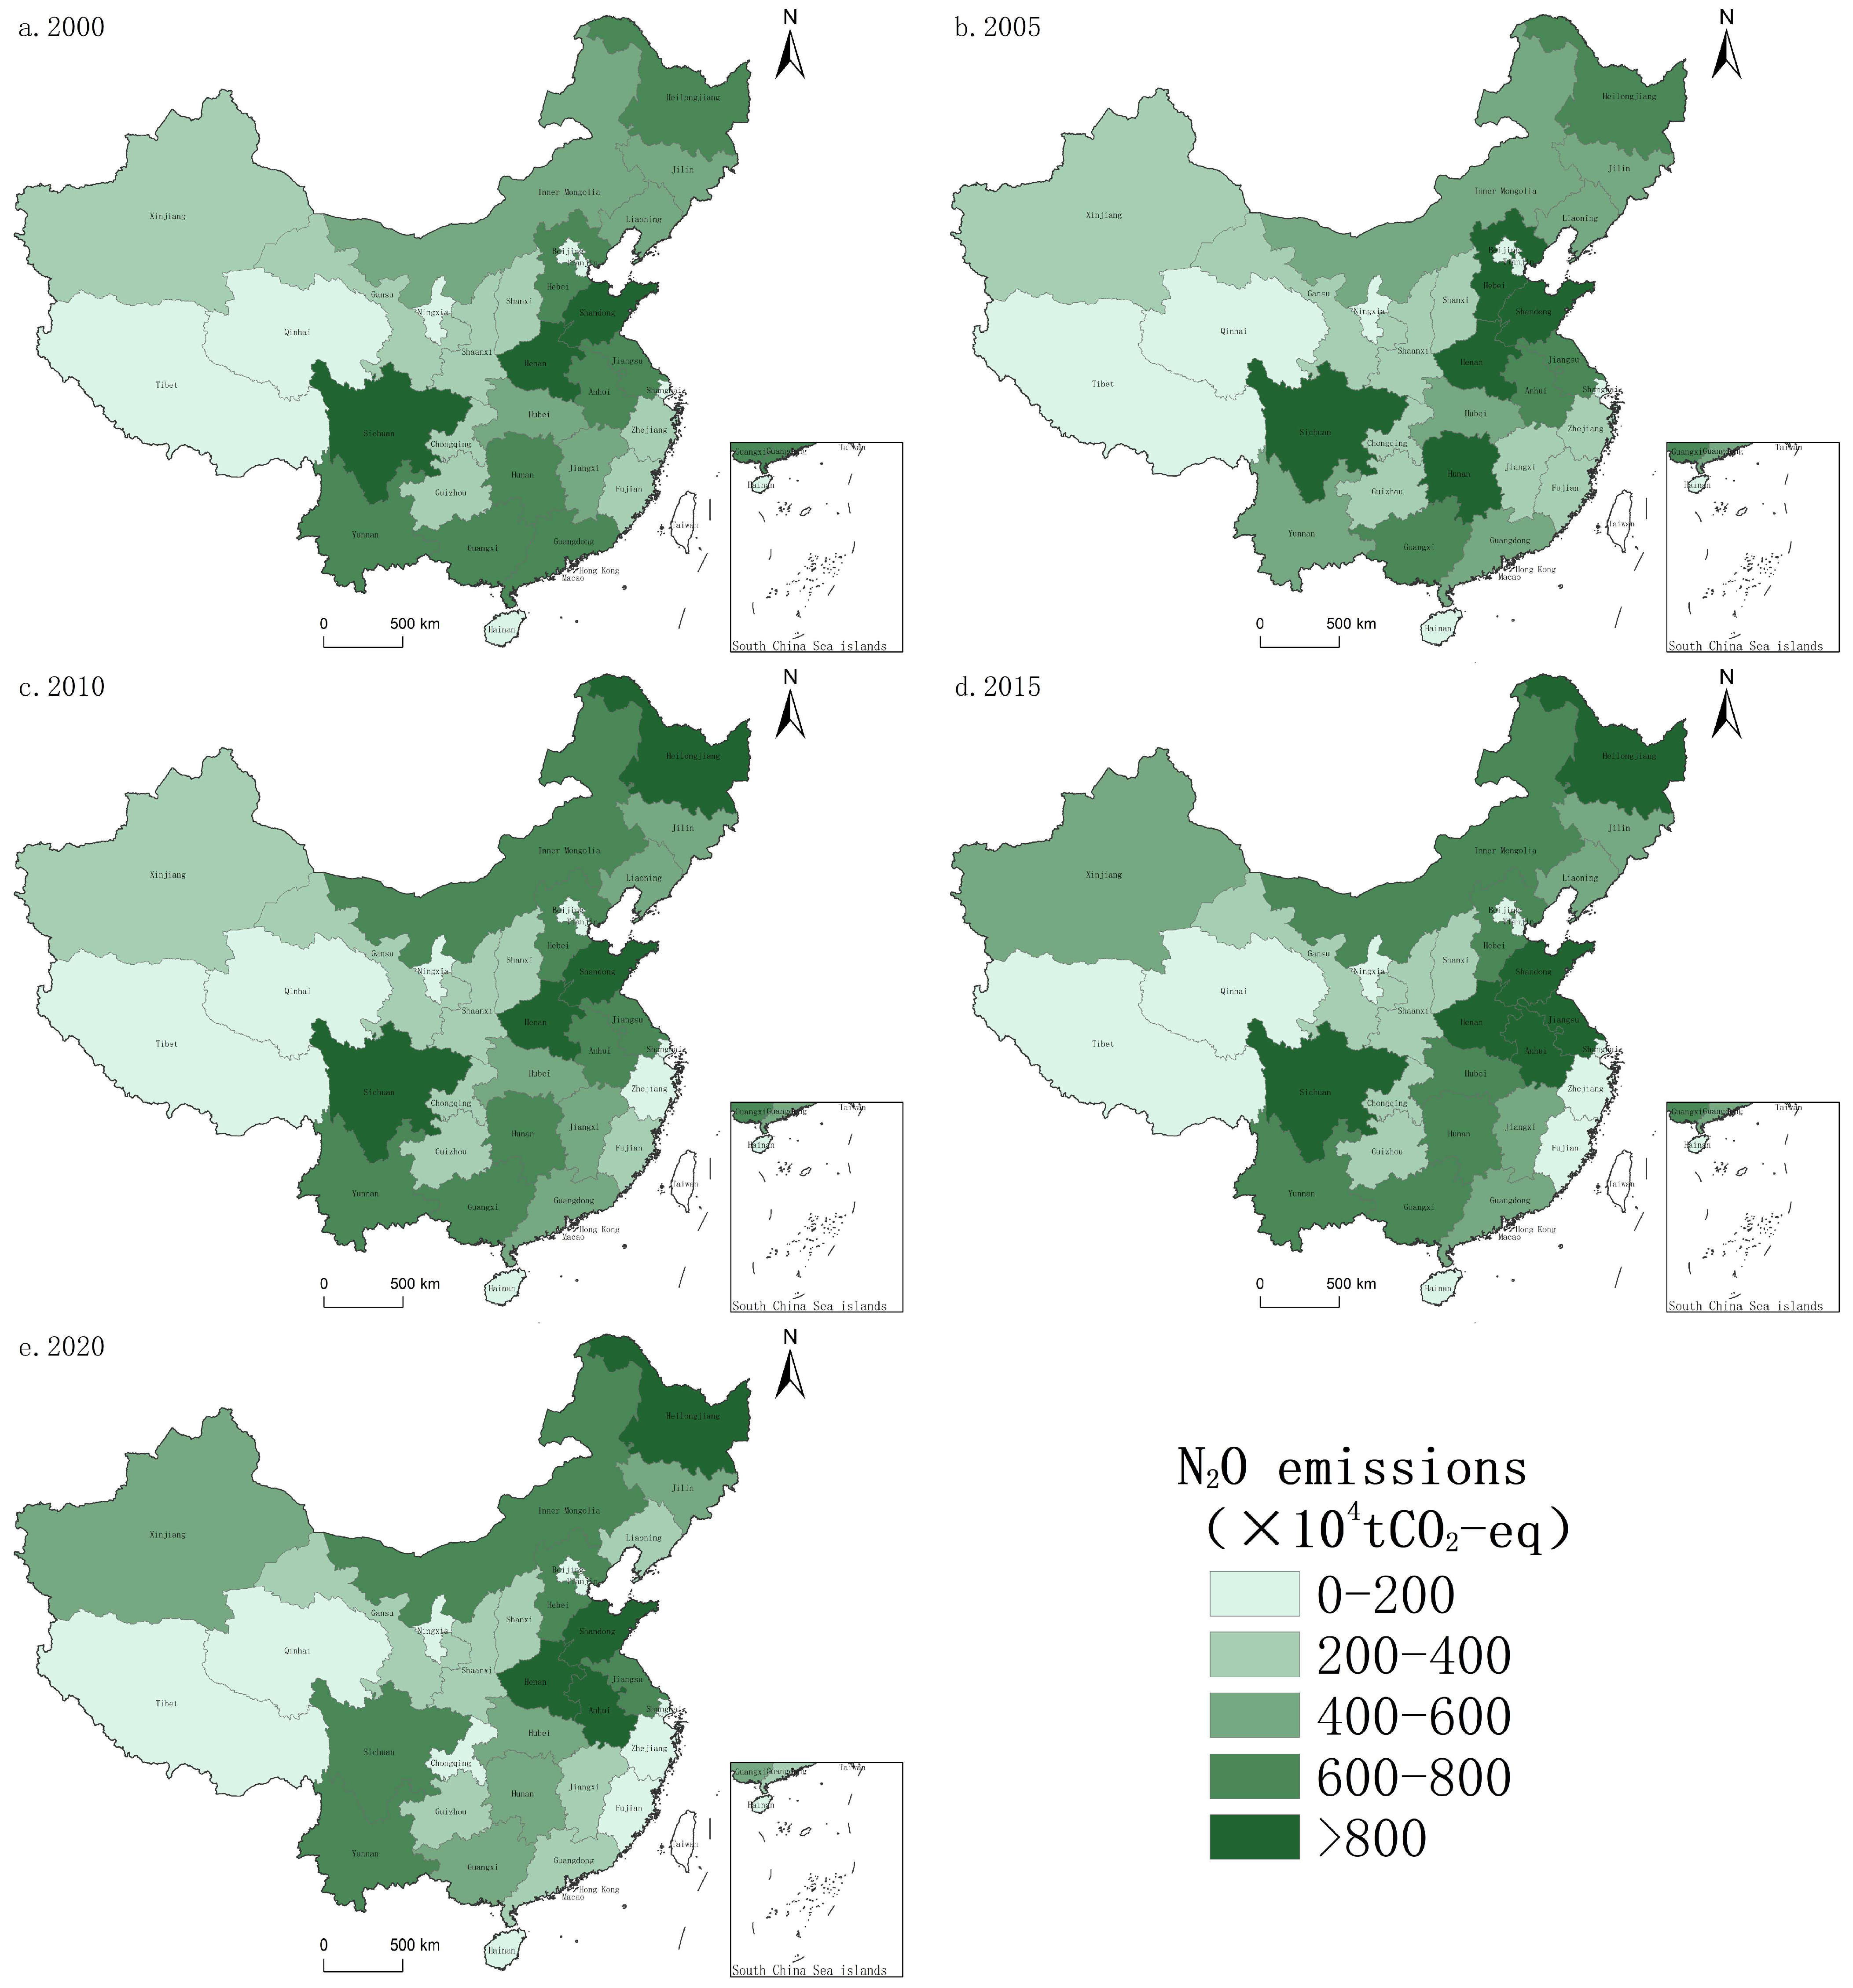
Table 2.
Direct N2O emission factors for agricultural land in different regions (kgN2O-N/kg N input).
Table 2.
Direct N2O emission factors for agricultural land in different regions (kgN2O-N/kg N input).
| District | Carbon Emission Coefficients | Coefficient Sources |
|---|---|---|
| Inner Mongolia, Xinjiang, Gansu, Qinghai, Tibet, Shaanxi, Shanxi, Ningxia | 0.0056 | Guidelines for the preparation of provincial greenhouse gas inventories (trial) |
| Heilongjiang, Jilin, Liaoning | 0.0114 | |
| Beijing, Tianjin, Hebei, Henan, Shandong | 0.0057 | |
| Zhejiang, Shanghai, Jiangsu, Anhui, Jiangxi, Hunan, Hubei, Sichuan, Chongqing | 0.0109 | |
| Guangdong, Guangxi, Hainan, Fujian | 0.0178 | |
| Yunnan, Guizhou | 0.0106 |
Table 3.
Three food crop parameters.
| Grain Crops | Nitrogen Content of Straw | Economic Factor | Root–Crown Ratio | Straw Return Rate |
|---|---|---|---|---|
| Rice | 0.00753 | 0.489 | 0.125 | 0.323 [47] |
| Wheat | 0.00516 | 0.434 | 0.166 | 0.765 [32] |
| Corn | 0.0058 | 0.438 | 0.17 | 0.093 [48] |
Table 4.
Emission factors for CH4 from rice fields in different regions (Kg/hm2).
| District | Single-Season Rice | Double-Season Early Rice | Double-Season Late Rice |
|---|---|---|---|
| Beijing, Tianjin, Hebei, Shanxi, Inner Mongolia | 234.0 | — | — |
| Shandong, Shanghai, Jiangsu, Zhejiang, Anhui, Fujian, Jiangxi | 215.5 | 211.4 | 224.0 |
| Henan, Hubei, Hunan, Guangdong, Guangxi, Hainan | 236.7 | 241.0 | 273.2 |
| Sichuan, Chongqing, Guizhou, Yunnan, Tibet | 156.2 | 156.2 | 171.7 |
| Liaoning, Jilin, Heilongjiang | 168.0 | — | — |
| Shaanxi, Gansu, Qinghai, Ningxia, Xinjiang | 231.2 | — | — |
Table 5.
Animal enteric fermentation CH4 emission factors (kg/head/year).
| Breeding Method | Cow | Non-Cow | Sheep | Goats | Pigs | Horse | Donkey/Mule | Camel |
|---|---|---|---|---|---|---|---|---|
| Large-scale feeding | 88.1 | 52.9 | 8.2 | 8.9 | 1 | 18 | 10 | 46 |
| Farmer feeding | 89.3 | 67.9 | 8.7 | 9.4 | ||||
| Herd | 99.3 | 85.3 | 7.5 | 6.7 |
Table 6.
Emission factors for animal manure management in different regions (kg/head/year).
| Animal Type | Northern China | Northwest | Eastern China | Central South | Southwestern | Northwestern | |
|---|---|---|---|---|---|---|---|
| Cow | CH4 | 7.46 | 2.23 | 8.33 | 8.45 | 6.51 | 5.93 |
| N2O | 1.846 | 1.096 | 2.065 | 1.710 | 1.884 | 1.447 | |
| Non-cow | CH4 | 2.82 | 1.02 | 3.31 | 4.72 | 3.21 | 1.86 |
| N2O | 0.794 | 0.913 | 0.846 | 0.805 | 0.691 | 0.545 | |
| Sheep | CH4 | 0.15 | 0.15 | 0.26 | 0.34 | 0.48 | 0.28 |
| N2O | 0.093 | 0.057 | 0.113 | 0.106 | 0.064 | 0.074 | |
| Goats | CH4 | 0.17 | 0.16 | 0.28 | 0.31 | 0.53 | 0.32 |
| N2O | 0.093 | 0.057 | 0.113 | 0.106 | 0.064 | 0.074 | |
| Pigs | CH4 | 3.12 | 1.12 | 5.08 | 5.85 | 4.18 | 1.38 |
| N2O | 0.227 | 0.266 | 0.175 | 0.157 | 0.159 | 0.195 | |
| Horse | CH4 | 1.09 | 1.09 | 1.64 | 1.64 | 1.64 | 1.09 |
| N2O | 0.330 | ||||||
| Donkey/Mule | CH4 | 0.60 | 0.60 | 0.90 | 0.90 | 0.90 | 0.60 |
| N2O | 0.188 | ||||||
| Camel | CH4 | 1.28 | 1.28 | 1.92 | 1.92 | 1.92 | 1.28 |
| N2O | 0.330 | ||||||
Table 7.
Greenhouse gas emissions from agriculture in 31 provinces of China, 2000–2020.
| Province | 2000 | 2005 | 2010 | 2015 | 2020 | |||||
|---|---|---|---|---|---|---|---|---|---|---|
| Total (10,000 tons) | Ranking | Total (10,000 tons) | Ranking | Total (10,000 tons) | Ranking | Total (10,000 tons) | Ranking | Total (10,000 tons) | Ranking | |
| Beijing | 126.52 | 31 | 186.21 | 31 | 168.57 | 31 | 130.23 | 31 | 48.61 | 31 |
| Shanghai | 281.87 | 29 | 202.49 | 30 | 208.55 | 30 | 191.83 | 30 | 153.28 | 30 |
| Tianjin | 258.44 | 30 | 292.59 | 29 | 254.66 | 29 | 534.25 | 29 | 293.43 | 29 |
| Chongqing | 1527.91 | 24 | 1739.50 | 22 | 1556.05 | 22 | 1564.59 | 23 | 1317.97 | 25 |
| Heilongjiang | 3720.19 | 13 | 4104.11 | 12 | 5865.46 | 4 | 7430.08 | 3 | 7007.71 | 4 |
| Liaoning | 2069.97 | 19 | 2397.21 | 18 | 2565.17 | 17 | 2638.66 | 17 | 2325.77 | 18 |
| Jilin | 2147.26 | 18 | 2867.73 | 17 | 3043.89 | 15 | 3417.13 | 16 | 3312.75 | 15 |
| Henan | 5865.67 | 3 | 8942.55 | 1 | 8494.50 | 1 | 8969.99 | 1 | 7730.59 | 2 |
| Hebei | 3742.29 | 12 | 5118.43 | 6 | 4151.15 | 11 | 4535.81 | 12 | 4196.68 | 12 |
| Hubei | 3812.47 | 10 | 4253.10 | 9 | 4267.43 | 10 | 4746.43 | 9 | 4414.23 | 11 |
| Hunan | 7384.36 | 1 | 8065.24 | 2 | 7336.22 | 2 | 7853.12 | 2 | 7255.49 | 3 |
| Shandong | 4911.74 | 4 | 6552.21 | 4 | 5467.24 | 5 | 7415.40 | 4 | 5748.97 | 6 |
| Shanxi | 1373.74 | 26 | 1601.98 | 23 | 1458.13 | 23 | 1895.00 | 21 | 1963.96 | 20 |
| Shaanxi | 1525.96 | 25 | 1841.18 | 21 | 1943.91 | 20 | 2044.90 | 20 | 1752.41 | 23 |
| Zhejiang | 1998.27 | 20 | 1571.35 | 24 | 1441.92 | 24 | 1081.50 | 26 | 1792.07 | 22 |
| Anhui | 4072.89 | 9 | 5230.80 | 5 | 5016.39 | 6 | 6541.80 | 6 | 7844.98 | 1 |
| Fujian | 1553.36 | 23 | 1531.85 | 25 | 1352.30 | 26 | 1244.08 | 25 | 889.39 | 26 |
| Jiangsu | 3344.23 | 14 | 4570.41 | 8 | 4028.44 | 13 | 5946.06 | 7 | 4938.96 | 8 |
| Jiangxi | 3791.97 | 11 | 3472.52 | 14 | 4139.65 | 12 | 4695.21 | 10 | 4535.82 | 10 |
| Guangdong | 4137.16 | 8 | 4158.29 | 11 | 3688.28 | 14 | 3708.10 | 14 | 3110.60 | 16 |
| Hainan | 632.95 | 28 | 760.10 | 27 | 700.27 | 27 | 653.18 | 28 | 451.18 | 28 |
| Sichuan | 6526.62 | 2 | 7102.36 | 3 | 6714.90 | 3 | 6698.37 | 5 | 6127.22 | 5 |
| Guizhou | 2435.42 | 17 | 3123.52 | 15 | 2498.83 | 18 | 2549.84 | 19 | 2245.73 | 19 |
| Yunnan | 4563.86 | 5 | 4169.10 | 10 | 4359.16 | 9 | 4305.16 | 13 | 4832.14 | 9 |
| Gansu | 2678.57 | 16 | 1930.02 | 19 | 2102.61 | 19 | 2608.10 | 18 | 2873.56 | 17 |
| Qinghai | 1776.64 | 22 | 1378.33 | 26 | 1430.62 | 25 | 1428.38 | 24 | 1858.10 | 21 |
| Guangxi | 4371.55 | 6 | 5085.64 | 7 | 4512.08 | 7 | 4538.58 | 11 | 3749.35 | 14 |
| Inner Mongolia | 4295.77 | 7 | 3851.86 | 13 | 4407.36 | 8 | 5088.53 | 8 | 5104.39 | 7 |
| Ningxia | 983.11 | 27 | 612.13 | 28 | 604.48 | 28 | 709.83 | 27 | 880.40 | 27 |
| Xinjiang | 3300.55 | 15 | 3070.58 | 16 | 2647.62 | 16 | 3667.66 | 15 | 3871.10 | 13 |
| Tibet | 1793.40 | 21 | 1887.76 | 20 | 1860.88 | 21 | 1829.72 | 22 | 1708.39 | 24 |
Table 8.
Relevance of national policies and events to greenhouse gas emissions from agriculture.
| Year | National Policy (or Event) | Influence |
|---|---|---|
| 2004 | Implementation of the “two reductions, three subsidies” policy | + |
| 2006 | Central Document No. 1 emphasizes slowing down high-emission and high-polluting agricultural inputs | − |
| 2007 | Opinions of the State Council on Promoting the Sustainable and Healthy Development of the Livestock Industry | − |
| 2008 | Central Document No. 1 emphasizes the protection of the ecological environment and the development of conservation agriculture | − |
| 2008 | The onset of the financial crisis | + |
| 2014 | Central Document No. 1 points out to accelerate the modernization of agriculture | + |
| 2015 | Law of the People’s Republic of China on Prevention and Control of Air Pollution | − |
| 2015 | Action Plan for Zero Growth in Fertilizer Use by 2020 | − |
| 2017 | The introduction of the rural revitalization strategy | − |
| 2017 | Central Document No. 1 proposes to enhance resource environmental protection and green ecological restoration work | − |
Note: +: the national policy or event contributed to an increase in agricultural GHG emissions; −: the national policy or event inhibited the increase in agricultural GHG emissions.
Disclaimer/Publisher’s Note: The statements, opinions and data contained in all publications are solely those of the individual author(s) and contributor(s) and not of MDPI and/or the editor(s). MDPI and/or the editor(s) disclaim responsibility for any injury to people or property resulting from any ideas, methods, instructions or products referred to in the content. |
© 2024 by the authors. Licensee MDPI, Basel, Switzerland. This article is an open access article distributed under the terms and conditions of the Creative Commons Attribution (CC BY) license (https://creativecommons.org/licenses/by/4.0/).
Share and Cite
MDPI and ACS Style
Ning, J.; Zhang, C.; Hu, M.; Sun, T. Accounting for Greenhouse Gas Emissions in the Agricultural System of China Based on the Life Cycle Assessment Method. Sustainability 2024, 16, 2594. https://doi.org/10.3390/su16062594
AMA Style
Ning J, Zhang C, Hu M, Sun T. Accounting for Greenhouse Gas Emissions in the Agricultural System of China Based on the Life Cycle Assessment Method. Sustainability. 2024; 16(6):2594. https://doi.org/10.3390/su16062594
Chicago/Turabian StyleNing, Jing, Chunmei Zhang, Mingjun Hu, and Tiancheng Sun. 2024. "Accounting for Greenhouse Gas Emissions in the Agricultural System of China Based on the Life Cycle Assessment Method" Sustainability 16, no. 6: 2594. https://doi.org/10.3390/su16062594
Note that from the first issue of 2016, this journal uses article numbers instead of page numbers. See further details here.