

Indoor Air Quality and Ventilation Energy in University Classrooms: Simplified Model to Predict Trade-Offs and Synergies


1
Environmental Engineering Program, School of Sciences and Engineering, The American University in Cairo, AUC Avenue, P.O. Box 74, New Cairo 11835, Egypt
2
Department of Architecture, School of Sciences and Engineering, The American University in Cairo, AUC Avenue, P.O. Box 74, New Cairo 11835, Egypt
*
Author to whom correspondence should be addressed.
Sustainability 2024, 16(7), 2719; https://doi.org/10.3390/su16072719
Submission received: 29 December 2023
/
Revised: 27 February 2024
/
Accepted: 19 March 2024
/
Published: 26 March 2024
(This article belongs to the Special Issue Sustainable Buildings and Cities)
Abstract
:Students and educators spend significant time in learning spaces on university campuses. Energy efficiency has become a concern among facility managers, given the need to maintain acceptable indoor air quality (IAQ) levels during and after the COVID-19 pandemic. This paper investigates the relationship between control and extraneous variables in a university classroom’s total mechanical ventilation (kWh). The model is built using Grasshopper software on Rhino Version 7. Our methodology encompasses (1) an extensive review of recent trends for studying IAQ and energy, (2) selecting parameters for simulation, (3) model configuration on Grasshopper, and finally, (4) a formulation of a pertinent equation to consolidate the relationship between the studied factors and the total mechanical ventilation energy (kWh). Central to this study are two key research questions: (1) What correlations exist between various parameters related to occupancy and IAQ in educational spaces? And (2) how can we optimize energy efficiency in university classrooms? The main contribution of this research is a generated equation representing the annual mechanical ventilation energy consumption based on selected parameters of classroom height, area, occupancy, window location, and ventilation rate of HVAC systems. We find that occupancy and class volume are the two most influential factors directly affecting mechanical ventilation energy consumption. The equation serves as a valuable estimation tool for facility managers, designers, and campus operations to investigate how fluctuations in occupancy can influence ventilation energy consumption in the physical attributes of a university classroom. This enables proactive decision-making, optimizing energy efficiency and resource allocation in real-time to promote sustainable and cost-effective campus operations.
1. Introduction
1.1. Background and Context
How can we ensure that university classrooms consume less energy while maintaining acceptable indoor air quality levels? Educational buildings are among the most essential building typologies where indoor air quality is crucial [1,2,3,4,5]. This is because students and educators spend most of their time in these buildings, and the state of air quality management significantly impacts their concentration levels, creativity, productivity, and overall health and well-being. The COVID-19 pandemic has not only renewed the scientific community’s interest in researching strategies that improve indoor air quality, but has also enhanced the prospects of energy efficiency in the built environment [6]. The recent indoor air quality (IAQ) recommendations promoted maximizing fresh air through mechanical ventilation systems and advocated for opening windows within non-medical facilities. It also recommended to use high-efficiency purification and filtration systems. Such recommendations are advocated by the American Society of Heating, Refrigerating and Air-Conditioning Engineers (ASHRAE), the Federation of European Heating, Ventilation and Air Conditioning Associations (REVAH), the Centers for Disease Control and Prevention (CDC), the World Health Organization (WHO), as well as the United States Environmental Protection Agency (EPA) [7,8,9,10,11,12]. The standards mentioned above consider the occupancy rate within the volume of indoor space and exposure time. Parameters such as air flow rate, fresh air percentage within mechanical ventilation systems, and carbon dioxide levels are among the measurable indicators for healthy levels of IAQ.
IAQ echoes recommendations in educational facilities and university classrooms that advocate for maximizing fresh air within mechanically ventilated spaces. We continue to abide by such recommendations, which have increased energy bills. By observing published case studies documenting trends in the operation of educational facilities, specifically at the university level [13,14,15,16], it can be inferred that there is a trend of increasing energy consumption levels in light of the COVID-19 IAQ requirements. During the peak of the pandemic’s stringent lockdown regulations in March 2020, campus operations were minimized, and the shift to online learning happened within a short time frame. Conversely, when students returned to campus, operations gradually resumed business as usual. Between then and now, we observed spiking energy costs on campuses worldwide, which has made the energy efficiency of campuses a timely topic to explore.
1.2. State-of-the-Art Methods
A wide body of literature investigates the relationship between IAQ and energy efficiencies, where researchers use various methodologies to establish their hypotheses. Various modeling approaches, including simulation tools of software programs, integrated models, and machine learning, amongst other predictive models, have been used to analyze and optimize indoor air quality and energy performance. We explore relevant research studies employing diverse methodologies to illuminate the complex synergy between maintaining healthy indoor environments and minimizing energy consumption.
1.2.1. Simulation Tools
Researchers often employ different software programs to simulate indoor air quality-related parameters and energy-related modeling. Selecting two or more software programs serves to check off multiple research objectives [17,18]. First, for logistical reasons; using simulation as a technique saves time and physical effort compared to taking multiple IAQ-related field measurements, which are more expensive when employed repeatedly within buildings for assessments [19]. Secondly, each software program is designed with a core focus on analyzing a specific dataset. Scholars can test different parameters with strong confidence levels by combining software programs. For example, Cony Renaud Salis et al. used the CONTAM software (https://www.nist.gov/services-resources/software/contam, accessed on 28 December 2023) to determine air flow rates and concentration and used TRNSYS (https://www.trnsys.com/, accessed on 28 December 2023) for the calculation of thermal energy and moisture [19]. In another study, Chen et al. used the co-simulation method, where EnergyPlus (https://energyplus.net/, accessed on 28 December 2023) and CHAMPS-multizone software (Program CHAMPS_BES 1.6.0 beta, https://beesl.syr.edu/research/champs-in-building-envelope-systems-champs-bes/, accessed on 28 December 2023) were used together to assess indoor air quality [18]. The co-simulation method was especially useful in analyzing the interaction between IAQ and energy efficiency measures. Another simulation method that became increasingly popular during the pandemic to test viral transmission and was used for similar purposes of studying the inter-relationships between IAQ and energy efficiency is Computational Fluid Dynamics (CFD). CFD is used to create a mesh-based model that could simulate air movement and velocity and report temperature [20]. Yet, another angle of simulation use is shown in the work of Heibati et al. [21]. The authors used the CONTAM software and EnergyPlus to examine the impact of airtightness on the indoor air quality and energy performance of a three-story building [21]. Other researchers also used the CONTAM software to model air leakages and assess the influential extent of such leakages within a given space [22,23].
This brings us to the third reason why using two software programs for IAQ and energy efficiency (EE) is a common practice, which relates to increasing the validity of the results [18]. Using two technically compatible and methodologically coherent software can often reach satisfactory results in accuracy, testing, and validation. However, it is not without its drawbacks. The use of multiple software programs means that it requires high technical integration and compatibility. Further, it would mean a longer simulation time to obtain accurate results. Moreover, software accessibility is an important yet unacknowledged reason that leads researchers to select one type of simulation software over the other. Thus, selecting the appropriate simulation tool while debating the pros and cons of each to best match the research objectives is critical.
1.2.2. Weather and Context
Adding to the study’s realism is the importance of contextualization. The study of indoor air quality and energy efficiency does not automatically rule out contextual climatic conditions. Outside weather conditions directly influence the air quality inside the built environment, impacting the HVAC energy loads. Highlighting the importance of weatherization, Underhill et al. investigate the effects of weather on ventilation, energy consumption, and IAQ in multifamily housing in Boston by simulating the scenarios on CONTAM and EnergyPlus software programs [17]. The study emphasizes the need to balance energy savings while simultaneously maintaining good IAQ, especially in the presence of strong pollutants. In another example, Kim and Choi studied the impact of increased atmospheric carbon dioxide (CO2) concentrations on building ventilation and energy consumption [24]. Their findings indicated that higher CO2 levels require increased outdoor air flow rates to maintain IAQ, affecting building energy loads. This suggests that it is essential to consider ambient air conditions when analyzing IAQ and the energy efficiency of ventilation systems.
1.2.3. Time Dimension
The selected method is also a function of time. Predictability models and methods are another critical element in the reviewed literature, indicating a futuristic time set based on real-time data. One way to do so is shown in the work of Zhang et al. [25]. The authors analyze IAQ parameters in a laboratory setting by using multiple linear regression (MLR), time series regression (TSR), and artificial neural network (ANN) models [25]. In another algorithmic method, Berouine et al. proposed a generalized predictive control algorithm based on a controlled auto-regressive integrated moving average to control standalone ventilation systems [26]. The algorithm effectively improved indoor air quality and energy consumption in energy-efficient buildings. Similarly, using advanced methods of investigation, Ibrahim et al. studied the feasibility and accuracy of using machine learning methods to estimate building energy consumption [27]. Their study demonstrated the potential of machine learning in accurately predicting heating and cooling loads for residential buildings. We can deduce that the intersecting fields of IAQ and energy efficiency have a broad potential for future exploration by using advanced tools, artificial intelligence, and machine learning methods for precise predictions and simulation.
1.2.4. Energy Savings
Research examining the energy efficiency of HVAC systems using simulation software reveals a direct correlation with fiscal savings. Scholarly literature explores this relationship from multiple angles, highlighting its significance for different building typologies. For instance, studies demonstrate the potential for substantial savings in educational institutions through optimized HVAC operation. Jidal et al. studied HVAC energy savings without undermining user comfort [28]. This, among other studies, emphasizes the impact of energy fuel usage on occupant comfort, underscoring the importance of efficient HVAC systems in maintaining a conducive indoor environment [28,29,30]. Further, researchers are examining the potential effects of energy-efficient models on mechanical ventilation, particularly in terms of cooling and heating systems, with a focus on real-time monitoring to enhance performance and reduce operational costs [31,32,33]. What we take away from articles studying mechanical ventilation systems in light of optimized user comfort and air quality parameters is the significant fiscal savings, benefiting both building owners and occupants alike.
1.2.5. Scaling Up Simulation Case Studies
The literature also provides abundant simulation studies that experiment and examine this topic at different scales. Such investigative studies on air quality and energy loads are not restricted to a building unit, but there are examples of simulating cities. Hong et al. and Todeschi et al. found means to predict energy consumption at the city scale. Todeschi et al. compared machine learning and GIS-based engineering models for predicting building energy consumption at the urban scale in Switzerland, where the case study is located [34]. The study demonstrated the precision of these models in predicting energy use for residential buildings built in different construction periods. Further, Hong et al. presented ten questions about urban building energy modeling (UBEM) and discussed their applications [35]. UBEM tools were highlighted as essential for quantifying building energy performance and providing insights for urban energy planning. Such studies highlight that scale is a determining factor in selecting an appropriate tool for simulation relevant to the project resources and expected outcomes.
1.3. Practicalities of Modeling a Classroom
On the other end of the scale spectrum, several studies aim to assess the interlinkages between air quality measures and their impact on energy efficiency on a classroom scale. A common concern is rising CO2 levels due to high occupancy rates and spending long hours within a confined space [3]. The effect of IAQ contamination within a space raises practical scenarios, especially in schools and universities. Researchers have debated aspects of alarm access and notifications within schools and universities when IAQ contaminates exceed threshold levels [36,37,38,39].
Further, researchers have shown that different ventilation strategies have a significant direct impact on the output of the mechanical ventilation energy, as well as user comfort [28,29,40]. Chitaru et al. conducted a numerical analysis to evaluate the optimal condition of natural ventilation scenarios within one classroom, considering air quality and thermal comfort indicators [40]. What we take away from this study is the importance of paying attention to IAQ parameter levels associated with occupancy and the detailed occupancy and HVAC operation schedules. In another study, Abdel Salam studied 16 mechanically ventilated schools in Doha during the winter season [41]. High indoor CO2 concentration was found in many classrooms, resulting from the classrooms’ high occupancy and the spaces’ poor ventilation. What we take away from the abovementioned studies is that, when modeling a university classroom to study parameters related to ventilation and the energy efficiency of mechanical ventilation systems, it is important to pinpoint the exact attributes of such studied parameters, including but not limited to air tightness, natural ventilation, and the type of HVAC system employed. In another study from Ukraine [42], a selected classroom was chosen as a case study for all school classrooms. The classroom sizes measured 5.90 m long, 6.30 m wide, and 3.30 m high. The volume of each room was 123 m3. Windows were northwest oriented. The study provided interesting insights on how CO2 concentrations can drop by 33.4% solely from ventilation during break hours. We take note of the modeled classroom dimensions and the parameters included as we aim to carry out such considerations further in our simulation of a medium-sized university classroom.
1.4. Research Gap and Contribution
The study of mechanical ventilation energy while holding constant levels of healthy indoor air—with fresh air percentages as advocated post-COVID—within university classrooms presents a compelling avenue for investigation. As a research gap, we observe the impact of occupancy and class configuration on the total mechanical energy consumption in university classrooms. We need to quantify mechanical ventilation energy consumption when it operates interchangeably with natural ventilation strategies in a classroom. In other words, we seek to diagnose the total mechanical ventilation energy within an idealistic model while accounting for energy savings in reliance on natural ventilation when the outside temperature (°C) conditions are within the thermal comfort range for occupants. The idealized model takes into consideration the number of occupants within the space, as well as the classroom configuration. Specifically, focusing on medium-sized classrooms in an arid environment, based on those found at the American University in Cairo, Egypt, offers a contextual reference point for sustainably understanding the complexities of operating educational facilities. By simulating a case for a classroom and tracking the effects of varying occupancy levels and classroom configuration on total mechanical energy usage, this research seeks to provide valuable insights into optimizing energy consumption while ensuring healthy indoor environments for students and educators.
Further, this research holds significant relevance to the management practices of facilities. Limited practical tools are available for university college facility managers to predict the annual mechanical ventilation energy based on the classes’ spatial configuration and occupancy. While prior studies have explored indoor air quality parameters and the efficiency of ventilation strategies independently, there is a noticeable lack of simplified models that cater to both dimensions. We seek to generate a simplified equation—a tool—that can serve this purpose. However, we acknowledge the research’s limited scope in addressing a medium-sized classroom model and that it does not consider occupant behavior, window characteristics, and non-scheduled natural ventilation conditions. The main trade-off of our study as well is that the idealistic model is a single-zone classroom that does not interact with other contextual conditions—i.e., modeled in a vacuum.
1.5. Research Objectives
This research aims to develop a simplified predictive equation tool based on simulation outputs of a Grasshopper-based model of a university classroom. The scope of this model is limited to a medium-sized university classroom with non-control variables of classroom height, volume, occupancy, and window location. The response of such selected variables is tested on the annual total mechanical ventilation energy.
The main research questions are as follows: (1) What correlations exist between various parameters related to occupancy and IAQ in a classroom space? (2) How can we optimize energy efficiency in university classrooms? The research in this domain contributes to our comprehension of mechanical energy consumption patterns and informs the development of tools and strategies that promote sustainability and occupant well-being in built environments.
What we have learnt from simulation strategies incorporating elements of IAQ parameters and energy efficiency of mechanical ventilation systems is that a parametric model of a classroom should include various factors to ensure its accuracy. While modeling a case study for a university classroom, it is essential to consider factors such as software selection to meet research objectives, spatial configuration of the exact case study, HVAC schedules, occupancy patterns, weather conditions, arbitrary timeframe for simulation, and other contextual variables. Studies emphasize the significance of these factors in accurately predicting the performance of HVAC systems and their impact on indoor environmental quality to ensure the relevance and reliability of simulation outcomes. Furthermore, the exact scope of our study within the overlapping domains of IAQ and mechanical ventilation energy consumption encompasses the development and validation of simulation models tailored to educational environments. We tackle three main spheres of assessing the mechanical ventilation system’s energy consumption, thermal comfort of occupants, and IAQ parameters. Positioned within this body of literature, our research contributes by proposing a novel methodological framework that integrates simplified modeling techniques to comprehensively analyze the energy efficiency of HVAC systems in a university classroom setting, considering both operational and environmental factors.
Based on this research outcome, facility managers can estimate energy usage and translate it into fiscal values to advise on the best practices for campus facility management operations about balancing healthy indoor air environments and sustainable operations. The novelty of this research lies in developing an editable model using Grasshopper software that considers the characteristics of a university classroom. The dynamic nature of the model, influenced by actual classroom dimensions, occupancy rate, and window location, can generate reasonably accurate assumptions on the annual HVAC energy consumption.
2. Methodology
The methodology encompasses four research stages: (1) a review of recent trends for studying IAQ and energy, (2) selecting parameters and simulation tools based on study objectives, (3) the utilization of the selected simulation tool to capture an actual case of a university classroom, and finally, (4) the formulation of a pertinent equation. The research methodology is illustrated in Figure 1.
2.1. Reviewing Recent Trends for Studying IAQ and Energy
The review tackles recent journal articles, most of which are published post the peak of the pandemic (post-2020) that (1) study different simulation methods for measuring the energy efficiency of natural and mechanical ventilation strategies, (2) identify methods to simulate mechanical ventilation classroom scale, as well as (3) analyze case studies to understand the dynamics of both indoor air quality within a given space and the mechanical ventilation equipment performance.
2.2. Data Modeling and Simulation
A parametric cube—representing a classroom—was built on Grasshopper software. Grasshopper is part of Rhinoceros (Rhino) 3D modeling software programs [43]. The software selection was based on the literature review narratives of researchers conducting similar experiments and meeting research objectives. Grasshopper software uses EnergyPlus software as the primary energy engine. The parametric simplified classroom accommodates several parameters modeled into building blocks. As shown in Figure 2 and Table 1 below, Grasshopper software consists of building blocks. Table 2 shows the details of the variables being modeled. Appendix A shows the visuals of the blocks modeled on Grasshopper.
The simulation model output is the total predicted annual mechanical ventilation energy consumption in kWh, which considers the input parameters. The model considers natural ventilation only when the outdoor temperature allows for it (i.e., 21 to 27 °C in summer and 18 to 24 °C in winter are considered within the thermal comfort zone), based on an embedded weather file, for Cairo, Egypt. The considered mechanical ventilation system is simplified in terms of the modeled classroom design and schedule—refer to Block 01 and 05 in Table 1 below. Moreover, air tightness is represented within the infiltration coefficient set within EnergyPlus programming on Grasshopper software—refer to Block 05 in Table 1. This output not only considers the physical dimensions and characteristics of the space but also factors in the impact of different ventilation strategies on energy demand. By accounting for the nuanced interplay between architectural elements and mechanical systems, the simulation provides valuable insights into optimizing energy-efficient designs for university classrooms. The study parametrizes the variables as shown in Table 2, resulting in a total number of simulations of 160.
It is important to note that some parameters were fixed based on suggested best practices and regulations. This study considered only mechanical ventilation (i.e., natural ventilation strategies in non-scheduled times and hybrid ventilation options were excluded).
2.3. Simplified Predictive Model Generation
The fourth methodological stage is deriving equations, consolidating the relationship between studied variables to derive a simple predictive model for the simulated standard classroom. The simulation equation for the annual mechanical ventilation energy is essential for assessing the energy performance of university classrooms. By integrating parameters such as area, height, occupancy, mechanical ventilation, and window location, the equation enables a simplified understanding of how each of the studied parameters related to the architectural design of the classroom and energy consumption patterns influences the development of optimized designs that prioritize energy efficiency—and optimally occupant comfort—in educational spaces.
2.4. Validation
The fifth methodological stage is to validate the model by testing its sensitivity to estimate the number of occupants based on CO2 concentration limits and CO2 generation rates. Also, by comparing the results of calculated CO2 levels versus the results produced by the predictive equation, we seek to establish the model’s validation. The sensitivity analyses for CO2 levels are based on collected data from February–March 2023, New Cairo, Egypt. The analysis validates the tool’s accuracy in estimating CO2 concentrations and mechanical ventilation requirements.
3. Results and Analysis
3.1. Simulation Results
The simulation results presented in this study are available in a tabular format in Appendix C. The tabular format presents 160 observations (rows). The columns (from left to right) include area, height, ventilation per person, occupancy, window location, and total mechanical ventilation energy. These results were obtained through a manual generation process involving the adjustment of one or more of the above parameters and the type of HVAC system employed. The effect of parameter variations is then reflected in the total mechanical energy output.
3.2. Statistical Analysis
A statistical analysis based on the simulation log was conducted to understand the findings comprehensively. This statistical analysis elucidates the intricate relationships between the key parameters under investigation, shedding light on the impacts of these factors on indoor air quality and energy efficiency in the studied classroom model. The automated statistical analysis was run by JMP software (version 16) [45]. The main method of this statistical analysis was a standard least squares model, which employs regression analysis, analysis of variance, and co-variance [46]. The least squares method is a statistical procedure to find the best fit for a set of data points to enable the generation of an equation that quantifies the relationship between the studied parameters. The method works by minimizing the sum of the offsets or residuals of points from the plotted curve. Thus, in terms of regression analysis, it is used to predict the behavior of dependent variables [47].
3.2.1. Least Fit of Squares Analysis
The 160 data points are well distributed, with a root-mean-squared error (RMSE) of 20.352 and a root-squared (RSq) error of 0.98158—refer to Figure 3 and Table 3. The RMSE is a measure of the model’s accuracy. Our study represents the average difference between the observed and predicted values. This high value of the RSq indicates that the provided estimation of the model is 98.16% accurate and can predict the variability in the response to mechanical ventilation energy with a high degree of confidence. The average value of the total mechanical ventilation energy across all data points is 265.323 kWh. Moreover, the studied effect of parameters shows that the classroom area and the occupancy are the most impactful factors on the mechanical ventilation energy output with a p-value < 0.0001. Nevertheless, neither the height of the window nor its location indicated any significance (refer to Figure 4 below).
3.2.2. Analysis of Variance (ANOVA)
The variance analysis determines the systematic factors versus random factors in a dataset [48]. Therefore, it assesses the overall significance of the model and individual predictors—refer to Table 4. The overall F ratio stands at 1358.56, confirming the model’s robustness. Another indicator that affirms the data points’ coherence is the Model Sum of Squares, which is much higher than the Error Sum of Squares, respectively, at 376,279.4 and 63,373.5.
3.2.3. Parameter Estimates
Parameter estimates, also known as coefficients, are the change in the response associated with a one-unit change in other parameters, where all other parameters are held constant [49,50]. The parameter estimates analysis is summarized in Table 5 below. The intercept of −115.485 represents the estimated value when all predictors are zero. Notably, positive coefficients for area and height indicate a positive association with energy consumption, while the occupancy coefficient suggests a significant positive impact. Conversely, window location, especially on the east side, has a negative coefficient, implying a negative influence. The estimates, accompanied by standard errors and t-ratios, contribute to understanding the magnitude and significance of each predictor’s effect.
3.2.4. Effect Test
Area, height, occupancy, and window location have been individually tested for significance. As noted earlier, in the Least Fit of Squares section, area, height, and occupancy are statistically significant, with values reading, respectively, the following: Prob > F < 0.0001, 0.0326, <0.0001. On the other hand, the window location is not significant—it does not matter if it is on the E, N, S, or W side. Refer to Table 6 for exact values, Figure 5 for leverage plot, and Table 7 for the least square means of window locations.
3.2.5. Simplified Predictive Model Generation
Most importantly, the prediction expression based on the statistical analysis is presented as Equation (1) below. The mathematical equation represents the relationships between the studied parameters identified during the regression analysis.
Equation (1). Prediction Expression:
Window location variables:
- North: 1.740;
- East: 0.837;
- South: −0.453;
- West: −0.449.
3.3. Sensitivity Analysis and Model Validation
To validate the generated equation, we ran additional calculations to test the accuracy of the equation regarding occupancy and CO2 levels, both of which were calculated along with field measurements.
3.3.1. Occupancy and CO2 Concentrations
We estimated the number of occupants based on CO2 concentration limits and CO2 generation rates. An equation from the referenced literature has been utilized to calculate the maximum allowable CO2 concentration and CO2 generation per person, considering outdoor CO2 concentrations [51]—refer to Equation (2). The calculation reflects the number of occupants for a one-hour lecture, assuming that the maximum allowable CO2 concentration is 1000 PPM at steady state, where CO2 generation per person is 0.08 m3/h, and outdoor concentration is 400 ppm.
Equation (2). Indoor Carbon Dioxide Metric Analysis Tool [51]:
where
Q = (Ventilation per area × area) + Infiltration;
Infiltration = ((7/20) × Volume).
Based on the simulation data log, we have produced Figure 6 below. Thus, we can predict the maximum no. of occupants based on volume and area. Moreover, by using the number of occupants depending on the classroom area, mechanical ventilation can be predicted—refer to Figure 7. Therefore, we can predict the maximum number of occupants based on classroom volume and area, subsequently using this information to predict mechanical ventilation requirements.
3.3.2. CO2 Levels
We estimated baseline CO2 levels in the context of the modeled case study, New Cairo, Egypt, based on IAQ-logged data between February and May 2023. The logged data were collected by the placement of an IAQ monitor model, Qingping CGS1, in the selected case study of a university classroom. The monitor logs data in 15 min intervals. The placement of the monitor is shown in Figure 8.
We have analyzed random points to conduct the sensitivity analyses for CO2 levels based on collected data. Based on the data presented in Table 8 and Figure 9, it can be inferred that instances where calculated CO2 concentrations—using Equation (2)—exceed measured values suggest the possibility of open windows, resulting in a reduction in CO2 concentration by an estimated range of 2–22% (hypothetical assumption). Conversely, in situations where calculated CO2 concentrations are lower than measured values, it implies that the ventilation system was not operating at its full capacity. This is indicated by the actual HVAC drawing (refer to Appendix C), which specifies a ventilation rate of 2040 m3/h. This has helped validate the tool’s accuracy in estimating CO2 concentrations and mechanical ventilation requirements. These additions are believed to have enriched the analysis and enhanced the robustness of the findings.
4. Discussion
Exploring total mechanical ventilation energy consumption in light of changing occupancy patterns and classroom configuration provided interesting insights into the design and functionality of learning spaces [3,5,6,17,18,53,54]. The literature review served to contextualize our simulation model when considering the interconnection of parameters that influence healthy air quality and the efficiency of ventilation strategies in university classrooms. The literature provided vital information on the importance of selecting environmental parameters [2,13,17,18,24,55], building and HVAC variables [18], IAQ, ventilation and filtration-related parameters [56,57,58], weather data [27,35,59], and occupant behavior [60,61,62], amongst other considerations to build an accurate model. In addition, we learned why specific types of simulation software programs are used and the complexity involved in balancing trade-offs between all the variables mentioned above [2,13,17,18,26,27,30,35,53,55,63].
Concerning environmental parameters, our model acknowledges the ventilation rates associated with mechanical ventilation systems; however, it does not mimic continuous natural ventilation or hybrid models other than the preset schedule. In the designed Grasshopper-based parametric model, various key parameters were carefully selected and defined to capture total mechanical ventilation energy response in response to the control and non-control variables in the modeled medium-sized university classroom. The non-control parameter group encompasses considerations related to classroom volume, occupancy, and the type of HVAC system. For classroom volume, the area varied within 30 to 150 square meters, reflecting common classroom sizes obtained from available references. It mimics actual medium-sized classrooms at the American University in Cairo, Egypt. The height parameter ranged from 3.5 to 5 m, with intervals of 0.5 m. Occupancy was defined by “Occupant Density”, measured in square meters per person (m2/person), with a range of 0 to 0.5 and intervals of 0.1, adhering to international design standards. HVAC systems were simplified to assume only mechanical systems within the temperature range of with HVAC type labeled as VAC—Split. This denotes “Ventilation and Air-Conditioning (VAC)” systems that are centralized to space and do not factor the heating loads.
On the other hand, a “Split” unit refers to a decentralized type of mechanical ventilation space consisting of two units, an outside compressor and an inside unit, for improving temperature control within a room. The air changes per hour (ACH50) parameter, representing ventilation rates, was set at 7 h−1/person based on ASHRAE 60 guidelines. The HVAC schedule was conditioned to allow for natural ventilation only when the outside temperature permits. A range of 21 to 27 °C in summer and 18 to 24 °C in winter has been introduced to account for seasonal temperature variations. If the outside temperature falls within the following ranges, then HVAC stops and the classroom relies on natural ventilation. With regard to the opening of windows, or in model terms “Opening-to-Wall Ratio”, it was defined as the square root of the classroom area.
Moreover, within the control variable embedded in this model are CO2 and total volatile organic compounds (tVOCs), which are modeled in association with the number of occupants in the classroom at each scenario for simulation. This is yet another factor of limitation, as the model does not account for tVOC emissions of materials or outside conditions.
On the other hand, the model was more successful with respect to the physical attributes of a medium-sized classroom and mechanical ventilation energy parameters. Relying on the software model’s built-in schedules that correlate with the weather file enabled a more accurate prediction of the total annual mechanical energy. In total, 160 simulations were conducted, systematically exploring the defined parameter ranges to comprehensively analyze their impact and response with respect to the total annual mechanical ventilation energy.
The mean average kwh per year of the total mechanical ventilation energy of the modeled classroom was given at >265 kwh. It is acknowledged at the low end of the spectrum as a highly idealized model. Costa et al. estimated that the average energy consumption indicators corresponded to 58 kWh/m2 per year at the Polytechnic School and 40 kWh/m2 per year at the Faculty of Architecture of a university building in a tropical environment [64]. By far, our estimation is much lower (260 kwh divided by 30–150 m2), which may be related to the difference in weatherization and the use of natural ventilation when the outside conditions allow for it. Other reviews do not estimate HVAC energy annually per classroom, and other relevant publications are of a different context. This calls for a further assessment of the output results to diagnose the HVAC consumption seasonally to understand the dynamics. Further research work to better estimate the model’s sensitivity and impact of changing ventilation strategies, such as different air tightness coefficients, natural ventilation strategies, and various HVAC configurations, on mechanical energy consumption within educational settings is needed. In future modeling cases, researchers can build on this model by analyzing in more detail the sensitivity of the mechanical ventilation system’s fan efficiency by exploring variations in fan efficiency presets to demonstrate the potential range of energy consumption. Simulations with different fan efficiencies can help illustrate the linear correlation between fan efficiency and energy consumption, which could be utilized in future research directions to determine energy-saving measures.
Moreover, the proposed parametric model opens further conversation on incorporating occupant behavior in interaction with HVAC systems and window openings. This presents itself as a topic for future research that would add a layer of realism and widen the scope of research to better align with the dynamic nature of indoor environments. The choice of simulation software is a factor that answers to the complexity of the investigation of balancing trade-offs between computing energy efficiency and indoor air quality.
While the model was simplified on several fronts, understanding the interrelationships between parameters is a fundamental step. The literature advised combining several software programs, such as CONTAM and EnergyPlus, for more accurate results [18,21,30]. The next step for this research, thus, would be to test the generated equation on mechanical ventilation systems in the context of IAQ contaminants to optimize further for acceptable air quality and thermal comfort. Hence, it is safe to say that the generated equation of this Grasshopper-based parametric model for classrooms is essential for understanding associated factors of occupancy, mechanical ventilation energy, and physical attributes of the classroom on the annual mechanical ventilation energy consumption. The generated equation is a starting point to connect with a broader discourse on the intricate relationships between environmental parameters and indoor environmental quality.
5. Conclusions
Facility managers, designers, and campus operations can leverage this proposed model to estimate the impact of varying occupancy levels on total mechanical ventilation energy consumption in university classrooms. This allows for informed decision-making in facility management, enabling proactive adjustments to optimize energy efficiency and resource allocation based on real-time occupancy dynamics, ultimately fostering sustainable and cost-effective campus operations. In other words, our study aims to provide actionable insights for optimizing the mechanical ventilation energy’s performance and translate such savings into substantial cost savings while maintaining a healthy indoor environment conducive to learning. Simulating realistic conditions is among the perceived challenges and limitations in studying energy efficiency and energy losses in classrooms. Many attributes are difficult to replicate, such as occupants’ behavior, varying pollutant concentrations, and power cuts representing zero kWh of HVAC operations. On the other hand, there are potential solutions and advancements in software tools, equations, and theories that could be used to compensate for the calculator assumptions in future versions. There is a vast set of recommendations for future research direction and areas of focus related to maintaining healthy indoor air quality while optimizing for energy efficiency.
To start with, the response on mechanical ventilation energy consumption can be tested while exploring high purification and filtration systems—such as the MERV rating (13 or greater)—and high-efficiency particulate air (HEPA). Another way to improve the model’s accuracy is integrating real-time air quality monitoring data to draw further associations between efficiency and the extent of air quality within the classroom space. A third possibility is to conduct field tests in the classroom space. IAQ recommendations result in a trade-off between an improved air quality environment and energy efficiency.
Author Contributions
Conceptualization, F.S., S.G. and R.R.; methodology, F.S. and S.G.; software, R.R.; investigation, F.S.; resources, F.S. and R.R.; data curation, F.S. and R.R.; writing—original draft preparation, F.S.; writing—review and editing, F.S. and S.G.; supervision, S.G. and K.T.; project administration, F.S. and S.G.; funding acquisition, S.G. and K.T. All authors have read and agreed to the published version of the manuscript.
Funding
The research received the Graduate Support Grant Award|PHD Research Grant (R45), from the American University in Cairo.
Institutional Review Board Statement
This research has received the Institutional Review Board (IRB) approval letter (Case # 2023-2024-003).
Informed Consent Statement
Not applicable.
Data Availability Statement
Data are available upon request from the first author provided justifiable reasons for use.
Acknowledgments
We would like to sincerely thank the Department of Architecture at the American University in Cairo (AUC) for their support of this project. Special thanks to the Engaged Sustainable Futures’ research team for maintaining a high rigor of research stamina and encouraging fellow peers in their research efforts. The authors would also like to thank the Facility Management team at AUC, and the security team who assisted in ensuring the safety of users and equipment. The authors would also like to thank the Office of the Dean of Graduate Studies for the financial support of this work.
Conflicts of Interest
The authors declare no conflicts of interest.
Appendix A. Parametric Model on Grasshopper
Figure A1.
Parametric model on Grasshopper.
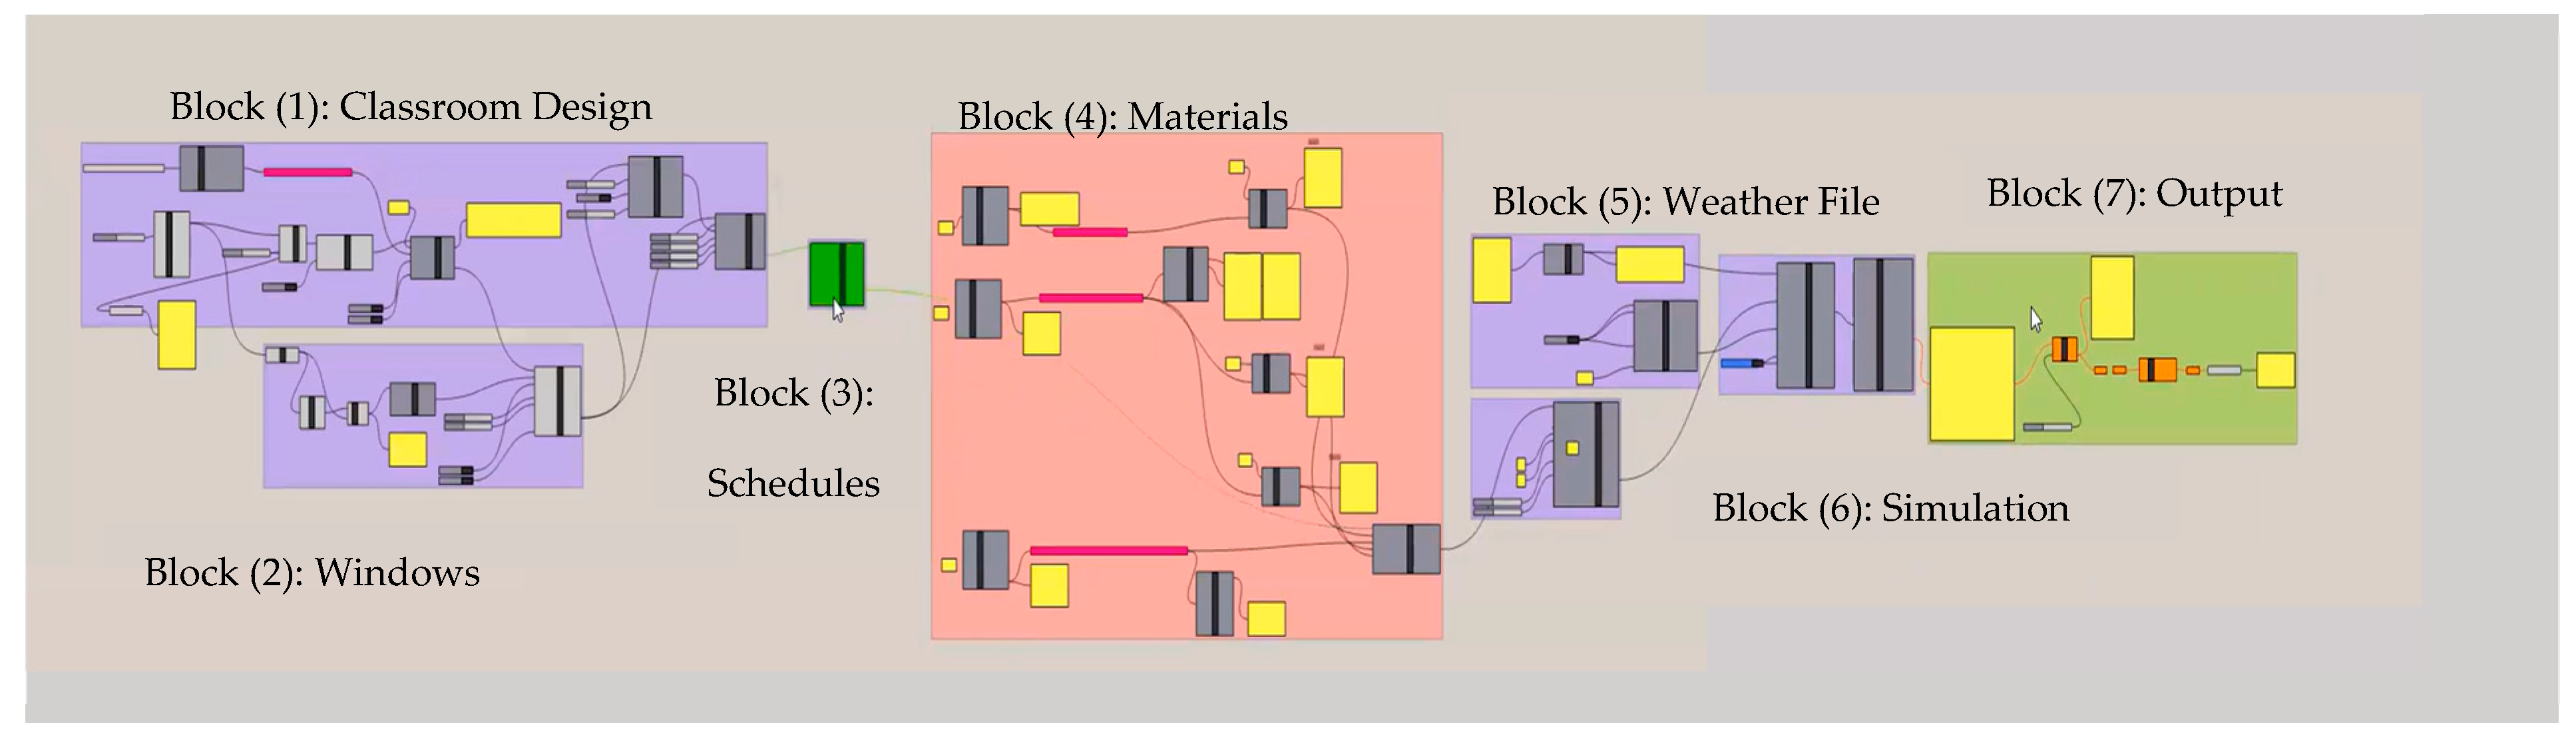
Figure A2.
Grasshopper model Block (1)-A: classroom design.
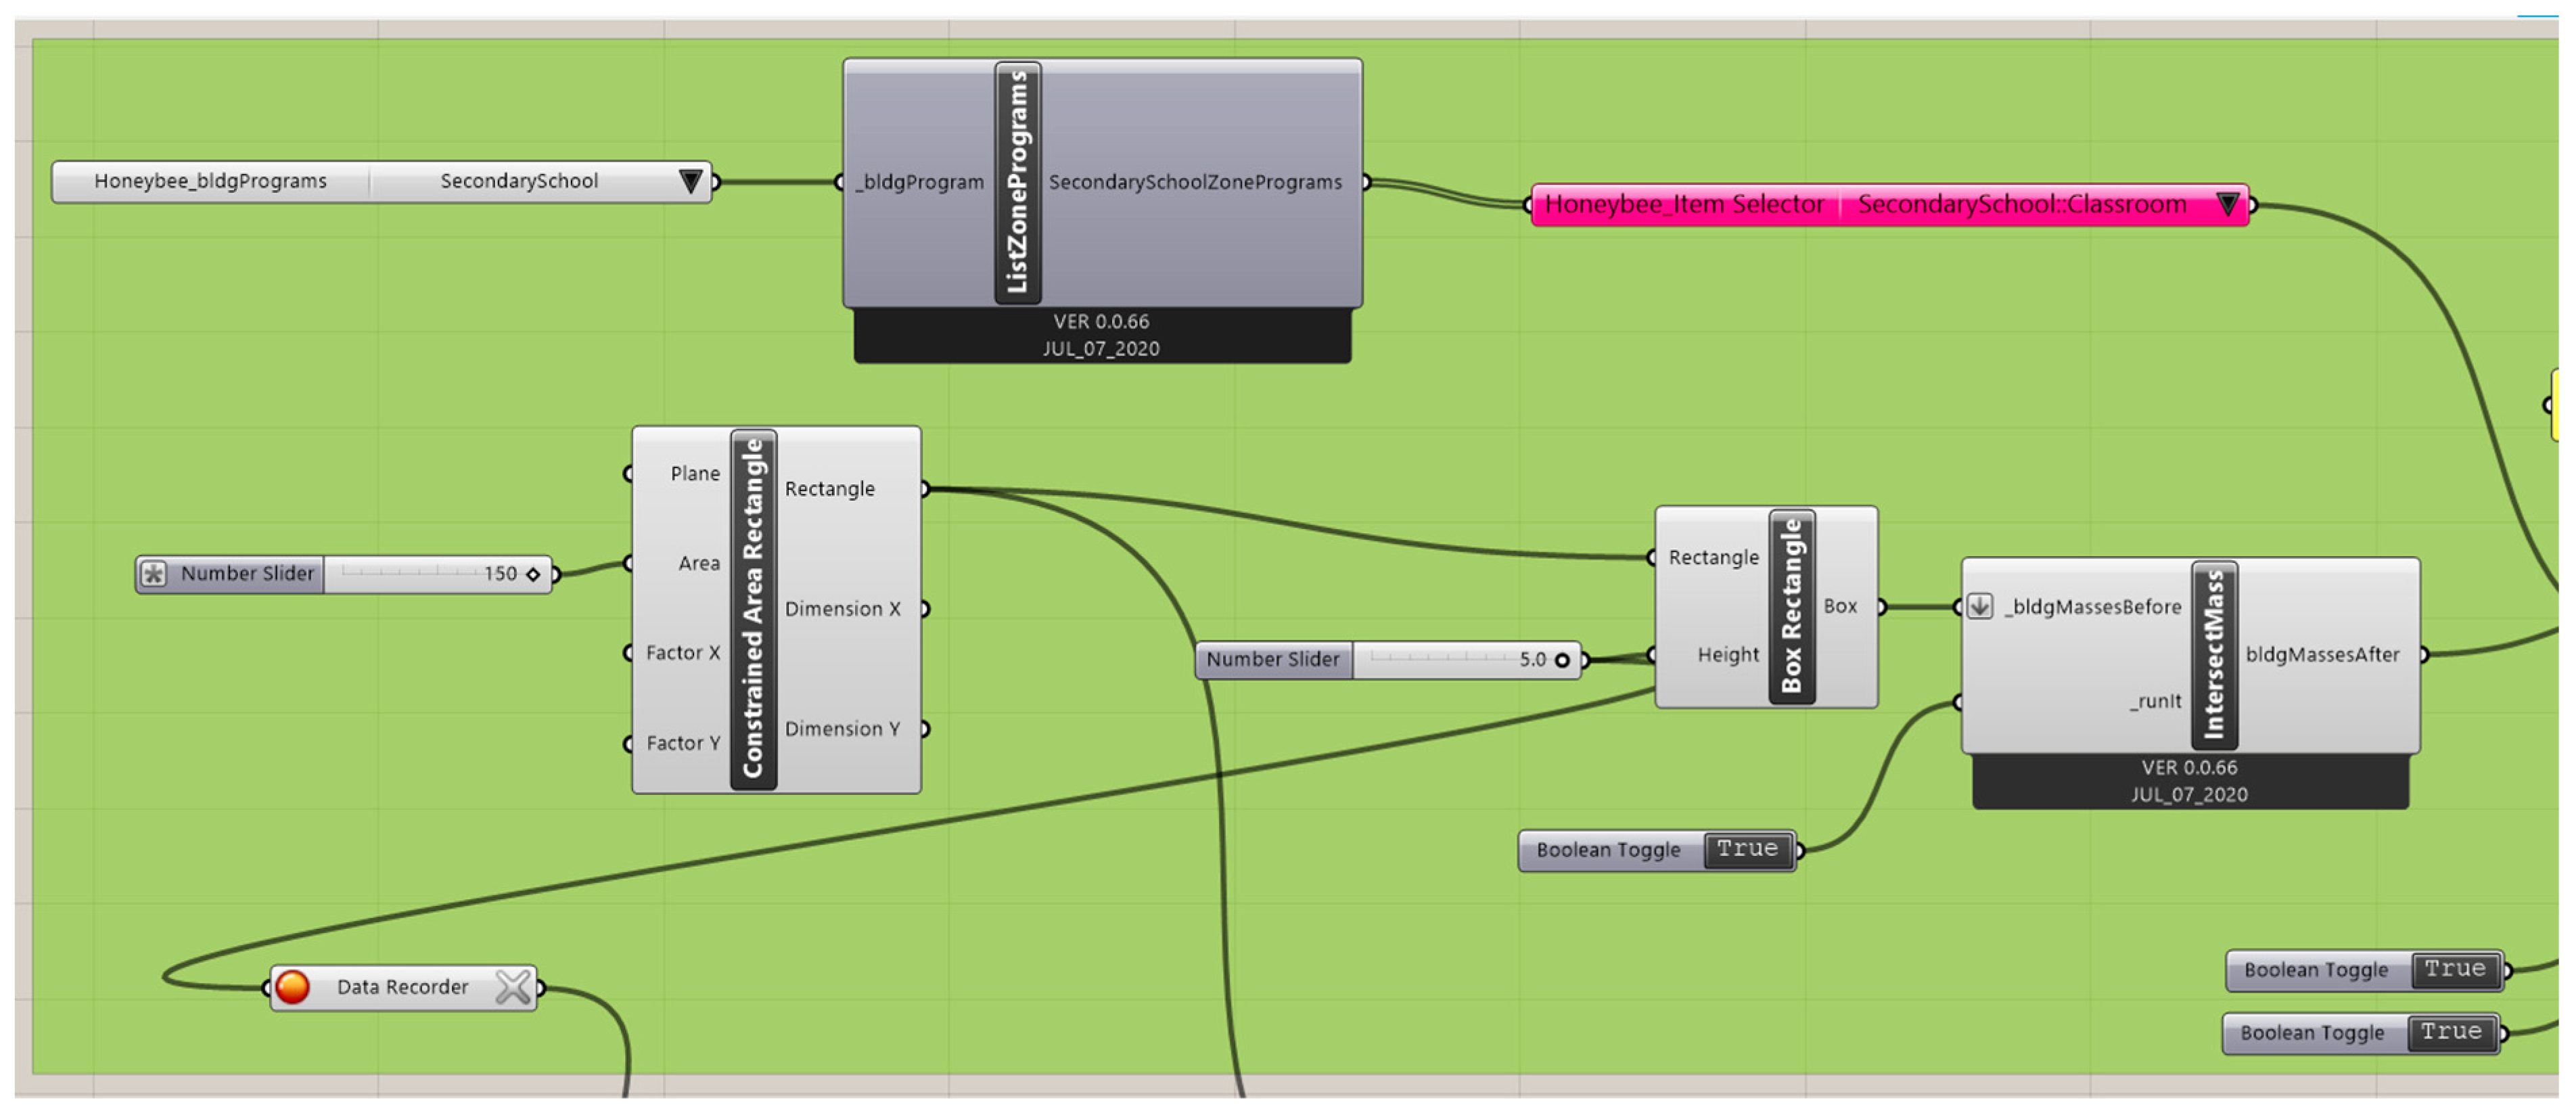
Figure A3.
Grasshopper model Block (1)-B: classroom design.
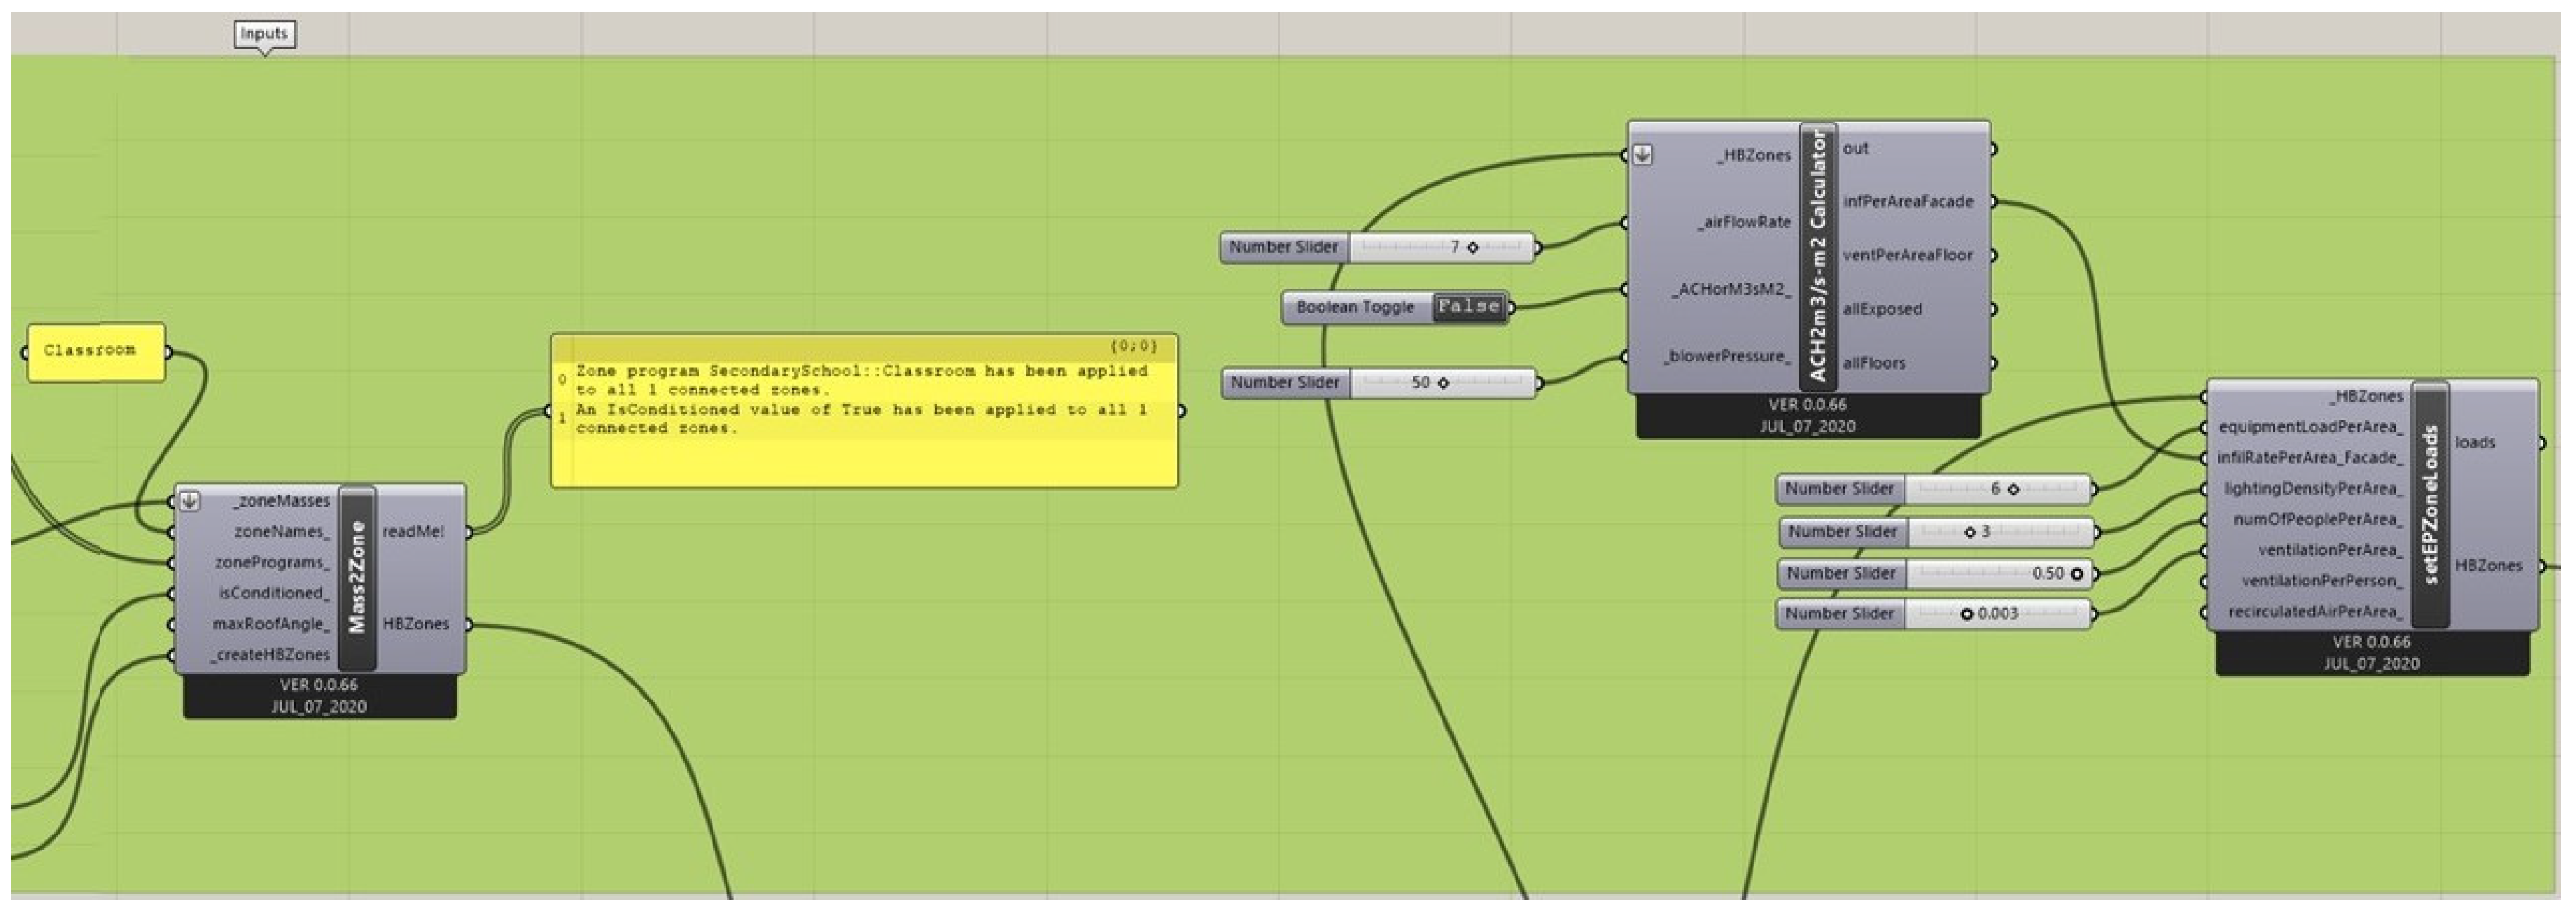
Figure A4.
Grasshopper model Block (2): windows.
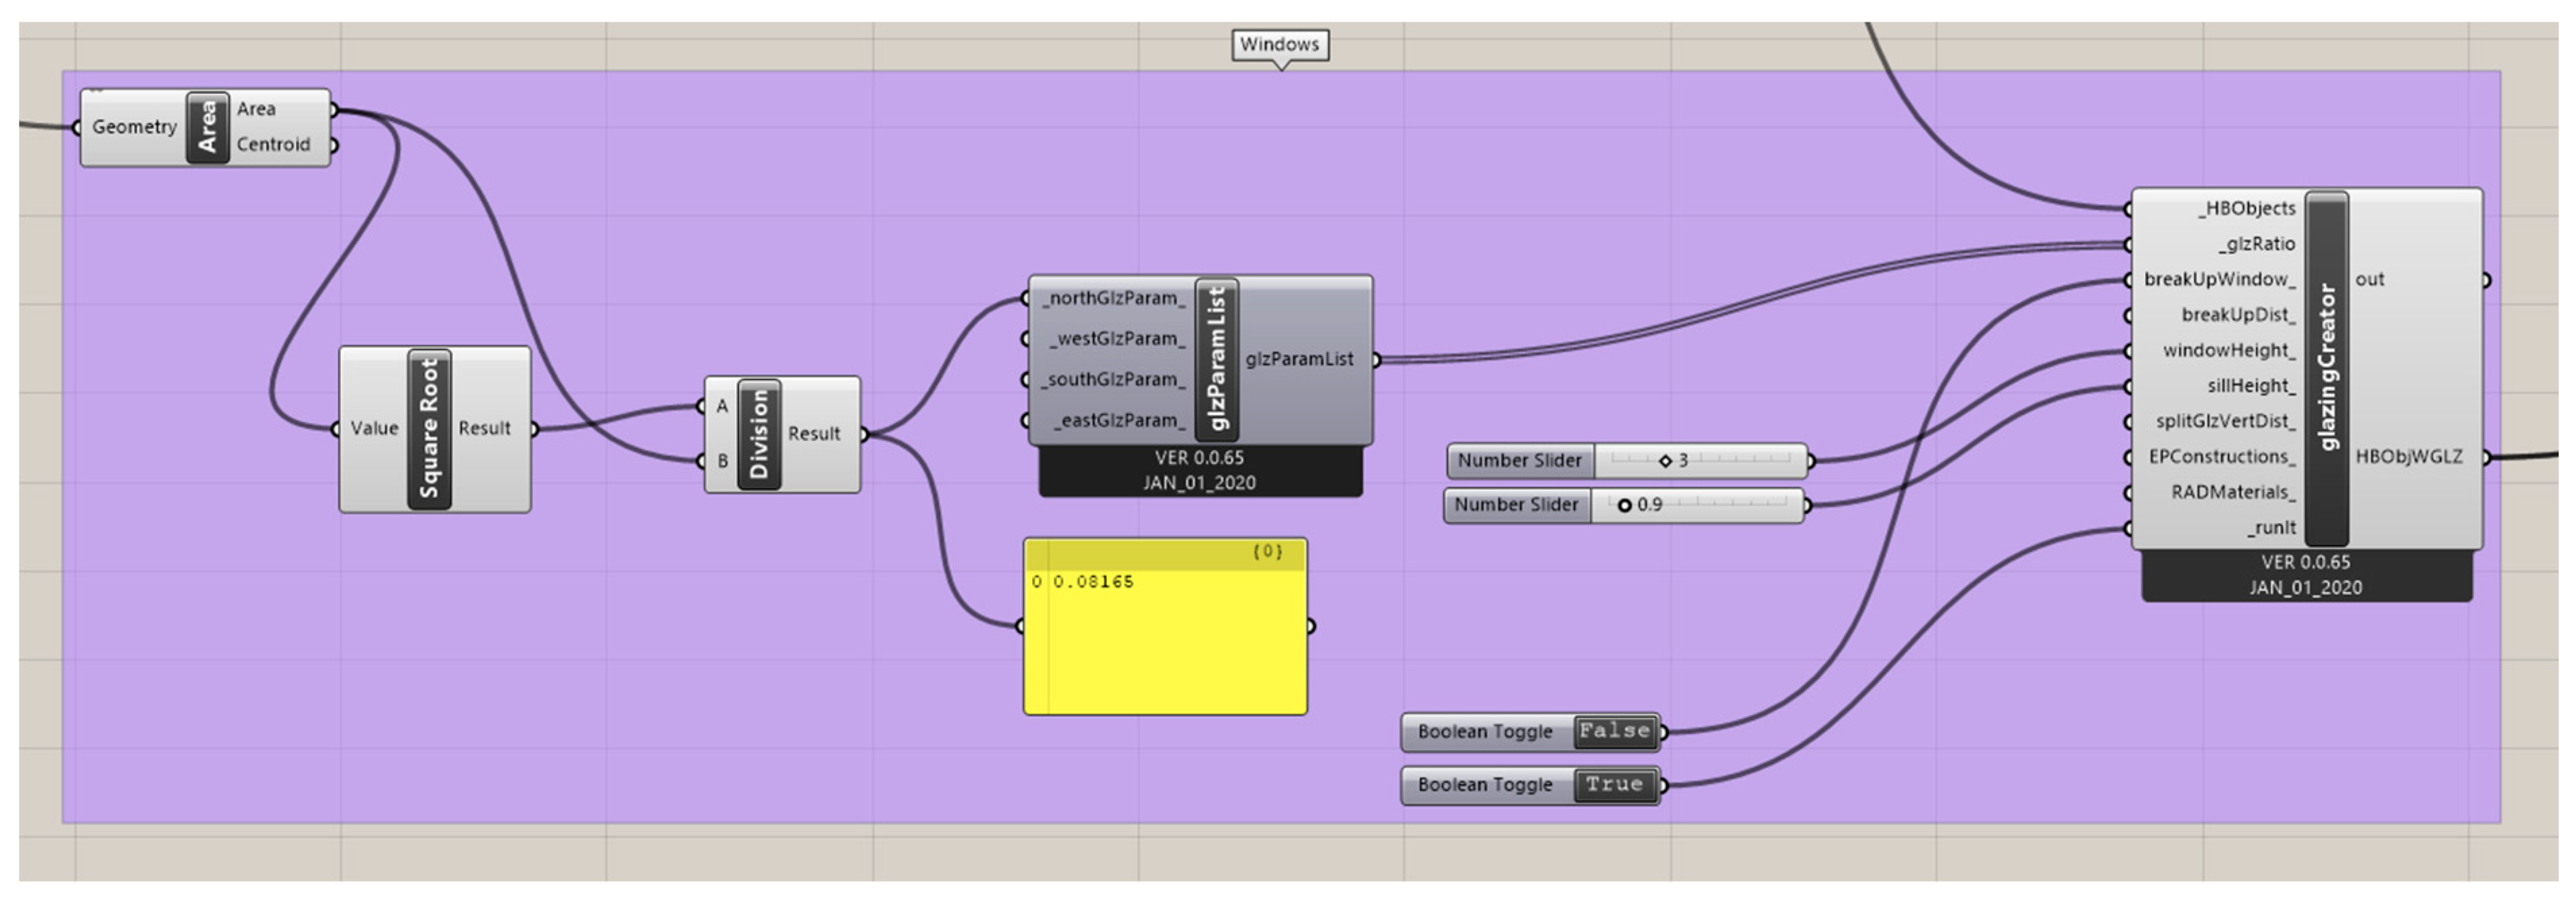
Figure A5.
Grasshopper model Block (3): schedule.
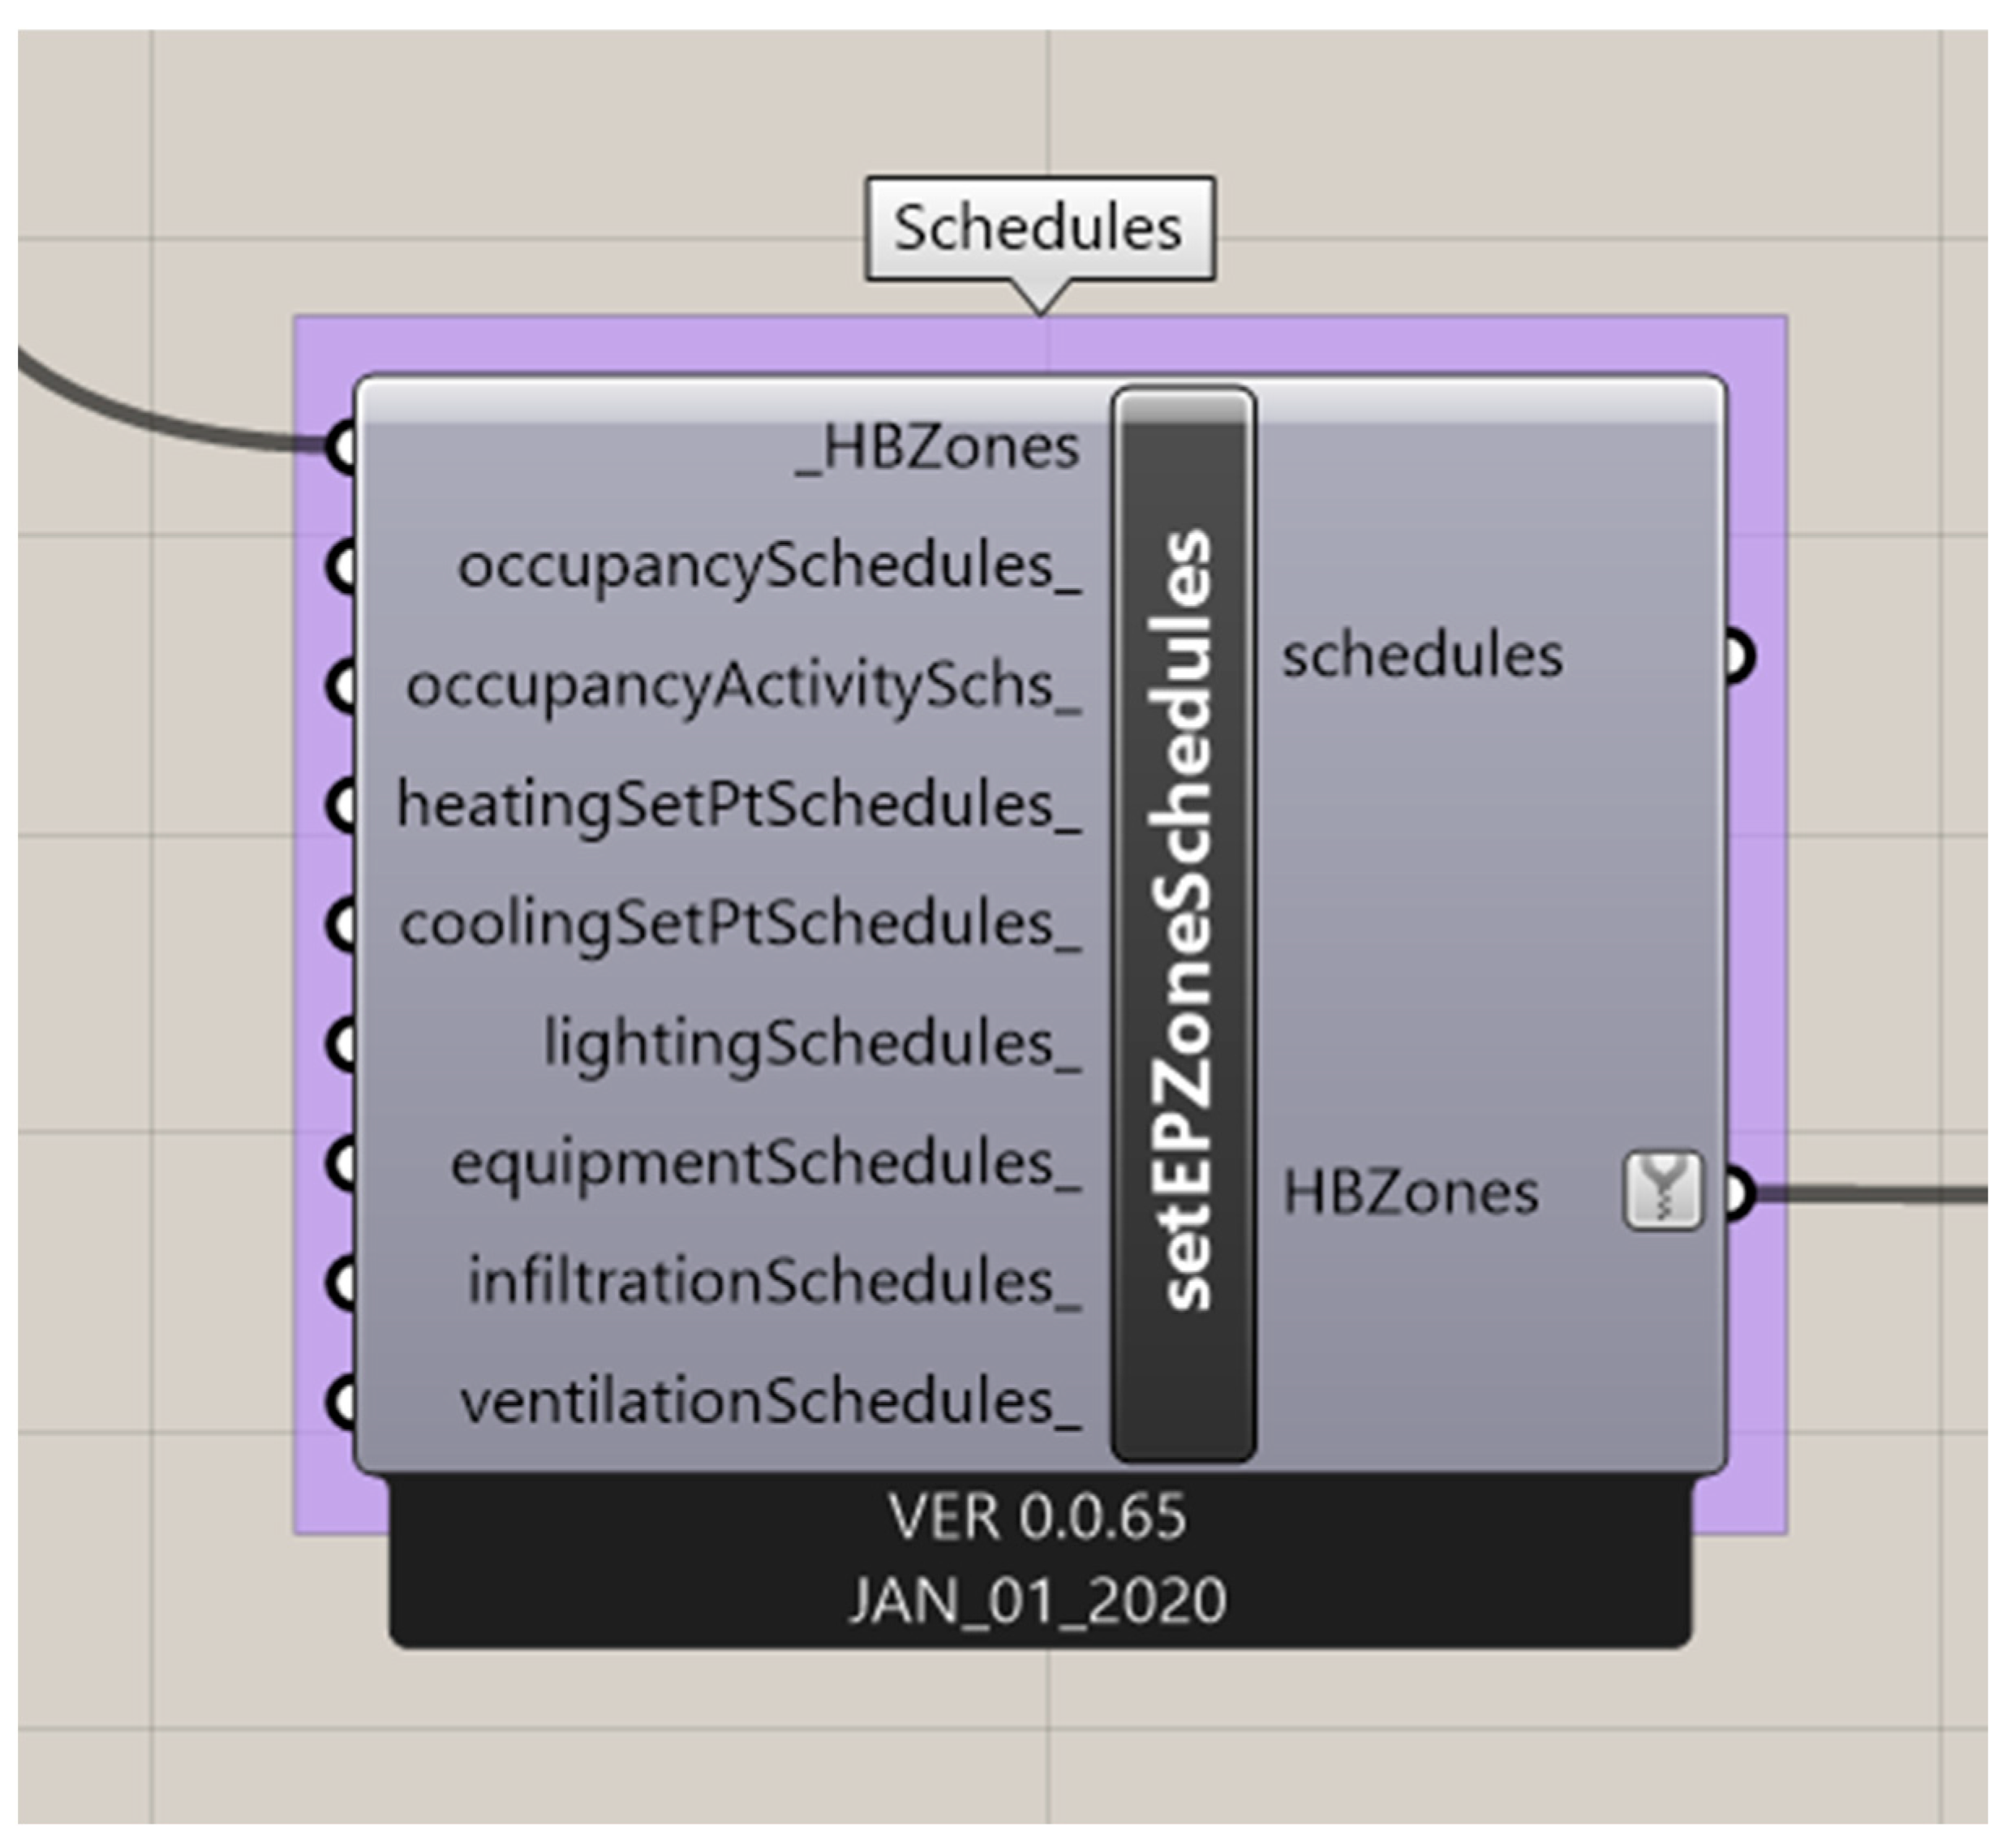
Figure A6.
Grasshopper model Block (4)-A: materials.

Figure A7.
Grasshopper model Block(4)-B: materials.

Figure A8.
Grasshopper model Block (5): weather file.
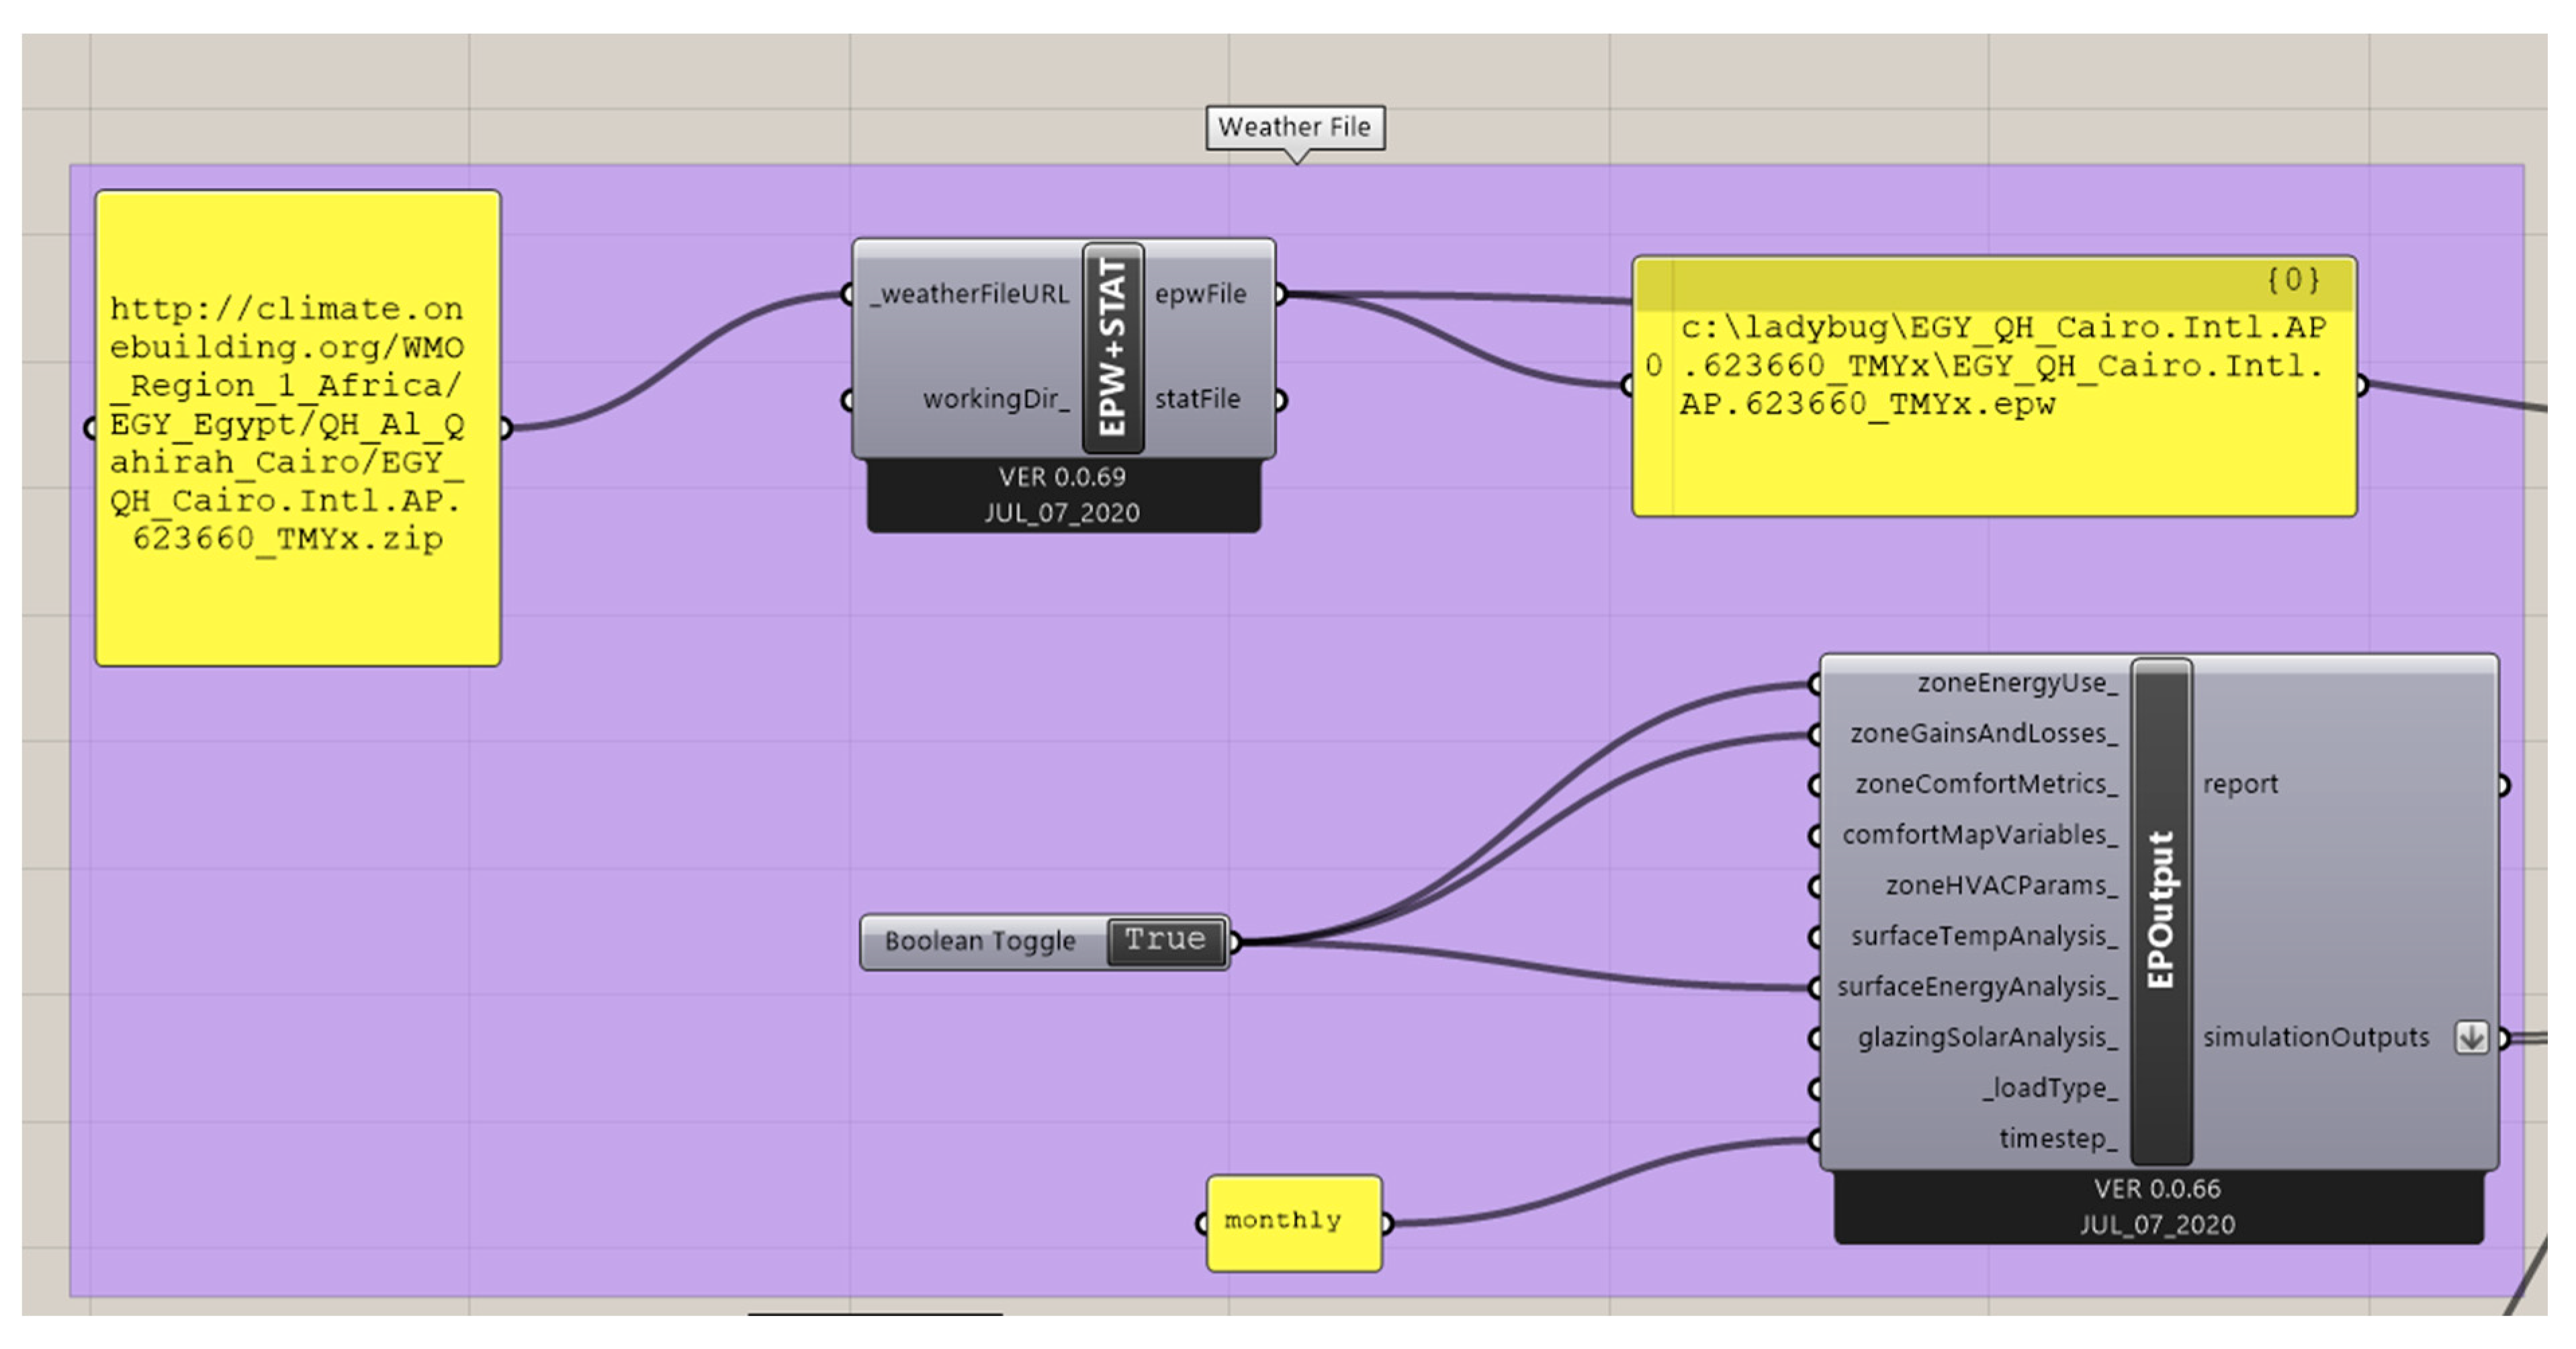
Figure A9.
Grasshopper model Block (6): simulation.

Figure A10.
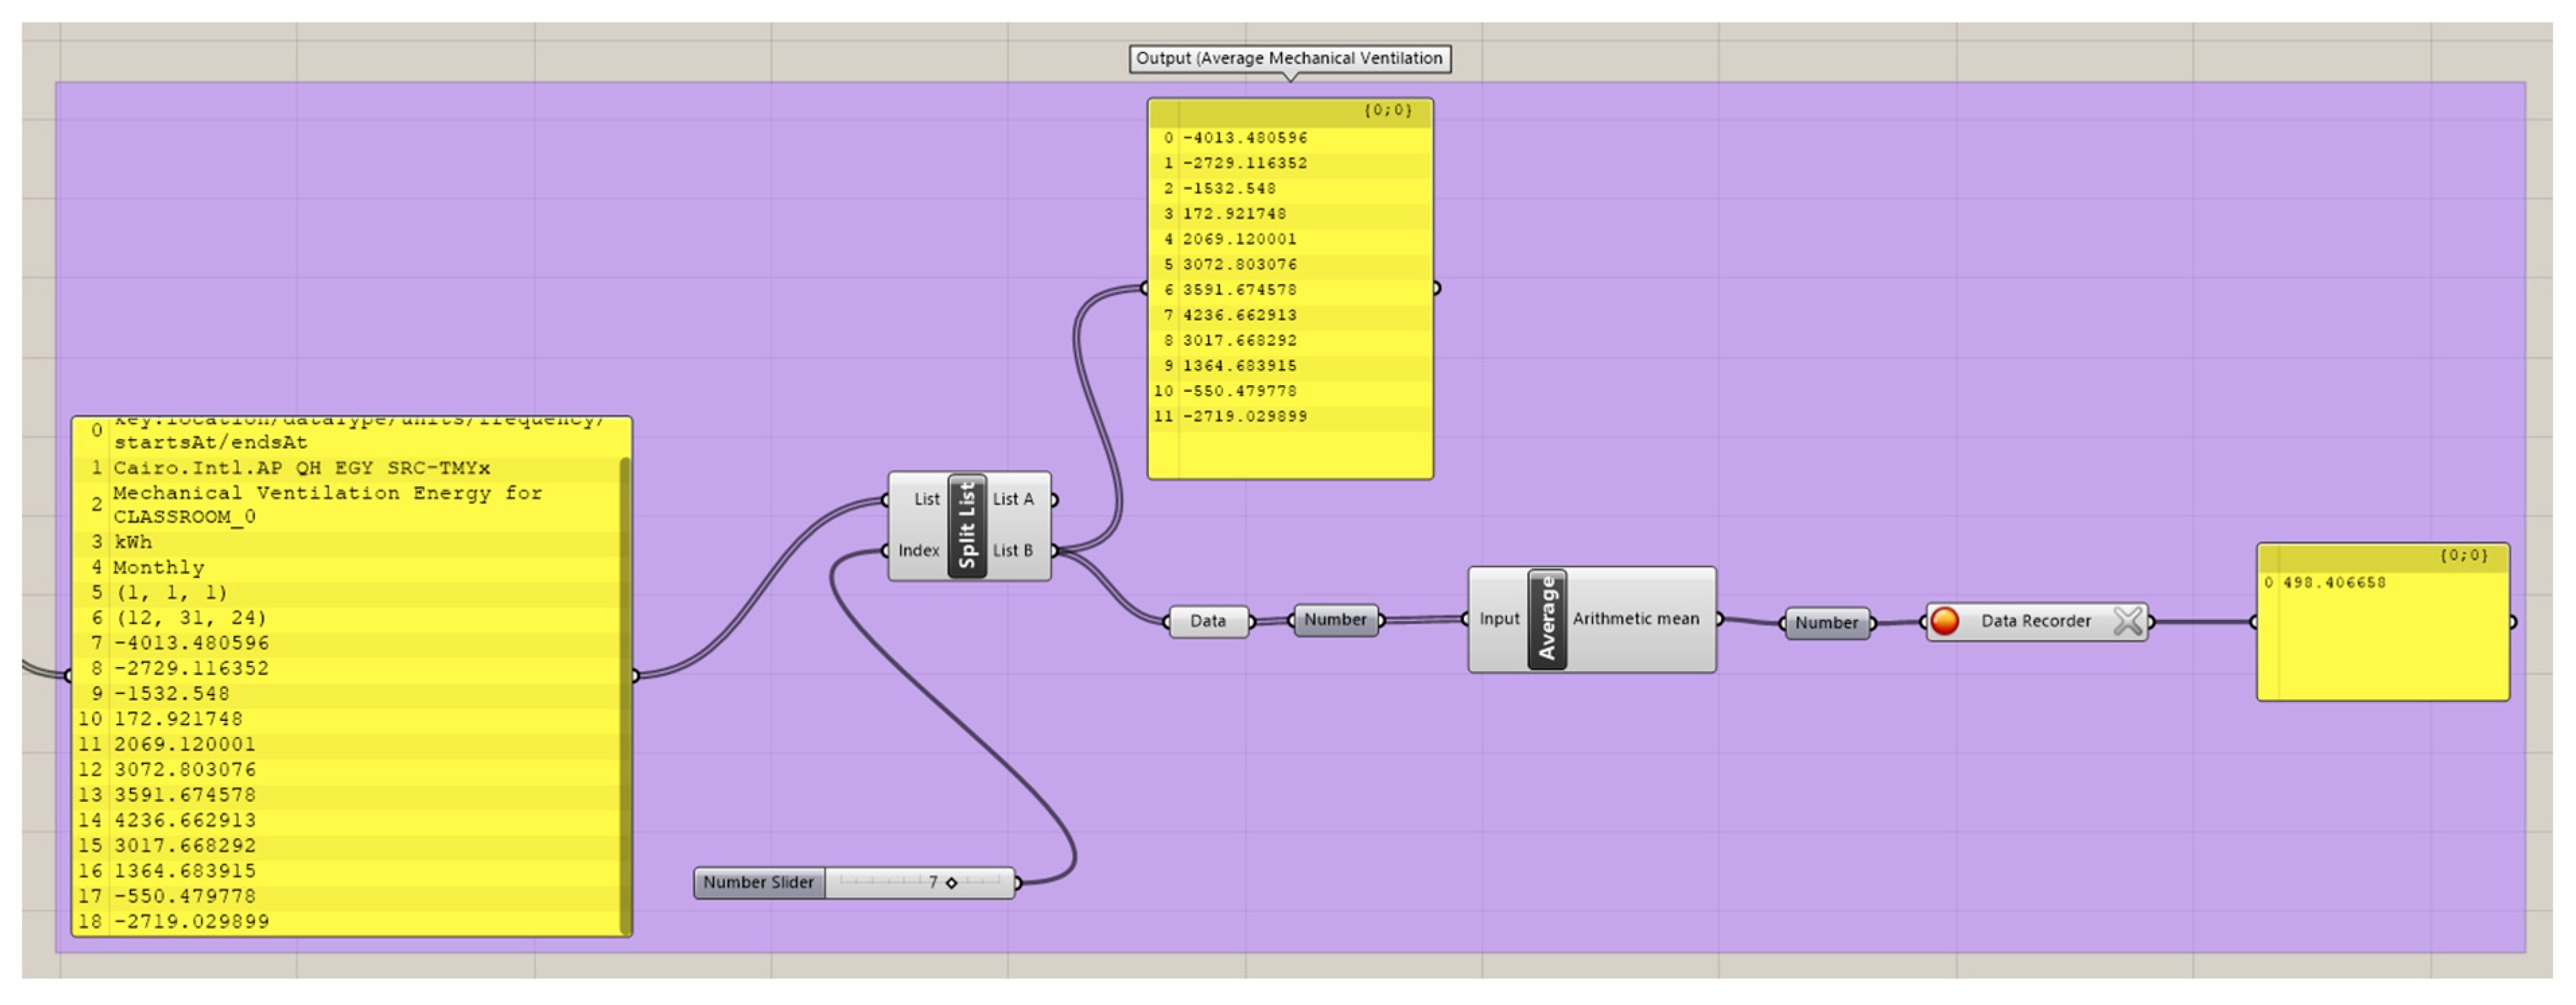
Grasshopper model Block (7): output.
Appendix B. Actual Case Study of an HVAC System
Figure A11.
Medium-sized classroom. Source: School of Sciences and Engineering, the American University in Cairo, Egypt.
Figure A11.
Medium-sized classroom. Source: School of Sciences and Engineering, the American University in Cairo, Egypt.

Appendix C. Simulation Log

Table A1.
Simulation log.
| # | Area (m2) | Height (m) | V (m3) | Glazing | Vent per Area | Occupancy (m2/Person) | Window Location | Mech. Vent. Energy (kWh) | Occupancy (Number) | Ventilation (m3/s) | Infiltration (m3/h) | Ventilation (m3/h) |
|---|---|---|---|---|---|---|---|---|---|---|---|---|
| 1 | 30 | 5 | 150 | 5.48 | 0.003 | 0.5 | N | 99.456375 | 15 | 0.09 | 52.5 | 324.00 |
| 2 | 30 | 3.5 | 105 | 5.48 | 0.003 | 0.5 | N | 99.347542 | 15 | 0.09 | 36.75 | 324.00 |
| 3 | 30 | 4 | 120 | 5.48 | 0.003 | 0.5 | N | 99.380419 | 15 | 0.09 | 42 | 324.00 |
| 4 | 30 | 4.5 | 135 | 5.48 | 0.003 | 0.5 | N | 99.416624 | 15 | 0.09 | 47.25 | 324.00 |
| 5 | 30 | 3.5 | 105 | 5.48 | 0.003 | 0.5 | W | 99.349291 | 15 | 0.09 | 36.75 | 324.00 |
| 6 | 30 | 4 | 120 | 5.48 | 0.003 | 0.5 | W | 99.382889 | 15 | 0.09 | 42 | 324.00 |
| 7 | 30 | 4.5 | 135 | 5.48 | 0.003 | 0.5 | W | 99.418808 | 15 | 0.09 | 47.25 | 324.00 |
| 8 | 30 | 5 | 150 | 5.48 | 0.003 | 0.5 | W | 99.458421 | 15 | 0.09 | 52.5 | 324.00 |
| 9 | 30 | 3.5 | 105 | 5.48 | 0.003 | 0.5 | S | 99.345502 | 15 | 0.09 | 36.75 | 324.00 |
| 10 | 30 | 4 | 120 | 5.48 | 0.003 | 0.5 | S | 99.378382 | 15 | 0.09 | 42 | 324.00 |
| 11 | 30 | 4.5 | 135 | 5.48 | 0.003 | 0.5 | S | 99.414593 | 15 | 0.09 | 47.25 | 324.00 |
| 12 | 30 | 5 | 150 | 5.48 | 0.003 | 0.5 | S | 99.454242 | 15 | 0.09 | 52.5 | 324.00 |
| 13 | 30 | 3.5 | 105 | 5.48 | 0.003 | 0.5 | E | 99.333968 | 15 | 0.09 | 36.75 | 324.00 |
| 14 | 30 | 4 | 120 | 5.48 | 0.003 | 0.5 | E | 99.373617 | 15 | 0.09 | 42 | 324.00 |
| 15 | 30 | 4.5 | 135 | 5.48 | 0.003 | 0.5 | E | 99.409878 | 15 | 0.09 | 47.25 | 324.00 |
| 16 | 30 | 5 | 150 | 5.48 | 0.003 | 0.5 | E | 99.446569 | 15 | 0.09 | 52.5 | 324.00 |
| 17 | 30 | 3.5 | 105 | 5.48 | 0.003 | 0 | E | 55.394252 | 0 | 0.09 | 36.75 | 324.00 |
| 18 | 30 | 3.5 | 105 | 5.48 | 0.003 | 0.1 | E | 64.194788 | 3 | 0.09 | 36.75 | 324.00 |
| 19 | 30 | 3.5 | 105 | 5.48 | 0.003 | 0.2 | E | 72.988097 | 6 | 0.09 | 36.75 | 324.00 |
| 20 | 30 | 3.5 | 105 | 5.48 | 0.003 | 0.3 | E | 81.77624 | 9 | 0.09 | 36.75 | 324.00 |
| 21 | 30 | 3.5 | 105 | 5.48 | 0.003 | 0.4 | E | 90.557812 | 12 | 0.09 | 36.75 | 324.00 |
| 22 | 30 | 3.5 | 105 | 5.48 | 0.003 | 0.5 | E | 99.333968 | 15 | 0.09 | 36.75 | 324.00 |
| 23 | 30 | 4.5 | 135 | 5.48 | 0.003 | 0 | E | 55.39301 | 0 | 0.09 | 47.25 | 324.00 |
| 24 | 30 | 4.5 | 135 | 5.48 | 0.003 | 0.1 | E | 64.206429 | 3 | 0.09 | 47.25 | 324.00 |
| 25 | 30 | 4.5 | 135 | 5.48 | 0.003 | 0.2 | E | 73.014132 | 6 | 0.09 | 47.25 | 324.00 |
| 26 | 30 | 4.5 | 135 | 5.48 | 0.003 | 0.3 | E | 81.817604 | 9 | 0.09 | 47.25 | 324.00 |
| 27 | 30 | 4.5 | 135 | 5.48 | 0.003 | 0.4 | E | 90.616154 | 12 | 0.09 | 47.25 | 324.00 |
| 28 | 30 | 4.5 | 135 | 5.48 | 0.003 | 0.5 | E | 99.409878 | 15 | 0.09 | 47.25 | 324.00 |
| 29 | 30 | 5 | 150 | 5.48 | 0.003 | 0 | E | 55.395737 | 0 | 0.09 | 52.5 | 324.00 |
| 30 | 30 | 5 | 150 | 5.48 | 0.003 | 0.1 | E | 64.215187 | 3 | 0.09 | 52.5 | 324.00 |
| 31 | 30 | 5 | 150 | 5.48 | 0.003 | 0.2 | E | 73.030106 | 6 | 0.09 | 52.5 | 324.00 |
| 32 | 30 | 5 | 150 | 5.48 | 0.003 | 0.3 | E | 81.839603 | 9 | 0.09 | 52.5 | 324.00 |
| 33 | 30 | 5 | 150 | 5.48 | 0.003 | 0.4 | E | 90.645351 | 12 | 0.09 | 52.5 | 324.00 |
| 34 | 30 | 5 | 150 | 5.48 | 0.003 | 0.5 | E | 99.446569 | 15 | 0.09 | 52.5 | 324.00 |
| 35 | 50 | 5 | 250 | 7.07 | 0.003 | 0.5 | N | 165.935582 | 25 | 0.15 | 87.5 | 540.00 |
| 36 | 50 | 3.5 | 175 | 7.07 | 0.003 | 0.5 | N | 165.706857 | 25 | 0.15 | 61.25 | 540.00 |
| 37 | 50 | 4 | 200 | 7.07 | 0.003 | 0.5 | N | 165.780357 | 25 | 0.15 | 70 | 540.00 |
| 38 | 50 | 4.5 | 225 | 7.07 | 0.003 | 0.5 | N | 165.854101 | 25 | 0.15 | 78.75 | 540.00 |
| 39 | 50 | 3.5 | 175 | 7.07 | 0.003 | 0.5 | W | 165.708247 | 25 | 0.15 | 61.25 | 540.00 |
| 40 | 50 | 4 | 200 | 7.07 | 0.003 | 0.5 | W | 165.781952 | 25 | 0.15 | 70 | 540.00 |
| 41 | 50 | 4.5 | 225 | 7.07 | 0.003 | 0.5 | W | 165.855924 | 25 | 0.15 | 78.75 | 540.00 |
| 42 | 50 | 5 | 250 | 7.07 | 0.003 | 0.5 | W | 165.937674 | 25 | 0.15 | 87.5 | 540.00 |
| 43 | 50 | 3.5 | 175 | 7.07 | 0.003 | 0.5 | S | 165.704227 | 25 | 0.15 | 61.25 | 540.00 |
| 44 | 50 | 4 | 200 | 7.07 | 0.003 | 0.5 | S | 165.776672 | 25 | 0.15 | 70 | 540.00 |
| 45 | 50 | 4.5 | 225 | 7.07 | 0.003 | 0.5 | S | 165.851337 | 25 | 0.15 | 78.75 | 540.00 |
| 46 | 50 | 5 | 250 | 7.07 | 0.003 | 0.5 | S | 165.93283 | 25 | 0.15 | 87.5 | 540.00 |
| 47 | 50 | 3.5 | 175 | 7.07 | 0.003 | 0.5 | E | 165.699277 | 25 | 0.15 | 61.25 | 540.00 |
| 48 | 50 | 4 | 200 | 7.07 | 0.003 | 0.5 | E | 165.776301 | 25 | 0.15 | 70 | 540.00 |
| 49 | 50 | 4.5 | 225 | 7.07 | 0.003 | 0.5 | E | 165.851709 | 25 | 0.15 | 78.75 | 540.00 |
| 50 | 50 | 5 | 250 | 7.07 | 0.003 | 0.5 | E | 165.928939 | 25 | 0.15 | 87.5 | 540.00 |
| 51 | 50 | 3.5 | 175 | 7.07 | 0.003 | 0 | E | 92.523592 | 0 | 0.15 | 61.25 | 540.00 |
| 52 | 50 | 3.5 | 175 | 7.07 | 0.003 | 0.1 | E | 107.184297 | 5 | 0.15 | 61.25 | 540.00 |
| 53 | 50 | 3.5 | 175 | 7.07 | 0.003 | 0.2 | E | 121.829663 | 10 | 0.15 | 61.25 | 540.00 |
| 54 | 50 | 3.5 | 175 | 7.07 | 0.003 | 0.3 | E | 136.465162 | 15 | 0.15 | 61.25 | 540.00 |
| 55 | 50 | 3.5 | 175 | 7.07 | 0.003 | 0.4 | E | 151.088121 | 20 | 0.15 | 61.25 | 540.00 |
| 56 | 50 | 3.5 | 175 | 7.07 | 0.003 | 0.5 | E | 165.699277 | 25 | 0.15 | 61.25 | 540.00 |
| 57 | 50 | 3.5 | 175 | 7.07 | 0.003 | 0 | E | 92.523592 | 0 | 0.15 | 61.25 | 540.00 |
| 58 | 50 | 3.5 | 175 | 7.07 | 0.003 | 0.1 | E | 107.184297 | 5 | 0.15 | 61.25 | 540.00 |
| 59 | 50 | 3.5 | 175 | 7.07 | 0.003 | 0.2 | E | 121.829663 | 10 | 0.15 | 61.25 | 540.00 |
| 60 | 50 | 3.5 | 175 | 7.07 | 0.003 | 0.3 | E | 136.465162 | 15 | 0.15 | 61.25 | 540.00 |
| 61 | 50 | 3.5 | 175 | 7.07 | 0.003 | 0.4 | E | 151.088121 | 20 | 0.15 | 61.25 | 540.00 |
| 62 | 50 | 3.5 | 175 | 7.07 | 0.003 | 0.5 | E | 165.699277 | 25 | 0.15 | 61.25 | 540.00 |
| 63 | 70 | 5 | 350 | 8.37 | 0.003 | 0.5 | N | 232.429805 | 35 | 0.21 | 122.5 | 756.00 |
| 64 | 70 | 3.5 | 245 | 8.37 | 0.003 | 0.5 | N | 232.065867 | 35 | 0.21 | 85.75 | 756.00 |
| 65 | 70 | 4 | 280 | 8.37 | 0.003 | 0.5 | N | 232.185658 | 35 | 0.21 | 98 | 756.00 |
| 66 | 70 | 4.5 | 315 | 8.37 | 0.003 | 0.5 | N | 232.30669 | 35 | 0.21 | 110.25 | 756.00 |
| 67 | 70 | 3.5 | 245 | 8.37 | 0.003 | 0.5 | W | 232.066975 | 35 | 0.21 | 85.75 | 756.00 |
| 68 | 70 | 4 | 280 | 8.37 | 0.003 | 0.5 | W | 232.187003 | 35 | 0.21 | 98 | 756.00 |
| 69 | 70 | 4.5 | 315 | 8.37 | 0.003 | 0.5 | W | 232.306836 | 35 | 0.21 | 110.25 | 756.00 |
| 70 | 70 | 5 | 350 | 8.37 | 0.003 | 0.5 | W | 232.431537 | 35 | 0.21 | 122.5 | 756.00 |
| 71 | 70 | 3.5 | 245 | 8.37 | 0.003 | 0.5 | S | 232.062849 | 35 | 0.21 | 85.75 | 756.00 |
| 72 | 70 | 4 | 280 | 8.37 | 0.003 | 0.5 | S | 232.182547 | 35 | 0.21 | 98 | 756.00 |
| 73 | 70 | 4.5 | 315 | 8.37 | 0.003 | 0.5 | S | 232.30209 | 35 | 0.21 | 110.25 | 756.00 |
| 74 | 70 | 5 | 350 | 8.37 | 0.003 | 0.5 | S | 232.422452 | 35 | 0.21 | 122.5 | 756.00 |
| 75 | 70 | 3.5 | 245 | 8.37 | 0.003 | 0.5 | E | 232.061082 | 35 | 0.21 | 85.75 | 756.00 |
| 76 | 70 | 4 | 280 | 8.37 | 0.003 | 0.5 | E | 232.179658 | 35 | 0.21 | 98 | 756.00 |
| 77 | 70 | 4.5 | 315 | 8.37 | 0.003 | 0.5 | E | 232.30081 | 35 | 0.21 | 110.25 | 756.00 |
| 78 | 70 | 5 | 350 | 8.37 | 0.003 | 0.5 | E | 232.422629 | 35 | 0.21 | 122.5 | 756.00 |
| 79 | 70 | 3.5 | 245 | 8.37 | 0.003 | 0 | E | 129.674876 | 0 | 0.21 | 85.75 | 756.00 |
| 80 | 70 | 3.5 | 245 | 8.37 | 0.003 | 0.1 | E | 150.191721 | 7 | 0.21 | 85.75 | 756.00 |
| 81 | 70 | 3.5 | 245 | 8.37 | 0.003 | 0.2 | E | 170.685195 | 14 | 0.21 | 85.75 | 756.00 |
| 82 | 70 | 3.5 | 245 | 8.37 | 0.003 | 0.3 | E | 191.161827 | 21 | 0.21 | 85.75 | 756.00 |
| 83 | 70 | 3.5 | 245 | 8.37 | 0.003 | 0.4 | E | 211.621263 | 28 | 0.21 | 85.75 | 756.00 |
| 84 | 70 | 3.5 | 245 | 8.37 | 0.003 | 0.5 | E | 232.061082 | 35 | 0.21 | 85.75 | 756.00 |
| 85 | 110 | 5 | 550 | 10.49 | 0.003 | 0.5 | N | 365.421861 | 55 | 0.33 | 192.5 | 1188.00 |
| 86 | 110 | 3.5 | 385 | 10.49 | 0.003 | 0.5 | N | 364.776239 | 55 | 0.33 | 134.75 | 1188.00 |
| 87 | 110 | 4 | 440 | 10.49 | 0.003 | 0.5 | N | 364.986756 | 55 | 0.33 | 154 | 1188.00 |
| 88 | 110 | 4.5 | 495 | 10.49 | 0.003 | 0.5 | N | 365.203369 | 55 | 0.33 | 173.25 | 1188.00 |
| 89 | 110 | 3.5 | 385 | 10.49 | 0.003 | 0.5 | W | 364.77453 | 55 | 0.33 | 134.75 | 1188.00 |
| 90 | 110 | 4 | 440 | 10.49 | 0.003 | 0.5 | W | 364.991718 | 55 | 0.33 | 154 | 1188.00 |
| 91 | 110 | 4.5 | 495 | 10.49 | 0.003 | 0.5 | W | 365.204406 | 55 | 0.33 | 173.25 | 1188.00 |
| 92 | 110 | 5 | 550 | 10.49 | 0.003 | 0.5 | W | 365.421019 | 55 | 0.33 | 192.5 | 1188.00 |
| 93 | 110 | 3.5 | 385 | 10.49 | 0.003 | 0.5 | S | 364.77031 | 55 | 0.33 | 134.75 | 1188.00 |
| 94 | 110 | 4 | 440 | 10.49 | 0.003 | 0.5 | S | 364.983043 | 55 | 0.33 | 154 | 1188.00 |
| 95 | 110 | 4.5 | 495 | 10.49 | 0.003 | 0.5 | S | 365.199504 | 55 | 0.33 | 173.25 | 1188.00 |
| 96 | 110 | 5 | 550 | 10.49 | 0.003 | 0.5 | S | 365.417884 | 55 | 0.33 | 192.5 | 1188.00 |
| 97 | 110 | 3.5 | 385 | 10.49 | 0.003 | 0.5 | E | 364.771001 | 55 | 0.33 | 134.75 | 1188.00 |
| 98 | 110 | 4 | 440 | 10.49 | 0.003 | 0.5 | E | 364.986002 | 55 | 0.33 | 154 | 1188.00 |
| 99 | 110 | 4.5 | 495 | 10.49 | 0.003 | 0.5 | E | 365.201258 | 55 | 0.33 | 173.25 | 1188.00 |
| 100 | 110 | 5 | 550 | 10.49 | 0.003 | 0.5 | E | 365.416269 | 55 | 0.33 | 192.5 | 1188.00 |
| 101 | 110 | 3.5 | 385 | 10.49 | 0.003 | 0 | E | 204.01407 | 0 | 0.33 | 134.75 | 1188.00 |
| 102 | 110 | 3.5 | 385 | 10.49 | 0.003 | 0.1 | E | 236.234717 | 11 | 0.33 | 134.75 | 1188.00 |
| 103 | 110 | 3.5 | 385 | 10.49 | 0.003 | 0.2 | E | 268.416684 | 22 | 0.33 | 134.75 | 1188.00 |
| 104 | 110 | 3.5 | 385 | 10.49 | 0.003 | 0.3 | E | 300.567908 | 33 | 0.33 | 134.75 | 1188.00 |
| 105 | 110 | 3.5 | 385 | 10.49 | 0.003 | 0.4 | E | 332.685749 | 44 | 0.33 | 134.75 | 1188.00 |
| 106 | 110 | 3.5 | 385 | 10.49 | 0.003 | 0.5 | E | 364.771001 | 55 | 0.33 | 134.75 | 1188.00 |
| 107 | 110 | 4 | 440 | 10.49 | 0.003 | 0 | E | 204.068733 | 0 | 0.33 | 154 | 1188.00 |
| 108 | 110 | 4 | 440 | 10.49 | 0.003 | 0.1 | E | 236.313743 | 11 | 0.33 | 154 | 1188.00 |
| 109 | 110 | 4 | 440 | 10.49 | 0.003 | 0.2 | E | 268.526533 | 22 | 0.33 | 154 | 1188.00 |
| 110 | 110 | 4 | 440 | 10.49 | 0.003 | 0.3 | E | 300.711562 | 33 | 0.33 | 154 | 1188.00 |
| 111 | 110 | 4 | 440 | 10.49 | 0.003 | 0.4 | E | 332.864193 | 44 | 0.33 | 154 | 1188.00 |
| 112 | 110 | 4 | 440 | 10.49 | 0.003 | 0.5 | E | 364.986002 | 55 | 0.33 | 154 | 1188.00 |
| 113 | 130 | 5 | 650 | 11.40 | 0.003 | 0.5 | N | 431.91331 | 65 | 0.39 | 227.5 | 1404.00 |
| 114 | 130 | 3.5 | 455 | 11.40 | 0.003 | 0.5 | N | 431.12554 | 65 | 0.39 | 159.25 | 1404.00 |
| 115 | 130 | 4 | 520 | 11.40 | 0.003 | 0.5 | N | 431.392029 | 65 | 0.39 | 182 | 1404.00 |
| 116 | 130 | 4.5 | 585 | 11.40 | 0.003 | 0.5 | N | 431.65122 | 65 | 0.39 | 204.75 | 1404.00 |
| 117 | 130 | 3.5 | 455 | 11.40 | 0.003 | 0.5 | W | 431.123197 | 65 | 0.39 | 159.25 | 1404.00 |
| 118 | 130 | 4 | 520 | 11.40 | 0.003 | 0.5 | W | 431.387844 | 65 | 0.39 | 182 | 1404.00 |
| 119 | 130 | 4.5 | 585 | 11.40 | 0.003 | 0.5 | W | 431.652072 | 65 | 0.39 | 204.75 | 1404.00 |
| 120 | 130 | 5 | 650 | 11.40 | 0.003 | 0.5 | W | 431.911875 | 65 | 0.39 | 227.5 | 1404.00 |
| 121 | 130 | 3.5 | 455 | 11.40 | 0.003 | 0.5 | S | 431.118957 | 65 | 0.39 | 159.25 | 1404.00 |
| 122 | 130 | 4 | 520 | 11.40 | 0.003 | 0.5 | S | 431.383241 | 65 | 0.39 | 182 | 1404.00 |
| 123 | 130 | 4.5 | 585 | 11.40 | 0.003 | 0.5 | S | 431.647121 | 65 | 0.39 | 204.75 | 1404.00 |
| 124 | 130 | 5 | 650 | 11.40 | 0.003 | 0.5 | S | 431.909052 | 65 | 0.39 | 227.5 | 1404.00 |
| 125 | 130 | 3.5 | 455 | 11.40 | 0.003 | 0.5 | E | 431.120509 | 65 | 0.39 | 159.25 | 1404.00 |
| 126 | 130 | 4 | 520 | 11.40 | 0.003 | 0.5 | E | 431.387716 | 65 | 0.39 | 182 | 1404.00 |
| 127 | 130 | 4.5 | 585 | 11.40 | 0.003 | 0.5 | E | 431.647724 | 65 | 0.39 | 204.75 | 1404.00 |
| 128 | 130 | 5 | 650 | 11.40 | 0.003 | 0.5 | E | 431.9086 | 65 | 0.39 | 227.5 | 1404.00 |
| 129 | 130 | 3.5 | 455 | 11.40 | 0.003 | 0 | E | 241.196055 | 0 | 0.39 | 159.25 | 1404.00 |
| 130 | 130 | 3.5 | 455 | 11.40 | 0.003 | 0.1 | E | 279.263922 | 13 | 0.39 | 159.25 | 1404.00 |
| 131 | 130 | 3.5 | 455 | 11.40 | 0.003 | 0.2 | E | 317.288769 | 26 | 0.39 | 159.25 | 1404.00 |
| 132 | 130 | 3.5 | 455 | 11.40 | 0.003 | 0.3 | E | 355.273763 | 39 | 0.39 | 159.25 | 1404.00 |
| 133 | 130 | 3.5 | 455 | 11.40 | 0.003 | 0.4 | E | 393.217346 | 52 | 0.39 | 159.25 | 1404.00 |
| 134 | 130 | 3.5 | 455 | 11.40 | 0.003 | 0.5 | E | 431.120509 | 65 | 0.39 | 159.25 | 1404.00 |
| 135 | 150 | 5 | 750 | 12.25 | 0.003 | 0.5 | N | 498.406658 | 75 | 0.45 | 262.5 | 1620.00 |
| 136 | 150 | 3.5 | 525 | 12.25 | 0.003 | 0.5 | N | 497.472386 | 75 | 0.45 | 183.75 | 1620.00 |
| 137 | 150 | 4 | 600 | 12.25 | 0.003 | 0.5 | N | 497.781796 | 75 | 0.45 | 210 | 1620.00 |
| 138 | 150 | 4.5 | 675 | 12.25 | 0.003 | 0.5 | N | 498.094218 | 75 | 0.45 | 236.25 | 1620.00 |
| 139 | 150 | 5 | 750 | 12.25 | 0.003 | 0.5 | N | 498.406658 | 75 | 0.45 | 262.5 | 1620.00 |
| 140 | 150 | 3.5 | 525 | 12.25 | 0.003 | 0.5 | N | 497.472386 | 75 | 0.45 | 183.75 | 1620.00 |
| 141 | 150 | 4 | 600 | 12.25 | 0.003 | 0.5 | N | 497.781796 | 75 | 0.45 | 210 | 1620.00 |
| 142 | 150 | 4.5 | 675 | 12.25 | 0.003 | 0.5 | N | 498.094218 | 75 | 0.45 | 236.25 | 1620.00 |
| 143 | 150 | 3.5 | 525 | 12.25 | 0.003 | 0.5 | W | 497.472322 | 75 | 0.45 | 183.75 | 1620.00 |
| 144 | 150 | 4 | 600 | 12.25 | 0.003 | 0.5 | W | 497.782294 | 75 | 0.45 | 210 | 1620.00 |
| 145 | 150 | 4.5 | 675 | 12.25 | 0.003 | 0.5 | W | 498.094864 | 75 | 0.45 | 236.25 | 1620.00 |
| 146 | 150 | 5 | 750 | 12.25 | 0.003 | 0.5 | W | 498.40161 | 75 | 0.45 | 262.5 | 1620.00 |
| 147 | 150 | 3.5 | 525 | 12.25 | 0.003 | 0.5 | S | 497.465197 | 75 | 0.45 | 183.75 | 1620.00 |
| 148 | 150 | 4 | 600 | 12.25 | 0.003 | 0.5 | S | 497.77766 | 75 | 0.45 | 210 | 1620.00 |
| 149 | 150 | 4.5 | 675 | 12.25 | 0.003 | 0.5 | S | 498.089904 | 75 | 0.45 | 236.25 | 1620.00 |
| 150 | 150 | 5 | 750 | 12.25 | 0.003 | 0.5 | S | 498.399117 | 75 | 0.45 | 262.5 | 1620.00 |
| 151 | 150 | 3.5 | 525 | 12.25 | 0.003 | 0.5 | E | 497.466408 | 75 | 0.45 | 183.75 | 1620.00 |
| 152 | 150 | 4 | 600 | 12.25 | 0.003 | 0.5 | E | 497.783577 | 75 | 0.45 | 210 | 1620.00 |
| 153 | 150 | 4.5 | 675 | 12.25 | 0.003 | 0.5 | E | 498.09154 | 75 | 0.45 | 236.25 | 1620.00 |
| 154 | 150 | 5 | 750 | 12.25 | 0.003 | 0.5 | E | 498.397156 | 75 | 0.45 | 262.5 | 1620.00 |
| 155 | 150 | 3.5 | 525 | 12.25 | 0.003 | 0 | E | 278.382222 | 0 | 0.45 | 183.75 | 1620.00 |
| 156 | 150 | 3.5 | 525 | 12.25 | 0.003 | 0.1 | E | 322.298688 | 15 | 0.45 | 183.75 | 1620.00 |
| 157 | 150 | 3.5 | 525 | 12.25 | 0.003 | 0.2 | E | 366.159428 | 30 | 0.45 | 183.75 | 1620.00 |
| 158 | 150 | 3.5 | 525 | 12.25 | 0.003 | 0.3 | E | 409.980488 | 45 | 0.45 | 183.75 | 1620.00 |
| 159 | 150 | 3.5 | 525 | 12.25 | 0.003 | 0.4 | E | 453.747715 | 60 | 0.45 | 183.75 | 1620.00 |
| 160 | 150 | 3.5 | 525 | 12.25 | 0.003 | 0.5 | E | 497.466408 | 75 | 0.45 | 183.75 | 1620.00 |
References
- Adeleke, J.; Moodley, D. An Ontology for Proactive Indoor Environmental Quality Monitoring and Control. In Proceedings of the 2015 Annual Research Conference on South African Institute of Computer Scientists and Information Technologists, Stellenbosch, South Africa, 28 September 2015; pp. 1–10. [Google Scholar]
- Chen, S.; Zhang, G.; Xia, X.; Setunge, S.; Shi, L. A Review of Internal and External Influencing Factors on Energy Efficiency Design of Buildings. Energy Build. 2020, 216, 109944. [Google Scholar] [CrossRef]
- Almeida, R.M.S.F.; Pinto, M.; Pinho, P.G.; de Lemos, L.T. Natural Ventilation and Indoor Air Quality in Educational Buildings: Experimental Assessment and Improvement Strategies. Energy Effic. 2016, 10, 839–854. [Google Scholar] [CrossRef]
- Sadrizadeh, S.; Yao, R.; Yuan, F.; Awbi, H.; Bahnfleth, W.; Bi, Y.; Cao, G.; Croitoru, C.; de Dear, R.; Haghighat, F.; et al. Indoor Air Quality and Health in Schools: A Critical Review for Developing the Roadmap for the Future School Environment. J. Build. Eng. 2022, 57, 104908. [Google Scholar] [CrossRef]
- Asere, L.; Blumberga, A. Energy Efficiency—Indoor Air Quality Dilemma in Educational Buildings: A Possible Solution. Environ. Clim. Technol. 2020, 24, 357–367. [Google Scholar] [CrossRef]
- Settimo, G.; Avino, P. The Dichotomy between Indoor Air Quality and Energy Efficiency in Light of the Onset of the COVID-19 Pandemic. Atmosphere 2021, 12, 791. [Google Scholar] [CrossRef]
- ANSI/ASHRAE/IES Standard 90.1-2022 Changes. Available online: https://www.ashrae.org/technical-resources/bookstore/ansi-ashrae-ies-standard-90-1-2022-changes (accessed on 17 December 2023).
- Standards 62.1 & 62.2. Available online: https://www.ashrae.org/technical-resources/bookstore/standards-62-1-62-2 (accessed on 23 September 2021).
- CDC Coronavirus Disease 2019 (COVID-19). Available online: https://www.cdc.gov/coronavirus/2019-ncov/communication/guidance-list.html (accessed on 23 September 2021).
- U.S. Environmental Protection Agency. Science and Technical Resources Related to Indoor Air and Coronavirus (COVID-19). Available online: https://www.epa.gov/coronavirus/science-and-technical-resources-related-indoor-air-and-coronavirus-covid-19 (accessed on 12 August 2021).
- REHVA. Available online: https://www.rehva.eu/about-us/who-we-are/about-rehva (accessed on 23 September 2021).
- WHO Technical Guidance. Available online: https://www.who.int/emergencies/diseases/novel-coronavirus-2019/technical-guidance (accessed on 23 September 2021).
- Ma’bdeh, S.N.; Al-Zghoul, A.; Alradaideh, T.; Bataineh, A.; Ahmad, S. Simulation Study for Natural Ventilation Retrofitting Techniques in Educational Classrooms—A Case Study. Heliyon 2020, 6, e05171. [Google Scholar] [CrossRef] [PubMed]
- Jia, L.-R.; Han, J.; Chen, X.; Li, Q.-Y.; Lee, C.-C.; Fung, Y.-H. Interaction between Thermal Comfort, Indoor Air Quality and Ventilation Energy Consumption of Educational Buildings: A Comprehensive Review. Buildings 2021, 11, 591. [Google Scholar] [CrossRef]
- de la Hoz-Torres, M.L.; Aguilar, A.J.; Ruiz, D.P.; Martínez-Aires, M.D. Analysis of Impact of Natural Ventilation Strategies in Ventilation Rates and Indoor Environmental Acoustics Using Sensor Measurement Data in Educational Buildings. Sensors 2021, 21, 6122. [Google Scholar] [CrossRef] [PubMed]
- McLeod, R.S.; Mathew, M.; Salman, D.; Thomas, C.L.P. An Investigation of Indoor Air Quality in a Recently Refurbished Educational Building. Front. Built Environ. 2022, 7, 769761. [Google Scholar] [CrossRef]
- Underhill, L.J.; Dols, W.S.; Lee, S.K.; Fabian, M.P.; Levy, J.I. Quantifying the Impact of Housing Interventions on Indoor Air Quality and Energy Consumption Using Coupled Simulation Models. J. Expo. Sci. Amp. Environ. Epidemiol. 2020, 30, 436–447. [Google Scholar] [CrossRef]
- Chen, Y.; Gu, L.; Zhang, J. EnergyPlus and CHAMPS-Multizone Co-Simulation for Energy and Indoor Air Quality Analysis. Build. Simul. 2015, 8, 371–380. [Google Scholar] [CrossRef]
- Cony-Renaud-Salis, L.; Belhaj, N.; Ramalho, O.; Abadie, M. Analysis of the Need of Detailed Modelling for the Assessment of Indoor Air Quality in Residential Buildings. E3S Web Conf. 2019, 111, 04043. [Google Scholar] [CrossRef]
- Yang, L.; Ye, M.; He, B.-J. CFD Simulation Research on Residential Indoor Air Quality. Sci. Total Environ. 2014, 472, 1137–1144. [Google Scholar] [CrossRef] [PubMed]
- Heibati, S.; Maref, W.; Saber, H.H. Assessing the Energy and Indoor Air Quality Performance for a Three-Story Building Using an Integrated Model, Part One: The Need for Integration. Energies 2019, 12, 4775. [Google Scholar] [CrossRef]
- Ma, M.; Cao, C.; Xu, Y.; Liu, Z.; Zeng, L.; Zhang, C.; Gao, J. Using CONTAM to Design Ventilation Strategy of Negative Pressure Isolation Ward Considering Different Height of Door Gaps. Energy Built Environ. 2024, 5, 32–45. [Google Scholar] [CrossRef]
- Dols, W.S.; Polidoro, B.J. CONTAM User Guide and Program Documentation Version 3.2; National Institute of Standards and Technology: Gaithersburg, MD, USA, 2015; p. 12. [Google Scholar]
- Kim, M.K.; Choi, J.-H. Can Increased Outdoor CO2 Concentrations Impact on the Ventilation and Energy in Buildings? A Case Study in Shanghai, China. Atmos. Environ. 2019, 210, 220–230. [Google Scholar] [CrossRef]
- Zhang, H.; Srinivasan, R.; Yang, X. Simulation and Analysis of Indoor Air Quality in Florida Using Time Series Regression (TSR) and Artificial Neural Networks (ANN) Models. Symmetry 2021, 13, 952. [Google Scholar] [CrossRef]
- Berouine, A.; Ouladsine, R.; Bakhouya, M.; Essaaidi, M. Towards a Real-Time Predictive Management Approach of Indoor Air Quality in Energy-Efficient Buildings. Energies 2020, 13, 3246. [Google Scholar] [CrossRef]
- Ibrahim, D.M.; Almhafdy, A.; Al-Shargabi, A.A.; Alghieth, M.; Elragi, A.; Chiclana, F. The Use of Statistical and Machine Learning Tools to Accurately Quantify the Energy Performance of Residential Buildings. PeerJ Comput. Sci. 2022, 8, e856. [Google Scholar] [CrossRef]
- Jindal, A.; Kumar, N.; Rodrigues, J.J.P.C. A Heuristic-Based Smart HVAC Energy Management Scheme for University Buildings. IEEE Trans. Ind. Inform. 2018, 14, 5074–5086. [Google Scholar] [CrossRef]
- Shea, R.P.; Kissock, K.; Selvacanabady, A. Reducing University Air Handling Unit Energy Usage through Controls-Based Energy Efficiency Measures. Energy Build. 2019, 194, 105–112. [Google Scholar] [CrossRef]
- Justo Alonso, M.; Dols, W.S.; Mathisen, H.M. Using Co-Simulation between EnergyPlus and CONTAM to Evaluate Recirculation-Based, Demand-Controlled Ventilation Strategies in an Office Building. Build. Environ. 2022, 211, 108737. [Google Scholar] [CrossRef]
- Pastor-Fernández, A.; Cerezo-Narváez, A.; Montero-Gutiérrez, P.; Ballesteros-Pérez, P.; Otero-Mateo, M. Use of Low-Cost Devices for the Control and Monitoring of CO2 Concentration in Existing Buildings after the COVID Era. Appl. Sci. 2022, 12, 3927. [Google Scholar] [CrossRef]
- Liu, L.; Zhou, H.; Lin, B.; Yu, J. Real-Time Monitoring and Controlling Strategies of Indoor Environment in the Frontline Hospitals during COVID-19 Pandemic. Chin. Sci. Bull. 2021, 66, 424–432. [Google Scholar] [CrossRef]
- Scislo, L.; Szczepanik-Scislo, N. Near Real-Time Access Monitoring Based on IoT Dynamic Measurements of Indoor Air Pollutant. In Proceedings of the 2023 IEEE 12th International Conference on Intelligent Data Acquisition and Advanced Computing Systems: Technology and Applications (IDAACS), Dortmund, Germany, 7–9 September 2023; IEEE: Dortmund, Germany, 2023; pp. 729–734. [Google Scholar]
- Todeschi, V.; Boghetti, R.; Kämpf, J.H.; Mutani, G. Evaluation of Urban-Scale Building Energy-Use Models and Tools—Application for the City of Fribourg, Switzerland. Sustainability 2021, 13, 1595. [Google Scholar] [CrossRef]
- Hong, T.; Chen, Y.; Luo, X.; Luo, N.; Lee, S.H. Ten Questions on Urban Building Energy Modeling. Build. Environ. 2020, 168, 106508. [Google Scholar] [CrossRef]
- Chatzidiakou, L.; Archer, R.; Beale, V.; Bland, S.; Carter, H.; Castro-Faccetti, C.; Edwards, H.; Finneran, J.; Hama, S.; Jones, R.L.; et al. Schools’ Air Quality Monitoring for Health and Education: Methods and Protocols of the SAMHE Initiative and Project. Dev. Built Environ. 2023, 16, 100266. [Google Scholar] [CrossRef]
- Zagatti, E.; Russo, M.; Pietrogrande, M.C. On-Site Monitoring Indoor Air Quality in Schools: A Real-World Investigation to Engage High School Science Students. J. Chem. Educ. 2020, 97, 4069–4072. [Google Scholar] [CrossRef]
- Zauli-Sajani, S.; Marchesi, S.; Boselli, G.; Broglia, E.; Angella, A.; Maestri, E.; Marmiroli, N.; Colacci, A. Effectiveness of a Protocol to Reduce Children’s Exposure to Particulate Matter and NO2 in Schools during Alert Days. Int. J. Environ. Res. Public Health 2022, 19, 11019. [Google Scholar] [CrossRef]
- Heydon, J.; Chakraborty, R. Can Portable Air Quality Monitors Protect Children from Air Pollution on the School Run? An Exploratory Study. Env. Monit. Assess. 2020, 192, 195. [Google Scholar] [CrossRef]
- Chitaru, G.-M.; Istrate, A.; Catalina, T. Numerical Analysis of the Impact of Natural Ventilation on the Indoor Air Quality and Thermal Comfort in a Classroom. E3S Web Conf. 2019, 111, 01023. [Google Scholar] [CrossRef]
- Abdel-Salam, M.M.M. Investigation of Indoor Air Quality at Urban Schools in Qatar. Indoor Built Environ. 2019, 28, 278–288. [Google Scholar] [CrossRef]
- Kapalo, P.; Klymenko, H.; Zhelykh, V.; Adamski, M. Investigation of Indoor Air Quality in the Selected Ukraine Classroom—Case Study. In Proceedings of the CEE 2019; Blikharskyy, Z., Koszelnik, P., Mesaros, P., Eds.; Springer International Publishing: Cham, Switzerland, 2020; pp. 168–173. [Google Scholar]
- Associates, R.M. Rhinoceros 3D. Available online: https://www.rhino3d.com/ (accessed on 28 January 2024).
- Standard 90.1-2007; Energy Standard for Buildings Except Low-Rise Residential Buildings. American Society of Heating, Refrigerating and Air-Conditioning Engineers, Inc.: Peachtree Corners, GA, USA, 2007.
- Statistical Software. Available online: https://www.jmp.com/en_us/home.html (accessed on 23 January 2024).
- Standard Least Squares Models. Available online: https://www.jmp.com/support/help/en/17.2/index.shtml#page/jmp/standard-least-squares-models.shtml (accessed on 23 January 2024).
- Least Squares Method: What It Means, How to Use It, with Examples. Available online: https://www.investopedia.com/terms/l/least-squares-method.asp (accessed on 23 January 2024).
- Greenwood, M.; Banner, K. One-Way ANOVA Sums of Squares, Mean Squares, and F-Test—Mark Greenwood and Katharine Banner. Available online: https://arc.lib.montana.edu/book/statistics-with-r-textbook/item/56 (accessed on 10 June 2023).
- Schober, P.; Boer, C.; Schwarte, L.A. Correlation Coefficients: Appropriate Use and Interpretation. Anesth. Analg. 2018, 126, 1763. [Google Scholar] [CrossRef]
- Parameter Estimates > Linear Fit > Fit Model > Statistical Reference Guide|Analyse-It® 6.15 Documentation. Available online: https://analyse-it.com/docs/user-guide/fit-model/linear/parameter-estimates (accessed on 23 January 2024).
- Persily, A.; Polidoro, B.J. Indoor Carbon Dioxide Metric Analysis Tool; National Institute of Standards and Technology (U.S.): Gaithersburg, MD, USA, 2022; p. NIST TN 2213. [Google Scholar]
- Amazon.Com: Qingping Air Quality Monitor, Indoor Air Quality Meter Detects PM2.5, Temperature, CO2, and Humidity, Smart Air Quality Sensor for Bedroom, A Rechargeable Device with 2 Colors, Smart Home: Industrial & Scientific. Available online: https://www.amazon.com/Qingping-Monitor-Quality-Temperature-Humidity/dp/B0967TNJL4?th=1 (accessed on 19 February 2024).
- Cao, S.-J.; Deng, H.-Y. Investigation of Temperature Regulation Effects on Indoor Thermal Comfort, Air Quality, and Energy Savings toward Green Residential Buildings. Sci. Technol. Built Environ. 2019, 25, 309–321. [Google Scholar] [CrossRef]
- Anastasi, G.; Bartoli, C.; Conti, P.; Crisostomi, E.; Franco, A.; Saponara, S.; Testi, D.; Thomopulos, D.; Vallati, C. Optimized Energy and Air Quality Management of Shared Smart Buildings in the COVID-19 Scenario. Energies 2021, 14, 2124. [Google Scholar] [CrossRef]
- Balocco, C.; Leoncini, L. Energy Cost for Effective Ventilation and Air Quality for Healthy Buildings: Plant Proposals for a Historic Building School Reopening in the COVID-19 Era. Sustainability 2020, 12, 8737. [Google Scholar] [CrossRef]
- Azuma, K.; Yanagi, U.; Kagi, N.; Kim, H.; Ogata, M.; Hayashi, M. Environmental Factors Involved in SARS-CoV-2 Transmission: Effect and Role of Indoor Environmental Quality in the Strategy for COVID-19 Infection Control. Environ. Health Prev. Med. 2020, 25, 66. [Google Scholar] [CrossRef]
- Tzoutzas, I.; Maltezou, H.C.; Barmparesos, N.; Tasios, P.; Efthymiou, C.; Assimakopoulos, M.N.; Tseroni, M.; Vorou, R.; Tzermpos, F.; Antoniadou, M.; et al. Indoor Air Quality Evaluation Using Mechanical Ventilation and Portable Air Purifiers in an Academic Dentistry Clinic during the COVID-19 Pandemic in Greece. Int. J. Environ. Res. Public Health 2021, 18, 8886. [Google Scholar] [CrossRef] [PubMed]
- Agarwal, N.; Meena, C.S.; Raj, B.P.; Saini, L.; Kumar, A.; Gopalakrishnan, N.; Kumar, A.; Balam, N.B.; Alam, T.; Kapoor, N.R.; et al. Indoor Air Quality Improvement in COVID-19 Pandemic: Review. Sustain. Cities Soc. 2021, 70, 102942. [Google Scholar] [CrossRef]
- Chihib, M.; Salmerón-Manzano, E.; Manzano-Agugliaro, F. Benchmarking Energy Use at University of Almeria (Spain). Sustainability 2020, 12, 1336. [Google Scholar] [CrossRef]
- Anand, P.; Cheong, D.; Sekhar, C. A Review of Occupancy-Based Building Energy and IEQ Controls and Its Future Post-COVID. Sci. Total Environ. 2022, 804, 150249. [Google Scholar] [CrossRef] [PubMed]
- Tahmasebi, F.; Wang, Y.; Cooper, E.; Godoy Shimizu, D.; Stamp, S.; Mumovic, D. Window Operation Behaviour and Indoor Air Quality during Lockdown: A Monitoring-Based Simulation-Assisted Study in London. Build. Serv. Eng. Res. Technol. 2022, 43, 5–21. [Google Scholar] [CrossRef]
- Mahdavi, A.; Bochukova, V.; Berger, C. A Pragmatic Theory of Occupants’ Indoor-Environmental Control Behaviour. Front. Sustain. Cities 2021, 3, 748288. [Google Scholar] [CrossRef]
- Litardo, J.; Hidalgo-Leon, R.; Soriano, G. Energy Performance and Benchmarking for University Classrooms in Hot and Humid Climates. Energies 2021, 14, 7013. [Google Scholar] [CrossRef]
- da Silva Costa, M.L.; Freire, M.R.; da Silva, K.F.; Freires, F.G.M. Analysis of Energy Consumption Related to the Use of Air Conditioning in University Buildings in a Tropical Climate. Rev. De Gestão Soc. E Ambient. 2022, 16, e03025. [Google Scholar] [CrossRef]
Figure 1.
Research methodology.

Figure 2.
Data modeling blocks on Grasshopper software.

Figure 3.
Mechanical ventilation energy—predicted model. The black dots represent the data points. The red line is the trendline, i.e., best fit. The blue line is the statistical mean.
Figure 3.
Mechanical ventilation energy—predicted model. The black dots represent the data points. The red line is the trendline, i.e., best fit. The blue line is the statistical mean.
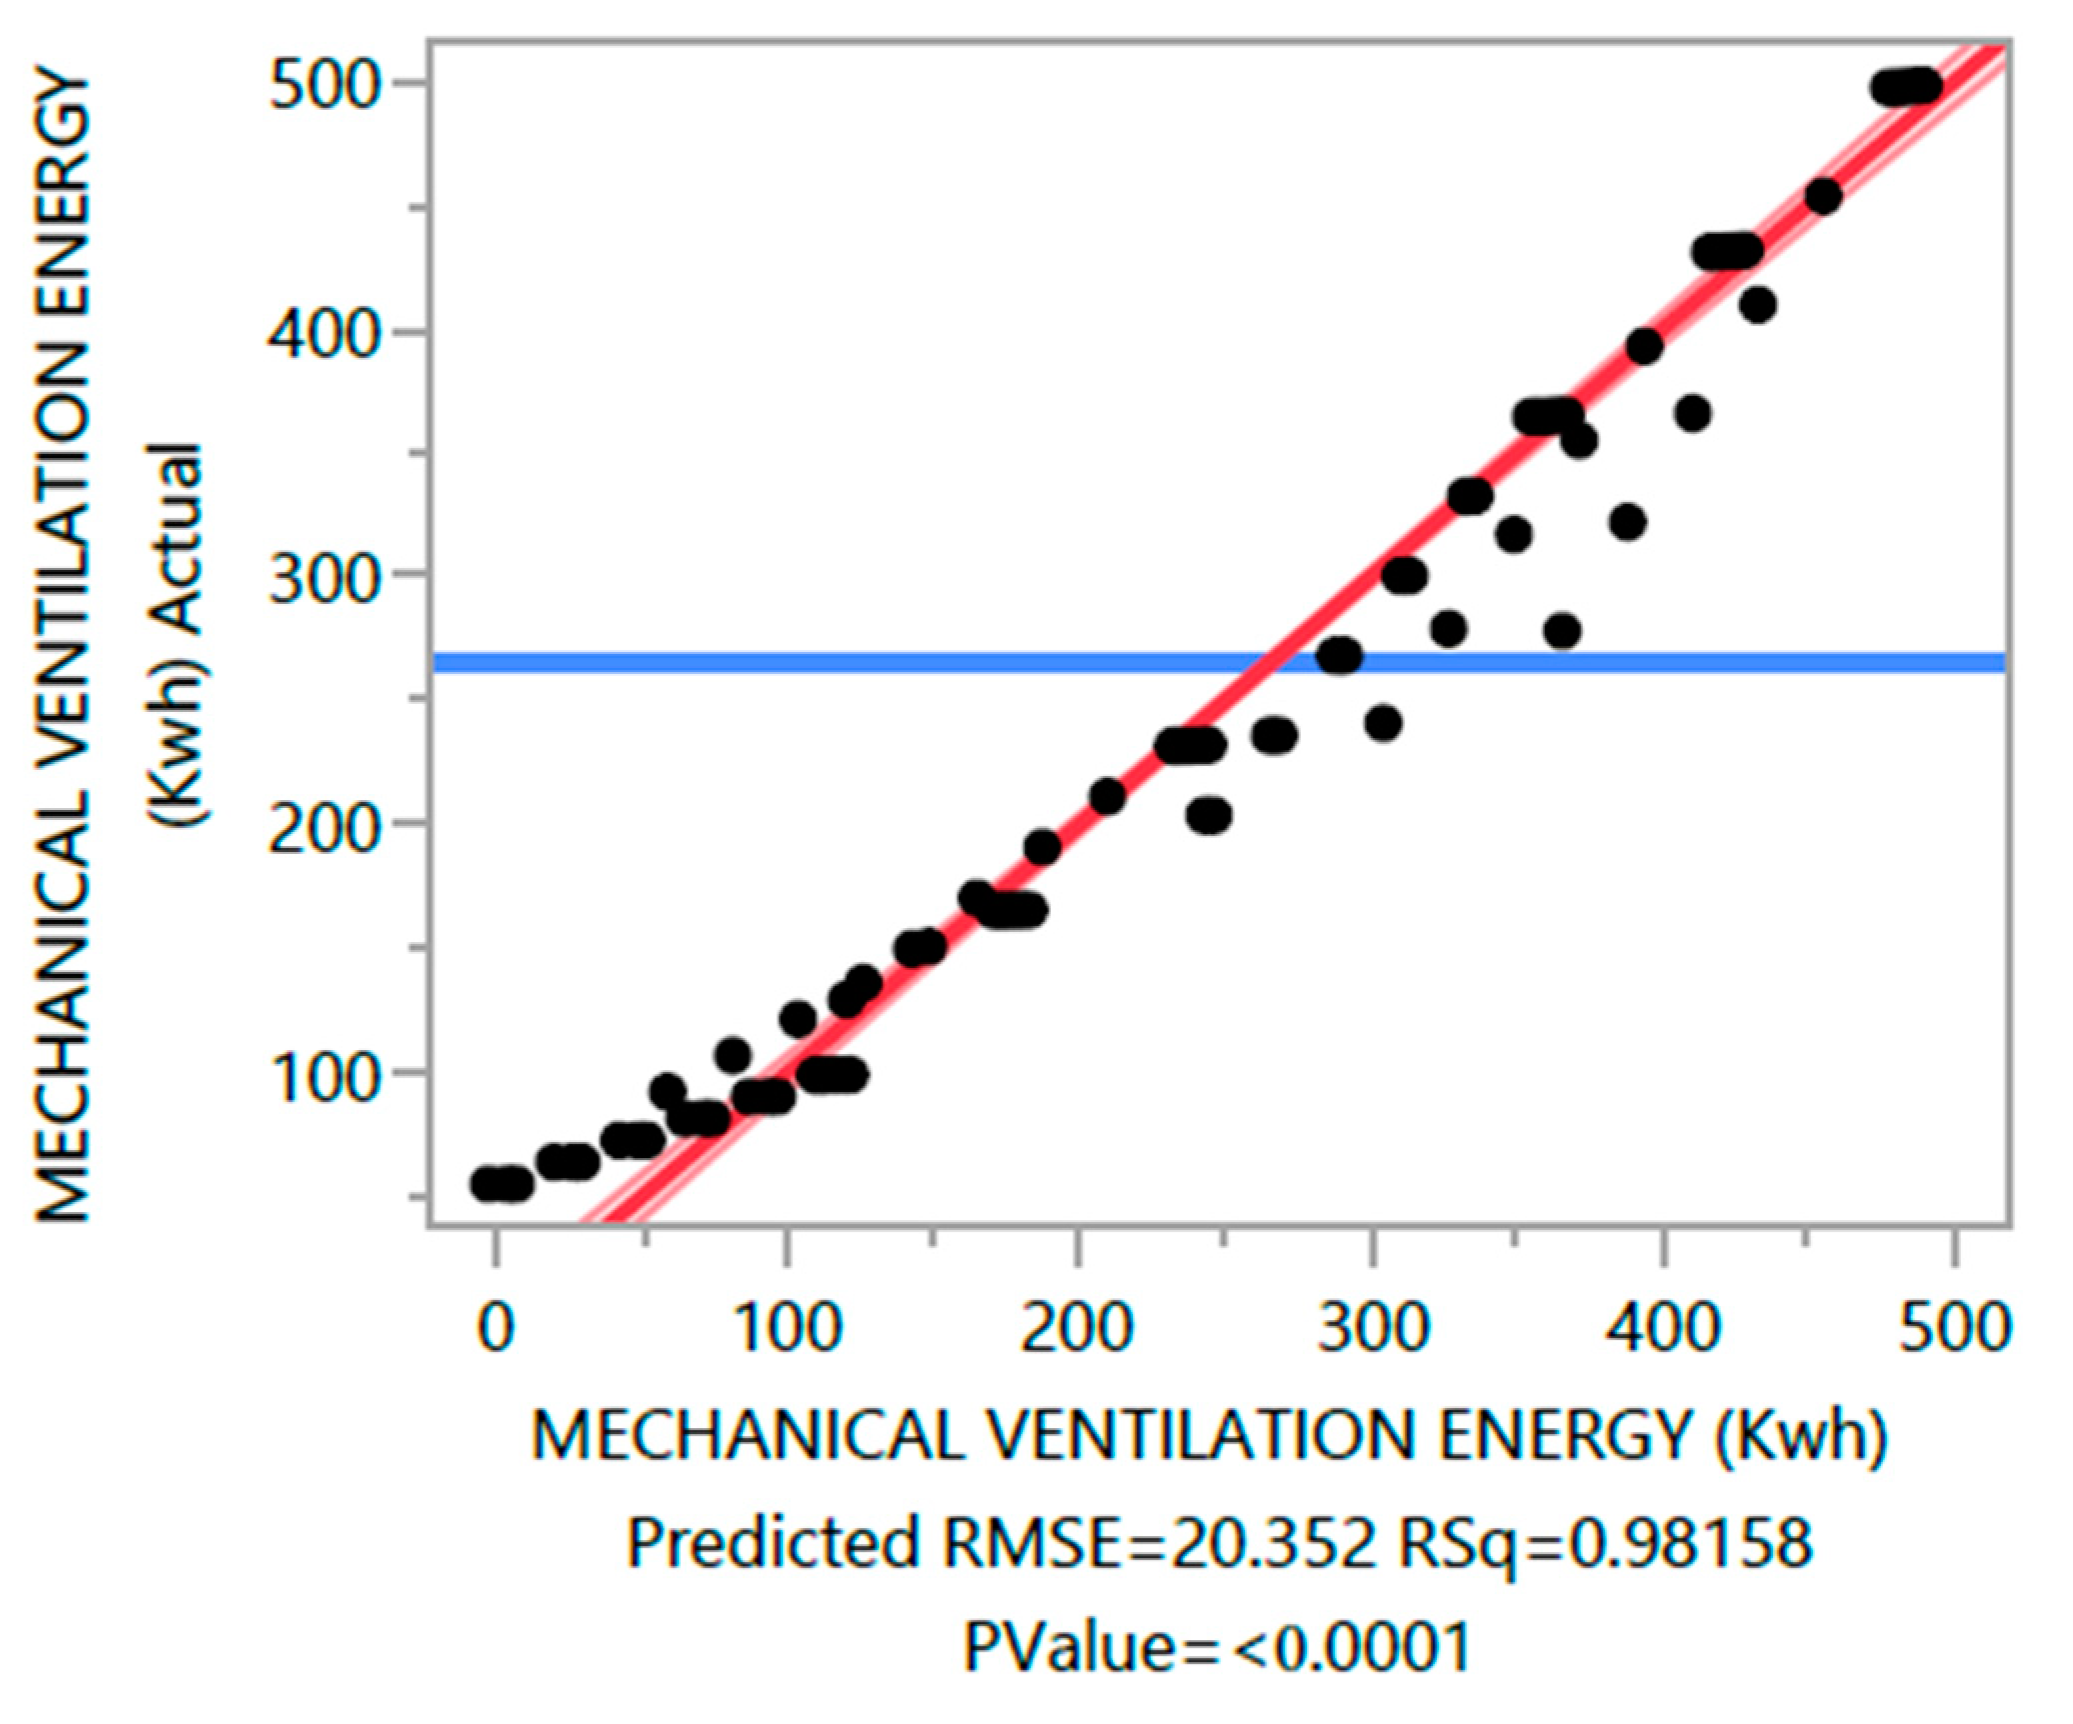
Figure 4.
Effect summary of studied parameters (produced by JMP software). The blue line represents the significance level of the ‘Effect Estimates Test’ of the ‘Fit Model’.
Figure 4.
Effect summary of studied parameters (produced by JMP software). The blue line represents the significance level of the ‘Effect Estimates Test’ of the ‘Fit Model’.
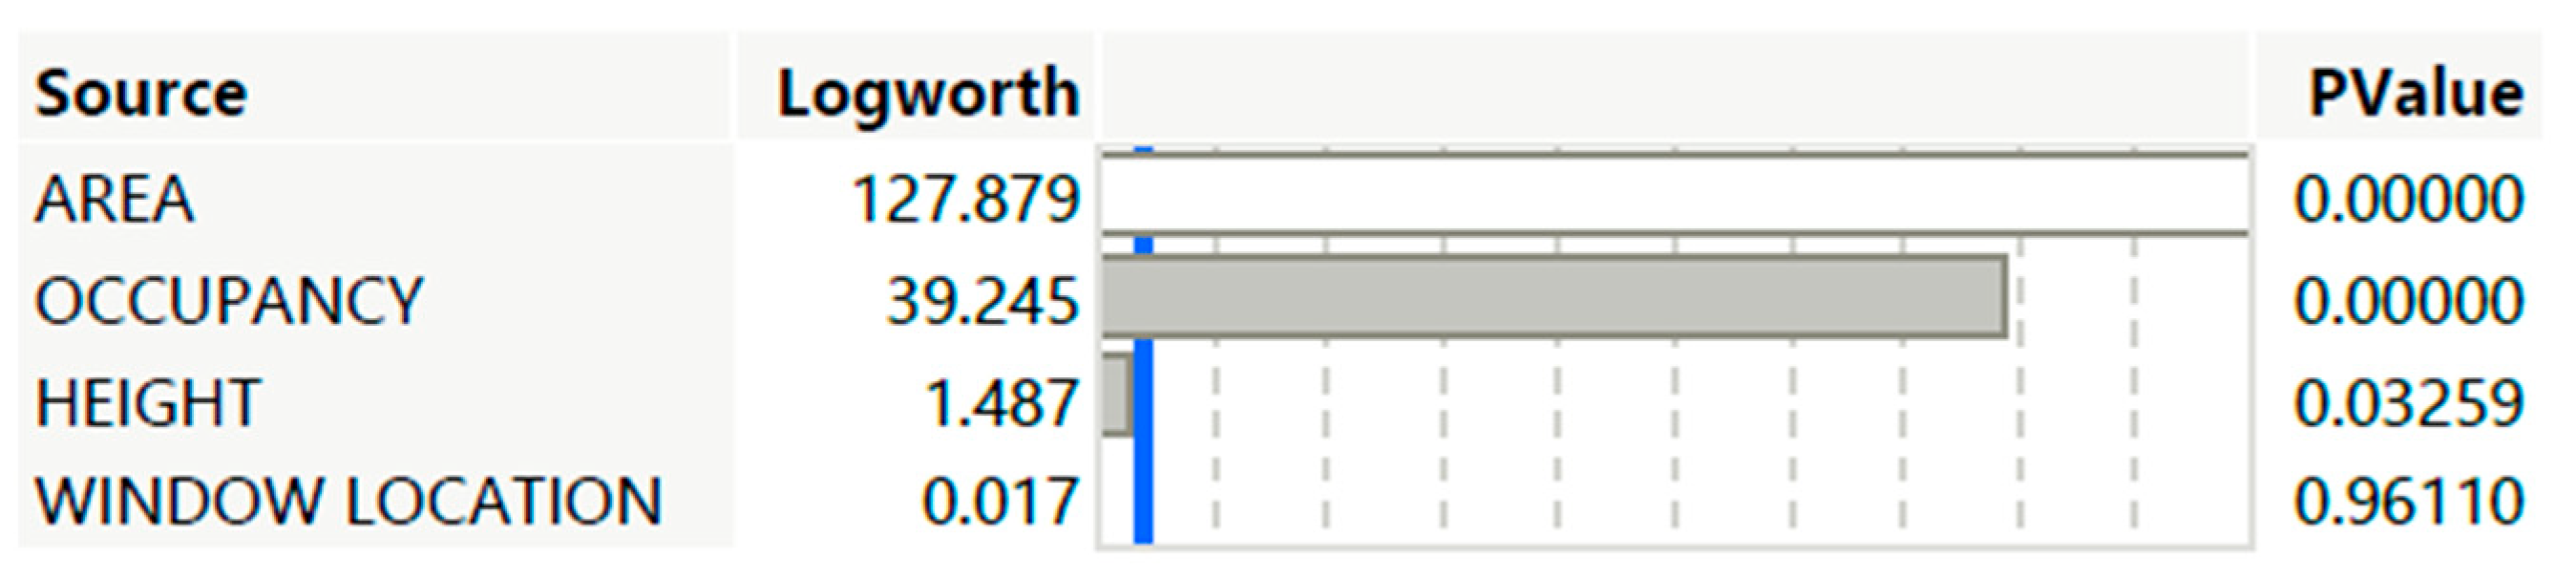
Figure 5.
Leverage plot in response to total annual mechanical ventilation (kwh): area (m2) (top left), height (m) (top right), occupancy (m2/person) (bottom left), window location (° degree) (bottom right). Leverage plots are produced by JMP software. The black dots represent the data points. The red line is the trendline, i.e., best fit. The blue line is the statistical mean.

Figure 6.
Occupancy and mechanical ventilation energy (kwh).

Figure 7.
Occupancy and volume of classroom (m3).

Figure 8.
Left—Qingping monitor CGS1—image source (Amazon [52]). Right—IAQ monitor installed behind the television screen in a selected university classroom (image source: self-produced).
Figure 8.
Left—Qingping monitor CGS1—image source (Amazon [52]). Right—IAQ monitor installed behind the television screen in a selected university classroom (image source: self-produced).
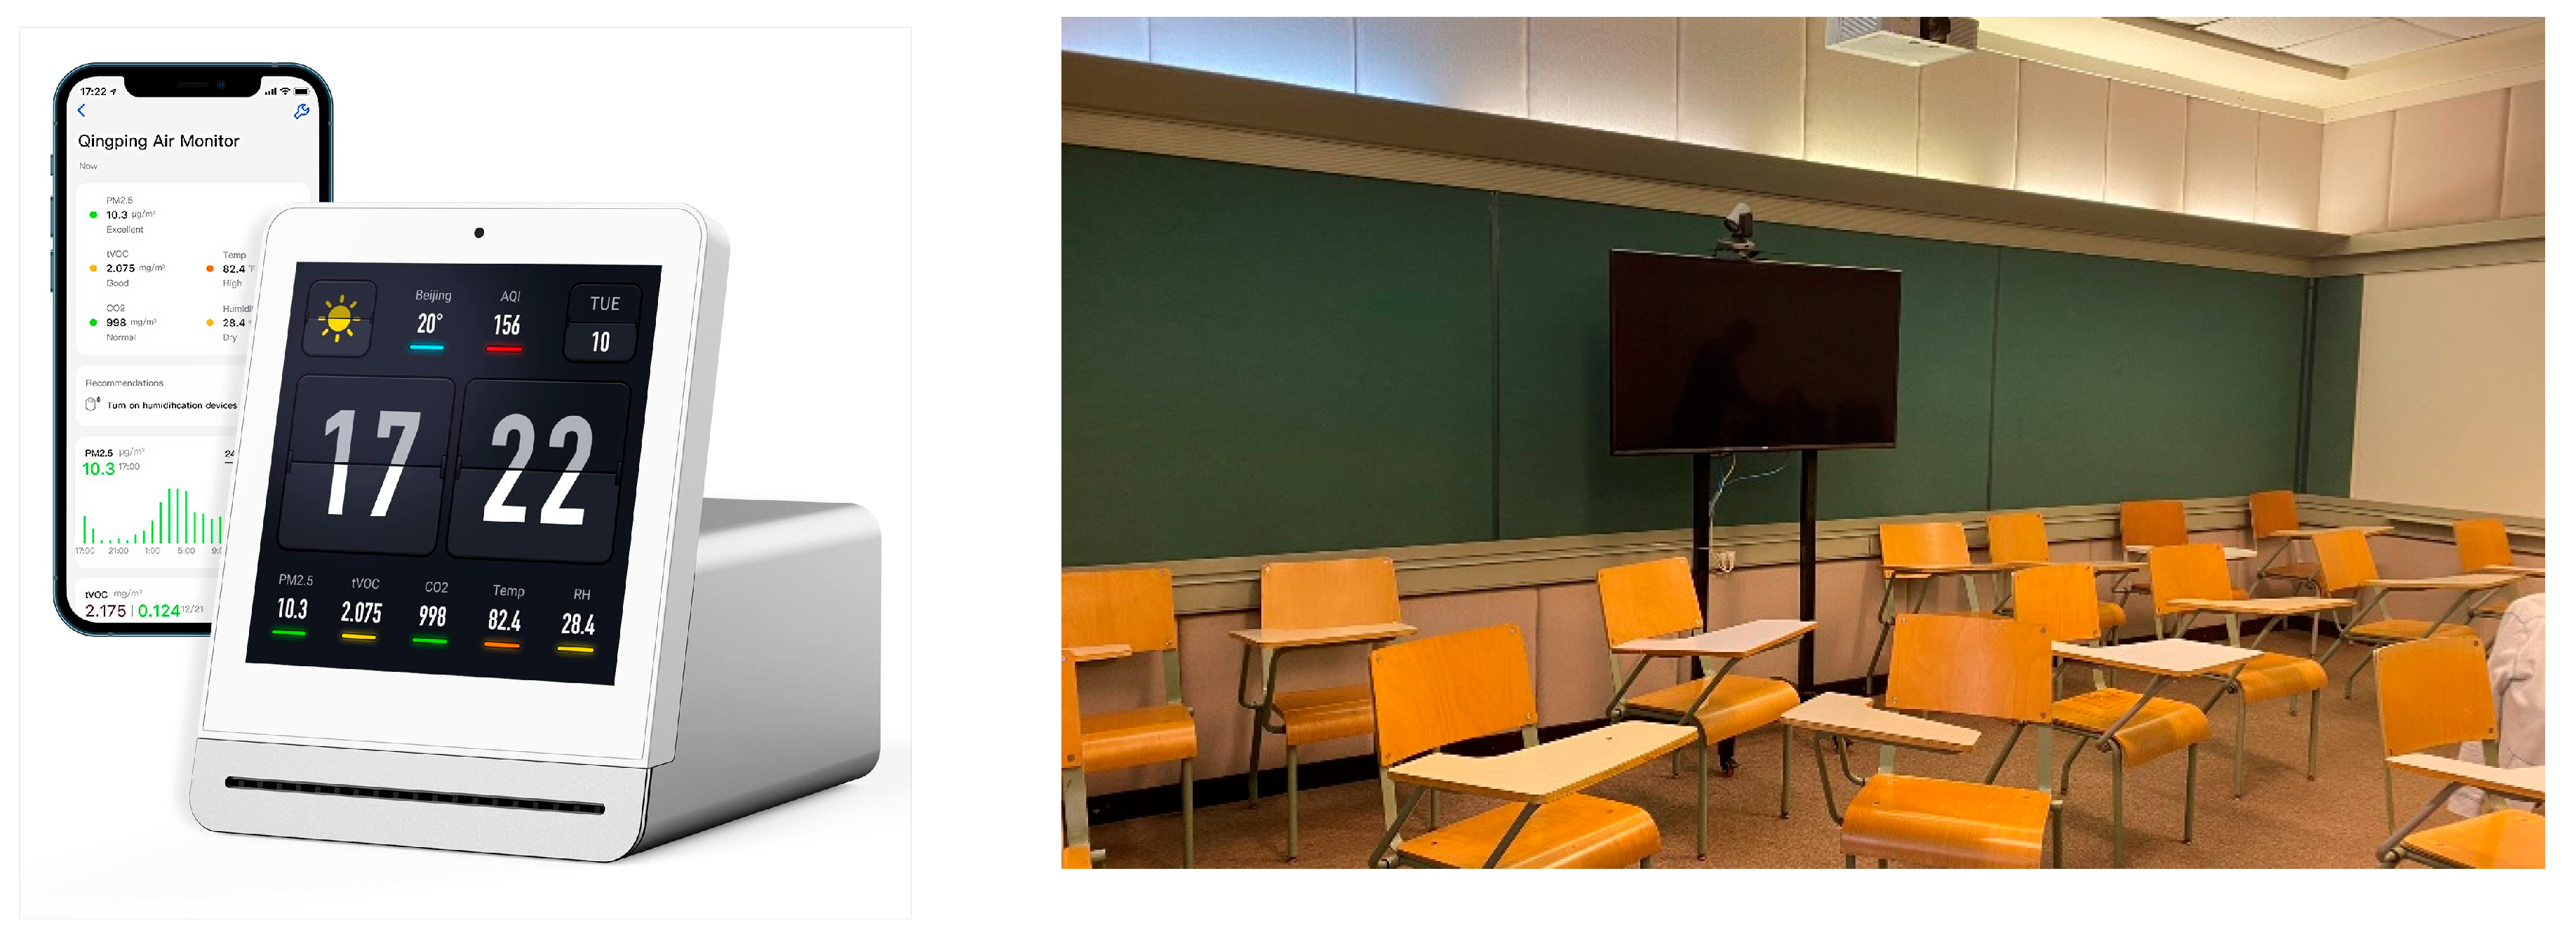
Figure 9.
Measured versus calculated c concentrations (using Equation (2)) for a medium-sized university classroom.
Figure 9.
Measured versus calculated c concentrations (using Equation (2)) for a medium-sized university classroom.
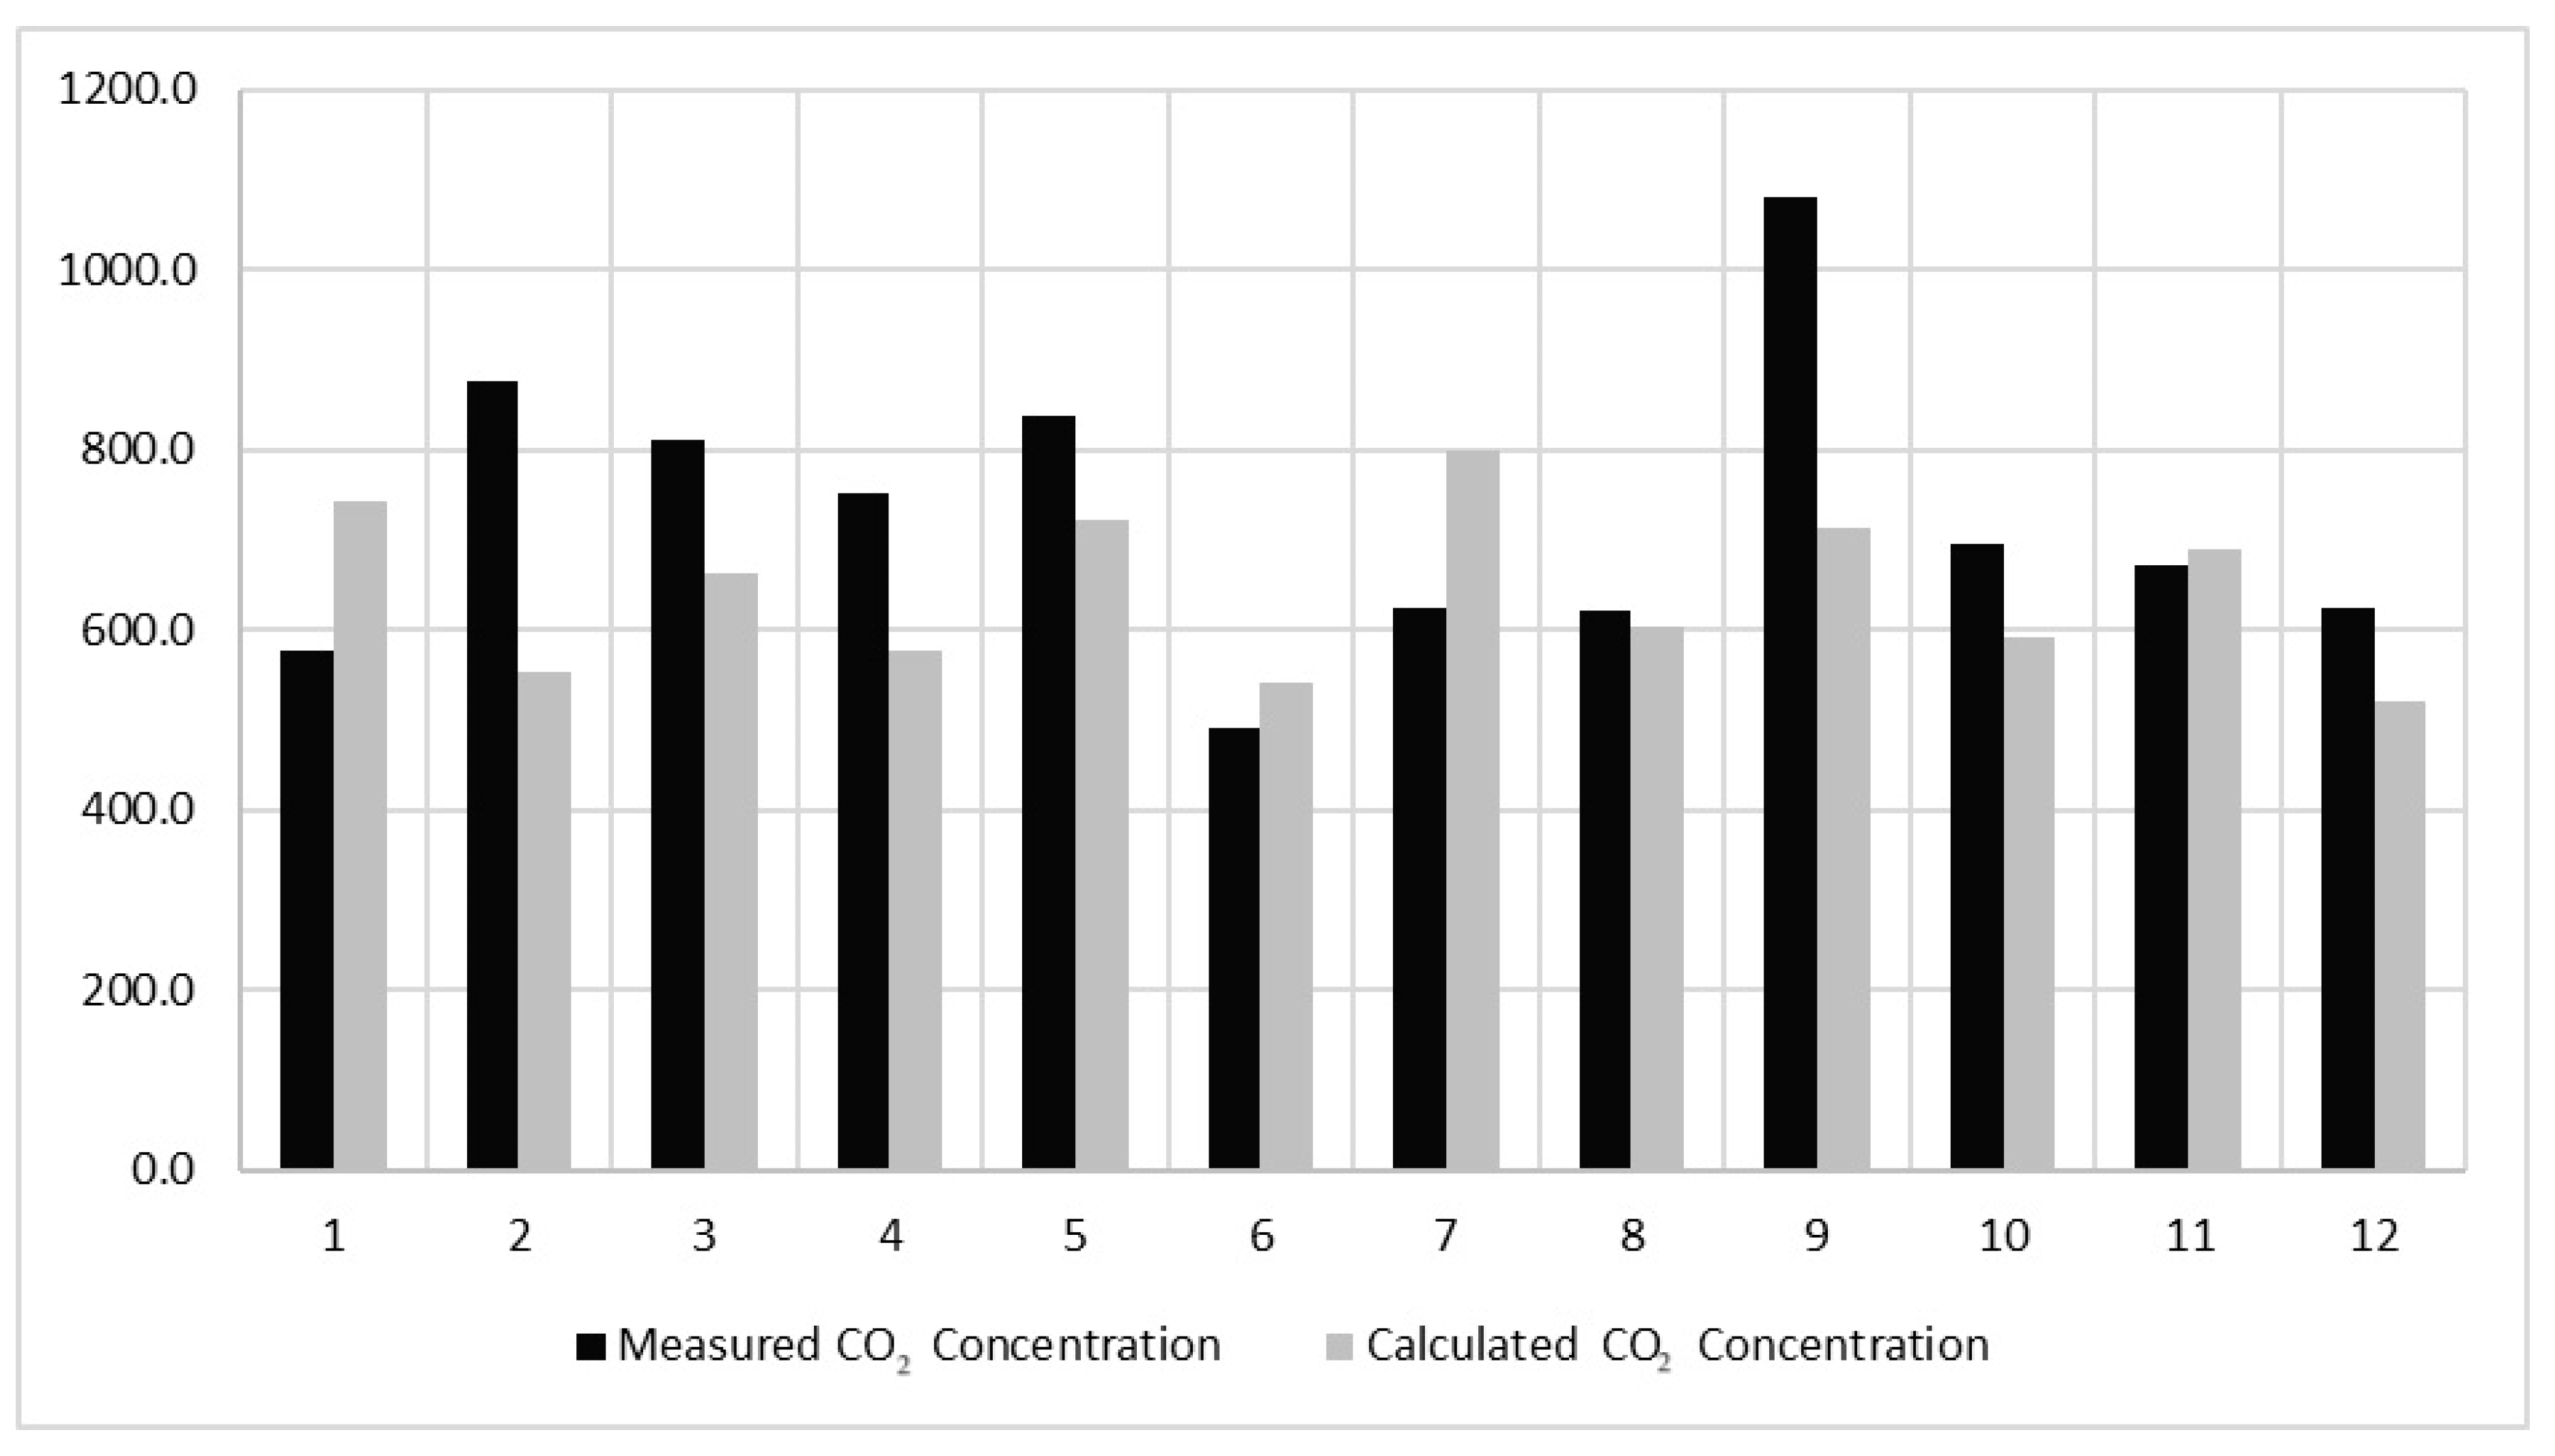
Table 1.
Grasshopper parametric building blocks.
| Block No. | Title | Description | Reference Figures in Appendix A |
|---|---|---|---|
| Block (1) | Classroom Design | Changes the model parameters by incorporating a secondary school classroom prototype from honey-bee plugin, and the changeable parameters include the height and area. | Figure A2 |
| The model classroom also includes sub-variable of air flow rate (7 h−1) at pressure difference of (50 Pa), as well as another block related to zone loads (equipment load per area (6 W/m2), and lighting density per area (3 W/m2), and ventilation rate per area 0.0003 (m3/s.m2)) according to ASHRAE 60. The mechanical ventilation parameters represented are in line with the actual case study’s HVAC system, which is referenced in Appendix B. | Figure A3 | ||
| Block (2) | Windows | The opening-to-wall ratio was specified as the classroom area’s square root. Other specified parameters included the window height (3 m) and windowsill height (0.9 m). In addition, the orientation of the opening was altered per the four main directions. | Figure A4 |
| Block (3) | Schedule | The schedule was also predefined and the parameters were preset according to ASHRAE 90 [44] in relation to occupancy schedules, occupancy activities’ schedules, heating and cooling, lighting, equipment, infiltration schedules, and ventilation schedules. | Figure A5 |
| Block (4) | Materials | Materials of built environment: walls, roof, floors, and windows. | Figure A6 and Figure A7 |
| Block (5) | Weather File | Includes the weather file imported from climate.onebuilding.org for the African region, including Cairo and Egypt. The file is further specified for the New Cairo region, Cairo International Airport as indicated by the ladybug file—refer to Image 8. | Figure A8 |
| Block (6) | Simulation | Refers to exact conditions of simulation, including the HVAC systems, simulation outputs, simulation run, and the exact calculations in terms of energy—mechanical ventilation energy. | Figure A9 |
| Block (7) | Output | (Annual mechanical ventilation energy), specified averages and data recording plugins yielded the final output file—in Appendix C. | Figure A10 |
Table 2.
Selected parameters used in the simulation model.
| Parameter Group | Sub-Parameters | Unit | Range (Min–Max) | Interval | Reference/Notes |
|---|---|---|---|---|---|
| Classroom Volume | Area | m2 | 30–150 | 20 | Common classroom sizes based on the available references |
| Height | m | 3.5–5 | 0.5 | ||
| Occupancy | Occupant Density | m2/Person | 0–0.5 | 0.1 | Max based on ASHRAE 90 |
| HVAC Systems | HVAC Type | - | VAC—Split | - | Assumed only to be mechanical |
| ACH50 | h−1/Person | 7 | - | Based on ASHRAE 60 | |
| Total Number of Simulations | 160 | ||||
Table 3.
Summary of fit.
| Summary of Fit | |
|---|---|
| RSquared | 0.981576 |
| RSquared Adj | 0.980853 |
| Root-Mean-Squared Error | 20.35204 |
| Mean of Response | 265.3232 |
| Observations (or Sum Wgts) | 160 |
Table 4.
Analysis of variance.
| Analysis of Variance | ||||
|---|---|---|---|---|
| Source | DF | Sum of Squares | Mean Square | F Ratio |
| Model | 6 | 3,376,279.4 | 562,713 | 1358.536 |
| Error | 153 | 63,373.5 | 414 | Prob > F |
| C. Total | 159 | 3,439,652.9 | <0.0001 * | |
* highlights the significant values.
Table 5.
Parameter estimates.
| Parameter Estimates | ||||
|---|---|---|---|---|
| Term | Estimate | Std Error | t Ratio | Prob > |t| |
| Intercept | −115.485 | 13.41495 | −8.61 | <0.0001 * |
| Area | 3.065693 | 0.037237 | 82.33 | <0.0001 * |
| Height | 6.328062 | 2.934173 | 2.16 | 0.0326 * |
| Occupancy | 223.5958 | 12.32417 | 18.14 | <0.0001 * |
| Window Location [E] | −0.83728 | 2.962314 | −0.28 | 0.7778 |
| Window Location [N] | 1.740038 | 3.346727 | 0.52 | 0.6039 |
| Window Location [S] | −0.45377 | 3.511829 | −0.13 | 0.8974 |
* highlights the significant values.
Table 6.
Sum of squares.
| Sum of Fit | |||||
|---|---|---|---|---|---|
| Source | No. of Parameters | DF | Sum of Squares | F Ratio | Prob > F |
| Area | 1 | 1 | 6778.231 | 2807581 | <0.0001 * |
| Height | 1 | 1 | 1926.6 | 4.6513 | 0.0326 * |
| Occupancy | 1 | 1 | 136341.3 | 329.1633 | <0.0001 * |
| Window Location | 3 | 3 | 121.6 | 0.0979 | 0.9611 |
* highlights the significant values.
Table 7.
Least squares mean of window location.
| Least Squares Mean of Window Location | |||
|---|---|---|---|
| Level | Least Sq Mean | Std Error | Mean |
| E | 264.75637 | 2.4706845 | 225.664 |
| N | 267.33369 | 4.0444331 | 327.137 |
| S | 265.13989 | 4.3188978 | 298.666 |
| W | 265.14466 | 4.3188978 | 298.671 |
Table 8.
Model validation.
| Model Validation | ||||||||
|---|---|---|---|---|---|---|---|---|
| Lecture (Number) | Occupancy (Number) | Average Outdoor Temperature (°C) | Average Outdoor CO2 Concentration | Average Indoor Temperature (°C) | Measured CO2 Concentration (ppm) | Calculated CO2 Concentration (ppm) | CO2 Difference (Δppm) | Temperature Difference (Δ°C)) |
| 1 | 28 | 26.0 | 435.5 | 17.6 | 578.0 | 742.0 | −164.0 | 8.5 |
| 2 | 12 | 28.2 | 419.3 | 21.6 | 877.0 | 553.0 | 324.0 | 6.7 |
| 3 | 22 | 28.3 | 416.8 | 22.5 | 811.0 | 662.0 | 149.0 | 5.8 |
| 4 | 11 | 20.1 | 453.7 | 23.5 | 752.0 | 577.0 | 175.0 | −3.4 |
| 5 | 24 | 20.5 | 452.8 | 26.4 | 839.0 | 724.0 | 115.0 | −5.9 |
| 6 | 8 | 19.4 | 453.1 | 26.1 | 491.0 | 543.0 | −52.0 | −6.6 |
| 7 | 28 | 18.5 | 489.7 | 22.5 | 626.0 | 801.0 | −175.0 | −4.0 |
| 8 | 12 | 18.9 | 468.8 | 25.4 | 621.0 | 604.0 | 17.0 | −6.5 |
| 9 | 22 | 18.4 | 467.0 | 24.9 | 1080.0 | 714.0 | 366.0 | −6.5 |
| 10 | 8 | 15.9 | 501.1 | 25.1 | 695.0 | 591.0 | 104.0 | −9.2 |
| 11 | 24 | 29.8 | 424.2 | 22.1 | 672.0 | 691.0 | −19.0 | 7.7 |
| 12 | 8 | 28.8 | 430.0 | 21.6 | 625.0 | 521.0 | 104.0 | 7.2 |
Disclaimer/Publisher’s Note: The statements, opinions and data contained in all publications are solely those of the individual author(s) and contributor(s) and not of MDPI and/or the editor(s). MDPI and/or the editor(s) disclaim responsibility for any injury to people or property resulting from any ideas, methods, instructions or products referred to in the content. |
© 2024 by the authors. Licensee MDPI, Basel, Switzerland. This article is an open access article distributed under the terms and conditions of the Creative Commons Attribution (CC BY) license (https://creativecommons.org/licenses/by/4.0/).
Share and Cite
MDPI and ACS Style
Shoukry, F.; Raafat, R.; Tarabieh, K.; Goubran, S. Indoor Air Quality and Ventilation Energy in University Classrooms: Simplified Model to Predict Trade-Offs and Synergies. Sustainability 2024, 16, 2719. https://doi.org/10.3390/su16072719
AMA Style
Shoukry F, Raafat R, Tarabieh K, Goubran S. Indoor Air Quality and Ventilation Energy in University Classrooms: Simplified Model to Predict Trade-Offs and Synergies. Sustainability. 2024; 16(7):2719. https://doi.org/10.3390/su16072719
Chicago/Turabian StyleShoukry, Farah, Rana Raafat, Khaled Tarabieh, and Sherif Goubran. 2024. "Indoor Air Quality and Ventilation Energy in University Classrooms: Simplified Model to Predict Trade-Offs and Synergies" Sustainability 16, no. 7: 2719. https://doi.org/10.3390/su16072719
Note that from the first issue of 2016, this journal uses article numbers instead of page numbers. See further details here.