Article

The Influence of Biowaste Type on the Physicochemical and Sorptive Characteristics of Corresponding Biochar Used as Sustainable Sorbent

by
Nikolaos Mourgkogiannis
,
Ioannis Nikolopoulos
,
Eleana Kordouli
*,
Alexis Lycourghiotis
,
Christos Kordulis
and
Hrissi K. Karapanagioti
*
Department of Chemistry, University of Patras, GR-26504 Patras, Greece
*
Authors to whom correspondence should be addressed.
Sustainability 2024, 16(7), 2889; https://doi.org/10.3390/su16072889
Submission received: 28 February 2024 / Revised: 26 March 2024 / Accepted: 27 March 2024 / Published: 30 March 2024

Abstract

:
Biowaste raw materials were used for biochar preparation through pyrolysis at 850 °C under a limited oxygen atmosphere. Raw materials and the corresponding biochar samples were characterized by XRD, FTIR, SEM, TGA, N2-sorption, pH-equilibrium, and ash content measurements. These samples were evaluated as sustainable sorbents for use in methylene blue (MB) removal from artificial fresh water. All biochar samples exhibited high specific surface areas (367–870 m2·g−1), low crystallinity, and low population of functional groups (C–O–C, –COOH, –N–O, –N–H, and –OH) on their surfaces. They were mainly micro-porous materials with a significant fraction of pores in the meso-porous range. The specific surface area of the latter pores proved very important for the physical adsorption of MB from aqueous solution. Although the raw materials exhibited low MB sorption capacity, ranging from 29 to 54 mg·g−1, the corresponding biochar samples exhibited important MB sorption efficiency ranging from 58 to 370 mg·g−1. Among the biochar samples studied, those produced from coffee residues proved most promising for MB removal from water solution (sorption capacity: 280–370 mg·g−1), addressing the United Nations Sustainability Development Goal (SDG) 6: Clean Water and Sanitation by improving the index related to anthropogenic wastewater that has received treatment.

1. Introduction

The use of biomass as a natural resource to produce carbonaceous materials under thermal conditions contributes to long-term environmental protection by purifying aqueous systems and reducing CO2 emissions while favoring sustainability. Biochar is a valuable product obtained from biomass heated under different pyrolytic conditions [1]. Pyrolysis is a thermal process through which organic substances decompose under a limited or very low oxygen atmosphere at a temperature range of 300 to 1300 °C. Biochar can be incorporated into soil as a soil amendment [2], providing organic matter amounts which prevent the physical breakdown of soil [3].
Past studies have shown that biochar obtained at high temperatures (750–900 °C) presents higher surface area and porosity compared to that produced at lower temperatures (300–600 °C) [4]. Another study also demonstrated that biochar yield decreases with increasing pyrolysis temperature [5]. Rasa et al. showed that pyrolysis temperature is a vital parameter affecting produced biochar [6]. Besides the pyrolysis temperature, the biomass type is another factor that determines the production of biochar with desirable properties. The lignin, cellulose, and hemicellulose contents of biomass used for biochar production affect the structure of the final product, whereas inorganic components result in biochar with high ash content and low volatile matter [7]. Both the chemical composition and the physical properties, such as pore size, surface area etc., of biochar depend on the production conditions, such as pyrolysis temperature, atmosphere, and time, along with the feedstock characteristics [8]. Therefore, the use of suitable raw materials and pyrolysis conditions are essential for the production of high performance and low-cost biochar [9,10]. This environmentally friendly material shows great potential as a pollutants (heavy metals, dyes, etc.) sorbent for use in the purification of water. The advantages of biochar for use in place of other materials, such as activated carbon and inorganic sorbents, in the efficient removal of toxic heavy metals from aqueous systems has been extensively reviewed by Shakoor et al. [10].
Coffee is a widespread product and the most famous beverage around the world [11]. In 2021, coffee exports increased by 0.11 million bags compared to 2020 and reached 11.4 million unit [12]. Spent coffee grounds contain several classes of compounds, with polysaccharides comprising 50% of the total mass [13]. Greek coffee is a strongly brewed coffee that is found everywhere in Greece. It is similar to the coffee served in surrounding countries in the Middle East and is an integral part of the country’s culture. Greek coffee is served with grounds in the cup. The grounds are allowed to settle as the coffee is slowly sipped. Therefore, large amounts of Greek coffee sediments end up in sewers without any form of treatment. Greek coffee contains large amounts of organic compounds [14]. Coffee sediments are a widely known pollutant and are hardly treated by conventional municipal wastewater treatment plants due to the fragmentary treatment of caffeine by microorganisms developed in these facilities [15].
Grapes are one of the most popular fruits worldwide. Approximately 75 million tons are produced every year, and 35 million tons are used to produce wine [16,17]. Grape seeds are considered a major winery waste product, comprising approximately 17% of the grape pomace mass [18]. In Greece, in 2021, approximately 695.6 thousand tons of grapes were produced [19], which corresponds to approximately 14 thousand tons of grape seeds in an annual base. These quantities render grape seeds among the popular biowastes found in Greece. Thus, the thermal degradation of grape seeds at elevated temperatures under oxygen-limited conditions seems to be a promising treatment for producing biochar with complex matrices. Grape seeds, after wine production, are also used to produce tsipouro, a Greek national distillate drink. Commercial tsipouro contains alcohol lower than 50% volume after water dilution [20]. Over the last decade, the tsipouro market has increased in size rapidly, producing 18.5 million L in 2012 (IWSR) in Greece. Seeds are the main waste product, among others (e.g., marcs), that should be treated after tsipouro production. However, several studies have shown that tsipouro contains many volatile compounds at significant concentrations [21]; hence, the thermal treatment of seeds remaining after tsipouro production is an issue that could be further explored.
Rice constitutes one of the largest crops in the world, with more than 500 million tons being produced every year. In Greece, the annual national rice harvest is estimated at 0.024% of the global rice production (approximately 120 thousand tons per year). Considering that rice husk represents 20% of the total amount of the grain produced [22], the annual production of rice husk in Greece is estimated approximately at 24 thousand tons per year. Hence, rice husk is an abundant biowaste which can be easily found in the Greek countryside. The high concentration of SiO2 in rice husk compared to other biowastes, with SiO2 comprising 96% of the inorganic compound content in the organic matrix of rice, makes it a favorable feedstock for the production of promising and cost-effective materials such as silica gel [23].
Although the aforementioned biowastes are not toxic, their management is not particularly environmentally friendly. While several extensive articles have reported on the physical and chemical characteristics of biochar obtained from spent coffee grounds [24,25] and rice husk [26], limited literature is available on the physicochemical characteristics of biochar derived from Greek coffee sediment, grape seeds after wine production, and grape seeds after distillation for tsipouro production.
From the above, it is obvious that biochar sorbents produced from biowastes satisfy the principles of circular economy concept, resulting in useful low-cost materials with significant environmental applications. The aim of the current study was to investigate the influence of various types of biowaste on biochar physicochemical and sorptive characteristics in a water purification context. Biochar samples obtained from five biowaste materials, processed via pyrolysis under a limited oxygen atmosphere, were studied. These biowastes, besides their different origin, also underwent different treatments. Rice husk and grape seeds for wine production underwent only mechanical treatment, Greek coffee sediment and grape seeds from tsipouro production underwent strong boiling, and espresso coffee grounds underwent instant contact with hot water. The main objectives of this study are: (a) evaluation of the biochar yield from each raw material, (b) comparison of the physicochemical properties of the different raw materials and biochar samples produced, and (c) investigation of the methylene blue (MB) sorption capability of the studied materials. MB was selected as a probe water pollutant representing cationic dyes found in the effluents of textile industries.
This study aims to increase sustainability and targets different United Nations Sustainability Development Goals (SDGs). It will positively affect SDG 6: Clean Water and Sanitation by improving the index related to anthropogenic wastewater that receives treatment. It also targets SDG 16: Life on Land by sustainably using terrestrial ecosystems, and not for disposing biowaste. SDG13: Climate Action is also targeted, specifically through not allowing the production of CO2 emissions resulting from the degradation of biowaste in disposal sites.

2. Materials and Methods

Material production. Spent coffee grounds (SCG) and sediment from Greek coffee (SGC) were obtained from a coffee shop located on the campus of the University of Patras, Greece. Grape seeds after wine production (GSW) were obtained from Patraiki winery, Patras, Greece. Grape seeds after distillation for tsipouro production (GST) were obtained from a local distillery in the region of Patras, Greece, and rice husk (RH) was sourced from Agrino Company, Agrinio, Greece. The raw materials were oven dried in a Memmet oven at 50 °C for several hours until the moisture was removed and the constant weight of the solid was obtained. The method for biochar production was based on Manariotis et al. [4]. Dried samples were weighed and placed in a custom-made ceramic saggar box, closed with a cap to prevent oxygen from entering the vessel, and pyrolyzed at 850 °C for 1 h in a large electric furnace with a heating range of 30–3000 °C (Type Nabertherm, Controller B 180, Lilienthal, Germany). The pyrolysis temperature of 850 °C for biochar production using several forms of biowaste was chosen according to previous studies [4] to achieve the highest specific surface area (SSA) of biochar. Produced biochar was weighed and yield was calculated according to Equation (1):
Biochar yield (%) = (mass of biochar/mass of dry raw material) × 100%
Ash content. The measurement of ash content was conducted using a standard method based on the findings of Kalaitzidis et al. [27]. For each of the examined samples, 1 g of sample was taken into a pre-calcined crucible for calcination at 750 °C in a furnace for 2 h. The crucible was then cooled to room temperature and reweighed. The ash content was calculated based on the Equation (2):
ash (%) = (mass of ash (g)/dry mass of sample (g)) × 100%
To check the reproducibility of the results, duplicate samples were run.
X-ray diffractions (XRD) analysis. X-ray diffraction examination was performed on the materials studied, and the corresponding patterns were recorded in a 2θ range of 5–70° using a Bucker D8 Advance Diffractometer equipped with a nickel-filtered Cu Kα (1.5418 Å) radiation source. XRD analysis was performed to investigate any possible crystal phase in the materials.
Thermo-gravimetric analysis (TGA). A thermo-gravimetric analyzer was used to reveal the weight loss characteristics of biochar. For each material, 7 mg of powdered sample was heated at a heating rate of 20 °C·min−1 from room temperature to 1000 °C in a Perkin Elmer, Diamond TGA/DTA instrument. To check the reproducibility of the results, duplicate samples were run.
SEM analysis. Morphology visualization, along with the elemental composition of samples, were examined at different magnifications with a JEOL 6300 (SEMJEOL JSM6300, Tokyo, Japan) equipped with an X-ray energy dispersive spectrometer accessory. Photomicrographs were taken in the range of 1.36 to 27.08 K X magnification.
Surface area and porosity. The determination of the specific surface area (SSA), the external surface area, the pore volume, the micropore volume, and the average pore size for each sample was performed using N2 adsorption−desorption isotherms recorded in a Micromeritics TriStar 3000 Analyzer system. Before analysis, the raw materials were degassed at 60 °C under mild nitrogen flow for 2 h, and biochar was degassed at 300 °C under mild nitrogen flow for 1 h.
Suspension pHeq. The suspension pH (pHeq) of raw materials and produced biochar samples was measured according to Manariotis et al. [4]. Approximately 20 mL of an electrolyte solution containing 0.1 M NaNO3 (pH = 7.0) and 0.32 g of each sample were placed in 40 mL glass bottles. The suspension pH of the supernatant was measured after 24 h using a portable multi-parameter pH-meter (Consort C862) equipped with a glass electrode. To calibrate the glass electrode, two different pH buffer solutions, with pH equal to 7.00 ± 0.02 and 4.00 ± 0.02 at 25 °C, were used.
Functional group analysis. The chemical characteristics of the raw materials and produced biochar were identified using a PerkinElmer FTIR spectrometer. Approximately 0.5 mg of dried sample and 50 mg of dried KBr were mixed and turned into a pellet. The wavenumber measurement range was 4000–400 cm−1 and was analyzed by IRSearchMaster 6.0 software.
Sorption tests. Methylene blue (MB) solutions were prepared in synthetic freshwater based on Karapanagioti et al. [28]. Approximately 44 mg·L−1 of CaCl2·2H2O, 14 mg·L−1 of CaSO4, and 17 mg·L−1 of NaHCO3 were added to 4 L of deionized water to adjust the ionic strength and salinity of the solution. MB adsorption experiments were carried out in 40 mL glass vials. A stock solution of 20 mg·L−1 of MB was prepared in synthetic freshwater. About 3 mg of each sorbent (raw materials and biochar samples produced) were placed into the glass vials, and MB stock solution was added. Blanks were also prepared containing only the MB stock solution without sorbent. For all samples, measurements of the aqueous concentration were taken after 24 h and at various time periods up to 137 days for some samples. All samples and blanks were prepared in triplicates.
Aqueous MB concentration was determined by a HACH DR/2400 portable spectrophotometer (Loveland, CO, USA), using a cuvette of 1 cm at 670 nm. The amounts of MB sorption for the tested samples were calculated by Equation (3):
q t = ( C o C t ) × V m
where qt (mg·g−1) is the sorption capacity of the solid at sampling time t, Ct (mg·L−1) is the aqueous concentration of MB at sampling time t, Co (mg·L−1) is the initial aqueous concentration of MB (determined by the blank sample to account for possible method MB losses), also measured at time t, V (mL) is the volume of the MB stock solution used, and m (g) is the sorbent mass added in the vials of 40 mL.
In the current study, the MB adsorption kinetics were well described by a pseudo-first order Equation (4):
d q d t = k 1 × ( q e q t ) ln ( q e q t ) = ln q e k t
where k1 is the constant of the pseudo-first-order rate (min−1), qt is the amount of MB adsorbed per mass of sorbent at time t (mg·g−1), and qe is the amount of MB adsorbed per mass of sorbent at equilibrium (mg·g−1).

3. Results and Discussion

3.1. Material Moisture, Ash Content and Biochar Yield

The moisture contents of the raw samples, which were calculated by subtracting the mass after initial drying at 50 °C from that before drying, are listed in Table 1. The moisture contents ranged from 4 to 63%. The highest percentage of moisture was detected in the SCG sample (63%), while the GSW and GST samples showed approximately the same moisture percentage (20% and 18%, respectively). SGC had a moisture content of 11%, and rice husks had the lowest moisture content (4%).
Pyrolysis temperature and inorganic content are considered parameters which crucially affect biochar yield [29] and ash content [30,31]. Table 1 shows the percentages in mass yield of biochar obtained from the pyrolyzed dry materials. These range from 6.8 to 28%. The highest biochar yield was 28%, and corresponded to RH. The yield order for the studied biochar from the highest to the lowest value is: RH > GSW > GST > SCG > SGC. The yield of biochar is strongly interrelated both with the percentage of inorganic mater (ash) and the thermal degradation of cellulose, hemicellulose, and lignin found in the structure of the materials [32]. If the biochar yield is calculated on the basis of the initial raw biomass (before drying), it is less (3.6–27%), as expected, but there is not any linear correlation with the moisture content.
Yargiloglou et al. determined the physicochemical properties of biochar obtained from logging residues and found that an increase in ash content is strongly correlated with the presence of polycyclic aromatic hydrocarbons (PAHs) and metals detected in biochar [33]. The low ash content of biochar is related to the small amount of metals found in the carbonaceous materials [34,35]. Table 1 shows that, with the exception of RH, the raw materials used had relatively low ash content (≤13%). It is well known that RH contains a significant fraction of SiO2, explaining the high ash content (60%) determined (Table 1). Dawei et al. used a rice husk-based SiO2/C composite to increase the performance of lithium batteries and found that the treatment of this composite material with a high concentration of alkaline solution (NaOH) led to a decrease in silica content, which was followed by a reduction in ash content of the tested sample [36]. It is obvious that the high pyrolysis temperature (850 °C), as well as the proportion of inorganic matter contained in each material, play a decisive role in the ash content of the biochar samples [30,31].

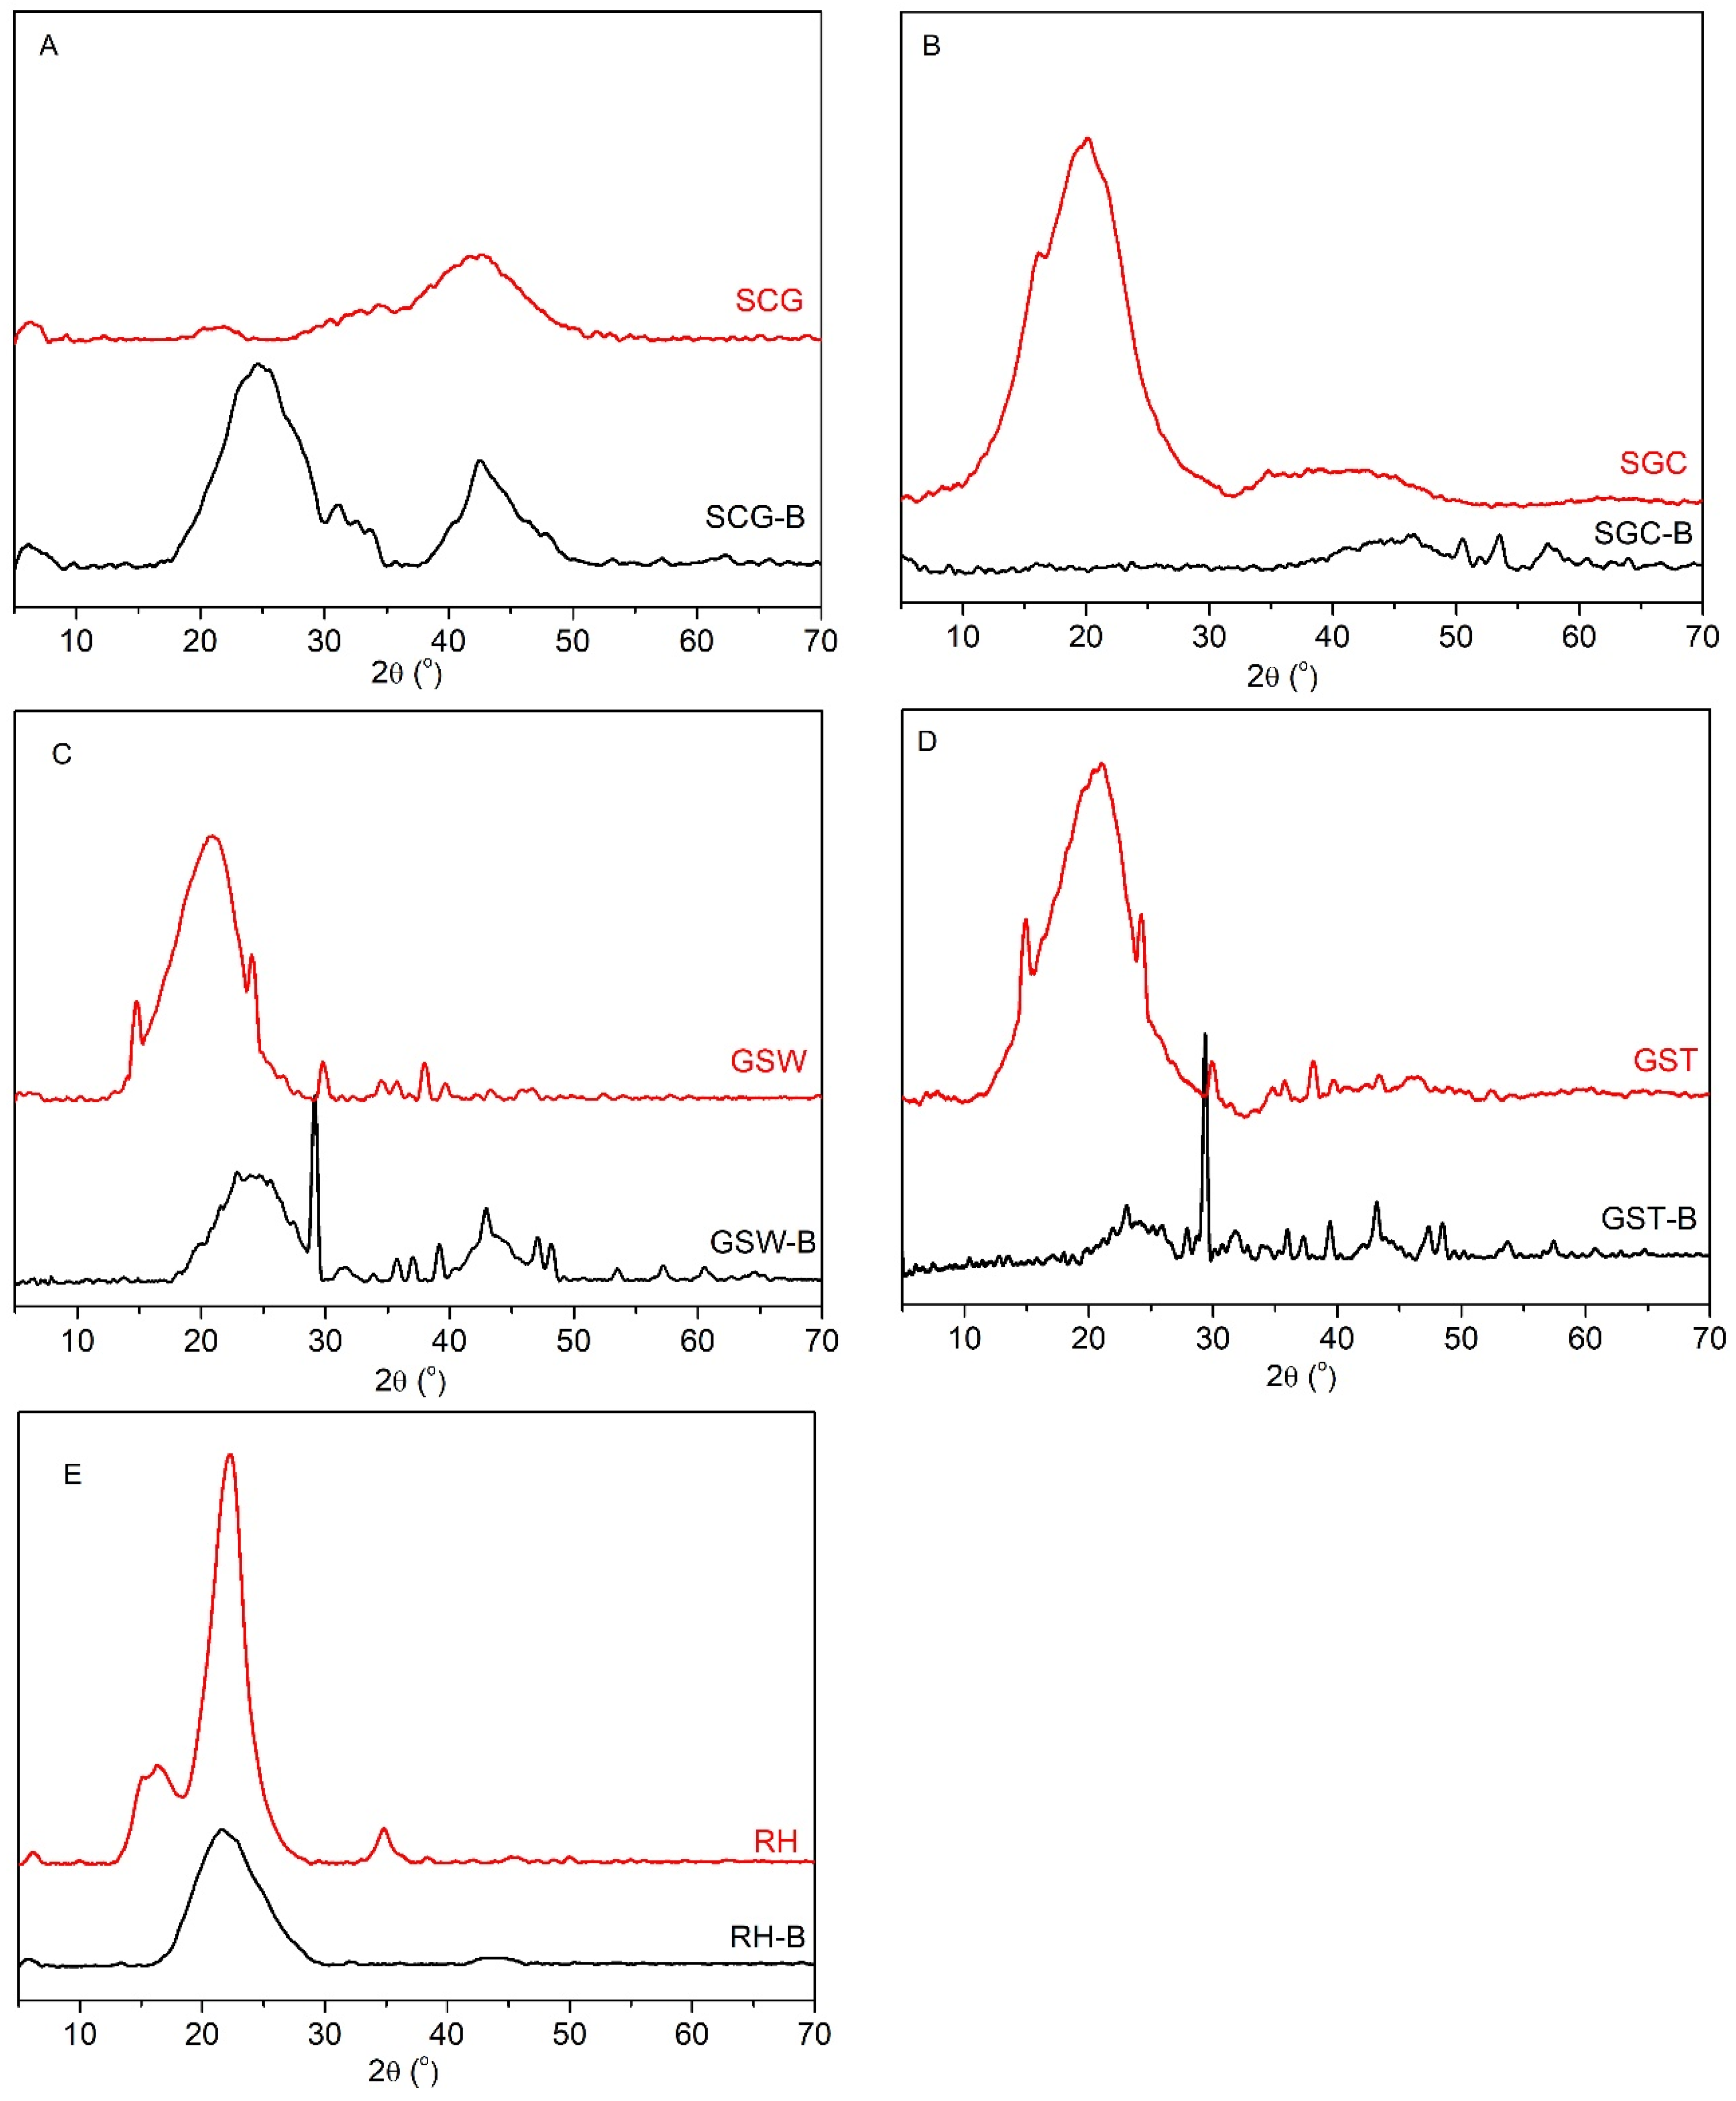
3.2. Material Structure

The XRD patterns of the raw materials studied, and the corresponding biochar products, are presented in Figure 1. In general, two wide peaks in the 2θ ranges at 20–30° and 35–45° (with exception of GSW, GST, and RH) were observed in the XRD patterns of raw materials, which is indicative of their cellulosic nature and low crystallinity [37]. In the XRD patterns of the biochar samples, these peaks were shifted towards slightly higher 2θ angle values, indicating the formation of a graphitic phase involving carbon species with sp2 hybridization [38,39].
More precisely, Figure 1A indicates that the SCG is almost amorphous. The observed XRD peaks at around 25° and 43° in the SCG-B pattern indicates that the obtained biochar was a typical carbonaceous material with porous structure produced via the disintegration of lignin, cellulose, and hemicellulose. Figure 1B shows that biochar produced through the pyrolysis of SGC is a completely amorphous material. Figure 1C,D show that the biochar produced via pyrolysis of grape seeds exhibited the characteristic XRD patterns of biochar with lignocellulosic origin. An inspection of these patterns revealed that additional sharp peaks appeared at 2θ: ~30 (strong), 36, 39.4, and 43.1°, which correspond to calcite (CaCO3) crystallites [40] and could be related to strong bonding between condensed carbon with Ca salts or SiO4 [41]. This is in agreement with the elemental analysis (EDS) of the GSW-B and GST-B samples, indicating the existence of Ca and Si in them (Table S1). Figure 1E shows that the XRD pattern of RH presented peaks at 12, 15, and 21o, revealing the presence of crystalline cellulose and some five carbon sugars [42]. The XRD pattern of pyrolyzed RH (RH-B) was quite different, exhibiting a broad peak in the 2θ range 20–30°, which is characteristic of biochar of lignocellulosic origin. This peak was deconvoluted into two peaks centered at 20 and 25°; the first one was attributed to the SiO2 contained in RH-B [43], and the second to the carbonaceous material in biochar.

3.3. Raw Materials Pyrolysis and Thermal Stability of Biochar

The results of the thermogravimetric (TG) analyses of raw materials used for biochar production are presented in Figure 2A. In all cases, raw materials lost mass at two distinct temperature ranges. At low temperatures (<200 °C), the mass loss was attributed to the removal of moisture and volatile compounds. A dramatic mass loss was observed in the range 350–500 °C and was attributed to the degradation/pyrolysis of lignocellulosic matter, followed by a slight mass loss up to 1000 °C due to further degradation [8]. An inspection of Figure 2A shows that the mass loss upon TG analysis of raw materials increased in the following order: SGC > SCG > GST > GSW > RH. As is expected [44], this order is the inverse of that based on the ash content of the raw materials (Table 1), indicating that mass loss was mainly determined by the pyrolysis of the organic fractions of raw materials.
TG analysis of biochar samples produced revealed that a significant mass loss took place at low temperatures (lower than ~250 °C), while mass declined slightly at higher temperatures (Figure 2B). The initial mass loss observed can be attributed to the removal of the moisture that was adsorbed on the biochar surface upon their storage. This agrees with the fact that the mass loss of biochar in the aforementioned area follows the same trend as that followed by their SSA and pore volume (see Table 2). The relevant stability of the samples at higher temperatures (up to 600 °C) was expected because of their thermal pretreatment (pyrolysis) at even higher temperatures (850 °C).

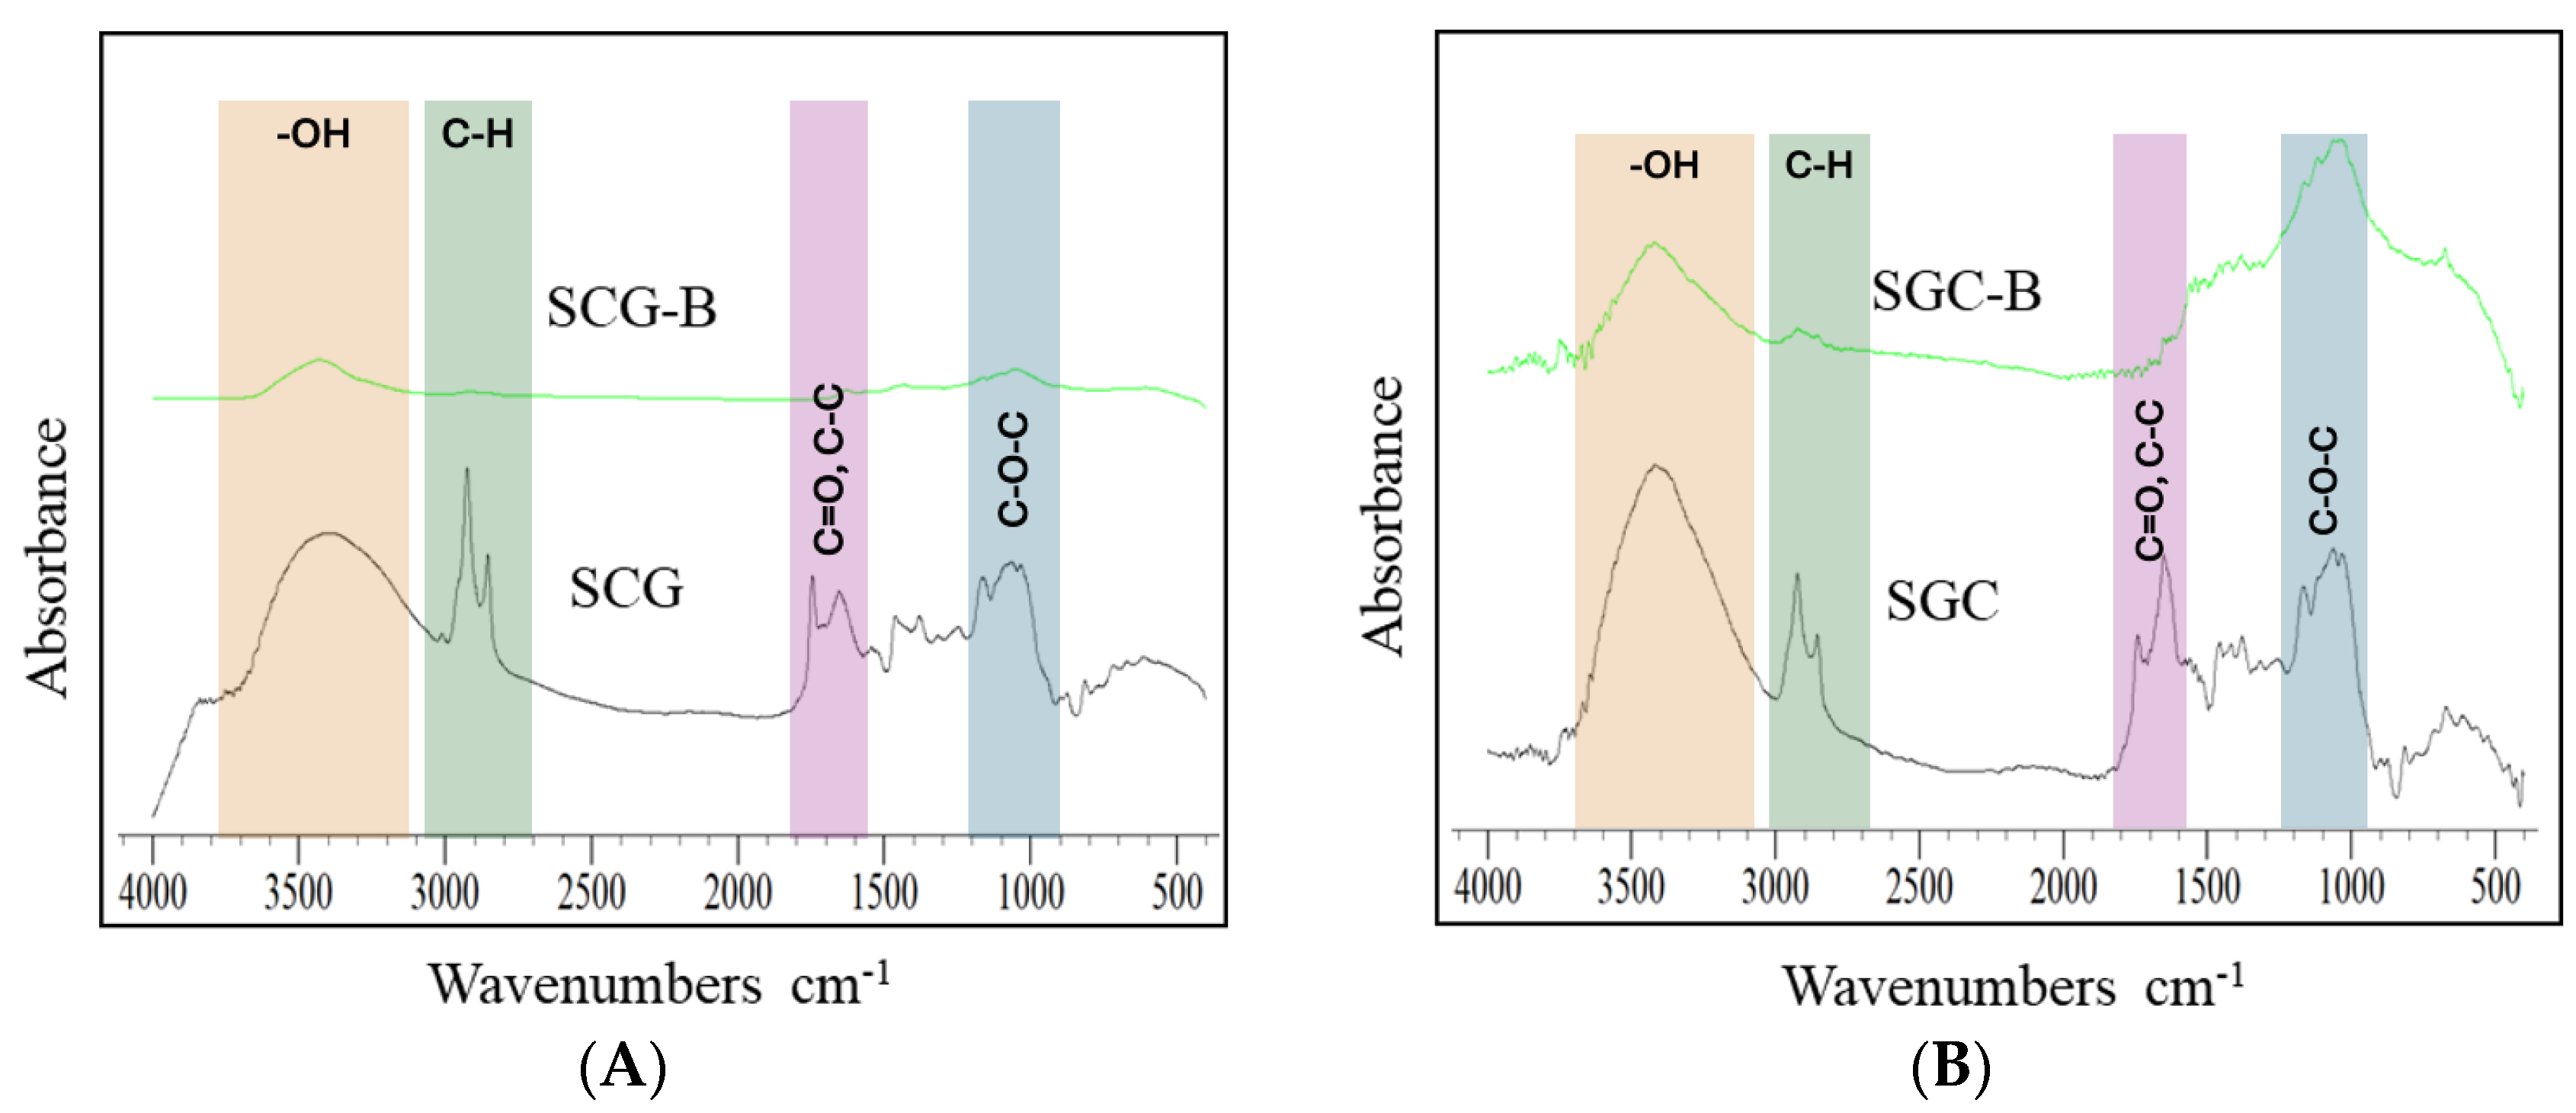
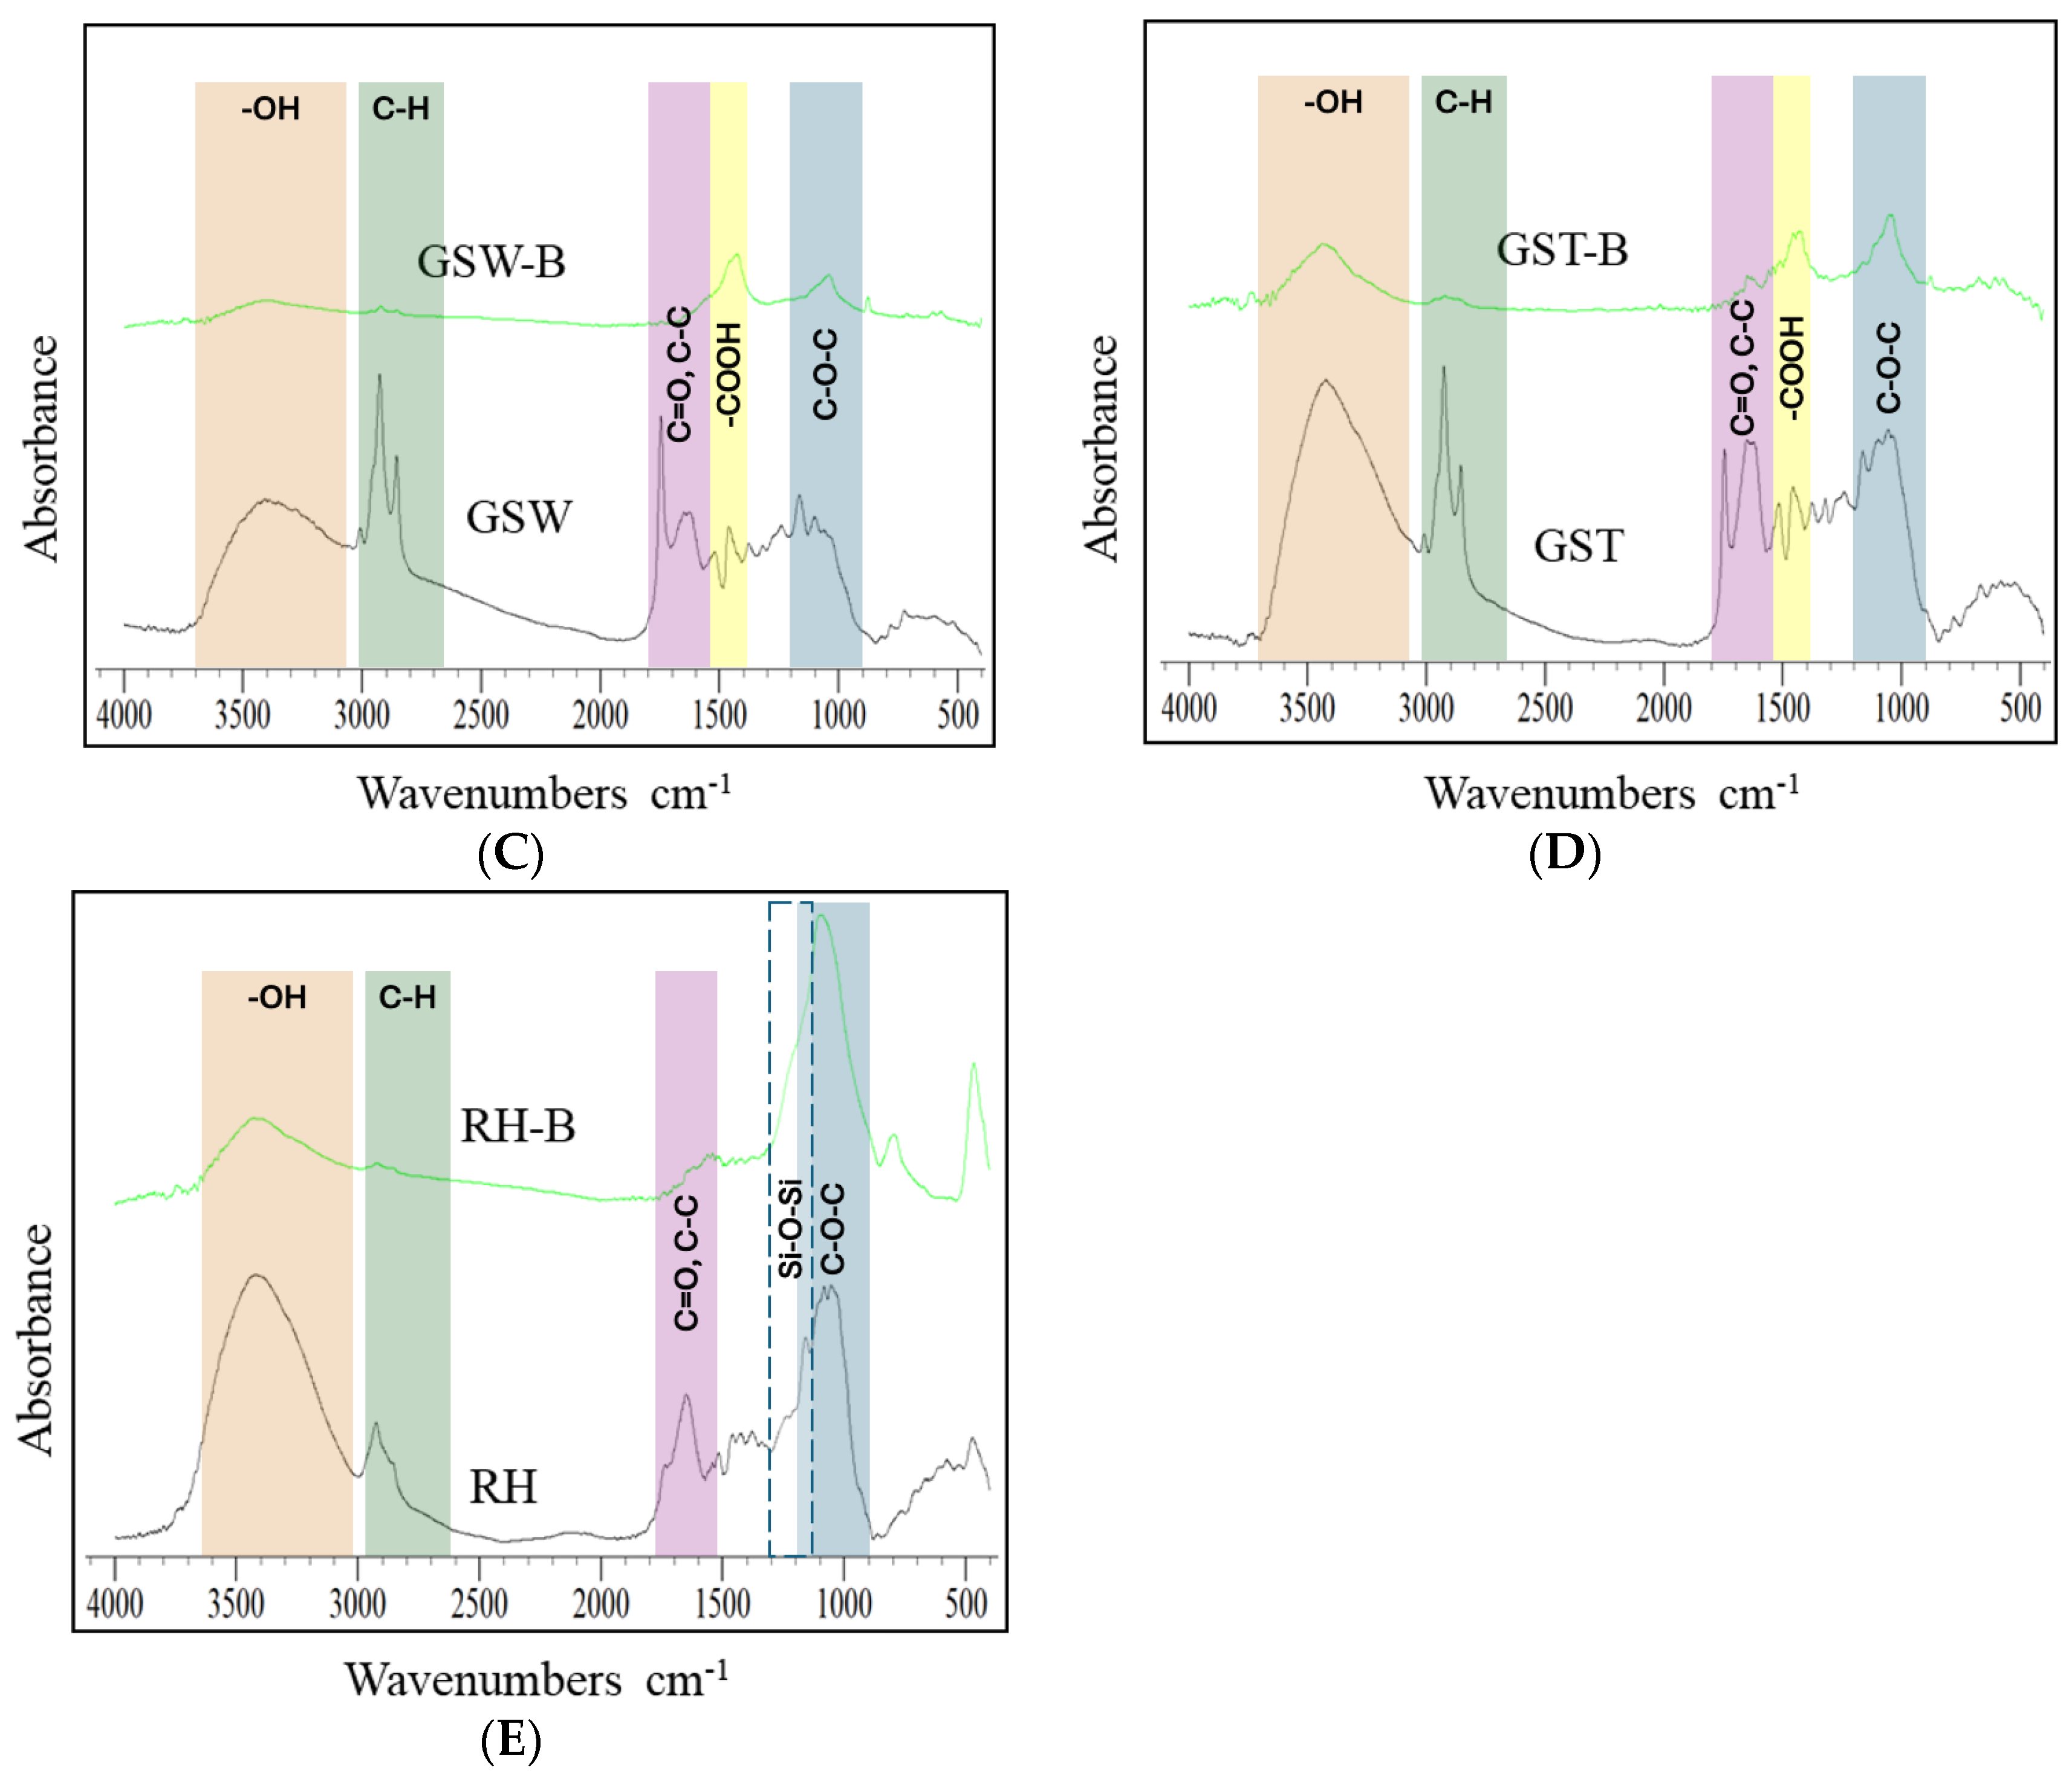
3.4. Chemical Characteristics

Figure 3 shows the FTIR spectra of raw materials and the corresponding biochar samples. The raw materials spectra present several peaks assigned to various functional groups.
The peaks between 3400 and 3600 cm−1 indicated the presence of –OH groups on both raw materials and biochar. The raw materials spectra presented peaks at 2855 and 2920 cm−1 that corresponded to aliphatic C–H stretching, attributed to the hemicellulose and cellulose components. Peaks appearing near 1740 cm−1 were attributed to C=O stretching vibration, indicating the existence of esters, carboxylic acids, and ketones [45], while peaks at 1590–1650 cm−1 were assigned to aromatic C=O and C–C stretching associated with the lignin fraction of raw materials [46]. Peaks appearing in the region 900–1200 cm−1 were considered characteristics of C–O–C and C–O ring vibrations in various polysaccharides [47].
The aforementioned peaks either decreased or totally vanished in the corresponding biochar spectra [48]. Fu et al. studied the FTIR spectra of biochar samples produced at temperatures higher than 600 °C and claimed that the adsorption bands recorded indicated the existence of mainly aromatic and ether structures [49].
The FTIR spectra of the biochar samples studied were quite similar. An absorbance peak in the range 1000–1100 cm−1, which predominated in all spectra, was attributed to C–O–C stretching vibration [48]. The highest intensity of this peak was observed in the FTIR spectrum of the RH-B sample. In this case, an overlap of the aforementioned absorption with the asymmetric Si–O–Si stretching could have taken place due to the high silica content of RH [50]. Absorbance peaks in the ranges 1400–1500, 1500–1550, 1580–1650, and 3200–3600 cm−1 were assigned to the presence of –COOH, –N–O, –N–H, and –OH groups, respectively [51].

3.5. Morphology of the Samples

Figure S1 presents the obtained SEM micrographs of the raw materials and biochar samples. These micrographs show that upon pyrolysis at 850 °C, the relatively smooth surface of raw materials was transformed and became rough due to pore formation. Table S1 presents the EDS semi-quantitative elemental analysis of the materials studied. As was expected, in all cases, C and O were the predominant elements. Ca, Mg, K, and Si existed as elements in most of the samples, while Na and Al were detected in the GST-B sample. Pyrolysis provoked a decrease in the oxygen content, thus increasing the weight percentage of the remaining elements.

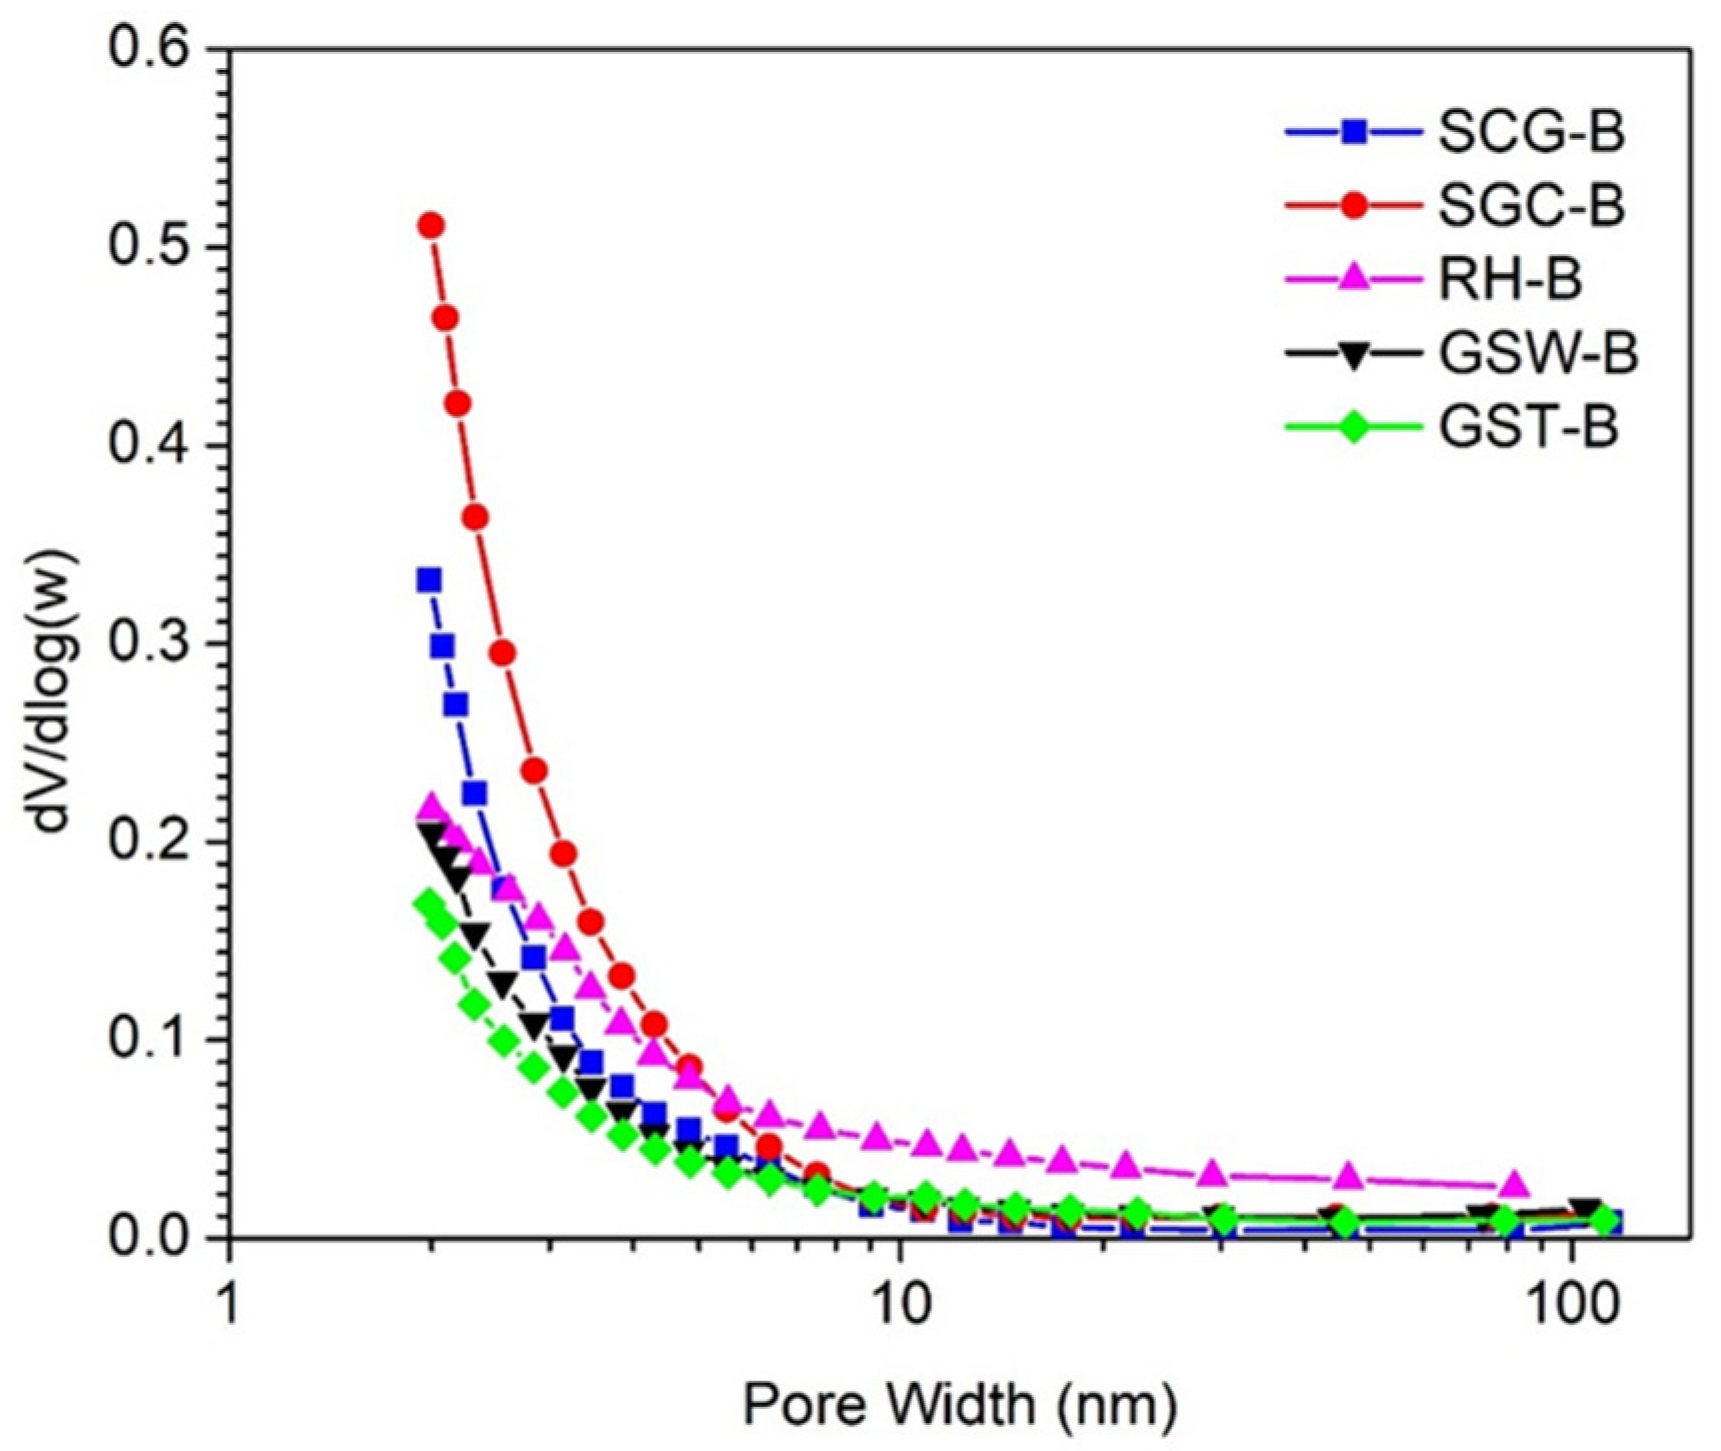
3.6. Biochar Surface Area and Porosity

N2 adsorption-desorption isotherms recorded at liquid nitrogen temperature were used to study the texture of the raw materials and biochar samples obtained (Figure S2).
Table 2 displays the values for the textural characteristics of biochar samples. Although the raw materials used had very low SSAs (<0.53 m2·g−1) and almost no pores (Figure S1), their pyrolysis for 1 h at 850 °C resulted in biochar samples with high total SSAs (367–870 m2·g−1). The t-plot analysis of N2 adsorption data revealed that the main part of their surface was inside of micro-pores (pore diameter lower than 2 nm, SSAMicro), representing percentage values in the range of 62–78% of SSA. Similarly, the specific volume of micro-pores corresponded to 47–71% of the specific pore volume. The mean pore diameter of biochar samples was in the range of 3.1–4.3 nm.
A more detailed picture of pore size can be obtained by inspecting Figure 4, which shows the pore size distribution curves of the biochar samples studied. It is obvious that all biochar samples were mainly microporous materials, especially those produced from coffee residues (SGC-B and SCG-B).
It is well known that the volatile matter of biomass is removed during the pyrolysis procedure, creating pores that increase thus the surface area of the biochar [52]. In addition, the destruction (dehydration and deoxygenation) of the carbohydrate, aromatic, and phenolic components of biomass causes a further increase in the porosity and SSA of the obtained biochar [53]. Manariotis et al. reported that the SSA of biochar obtained from malt spent rootlets at a high pyrolysis temperature gradually increased according to the development of a microporous structure [4]. Bonelli et al. stated that the pyrolysis of Brazil shell nuts at a high temperature produced biochar with high SSA, and as the temperature increased, micropores came to comprise most of the pore volume [54].

3.7. Suspension pHeq

The pHeq values for the raw materials suspensions were in the range 5.5–7.0 and shifted to higher values for the produced biochar samples (Table 1). The high biochar pHeq values are concomitant with the biochar ash content, and could be explained by the volatilization of the –COOH and –OH functional groups and the simultaneous condensation of alkali and alkaline macronutrient (Na, Mg, K, Ca) salts or oxides that took place upon pyrolysis [55]. It should be stressed that the high pHeq values (9.4–10.7) of biochar are not favorable for the electrostatic adsorption of cationic MB.

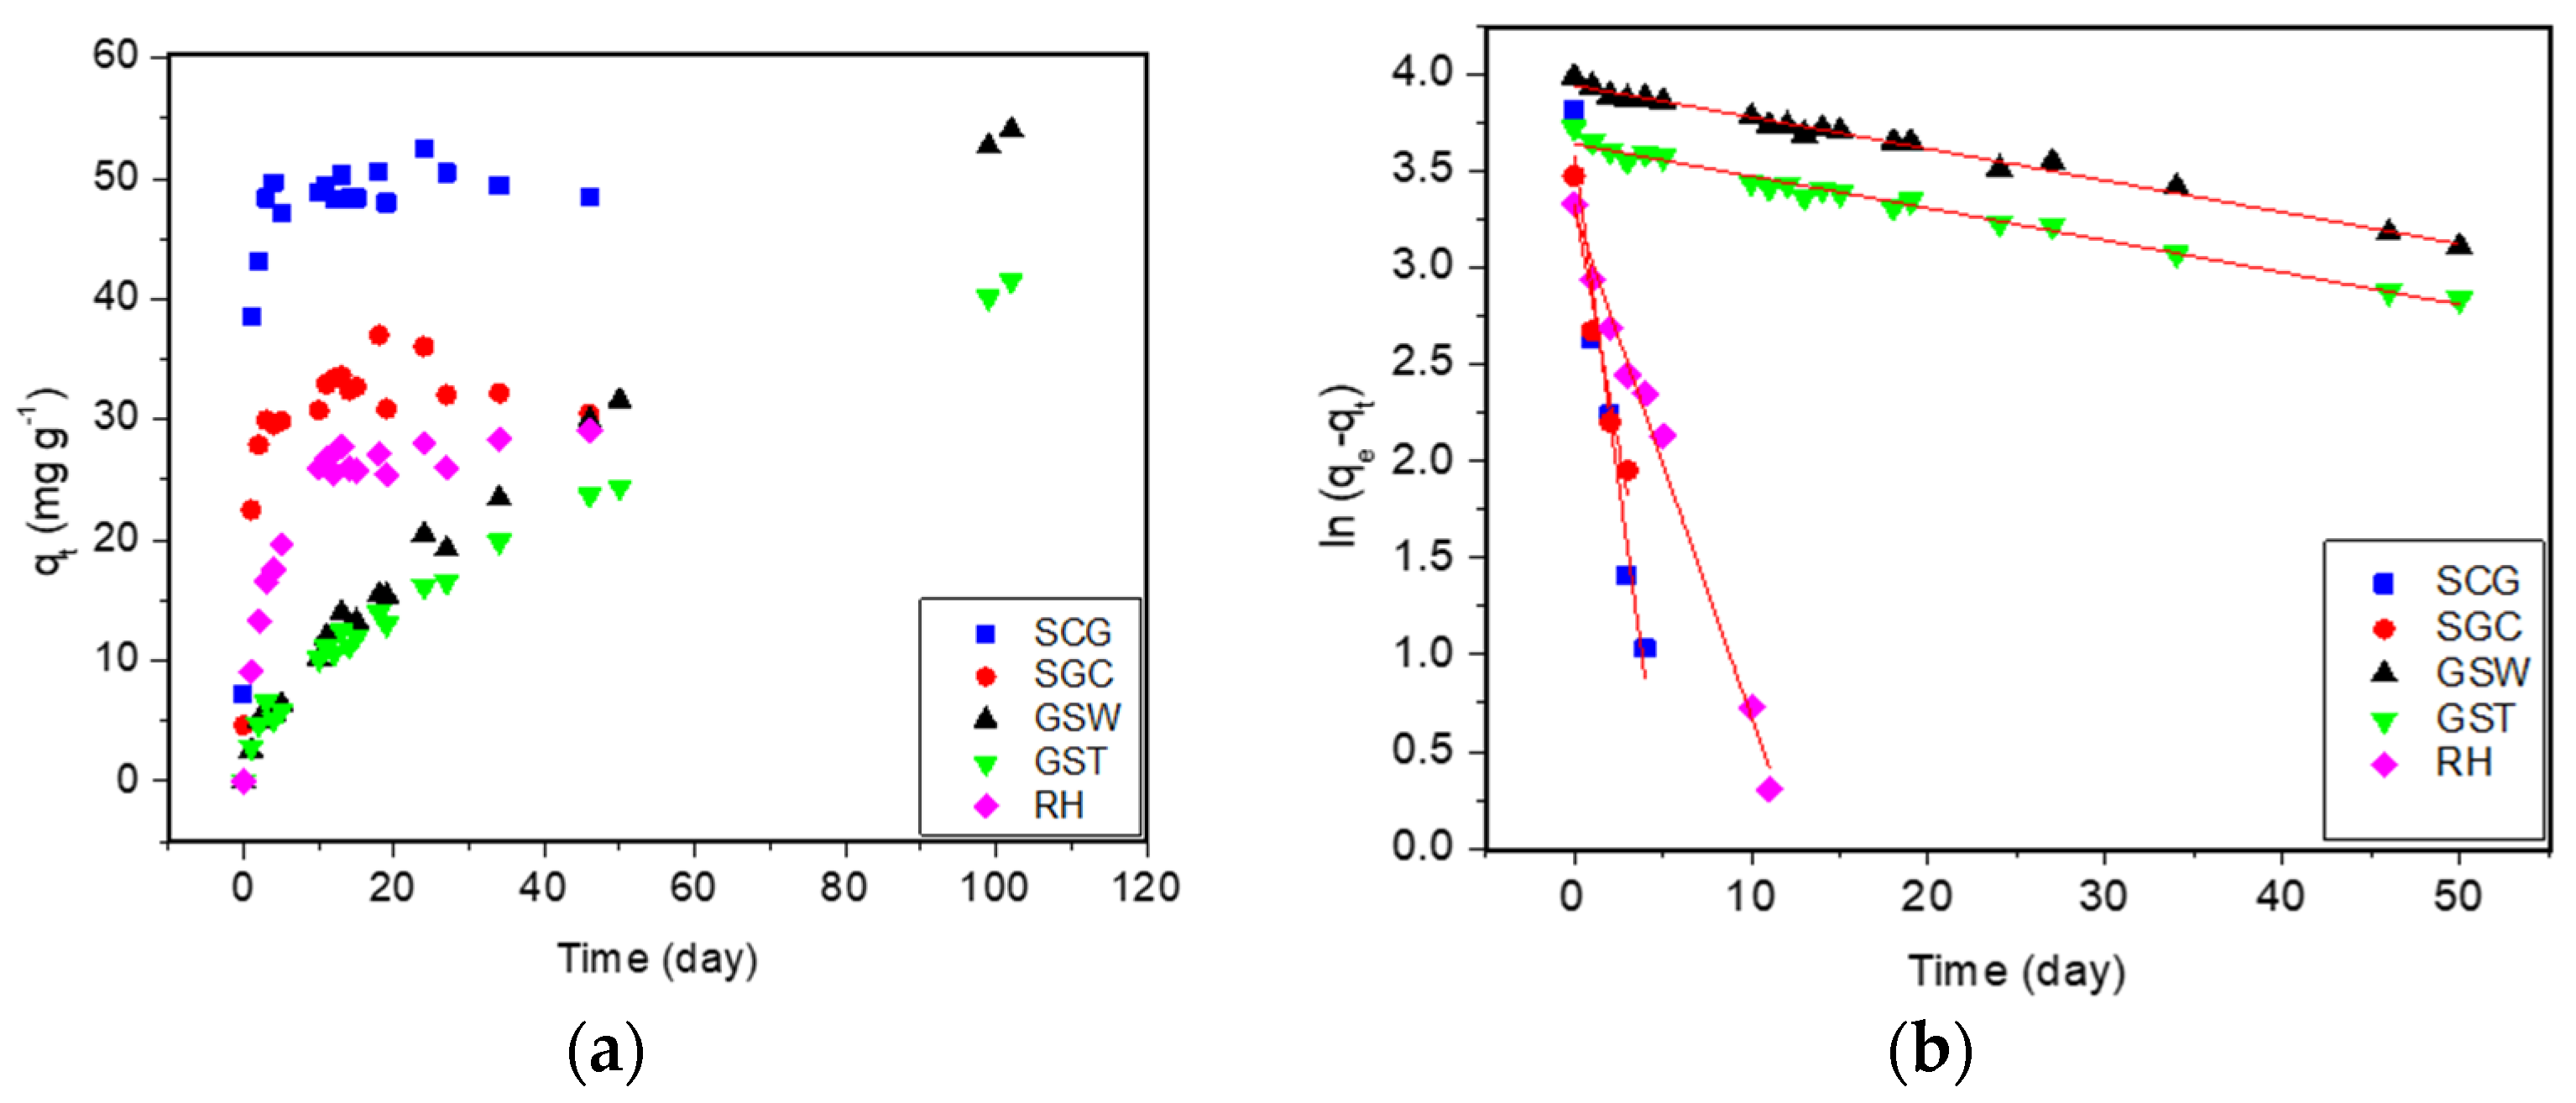
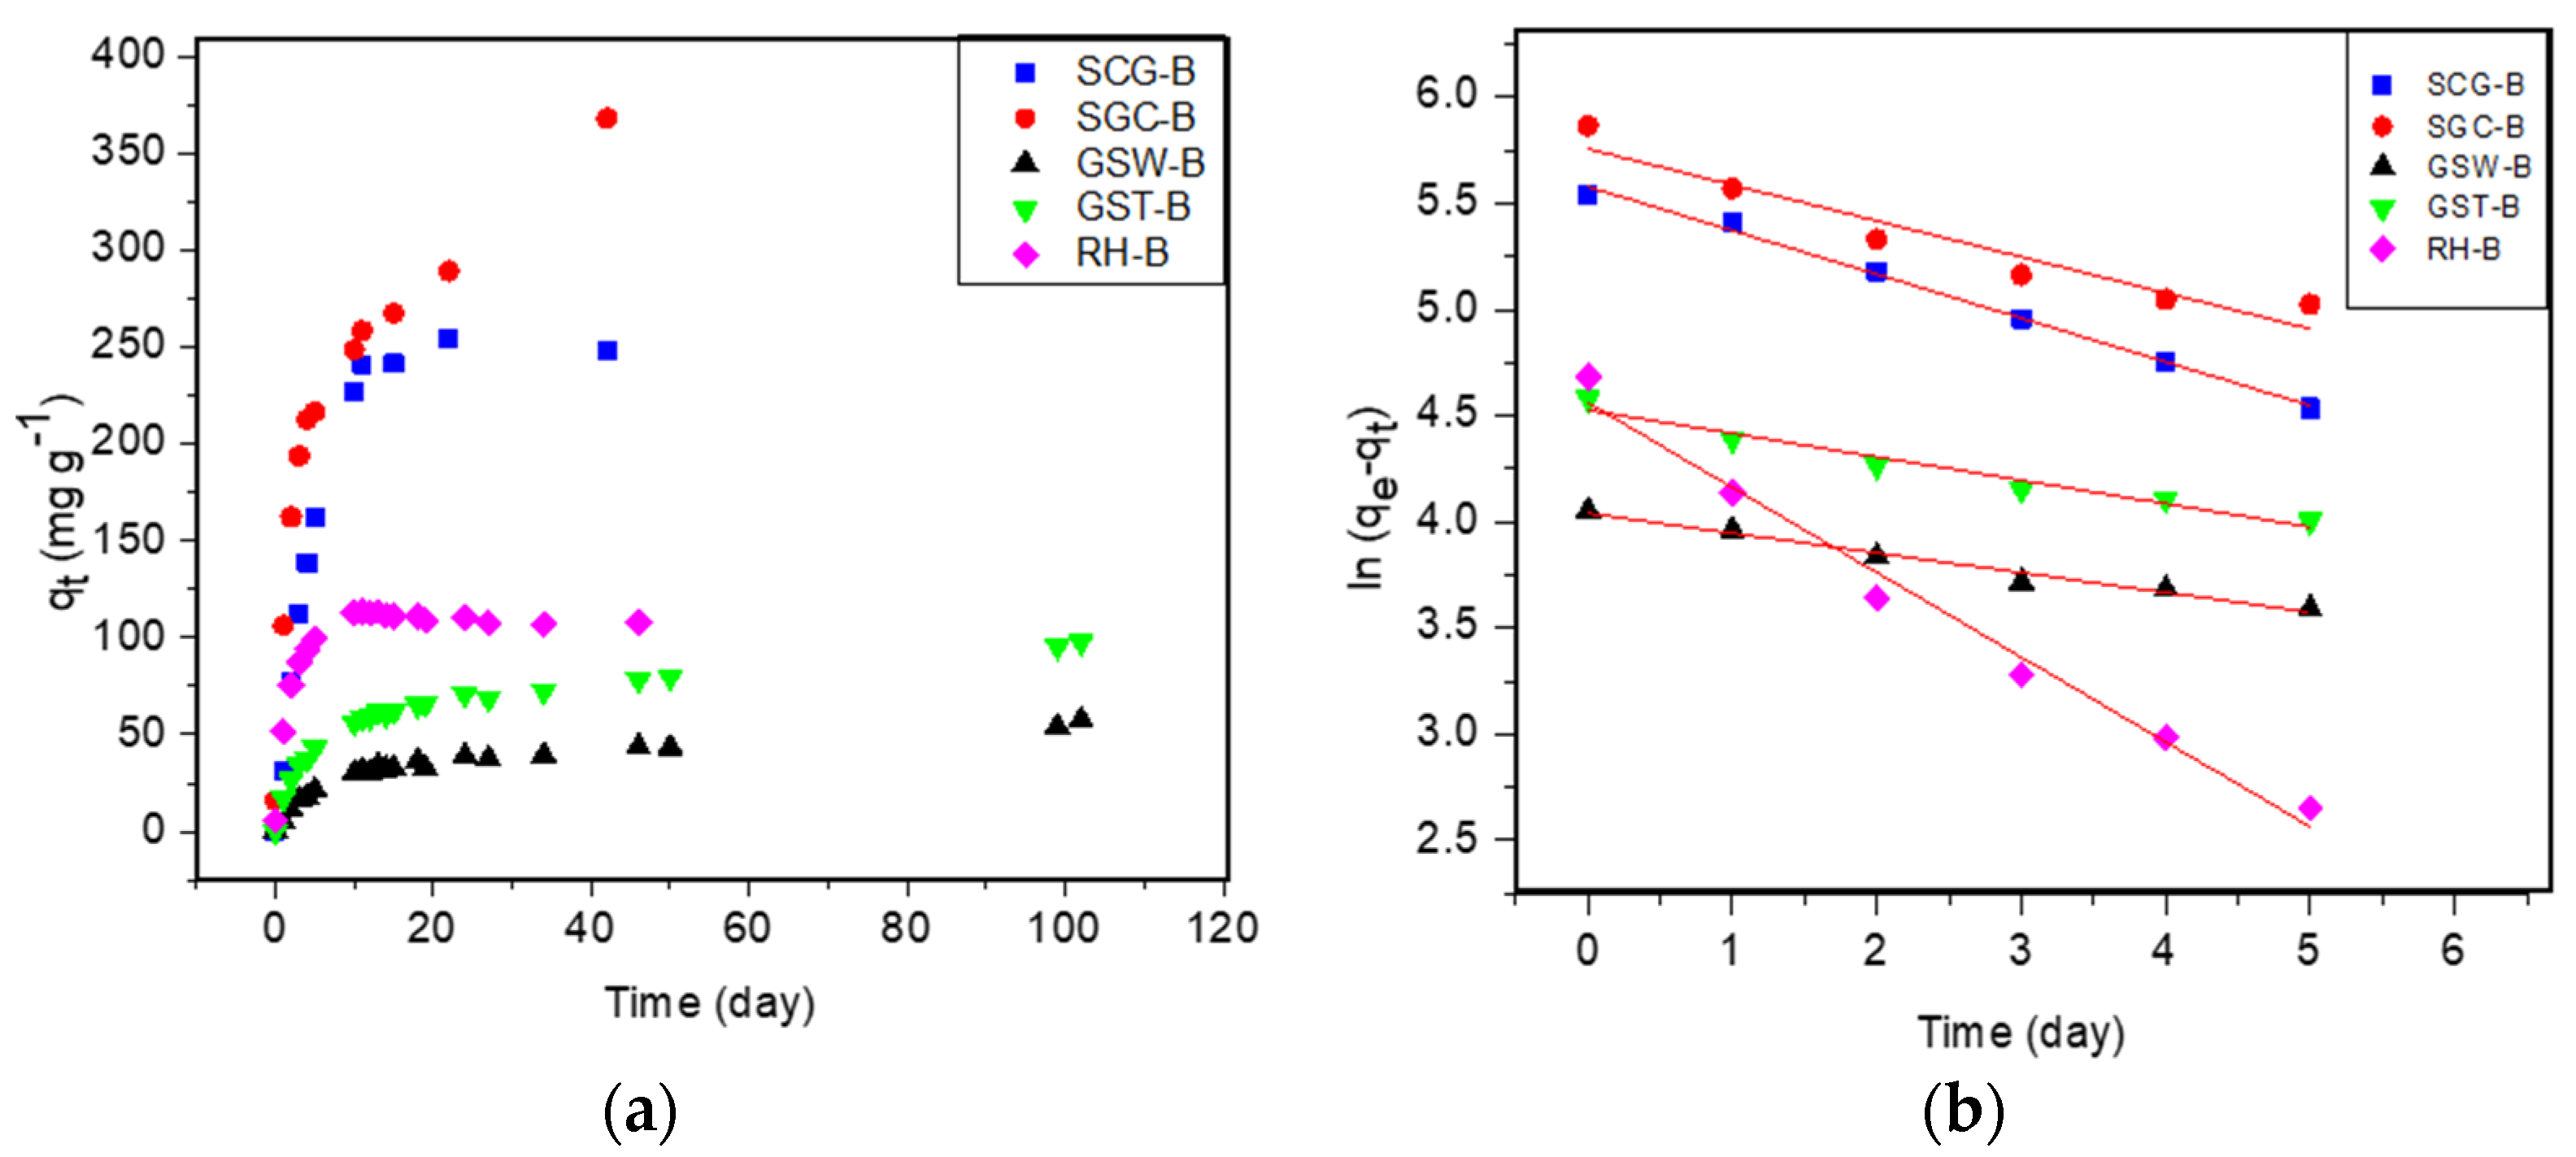
3.8. Methylene Blue Sorption

Figure 5a shows the MB sorption data collected using the raw materials as sorbents. Inspection of this figure indicates that SCG, SGC, and RH reached their equilibrium sorption capacity in less than 10 days. In contrast, grape seeds (SGW and SGT) did not reach an equilibrium plateau, even after 102 days. This slow sorption of MB observed in the latter materials could be attributed to their small external area and significantly greater mean particle size (~2.5 mm) in comparison with the remainder of the raw materials (<0.5 mm). However, in all cases, the sorption efficiency of the raw materials studied was low (<60 mg·g−1). This finding could be easily correlated with the low SSA (<0.53 m2·g−1) of these materials. Figure 5b shows that in all cases, sorption kinetics could be described quite well by adopting a pseudo-first order kinetic model.
Table 3 compiles the kinetic constant values calculated, the theoretical and experimental equilibrium sorption capacity values determined, and the R2 values of the straight lines fitted to the experimental data. The values of the latter parameter confirm the fairly good fit of the kinetic results to the pseudo-first order kinetic model. The k1 values calculated for the adsorption of MB on biochar samples produced from coffee residues are lower than those calculated using the corresponding raw materials as sorbents. This is not the case for the rest of the materials studied. One could attribute this different behavior to the low mean pore diameter (3.1 nm) of the first biochar samples, which probably retarded the MB mass transfer inside the pores. In contrast, the rest of the biochar samples exhibited higher mean pore diameters (3.8–4.1 nm), associated with lower mass transfer resistance, and thus higher k1 values, than those of the corresponding raw materials. The rate of MB sorption in grape seeds was very slow (0.02 day−1). However, these seeds exhibited final MB capacity values (qe exp final) among the highest determined. This could be due to the slow absorption of MB inside the mass of the seeds.
Figure 6a shows the MB adsorption data on the surfaces of the biochar samples studied. All biochar samples reached adsorption plateau within the first ten days, except the SGC-B, for which sorption seemed to continue with a different slope.
Figure 6b reveals the good fitting of adsorption experimental data with the pseudo first-order kinetic model adopted. The slopes of corresponding straight lines were used for the calculation of adsorption rate constant values (k1).
Table 3 shows that, except for SGC-B, for the rest of biochar samples studied, the adsorption capacity values (qe) predicted by the pseudo first-order kinetic model were close to the values measured at the end of the corresponding test (qe final exp). In the case of the SGC-B, the latter value measured was higher than predicted. This can be attributed to the high SSA (870 m2·g−1) of SGC-B, of which 67.5% was located in micro-pores (Table 2). This explains the slow second sorption step observed after the first ten days due to slow diffusion phenomena.
Summarizing the MB sorption efficiency of the materials tested in this study, it should be noted that: (i) the raw materials had low MB sorption capacity, ranging from 29 to 54 mg·g−1, and (ii) the biochar derived, with exception of GSW-B (58 mg·g−1), exhibited remarkable MB sorption efficiency, ranging from 99 to 370 mg·g−1. Similar values were reported as maximum sorption capacity (qmax) in Orfanos et al. [56], which presented a summary of several references studying methylene blue sorption by biowaste (18–240 mg·g−1) and their corresponding biochar (127–132 mg·g−1). Table 3 shows also that the sorption efficiency trend followed by the biochar samples studied (SGC-B > SCG-B > RH-B > GST-B > GSW-B) is the same as that followed by their SSAExternal values, presented in Table 2. Santoso et al., reviewing recent advances in carbon-based sorbents for MB removal from wastewater, have concluded that the removal efficiency is affected more by specific surface area than the pore size of sorbents [57]. This is expected, as the adsorption of MB in such materials is physical in nature [57]. However, our results showed that the surface area of pores with a diameter higher than ~2 nm played the main role in the physical adsorption of MB by the samples.

4. Conclusions

Biochar samples obtained via pyrolysis of biowaste (spent coffee grains, sediment of Greek coffee, grape seeds remaining after wine production, grape seeds remaining after tsipouro production, and rice husk) exhibit high specific surface areas, low crystallinity, and low population of functional groups. Although these biochar samples are mainly micro-porous materials, they have a significant fraction of pores in the meso-porous range. The specific surface area of the latter pores proved very important for the physical adsorption of methylene blue from aqueous solution. The raw materials with very low SSA had low MB sorption capacity, ranging from 29 to 54 mg·g−1, whereas the biochar samples, with exception of GSW-B (58 mg·g−1), exhibited remarkable MB sorption efficiency, ranging from 99 to 370 mg·g−1. The sorption efficiency trend of the biochar samples is the same as that followed by their SSAExternal values (SGC-B > SCG-B > RH-B > GST-B > GSW-B). This study revealed that different biowastes can be transformed to biochar with interesting sorption properties, satisfying the principles of circular economy. Among the biochar samples studied, those produced from coffee residues proved very promising for MB removal from water solutions.

Supplementary Materials

The following supporting information can be downloaded at: https://www.mdpi.com/article/10.3390/su16072889/s1, Table S1: EDS elemental analysis of the materials studied; Figure S1: SEM micrographs of raw materials and biochar samples obtained. (a) SCG, (b) SCG-B, (c) SGC, (d) SGC-B, (e) GSW, (f) GSW-B, (g) GST, (h) GST-B, (i) RH, and (j) RH-B; Figure S2: N2 adsorption-desorption isotherms recorded at liquid nitrogen temperature of raw materials and biochar samples obtained [58].

Author Contributions

Conceptualization, H.K.K., A.L. and C.K.; methodology, E.K.; software, N.M. and I.N.; validation, E.K., H.K.K. and C.K.; investigation, I.N., N.M. and E.K.; resources, C.K. and H.K.K.; data curation, E.K.; writing—original draft preparation, N.M.; writing—review and editing, E.K., C.K., A.L. and H.K.K.; visualization, E.K.; supervision, H.K.K.; project administration, E.K.; funding acquisition, C.K. All authors have read and agreed to the published version of the manuscript.

Funding

We acknowledge support of this work by the project “Research Infrastructure on Food Bioprocessing Development and Innovation Exploitation—Food Innovation RI” (MIS 5027222), which is implemented under the Action “Reinforcement of the Research and Innovation Infrastructure”, funded by the Operational Programme “Competitiveness, Entrepreneurship and Innovation” (NSRF 2014-2020) and co-financed by Greece and the European Union (European Regional Development Fund).

Institutional Review Board Statement

Not applicable.

Informed Consent Statement

Not applicable.

Data Availability Statement

All data supporting the reported results can be found in the published article.

Acknowledgments

We acknowledge the contribution of V. Dracopoulos (FORTH/ICE-HT) for recording SEM images and for the EDS mapping of the materials studied.

Conflicts of Interest

The authors declare no conflicts of interest.

References

  1. Lehmann, J.; Joseph, S. Biochar for Environmental Management: Science, Technology and Implementation, 2nd ed.; Lehmann, J., Joseph, S., Eds.; Routledge: London, UK, 2015; 976p. [Google Scholar] [CrossRef]
  2. Chan, K.Y.; Van Zwieten, L.; Meszaros, I.; Downie, A.; Joseph, S. Agronomic values of greenwaste biochar as a soil amendment. Aust. J. Soil Res. 2007, 45, 629–634. [Google Scholar] [CrossRef]
  3. Yang, B.; Li, D.; Yuan, S.; Jin, L. Role of biochar from corn straw in influencing crack propagation and evaporation in sodic soils. CATENA 2021, 204, 105457. [Google Scholar] [CrossRef]
  4. Manariotis, I.D.; Fotopoulou, K.N.; Karapanagioti, H.K. Preparation and characterization of biochar sorbents produced from malt spent rootlets. Ind. Eng. Chem. Res. 2015, 54, 9577–9584. [Google Scholar] [CrossRef]
  5. Demirbas, A. Effects of temperature and particle size on bio-char yield from pyrolysis of agricultural residues. J. Anal. Appl. Pyrolysis 2004, 72, 243–248. [Google Scholar] [CrossRef]
  6. Rasa, K.; Viherä-Aarnio, A.; Rytkönen, P.; Hyväluoma, J.; Kaseva, J.; Suhonen, H.; Jyske, T. Quantitative analysis of feedstock structural properties can help to produce willow biochar with homogenous pore system. Ind. Crops Prod. 2021, 166, 113475. [Google Scholar] [CrossRef]
  7. Keiluweit, M.; Nico, P.S.; Johnson, M.G.; Kleber, M. Dynamic Molecular Structure of Plant Biomass-Derived Black Carbon (Biochar). Environ. Sci. Technol. 2010, 44, 1247–1253. [Google Scholar] [CrossRef] [PubMed]
  8. Wang, S.; Gao, B.; Zimmerman, A.R.; Li, Y.; Ma, L.; Harris, W.G.; Migliaccio, K.W. Physicochemical and sorptive properties of biochars derived from woody and herbaceous biomass. Chemosphere 2015, 134, 257–262. [Google Scholar] [CrossRef]
  9. Vakros, J. Biochars and Their Use as Transesterification Catalysts for Biodiesel Production: A Short Review. Catalysts 2018, 8, 562. [Google Scholar] [CrossRef]
  10. Shakoor, M.B.; Ali, S.; Rizwan, M.; Abbas, F.; Bibi, I.; Riaz, M.; Khalil, U.; Niazi, N.K.; Rinklebe, J. A review of biochar-based sorbents for separation of heavy metals from water. Int. J. Phytoremediation 2019, 22, 111–126. [Google Scholar] [CrossRef] [PubMed]
  11. Zabaniotou, A.; Kamaterou, P. Food waste valorization advocating Circular Bioeconomy—A critical review of potentialities and perspectives of spent coffee grounds biorefinery. J. Clean. Prod. 2018, 211, 1553–1566. [Google Scholar] [CrossRef]
  12. ICO. Annual Review. 2021. Available online: https://www.ico.org/documents/cy2022-23/annual-review-2021-2022-e.pdf (accessed on 20 April 2023).
  13. Batista, M.J.P.A.; Ávila, A.F.; Franca, A.S.; Oliveira, L.S. Polysaccharide-Rich Fraction of Spent Coffee Grounds as Promising Biomaterial for Films Fabrication. Carbohydr. Polym. 2020, 233, 115851. [Google Scholar] [CrossRef] [PubMed]
  14. Makri, E.; Tsimogiannis, D.; Dermesonluoglu, E.K.; Taoukisa, P.S. Modeling of Greek coffee aroma loss during storage at different temperatures and water activities. Procedia Food Sci. 2011, 1, 1111–1117. [Google Scholar] [CrossRef]
  15. Vieira, L.R.; Soares, A.M.V.M.; Freitas, R. Caffeine as a contaminant of concern: A review on concentrations and impacts in marine coastal systems. Chemosphere 2021, 286, 131675. [Google Scholar] [CrossRef] [PubMed]
  16. FAOSTAT. Available online: https://www.fao.org (accessed on 20 April 2023).
  17. OIV. Statistical Report on World Vitiviniculture 2019. Available online: https://www.oiv.int/public/medias/6782/oiv-2019-statistical-report-on-world-vitiviniculture.pdf (accessed on 20 April 2023).
  18. Iuga, M.; Mironeasa, S. Potential of grape byproducts as functional ingredients in baked goods and pasta. Compr. Rev. Food Sci. Food Saf. 2020, 19, 2473–2505. [Google Scholar] [CrossRef] [PubMed]
  19. Hellenic Statistical Authority (ELSTAT). Available online: https://www.statistics.gr/documents/20181/18166418/Annual+Agricultural+Statistical+Survey+%28Final+Results%29+%28+2020+%29.pdf/ba0e1942-afaf-12b2-1984-e065f6bd3d72?t=1693558783605 (accessed on 27 February 2024).
  20. Soufleros, E.H. Wine and Distillates; Papageorgiou Pub: Thessaloniki, Greece, 1987. [Google Scholar]
  21. Apostolopoulou, A.A.; Flouros, A.I.; Demertzis, P.G.; Akrida-Demertzi, K. Differences in concentration of principal volatile constituents in traditional Greek distillates. Food Controls 2005, 16, 157–164. [Google Scholar] [CrossRef]
  22. Soltani, N.; Bahrami, A.; Pech-Canul, M.I.; González, L.A. Review on the physicochemical treatments of rice husk for production of advanced materials. J. Chem. Eng. 2015, 264, 899–935. [Google Scholar] [CrossRef]
  23. Barana, D.; Salanti, A.; Orlandi, M.; Ali, D.S.; Zoia, L. Biorefinery process for the simultaneous recovery of lignin, hemicelluloses, cellulose nanocrystals and silica from rice husk and Arundo donax. Ind. Crops Prod. 2016, 86, 31–39. [Google Scholar] [CrossRef]
  24. Tala, W.; Chantara, S. Use of spent coffee ground biochar as ambient PAHs sorbent and novel extraction method for GC-MS analysis. Environ. Sci. Pollut. Res. 2019, 26, 13025–13040. [Google Scholar] [CrossRef] [PubMed]
  25. Jagdale, P.; Ziegler, D.; Rovere, M.; Tulliani, J.M.; Tagliaferro, A. Waste Coffee Ground Biochar: A Material for Humidity Sensors. Sensors 2019, 19, 801. [Google Scholar] [CrossRef] [PubMed]
  26. Claoston, N.; Samsuri, A.; Husni, M.A.; Amran, M. Effects of pyrolysis temperature on the physicochemical properties of empty fruit bunch and rice husk biochars. Waste Manag. Res. J. Sustain. Circ. Econ. 2014, 32, 331–339. [Google Scholar] [CrossRef] [PubMed]
  27. Kalaitzidis, S.; Karapanagioti, H.K.; Christanis, K.; Bouzinos, A.; Iliopoulou, E. Evaluation of peat and lignite phenanthrene sorption properties in relation to coal petrography: The impact of inertinite. Int. J. Coal Geol. 2006, 68, 30–38. [Google Scholar] [CrossRef]
  28. Karapanagioti, H.K.; Sabatini, D.A.; Kleineidam, S.; Grathwohl, P.; Ligouis, B. Phenanthrene sorption with heterogeneous organic matter in a landfill aquifer material. Phys. Chem. Earth Part B Hydrol. Oceans Atmos. 1999, 24, 535–541. [Google Scholar] [CrossRef]
  29. Sessa, F.; Veeyee, K.F.; Canu, P. Optimization of biochar quality and yield from tropical timber industry wastes. Waste Manag. 2021, 131, 341–349. [Google Scholar] [CrossRef] [PubMed]
  30. Fuertes, A.B.; Arbestain, M.C.; Sevilla, M.; Maciá-Agulló, J.A.; Fiol, S.; López, R.; Smernik, R.J.; Aitkenhead, W.P.; Arce, F.; Macías, F. Chemical and structural properties of carbonaceous products obtained by pyrolysis and hydrothermal carbonisation of corn stover. Soil Res. 2010, 48, 618–626. [Google Scholar] [CrossRef]
  31. Cao, X.; Harris, W. Properties of dairy-manure-derived biochar pertinent to its potential use in remediation. Bioresour. Technol. 2010, 101, 5222–5228. [Google Scholar] [CrossRef] [PubMed]
  32. Zhang, Y.; Ma, Z.; Zhang, Q.; Wang, J.; Ma, Q.; Yang, Y.; Luo, X.; Zhang, W. Comparison of the physicochemical characteristics of bio-char pyrolyzed from moso bamboo and rice husk with different pyrolysis temperatures. BioResources 2017, 12, 4652–4669. [Google Scholar] [CrossRef]
  33. Yargiloglou, E.N.; Sadasivam, B.Y.; Reddy, K.R.; Spokas, K. Physical and chemical characterization of waste wood derived biochars. Waste Manag. 2015, 36, 256–268. [Google Scholar] [CrossRef] [PubMed]
  34. Zama, E.F.; Zhu, Y.-G.; Reid, B.J.; Sun, G.-X. The role of biochar properties in influencing the sorption and desorption of Pb(II), Cd(II) and As(III) in aqueous solution. J. Clean. Prod. 2017, 148, 127–136. [Google Scholar] [CrossRef]
  35. Xu, X.; Zhao, Y.; Sima, J.; Zhao, L.; Mašek, O.; Cao, X. Indispensable role of biochar-inherent mineral constituents in its environmental applications: A review. Bioresour. Technol. 2017, 241, 887–899. [Google Scholar] [CrossRef] [PubMed]
  36. Dawei, L.; Xiaoxiao, Z.; Yu, W.; Peijie, Z.; Li, Z.; Zongbo, Z.; Xin, G.; Yingyun, Q.; Guixia, L.; Yuanyu, T. Adjusting ash content of char to enhance lithium storage performance of rice husk-based SiO2/C. J. Alloys Compd. 2020, 854, 156986. [Google Scholar] [CrossRef]
  37. Shi, S.-C.; Liu, G.-T. Cellulose nanocrystal extraction from rice straw using a chlorine-free bleaching process. Cellulose 2021, 28, 6147–6158. [Google Scholar] [CrossRef] [PubMed]
  38. Nikolopoulos, I.; Kordouli, E.; Mourgkogiannis, N.; Karapanagioti, H.K.; Lycourghiotis, A.; Kordulis, C. Valorization of Pyrolyzed Biomass Residues for the Transformation of Waste Cooking Oil into Green Diesel. Catalysts 2023, 13, 1004. [Google Scholar] [CrossRef]
  39. Kalampaliki, D.; Jayasinghe, G.D.T.M.; Avramiotis, E.; Manariotis, I.D.; Venieri, D.; Poulopoulos, S.G.; Szpunar, J.; Vakros, J.; Mantzavinos, D. Application of a KOH-activated biochar for the activation of persulfate and the degradation of sulfamethoxazole. Chem. Eng. Res. Des. 2023, 194, 306–317. [Google Scholar] [CrossRef]
  40. Kyriakou, M.; Chatziiona, V.K.; Costa, C.N.; Kallis, M.; Koutsokeras, L.; Constantinides, G.; Koutinas, M. Biowaste-based biochar: A new strategy for fermentative bioethanol overproduction via whole-cell immobilization. Appl. Energy 2019, 242, 480–491. [Google Scholar] [CrossRef]
  41. Song, B.; Chen, M.; Zhao, L.; Qiu, H.; Cao, X. Physicochemical property and colloidal stability of micron- and nano-particle biochar derived from a variety of feedstock sources. Sci. Total. Environ. 2019, 661, 685–695. [Google Scholar] [CrossRef] [PubMed]
  42. Das, O.; Sarmah, A.K.; Zujovic, Z.; Bhattacharyya, D. Characterisation of waste derived biochar added biocomposites: Chemical and thermal modifications. Sci. Total. Environ. 2016, 550, 133–142. [Google Scholar] [CrossRef] [PubMed]
  43. Burachevskaya, M.; Minkina, T.; Bauer, T.; Lobzenko, I.; Fedorenko, A.; Mazarji, M.; Sushkova, S.; Mandzhieva, S.; Nazarenko, A.; Butova, V.; et al. Fabrication of biochar derived from different types of feedstocks as an efficient adsorbent for soil heavy metal removal. Sci. Rep. 2023, 13, 2020. [Google Scholar] [CrossRef] [PubMed]
  44. Mansaray, K.G.; Ghaly, A.E. Thermal degradation of rice husks in nitrogen atmosphere. Bioresour. Technol. 1998, 65, 13–20. [Google Scholar] [CrossRef]
  45. Cantrell, K.B.; Hunt, P.G.; Uchimiya, M.; Novak, J.M.; Ro, K.S. Impact of pyrolysis temperature and manure source on physicochemical characteristics of biochar. Bioresour. Technol. 2012, 107, 419–428. [Google Scholar] [CrossRef] [PubMed]
  46. Das, S.K.; Ghosh, G.K.; Avasthe, R.K.; Sinha, K. Compositional heterogeneity of different biochar: Effect of pyrolysis temperature and feedstocks. J. Environ. Manage 2021, 278, 111501. [Google Scholar] [CrossRef] [PubMed]
  47. Faghihzadeh, F.; Anaya, N.M.; Schifman, L.A.; Oyanedel-Craver, V. Fourier transform infrared spectroscopy to assess molecular-level changes in microorganisms exposed to nanoparticles. Nanotechnol. Environ. Eng. 2016, 1, 1–16. [Google Scholar] [CrossRef]
  48. Usman, A.R.; Abduljabbar, A.; Vithanage, M.; Ok, Y.S.; Ahmad, M.; Ahmad, M.; Elfaki, J.; Abdulazeem, S.S.; Al-Wabel, M.I. Biochar production from date palm waste: Charring temperature induced changes in composition and surface chemistry. J. Anal. Appl. Pyrolysis 2015, 115, 392–400. [Google Scholar] [CrossRef]
  49. Fu, P.; Hu, S.; Sun, L.; Xiang, J.; Yang, T.; Zhang, A.; Zhang, J. Structural evolution of maize stalk/char particles during pyrolysis. Bioresour. Technol. 2009, 100, 4877–4883. [Google Scholar] [CrossRef] [PubMed]
  50. Qian, L.; Chen, B. Dual role of biochars as adsorbents for aluminum: The effects of oxygen-containing organic components and the scattering of silicate particles. Environ. Sci. Technol. 2013, 47, 8759–8768. [Google Scholar] [CrossRef] [PubMed]
  51. Mahmud, K.N.; Wen, T.H.; Zakaria, Z.A. Activated carbon and biochar from pineapple waste biomass for the removal of methylene blue. Environ. Toxicol. Manag. 2021, 1, 30–36. [Google Scholar] [CrossRef]
  52. Sun, K.; Wang, Y.; Zhang, L.; Shao, Y.; Li, C.; Zhang, S.; Hu, X. High yield of carbonaceous material from biomass via pyrolysis-condensation. Chem. Eng. J. 2024, 485, 149823. [Google Scholar] [CrossRef]
  53. Chen, B.; Zhou, D.; Zhu, L. Transitional Adsorption and Partition of Nonpolar and Polar Aromatic Contaminants by Biochars of Pine Needles with Different Pyrolytic Temperatures. Environ. Sci. Technol. 2008, 42, 5137–5143. [Google Scholar] [CrossRef] [PubMed]
  54. Bonelli, P.R.; Della Rocca, P.A.; Cerrella, E.G.; Cukierman, A.L. Effect of pyrolysis temperature on composition, surface properties and thermal degradation rates of Brazil Nut shells. Bioresour. Technol. 2001, 76, 15–22. [Google Scholar] [CrossRef] [PubMed]
  55. Campos, P.; Miller, A.Z.; Knicker, H.; Costa-Pereira, M.F.; Merino, A.; De la Rosa, J.M. Chemical, physical and morphological properties of biochars produced from agricultural residues: Implications for their use as soil amendment. Waste Manag. 2020, 105, 256–267. [Google Scholar] [CrossRef] [PubMed]
  56. Orfanos, A.G.; Manariotis, I.D.; Karapanagioti, H.K. Removal of Methylene Blue from Water by Food Industry By-products and Biochars. Desalinat. Water Treat. 2018, 103, 113–121. [Google Scholar] [CrossRef]
  57. Santoso, E.; Ediati, R.; Kusumawati, Y.; Bahruji, H.; Sulistiono, D.O.; Prasetyoko, D. Review on recent advances of carbon based adsorbent for methylene blue removal from waste water. Mater. Today Chem. 2020, 16, 100233. [Google Scholar] [CrossRef]
  58. Thommes, M.; Kaneko, K.; Neimark, A.V.; Olivier, J.P.; Rodriguez-Reinoso, F.; Rouquerol, J.; Sing, K.S.W. Physisorption of gases, with special reference to the evaluation of surface area and pore size distribution (IUPAC Technical Report). Pure Appl. Chem. 2015, 87, 1051–1069. [Google Scholar] [CrossRef]
Figure 1. XRD patterns of the raw materials and the corresponding biochar samples studied; (A): SCG and SCG-B, (B): SGC and SGC-B, (C): GSW and GSW-B, (D): GST and GST-B and (E): RH and RH-B.
Sustainability 16 02889 g001
Figure 2. Thermogravimetric analysis of the raw materials (A) and the corresponding biochar samples (B).
Sustainability 16 02889 g002
Figure 3. FTIR spectra of raw materials and corresponding biochar samples studied; (A): SCG and SCG-B, (B): SGC and SGC-B, (C): GSW and GSW-B, (D): GST and GST-B and (E): RH and RH-B.
Sustainability 16 02889 g003aSustainability 16 02889 g003b
Figure 4. Pore size distribution curves of the biochar samples studied.
Sustainability 16 02889 g004
Figure 5. Variation of MB sorption in raw materials studied over time (a). Fitting of MB sorption kinetics on a pseudo-first order model (b).
Sustainability 16 02889 g005
Figure 6. Variation of MB sorption on biochar samples studied over time (a). Fitting of MB sorption kinetics on a pseudo-first order model (b).
Sustainability 16 02889 g006
Table 1. pHeq, moisture and ash content, and different yields for biochar production at 850 °C.
SamplespHeqMoisture Content of Raw Materials (%)Yield of Initial
Material in Biochar (%)
Yield of Dry Raw Material in Biochar (%)Ash Content (%) *Yield of Dry Raw Material in
Carbonaceous Material Fraction in Biochar (%)
SCG 5.563--1.7-
SCG-Β10.6-3.69.813 (17)8.6
SGC6.411--1.2-
SGC-Β10.3-6.06.812 (18)6.0
GSW5.820--2.6-
GSW-B10.2-17217 (10)20
GST7.018--2.4-
GST-B10.7-16209 (15)18
RH6.04--18-
RH-B9.4-272860 (64)11
* Values in parentheses are the predicted percentage of ash content in the biochar based on the raw material ash and the yield of the dry raw material in biochar.
Table 2. Biochar textural characteristics (SSA: specific surface area, SSAMicro: t-plot micropore area, SSAExternal: t-plot external surface area, SPV: specific pore volume, SPVMicro: t-plot micropore volume, and MPD: mean pore diameter).
BiocharSSA
(m2·g−1)
SSAMicro
(m2·g−1)
SSAExternal
(m2·g−1)
SPV
(cm3·g−1)
SPVMicro
(cm3·g−1)
MPD
(nm)
SCG-Β7515142370.390.243.1
SGC-Β8705872830.440.273.1
GSW-B5294201090.270.193.8
GST-B4643501140.240.173.8
RH-B3672301370.230.114.3
Table 3. Experimental sorption capacity (qe exp and qe exp final), theoretical adsorption capacity (qe), and kinetic constant (k1) for a pseudo first-order kinetic model, square of correlation coefficient (R2).
Experimental and Theoretical Sorption ParametersMaterials
SCGSCG-BSGCSGC-BGSWGSW-BGSTGST-BRHRH-B
k1 (day−1)0.680.210.500.170.020.090.020.110.260.39
qe (mg·g−1)3626528316525738922796
qe exp (mg·g−1)49208312491030105620100
qe exp final (mg·g−1)53280353705458429929110
R20.9520.9950.9140.9050.9890.9760.9820.9520.9900.980
Disclaimer/Publisher’s Note: The statements, opinions and data contained in all publications are solely those of the individual author(s) and contributor(s) and not of MDPI and/or the editor(s). MDPI and/or the editor(s) disclaim responsibility for any injury to people or property resulting from any ideas, methods, instructions or products referred to in the content.

