
Characteristics and Reduction of Carbon Dioxide (CO2) Emissions during the Construction of Urban Parks in South Korea
Department of Landscape Architecture, Yeungnam University, 280 Daehak-ro, Gyeongsan-si 38514, Republic of Korea
Sustainability 2024, 16(8), 3405; https://doi.org/10.3390/su16083405
Submission received: 25 February 2024
/
Revised: 29 March 2024
/
Accepted: 16 April 2024
/
Published: 18 April 2024
(This article belongs to the Section Sustainable Urban and Rural Development)
Abstract
:The purpose of this study was to determine the carbon dioxide emissions produced by each type of landscape construction required for each urban park design theme in South Korea and mitigation measures. This study obtained data from four urban park construction projects in South Korea and calculated the amount of carbon dioxide generated during the construction phase using the Tier 2 method based on the amount of construction machinery used according to Korean construction standards. The results show that the three cases beginning after 2020 generated about 1.0 tCO2 of carbon dioxide per 100 m2. In each case, mechanized construction accounted for more than 60% of the total trees planted, and more than 50% of the carbon dioxide was generated in constructing forest-themed parks. Transplanting trees in their natural state emitted at least 2.5 times and up to 9.6 times more carbon dioxide than planting new trees. Pavement construction generated about 340 to 390 tCO2, and block pavement construction generated about 20 to 70 tCO2 per 100 m2 more than pavement constructed by the wet construction method. Based on these results, in order to reduce carbon dioxide emissions, the first step should be to reduce the planting and transplanting of large trees, as this involves a high workload in terms of construction machinery at the design stage, and in the long term, it will be necessary to lead the “landscape of time” through the growth of plant materials. Second, the workload of construction machinery should be improved to induce carbon dioxide reductions through the revision of the Standard Unit Productivity Data on Construction Projects, and it is necessary to refer to past standards. Third, it may be desirable to use wet pavement, but there is a need to improve the sectional detail of block pavement to reduce mechanized work.
1. Introduction
In the interest of sustainable development, governments around the world are working to address global warming. As a concrete action, the Kyoto Protocol of 1997 set greenhouse gas (GHG) emissions targets for developed countries. The goal at the time was to reduce global GHG emissions by 5.2%, but to date, GHG emissions have increased by 19.5 GtCO2 eq. (1990: 37.9 GtCO2 eq. → 2022: 57.4 GtCO2 eq.) [1]. To join the international community in sustainable development, the South Korean government enacted related laws in 2010 (Framework Act on Low Carbon and Green Growth, repealed in 2022; Framework Act on Carbon Neutrality and Green Growth for Coping with Climate Crisis, 2022) and finalized the 2050 Carbon Neutrality Promotion Strategy at the 22nd Emergency Economic Central Countermeasures Headquarters Meeting in 2021, aiming to achieve a 40% reduction in GHG emissions by 2030 [2].
The United Nations Environment Programme (UNEP) expects South Korea to reach its National Determined Contributions (NCDs) but evaluates the country’s policy implementation efforts as somewhat lacking [1]. South Korea currently ranks seventh in carbon dioxide emissions from fuel combustion, higher than Saudi Arabia and Canada, and accounts for 1.8% of global emissions [3]. According to the National Inventory Report released by the Ministry of Environment, South Korea’s total carbon dioxide emissions in 2021 were 676.6 MtCO2 eq. (1990: 292.16 MtCO2 eq. → 2000: 502.76 MtCO2 eq.) and have steadily increased [4].
The construction industry uses large amounts of energy and resources to significantly contribute to social and economic development. It consumes 40% of the world’s economic resources and accounts for 40–50% of greenhouse gases [5]. Carbon dioxide emissions from the construction industry increased from 1990 (1.68 MtCO2 eq.) to 2006 (2.78 MtCO2 eq.) and gradually declined since then until 2019 (2.3 MtCO2 eq.) [6].
The Korean government has established a program to predict carbon dioxide emissions during construction, specifically in the design and planning phase. First of all, since the 1990s, the Ministry of Environment has registered the carbon emission factors for construction machinery. In 2011, the Ministry of Land, Infrastructure, and Maritime Affairs established the “Study on the Establishment of Carbon Emission Evaluation Plans for Each Facility” and developed a program to predict and evaluate carbon dioxide emissions in the construction stage based on the design data of buildings, roads, and railways.
Meanwhile, efforts are being made in the field of architecture and civil engineering to reduce carbon dioxide emissions from the construction stage, but there has been a lack of interest in the landscape architecture field. Parks and green spaces built by the landscape architecture sector use plant materials, so researchers focus on sequestering or storing carbon dioxide that is beneficial to humans rather than carbon dioxide emissions. This leads to the recognition of the provision of urban parks and green spaces as a solution to reduce carbon emissions and air purification [7,8]. In fact, the Korean government is calling for the creation of green areas in living areas, such as urban forests and gardens, as part of the “Korea 2050 Carbon Neutrality Strategy for the Realization of a Sustainable Green Society” [9].
Several previous studies have proven that urban park design has an impact on carbon dioxide sequestration effects. For example, Strohbach et al. analyzed the life cycle of urban parks over 50 years and found that natural parks such as forests have a higher carbon dioxide storage effect than parks with geometric arrangements of grasslands [10]. Furthermore, studies have shown that turf spaces are not effective in sequestrating carbon dioxide because they require a lot of care [11]. Meanwhile, Setälä et al. and Wang et al. found that more carbon dioxide was isolated in coniferous parks than in deciduous trees and medium-sized planting spaces with open structures [12,13]. Choi et al. showed that the carbon dioxide generated during the transplantation of large pine trees in the design and construction phase to increase the marketability of green spaces is 1.26 times higher than the carbon dioxide storage of pine trees maintained in the wild [14].
However, researchers who study the relationship between urban parks and carbon dioxide from a life cycle perspective believe that a significant amount of carbon dioxide is emitted during the park construction stage. For instance, according to Hisham et al., the reason for this is the excessive use and transportation of construction machinery [15]. Jamirsah et al. substantiated the above study and concluded that urban parks are carbon sources rather than carbon sink mediums [7]. They analyzed the carbon footprint of urban parks that have been in operation for 18–24 years and reported that about 27.5–40.0% of carbon dioxide was emitted in the construction stage and 10.5–20% in the maintenance stage, whereas only about 29% of carbon dioxide was stored in the urban park. For this reason, Schimel et al. defined the relationship between urban parks and carbon dioxide as uncertain [16].
The above studies are very valid in that they prove the influence of the relationship between urban parks and carbon dioxide in the design and construction stages. Above all, for urban parks to accurately grasp the effects of carbon dioxide absorption and sequestration in the city, carbon dioxide emissions in the construction stage must be calculated and analyzed. However, the above previous studies excluded the contributions of nonplanting species. Urban parks include not only planting but also facilities and pavements, which inevitably contribute to carbon dioxide emissions [17]. In addition, the design of urban parks involves the use of construction machinery during construction. Because of this, the design affects not only the carbon dioxide sequestration effect in the management phase but also the carbon dioxide emission in the construction phase. However, there is a lack of research analyzing carbon dioxide emissions in the construction phase of various urban park designs. Seo and Park started a related study, but it only covered one small park, thus limiting its results and analysis contents [18].
Currently, there is a lack of research on the amount of carbon dioxide emitted by urban parks. There is also no discussion on how the design of urban parks affects carbon dioxide emissions. Therefore, this study aims to address this lack of discussion in previous research, and its primary purpose is to present the carbon dioxide emissions generated during the construction of urban parks. Specifically, it analyzes carbon dioxide emissions according to the urban park design theme set in the design stage and carbon dioxide emissions by landscape construction type in the construction stage. Its second purpose is to present the cause of carbon dioxide emissions based on the results of an analysis and to propose carbon dioxide reduction measures. These analysis results can be used as basic data to predict and evaluate carbon dioxide emissions during the construction of urban parks. Moreover, these results could meaningfully contribute to the establishment of design guidelines that consider carbon dioxide emissions.
2. Research Methodology
There are two methods for calculating carbon dioxide emissions: the direct method, which directly measures concentration, flow rate, etc., with a device at the outlet of the emission source, and the indirect method, which makes a theoretical estimate based on the type and amount of fuel burned, combustion efficiency, and emission factors. The direct method has the advantage of obtaining accurate information on the final emissions because it reflects the fuel combustion process, but it is time-consuming and costly in terms of installing and operating the necessary equipment and has measurement limitations [19]. On the other hand, the indirect method estimates carbon dioxide emissions by considering the characteristics of the facility at each stage—planning and design; construction, including material production; operation; decommissioning; and recycling—according to guidelines [20,21]. Therefore, this study used the indirect method, which also facilitates easier to calculate with coefficients.
2.1. Calculating Carbon Dioxide Emissions
In 2004, the U.S. Environmental Protection Agency (EPA) established a Tier 1 through Tier 4 emissions standard for engines used in non-road construction, as well as for agricultural equipment, and presented emission factors for these engines [22]. Later, the 2006 Intergovernmental Panel on Climate Change (IPCC) guidelines provided a methodology for GHG or carbon dioxide emissions and sequestration from human activities [23], categorizing emission sources into energy, industrial processes and product use, agriculture, forestry, other land use, waste, and other. In terms of accuracy and precision, it recommended calculation methods from Tier 1 (the basic method) to Tier 3 (the most detailed method). In recent years, each country has adopted the IPCC’s methodology and applied emission factors appropriate to its particular circumstances based on its own test results.
Activity data and emission factors are required to quantify carbon dioxide emissions according to the 2006 IPCC guidelines, and the emission rate is necessary to estimate carbon dioxide emissions [24,25,26]. The activity data concern the amount of fuel burned in a specific activity and process [27], and the emission factor represents the average amount of carbon dioxide emitted from fuel combustion during the specific activity and process [28,29]. The final emissions are calculated using fuel-specific emission factors provided by the IPCC and correcting for oxidation rates, carbon incorporation rates, and the mass ratio of carbon dioxide.
Tier 1, which is the default method, multiplies the emission factors of the type of fuel used, such as diesel and gasoline, based on fuel consumption by vehicle type. The Tier 2 method is used when no data are available for a country, as it presents emission factors for each fuel type, vehicle type, or construction machinery type used as a way to categorize fuel consumption by technology and sample. This method is a bottom-up method that applies emission factors according to vehicle type and emission control technology and requires energy consumption data for each vehicle type. The Tier 3 method is based on activity data such as mileage instead of fuel consumption and is calculated as a product of the measured emission factors [21]. It is difficult to distinguish between the Tier 2 and Tier 3 methods, but the Tier 2 method classifies fuel consumption based on knowledge and samples of homogeneous technologies so that they can be applied as representative emission factors, whereas the Tier 3 method uses estimated emission factors based on activity data (e.g., miles traveled or ton/km in the transport sector) and fuel mixing ratios [30,31,32] (Table 1).
2.2. Study Process and Data Sources
Among the types of work involved in the construction of the urban parks, this study focused on landscaping work. For the calculation of carbon dioxide emissions, the Tier 2 method specified by the 2006 IPCC was selected, considering the characteristics of construction sites where various construction machinery are driven over short distances [33]. The Tier 1 method was not used because of its limitation of not reflecting the characteristics of construction machinery, and the Tier 3 method is more useful in cases involving long-distance travel.
To apply the Tier 2 method, this study collected the following data sources. For the emission factor (EF), we calculated the “equipment carbon emission factor” from South Korea’s carbon emission factor using the national LCI DB, 2011 [20]. This equipment carbon emission factor accounts for all equipment used at construction sites and existing standards. For fuel consumption, we used a formula (Formula (2)) based on the 2011 Ministry of Land, Infrastructure and Transport guidelines for calculating carbon emissions by facility (Table 2).
Formula (1):
Emission (tCO2) = ∑ [Fuela,b,c × EFa,b,c],
- Fuela,b,c: Fuel consumption (TJ) for a given mobile source activity;
- EFa,b,c: Emission factor (tCO2/unit);
- a: Fuel type (gasoline, diesel, natural gas, LPG, etc.);
- b: Vehicle type (or construction machinery type);
- c: Emission control technology (no control device, catalytic converter, etc.).
Formula (2):
Fuela,b,c = Work (unit) × Time (h/unit) × FE (L/h)
- Work: Workload;
- Time: Equipment usage time per unit of work;
- FE: Fuel efficiency.
To calculate the above fuel consumption for each case, we used the Standard Unit Productivity Data on Construction Projects and Construction Cost Estimation Data. The former provide a general standard for estimating the appropriate scheduled price of construction projects and establish standards for each equipment type and construction volume for generalized construction types and methods [34,35], while the latter are a means of calculating construction costs based on the construction standard specifications and detailed design drawings for each case, allowing for the actual quantities of materials, manpower, and construction machinery required for construction to be identified [36]. Finally, the Cost Calculation Table for Construction Machinery, which is published monthly by the Construction Association of Korea, was used to estimate the fuel efficiency of the construction machinery used in each case.
In addition, to examine carbon dioxide emissions in the construction phase, each urban park theme was categorized into plant work, pavement work, and landscape facility work (Figure 1). The above classification is based on the major construction type in the Landscaping Construction Classification System [37].
The planting work in each case (or theme) was subdivided into transplanting wild trees and planting outsourced trees, reflecting the characteristics of Korean urban parks that are mainly developed on mountainous terrain. Based on the Standard Unit Productivity Data on Construction Projects, small trees, shrubs, and ground covers, which are manually constructed and contribute less to carbon dioxide sequestration, were excluded [38], and trees with a root diameter of 10 cm or more that were used in the mechanized construction were targeted.
Pavement work is the main landscaping paving method used in South Korea. The main paving methods can be divided into two categories: block paving, which involves laying block paving materials on a sub-base layer, and paving by wet construction, in which materials such as granite and flagstone are attached to the concrete surface. Next, we analyzed the differences in the amount of carbon dioxide generated by landscape facility (and structures) construction and, finally, looked at the construction machinery that emits the most carbon dioxide during urban park construction.
2.3. Case Description
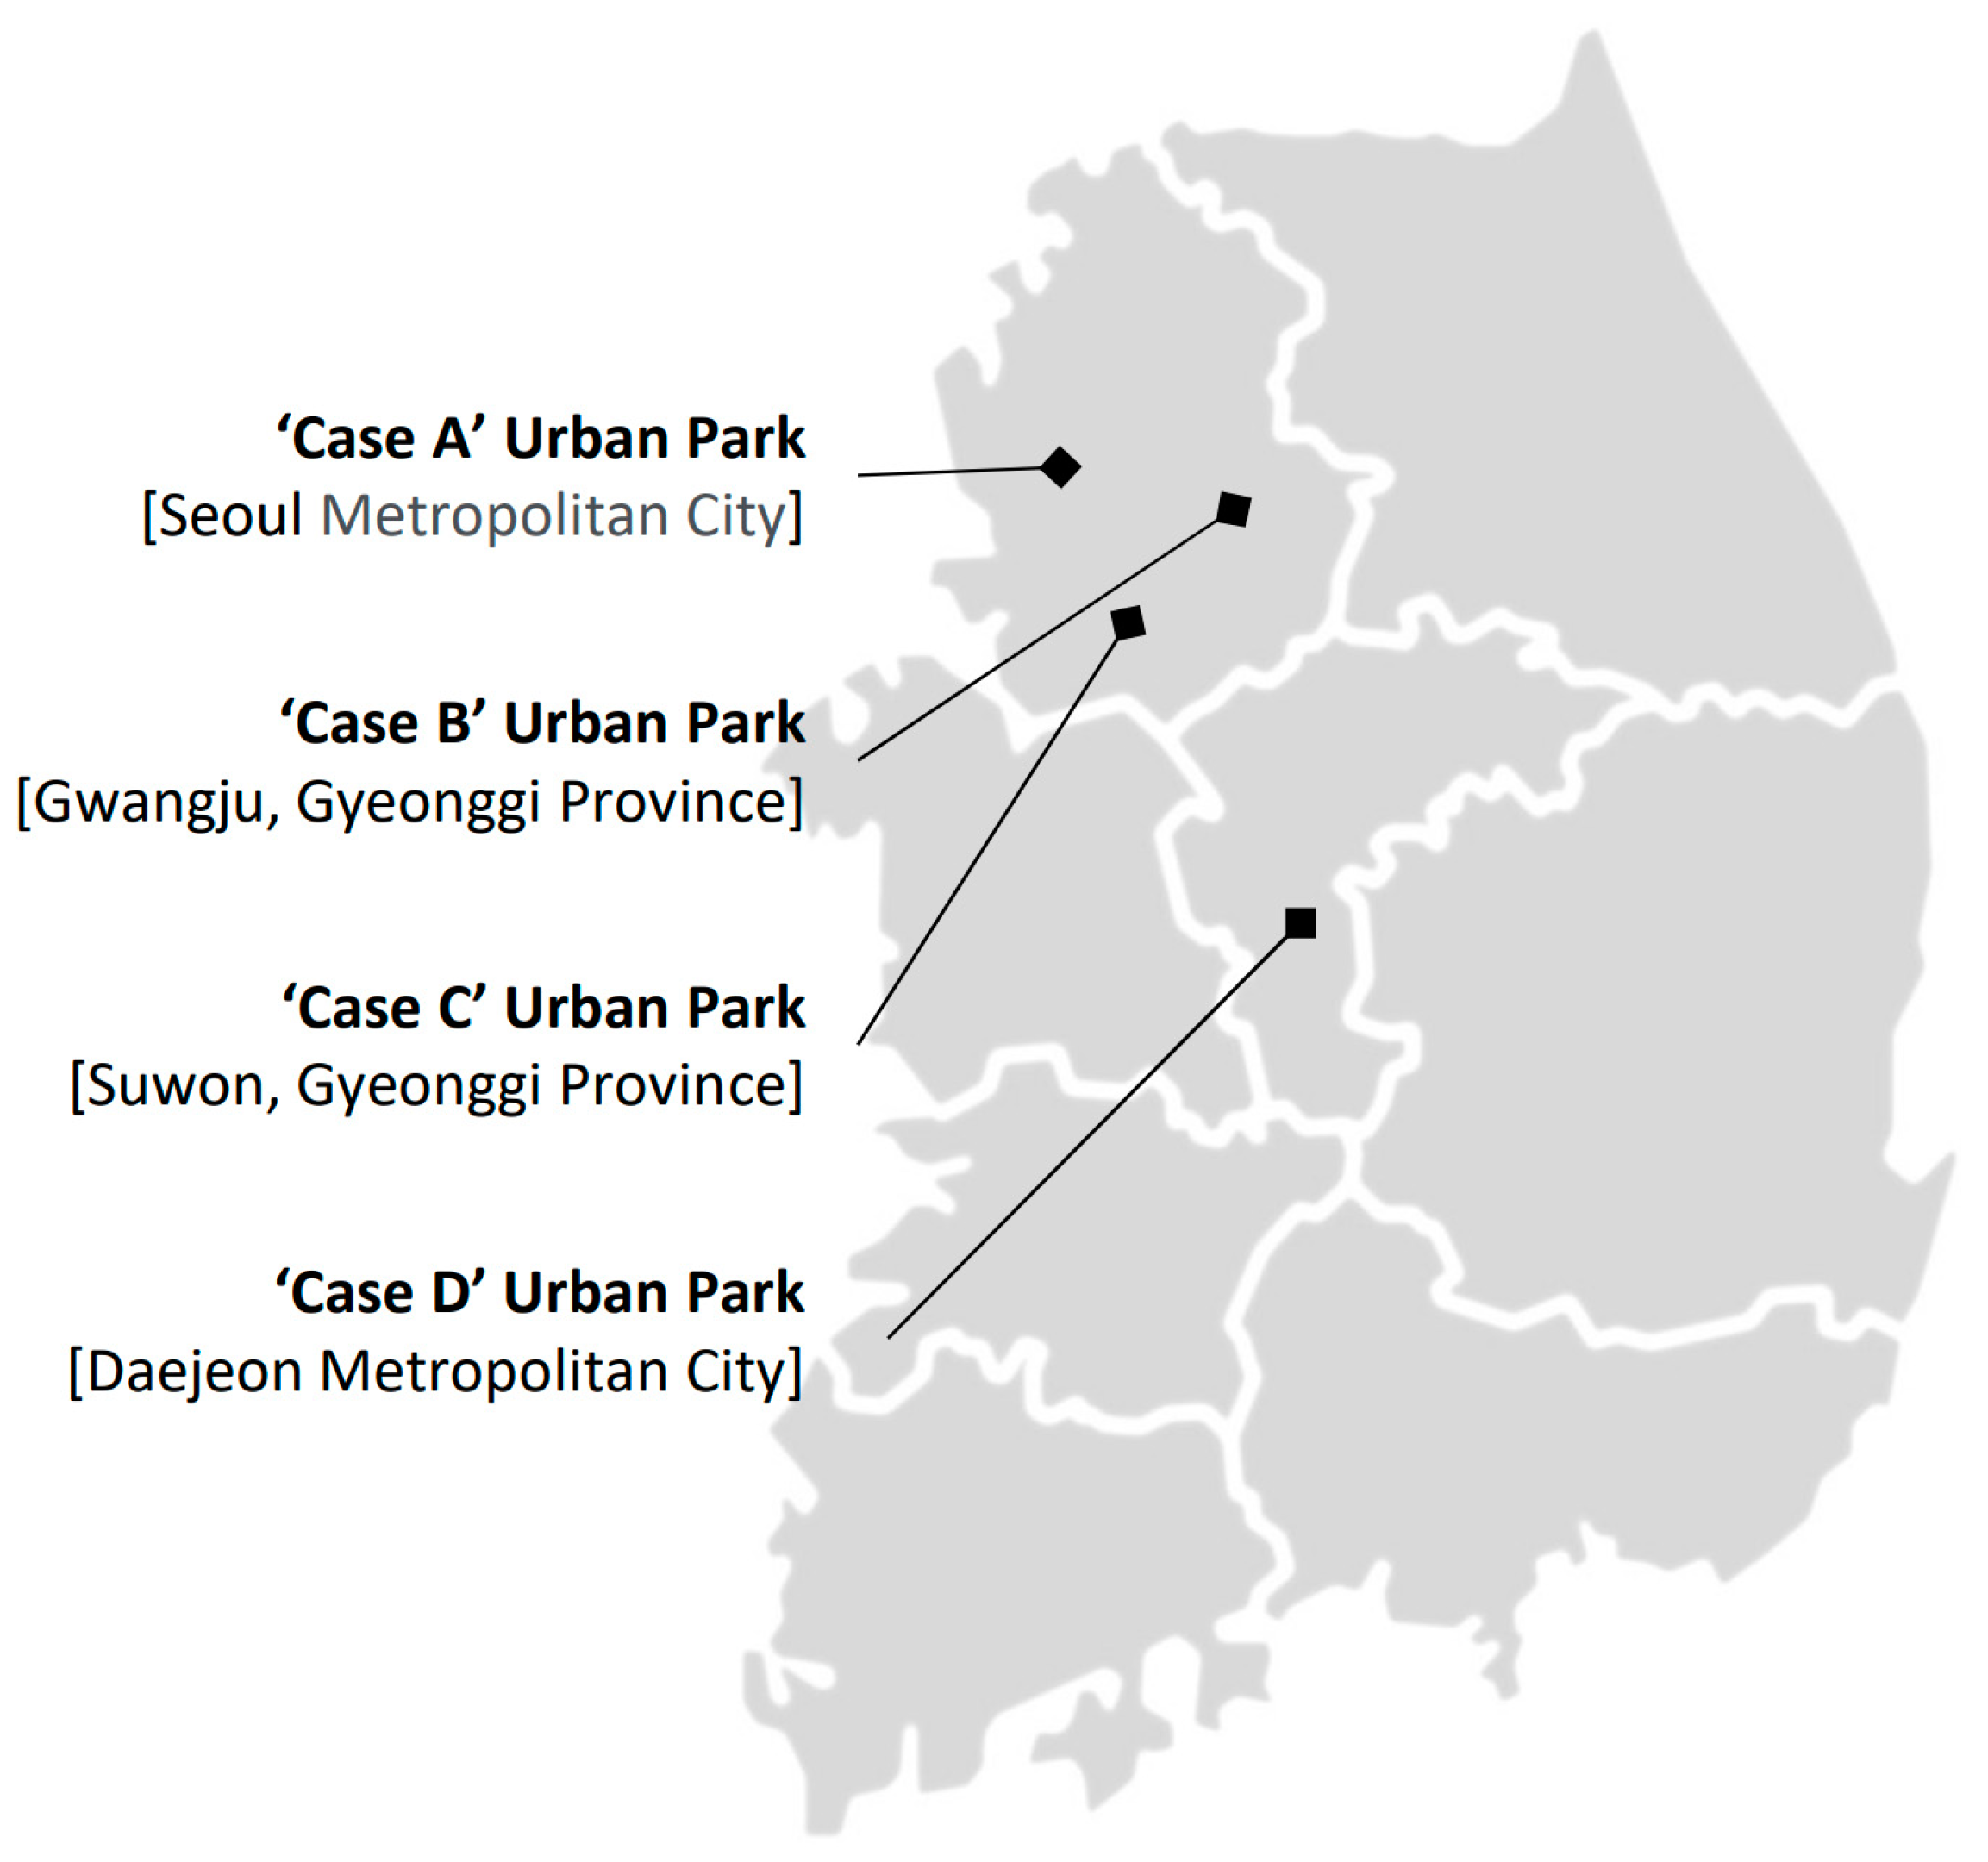
This study focuses on four urban parks in South Korea with an area of more than 100,000 square meters. These parks are located in Seoul (Case A); Gwangju, Gyeonggi-do (Case B); Suwon, Gyeonggi-do (Case C); and Daejeon Metropolitan City (Case D) (Table 3, Figure 2). We obtained Design Reports to identify themes for each case, and the themes for the cases are as follows.
Case A is a citizen-participatory urban forest. The theme of Case A is to create “a forest of life” that breathes with nature, “a forest of participation” created together with citizens, and “a forest of joy” that everyone can enjoy together. In order to materialize this, specialized items, such as the creation of dense forests, the creation of emotional parks where you can feel the seasonal changes, the introduction of cultural and artistic elements that harmonize nature and culture, and the creation of nature-friendly parks, were introduced.
Case B, the most expensive, is an ecological forest that considers stormwater retention. The theme of Case B was set at a strategic level to link the system between the Blue Belt and the Forest Belt in Gwangju, Gyeonggi-do. In addition, in order to preserve the sense of place in the area and to enable landscape and ecological connection with the city, specialized facilities such as the Family Forest, the Forest of Literature, the Sol Hyang Hill, the Forest of Art, and the Ecological Mooring Garden were planned.
Case C is an arboretum. The theme of Case C was set for the purpose of disseminating the garden culture of Suwon, Gyeonggi-do, and inheriting the tradition of plant research. Considering the topographical conditions, it consists of the “Hydrangea Garden, Eucommia Ulmodies Forest, and Rock Garden”, which encompasses trees in the central temperate zone; the “Seasonal Flower Garden, Wetland Flower Garden, and Blooming Garden”, encompassing the existing water system and rice field topography; and the “Crop Garden, Winter Garden”, where you can observe the ecological processes of forest changes.
Case D is a civic garden and a recreation and exercise space for residents. The theme of Case D was set to preserve the mountainous terrain that occupies most of the park while minimizing damage to some of the topography and specializing in spiral mounding for the purpose of providing various herbs and urban views.
Cases A and B were awarded the International Federation of Landscape Architects (IFLA) Prize for Excellence in 2006 and 2022, respectively. In terms of development, Case A, completed in 2006, is an urban park developed on flat land that was directly promoted by the local government as the management entity, while Cases B through D, which have been completed or are scheduled to be completed after 2020, are urban parks developed on mountainous land that were promoted as Private Park Special Projects. The latter refers to private developers financing the development costs through revenue-generating projects, such as the sale of apartments within 30% of the park site for urban parks that have not been built for more than 20 years. These private developers then develop the remaining site into a park and donate it to the local government (Act on Urban Parks and Green Areas. Article 21-2). Each case was developed with a different theme. Case A is a citizen-participatory urban forest; Case B, the most expensive, is an ecological forest that considers stormwater retention; Case C is an arboretum; and Case D is a civic garden and a recreation and exercise space for residents.
3. Results
3.1. Urban Park Design Themes and the Emittance of Carbon Dioxide during the Construction Phase
The total carbon dioxide emissions from the construction phase of each case were calculated using the Tier 2 method and ranged from 1238 tCO2 to 3918 tCO2 (Table 4). Cases B–D, which have been completed or are scheduled to be completed after 2020, had a proportional amount of carbon dioxide generated to the surface area of 0.92 to 1.10 tCO2 generated per 100 m2. In contrast, Case A generated the least amount of carbon dioxide per 100 m2 with 0.42 tCO2, despite having the largest surface area.
Cases with different design themes had different percentages of carbon dioxide emitted during planting, paving, and facility construction. Case A and Case B, which have a forest theme, generated the highest percentage of carbon dioxide during planting, with Case B, developed on mountainous terrain, generating about 10% more than Case A, developed on an urban flatland. Case C and Case D, which have arboretum and garden themes, respectively, had carbon dioxide emissions of 21.6% and 38.8% during planting, respectively, which is significantly different from Case A and Case B. However, Case C and Case D emitted a higher amount of carbon dioxide from facility construction than Case A and Case B, especially Case C, which accounted for 63.8%.
3.2. Carbon Dioxide Emissions by Type of Urban Park Construction
3.2.1. Carbon Dioxide Emittance during Planting
The amount of carbon dioxide generated during planting work was proportional to the size and quantity of trees undergoing mechanized construction. In other words, as the size of the tree increases, so does the size of the machinery used, leading to an increase in the emission factor.
The number of trees planted in each case varied depending on the size and theme of the park. More than 12,000 trees were planted in the larger, forest-themed Case A and Case B, 9687 trees were planted in the arboretum-themed Case C, and 4505 trees were planted in the smallest, garden-themed Case D. Planting was mechanized in all cases, comprising more than 60% of the total tree volume, with Case B accounting for more than 93% of the total number of large-sized trees. The ratio of transplanting to planting among mechanized planting work is 12.6% to 87.4% in Case A, 8.1% to 91.9% in Case B, 3.4% to 96.6% in Case C, and 61.3% to 38.8% in Case D (Table 5).
Based on the volume of planting work in each case, the amount of transplanting work using mechanized construction was the highest in Case D (1666 trees), followed by Case A (1086 trees), Case B (913 trees), and Case C (232 trees). However, Case B (968.52 tCO2) generated the most carbon dioxide emissions during the transplantation process, followed by Case D (384.18 tCO2), Case C (172.77 tCO2), and Case A (135.70 tCO2). Speaking in terms of emissions per 100 trees, the most carbon dioxide was generated during the construction of Case B (106.08 tCO2 per 100 trees), which is an ecological forest in a mountainous terrain, and the least was seen in Case A (12.50 tCO2 per 100 trees), in which the second highest number of natural trees was transplanted on flat terrain. Case B generated the highest amount of carbon dioxide even though it had a lower quantity of transplanted trees than Case A and Case C because the transplantation of large-sized natural trees required an increased size of machinery and an increased duration of machinery use [39].
The volume of new trees supplied externally being planted with mechanized construction was the highest in Case B (10,367 trees, 1198.41 tCO2), followed by Case A (7567 trees, 955.11 tCO2) → Case C (6581 trees, 549.39 tCO2) → Case D (1054 trees, 96.72 tCO2), and the amount of carbon dioxide was emitted in the same order. Per 100 trees, 12.62 tCO2 and 11.56 tCO2 were emitted in forest-themed Case A and Case B, respectively, and 8.35 tCO2 and 9.18 tCO2 were generated in garden-themed Case C and Case D, respectively. The reason for this difference in the amount of carbon dioxide generated during planting is closely related to the planting design suitable for each park’s respective theme [40,41]. In other words, Case A and Case B, which are forests, involved a large number of large trees in the design stage, which increased the workload of construction machinery, while Case C and Case D, which are gardens, involved small-sized, multi-variety, labor-intensive plant materials, mainly shrubs and flowering plants, which required less equipment for construction work.
According to the results of this study, there was a large difference in carbon dioxide emissions per 100 m2 during the process of transplanting and planting new trees. In Case B and Case C, the amount of carbon dioxide generated during transplanting was about nine times higher than the amount generated during the planting of new trees. This is because, along with the differences between each standard, transplantation work involves the additional steps of excavation, capping, re-excavation, planting, and maintenance at the capping site.
3.2.2. Carbon Dioxide Emittance during Paving
Pavement work uses various pieces of equipment for all processes, including excavation, the handling of surplus soil, constructing a sub-base, rod tamping, the placing of concrete, and pavement finishing. South Korean urban park legislation stipulates that the pavement area should be no more than 40% of the park area (Enforcement Regulation of the Act on Urban Parks and Green Areas, Article 6), and designers and local governments are very limited in how they may incorporate pavements to enhance the ecological effect of urban parks.
The paved area of Case A, in which the park is located in a flat urban area, is more than 100,000 m2, while the paved area of Cases B–D, which are mountainous urban parks, is 20,000 to 30,000 m2. The ratio of wet pavement to block pavement is 26.7% to 43.3% in Case A, 16% to 26.5% in Case B, 72.7% to 6.3% in Case C, and 26.0% to 56.5% in Case D.
The amount of carbon dioxide generated during pavement construction was about 330–390 tCO2 and, converting the pavement area to a 100 m2 unit, 1.15–1.59 tCO2 for Cases B–D and 486.39 tCO2 and 0.45 tCO2 for Case A, which had a large pavement area (Table 6). The ratio of carbon dioxide generated by wet pavement and block pavement cannot be exactly matched due to differences in pavement cross-section and equipment combinations, which depended on the materials used, but it was generally similar to the ratio of each area.
The amount of carbon dioxide per 100 m2 generated by block paving (1.36–1.93 tCO2) was higher than with wet paving (0.99–1.24 tCO2). This is due to the difference in construction methods; wet paving uses labor to finish the material, while block paving requires additional equipment such as excavators and compactors to install the blocks. Therefore, the results show that the selection of pavement finishing materials at the design stage can reduce carbon dioxide emissions per 100 m2 by at least 0.37 to 0.69 tCO2.
3.2.3. Carbon Dioxide Emittance during Facility Construction
Facility construction is carried out to overcome the terrain and its features in order to implement landscape design. Except for Case C, the cases accounted for 22.4 to 33.7% of the total amount of carbon dioxide emitted during the construction phase (Table 4). However, the reason for the relatively high amount of carbon dioxide generated during the construction of the facilities in Case C is presumably due to the installation of stairs, decks, bridges, and retaining walls to facilitate the viewing of the trees in the mountainous terrain.
3.3. Carbon Dioxide Emissions from Major Construction Machinery Used in the Construction of Urban Parks
In this study, we found that among the construction machinery used in each case, more than 80% of carbon dioxide was emitted by excavators (Table 7). And after excavators, cranes were used the most, because large-sized trees were planted or transplanted. The vibrating roll roller shown in Case A and Case D was used to compact the material of the block pavement.
4. Discussion
Based on these results, this study was able to identify differences in the amount of carbon dioxide emissions generated by each type of construction depending on the theme of the park, and the breakdown of carbon dioxide emissions provide guidance for reducing them in the construction phase. This study found that about 1.0 tCO2 of carbon dioxide is generated per 100 m2 of area during the construction of urban parks. This value is quite large in light of Setälä et al.’s findings that the amount of carbon dioxide stored per 100 m2 in newly established parks ranges from 1.89 to 2.14 tCO2 depending on the vegetation type [12]. It is difficult to generalize the results of Setälä et al., but reducing the amount of carbon dioxide emitted during the construction phase is an important part of increasing the effectiveness of carbon dioxide storage and sequestration during the operation of urban parks. Therefore, this section proposes ways to reduce carbon dioxide emissions in the construction stage of urban parks.
4.1. Planting Design to Reduce Carbon Dioxide Emissions
The first step is to reduce the amount of plant work. As we have already found that arboretum or garden-themed urban parks have lower carbon dioxide emissions during planting, designing smaller, more diverse plantings at the design stage may be one solution. This means that at the design stage, the initial landscape or initial ecological benefits should be considered, the use of large-sized trees should be avoided, and strategies for carbon dioxide storage or sequestration through the growth of plant material should be included. Since carbon dioxide emissions are very high during transplantation, it is necessary to minimize the size of the transplanted trees. However, from a life cycle perspective, removing existing trees can also generate carbon dioxide, so finding the right balance will be key.
While Strohbach et al. found that forest-like designs are effective at storing carbon dioxide during the maintenance phase, this study points out these designs may increase the rate of carbon dioxide generation during the construction phase [10]. In other words, forest-like designs that require large-sized trees or large quantities of trees may increase equipment usage time and, thus, increase carbon dioxide generation. This is in line with Wang et al.’s findings that biotopes with medium-sized plants and partially open structures are effective planting design techniques to offset carbon dioxide emissions [13]. It would also be effective to maximize the preservation of forests in areas where construction or maintenance can be less intensive [42]. As discussed above, urban parks with forest-like designs can increase uncertainty regarding carbon dioxide emittance. In order to reduce carbon dioxide generation during the construction of urban parks, urban park designers need to adopt the “landscaping of time” approach, which plans trees’ specifications from a long-term perspective in the design phase [14].
4.2. Improvement of Construction Standards in Consideration of Carbon Dioxide Reduction
We found a significant difference in the carbon dioxide emissions from the construction of a park that opened in 2005 (Case A) and those from the construction of parks that are set to open after 2020 (Case B–D). This is because the Standard Unit productivity Data on Construction Projects, which is based on the workload of construction machinery, have been revised annually to improve the combination and the usage time of equipment to improve construction capacities [43]. For example, applying mechanized construction has become established for trees with a root diameter of 10 cm or more since 2002, and for trees with a root diameter of 9 cm or more, since 2013, cranes with excavators, have been used for trees with a root diameter of 21 cm or more. In addition, the time required for an excavator to plant a tree with a root diameter of 10 cm increased from 0.24 h in 2002 to 0.37 h in 2019.
As the Standard Unit Productivity Data on Construction Projects set the foundation for construction, subsequent revisions should present data on working hours for construction machinery that take into account carbon dioxide reduction as well as construction efficiency.
4.3. Improvement of Construction Machinery to Reduce Carbon Dioxide
Excavators are the main carbon dioxide-generating machinery in the construction of urban parks, as they are equipped with buckets to dig or empty soil and transport materials over short distances and also have breakers to crush rocks. These account for more than 30% of all registered construction machinery in South Korea due to their wide range of uses, including basic earthwork [44]. They are also very useful in all types of landscaping work, as they can dig and move trees during plant work, dig and level soil during pavement work, and perform earthwork for foundation installation in facility construction.
Meanwhile, compared to other construction machinery, excavators have low fuel efficiency [45] and high emission factors, ranging from 2.6 × 10⁻² tCO2/unit to 8.3 × 10⁻² tCO2/unit. In particular, the output of an excavator increases when supporting the bucket on the ground and twisting the body to move [32]. Therefore, it is necessary to install kits that can reduce fuel consumption, use high-efficiency excavators, develop daily work plans to minimize excavator movements, and correct operators’ work habits [46].
5. Conclusions and Future Work
This study analyzed the amount of carbon dioxide emitted during the construction of urban parks and suggested ways to mitigate such emissions. To this end, carbon dioxide emissions were analyzed for four urban parks in Korea by dividing them by set at the design stage and by landscape construction type at the construction stage. The carbon dioxide emission calculation method was based on the Tier 2 method set by the 2006 IPCC. Accordingly, the following implications are provided:
First, this study presented the carbon dioxide unit emission per 100-m2 area (0.92 to 1.10 tCO2) in the construction stage of urban parks. In particular, the results showed that the theme of urban parks did not show a significant difference in carbon dioxide unit emissions. Therefore, this result could be the basis for projecting carbon dioxide emissions in the planning of urban parks. However, carbon dioxide unit emissions should also be accompanied by statistical verification through more case analyses.
Second, it was found that the theme of a park had an impact on carbon dioxide emissions due to the types of landscape construction. In particular, as the theme of the park affects the quantity and size of trees, carbon dioxide emissions at the construction stage have a direct relationship with the planting construction. In addition, this study found that planting a large number of small-sized trees and allowing the trees to grow over time is beneficial for reducing carbon dioxide emissions, conforming to the 2050 carbon neutrality scenario where “increasing the diversity of tree species and age in the forest” is effective in carbon neutrality policies.
Third, this study included the case of an old park (Case A), and carbon dioxide emissions in the construction stage in Korea were greatly influenced by the Standard Unit Productivity Data on Construction Projects. Therefore, past standards must be consulted to reduce carbon dioxide emissions in the construction stage. Moreover, in the process of calculating carbon dioxide emissions based on this standard, we found out that excavators comprise about 80% to 90% of the construction machinery used. Therefore, in addition to machinery workload, machinery usage habits, machinery travel distance, and machinery’s fuel efficiency are important factors affecting carbon dioxide emissions during the construction phase.
This study is meaningful in that it suggests a value that can predict carbon dioxide emissions in the construction of urban parks and suggests that planting can reduce the amount of such emissions. In addition, as found in previous research, the design of urban parks affects the effectiveness of carbon dioxide storage and sequestration in the management phase, as well as the carbon dioxide emissions in the construction phase. For this reason, to increase the capacity of urban parks as carbon sinks, systematic management is necessary to ensure low-carbon construction from the design stage.
However, the carbon dioxide emissions presented in this study are based on work activities within the urban park area and are a part of actual emissions. To accurately calculate the carbon dioxide emissions of the construction phase, the carbon dioxide emissions of the transportation required for bringing in materials from outside the park area must be added. Therefore, follow-up studies should obtain the source and transportation distances of the materials recorded in the construction log from the construction contractor and calculate and analyze carbon dioxide emissions using the Tier 3 method set by the 2006 IPCC.
Funding
This research received no external funding.
Institutional Review Board Statement
Not applicable.
Informed Consent Statement
Not applicable.
Data Availability Statement
The data presented in this study are available on request from the corresponding author.
Conflicts of Interest
The author declares no conflicts of interest.
References
- United Nations Environment Programme (UNEP). Emissions Gap Report 2023; United Nations Environment Programme (UNEP): Nairobi, Kenya, 2023. [Google Scholar]
- Available online: https://www.korea.kr/special/policyCurationView.do?newsId=148881562 (accessed on 12 January 2024).
- International Energy Agency (IEA). CO2 Emission form Fuel Combustion; International Energy Agency (IEA): Paris, France, 2019. [Google Scholar]
- Ministry of Environment. National Inventory Report (1990–2021); Ministry of Environment: Sejong-si, Republic of Korea, 2023. (In Korean)
- Asif, M.; Muneer, T.; Kelley, R. Life cycle assessment: A case study of a dwelling home in Scotland. Build. Environ. 2007, 42, 1391–1394. [Google Scholar] [CrossRef]
- Jeong, Y.S.; Mun, S.H.; Cho, S. Analysis of Greenhouse Gas Emissions in the Construction Sector. J. Clim. Chang. Res. 2021, 12, 299–306. [Google Scholar] [CrossRef]
- Jarmirsah, N.; Said, I.; Jaafar, B.; Haniff, M. Carbon Footprint of Built Features and Planting Works during Construction, Maintenance and Renewal Stages at Urban Parks in Petaling Jaya, Selangor. Sci. Technol. 2021, 29, 387–406. [Google Scholar]
- Popek, R.; Fornal-Pieniak, B.; Chyliński, F.; Pawełkowicz, M.; Bobrowicz, J.; Chrzanowska, D.; Piechota, N.; Przybysz, A. Not Only Trees Matter—Traffic-Related PM Accumulation by Vegetation of Urban Forests. Sustainability 2022, 14, 2973. [Google Scholar] [CrossRef]
- 2050 Carbon Neutrality Committee. 2050 Carbon Neutrality Scenario 2050; 2050 Carbon Neutrality Committee: Sejong-si, Republic of Korea, 2021. (In Korean) [Google Scholar]
- Strohbach, M.W.; Arnold, E.; Haase, D. The carbon footprint of urban green space—A life cycle approach. Landsc. Urban Plan. 2012, 104, 220–229. [Google Scholar] [CrossRef]
- Townsend-Small, A.; Czimczik, C.I. Carbon sequestration and greenhouse gas emissions in urban turf. Geophys. Res. Lett. 2010, 37. [Google Scholar] [CrossRef]
- Setälä, M.; Francini, G.; Allen, A.; Hui, N.; Jumpponen, A.; Kotze, J. Vegetation Type and Age Drive Changes in Soil Properties, Nitrogen, and Carbon Sequestration in Urban Parks under Cold Climate. Front. Ecol. Evol. 2016, 4, 93. [Google Scholar] [CrossRef]
- Wang, Y.; Chang, Q.; Li, X. Promoting sustainable carbon sequestration of plants in urban greenspace by planting design: A case study in parks of Beijing. Urban For. Urban Green. 2021, 64, 127291. [Google Scholar] [CrossRef]
- Choi, Y.; Ahn, T.; Lee, J. Carbon Emission Study of Transplanting Large Trees from Gangwon Province to Seoul. J. Korean Inst. Landsc. Archit. 2013, 41, 10–16. (In Korean) [Google Scholar] [CrossRef]
- Hisham, F.; Shahidan, M.; Ja’afar, M. Stages and Element Affecting Development of low Carbon Parks in Malaysia: An Expert Review. Alam Cipta 2018, 11, 2–8. [Google Scholar]
- Schimel, D.S.; House, J.I.; Hibbard, K.A.; Bousquet, P.; Ciais, P.; Peylin, P.; Braswell, B.H.; Apps, M.J.; Baker, D.; Bondeau, A.; et al. Recent patterns and mechanisms of carbon exchange by terrestrial ecosystems. Nature 2001, 414, 169–172. [Google Scholar] [CrossRef] [PubMed]
- O’Connor, K.; Pocok, C.; Barthelmeh, M.; Davis, S. Carbon and Environmental Profiling of Hard Landscape Materials. Land Environ. People Res. Rep. 2010, 22, 1–45. [Google Scholar]
- Seo, J.Y.; Park, C.A. Study on Greenhouse Gas Issues in Landscape Construction and Estimation of Emissions at the Children’s Park Construction. J. Korea Inst. Gard. Des. 2022, 8, 27–34. (In Korean) [Google Scholar]
- Kim, T.H. Estimation of Emissions of Carbon Dioxide (CO2) in the Metropolitan Area and the Necessity Developing the Learning Materials for Its Reduction. Master’s Thesis, Korea National University of Education, Cheongju, Republic of Korea, 2007. (In Korean). [Google Scholar]
- Ministry of Land, Transport and Maritime Affairs. Carbon Emission Estimating Guideline Each Facility; Ministry of Land, Transport and Maritime Affairs: Sejong-si, Republic of Korea, 2011. (In Korean)
- Maués, L.M.; Beltrão, N.; Silva, I. GHG Emissions Assessment of Civil Construction Waste Disposal and Transportation Process in the Eastern Amazon. Sustainability 2021, 13, 5666. [Google Scholar] [CrossRef]
- U.S. Environmental Protection Agency (EPA). Exhaust and Crankcase Emission Factors for Nonroad Engine Modeling Compression-Ignition; U.S. Environmental Protection Agency (EPA): Washington, DC, USA, 2004.
- Intergovernmental Panel on Climate Change (IPCC). 2006 IPCC Guidelines for National Greenhouse Gas Inventories; Intergovernmental Panel on Climate Change (IPCC): Geneva, Switzerland, 2006. [Google Scholar]
- Elahi, E.; Khalid, Z.; Tauni, M.Z.; Zhang, H.; Lirong, X. Extreme Weather Events Risk to Crop-Production and the Adaptation of Innovative Management Strategies to Mitigate the Risk: A Retrospective Survey of Rural Punjab, Pakistan. Technovation 2022, 117, 102255. [Google Scholar] [CrossRef]
- Elahi, E.; Khalid, Z.; Zhang, Z. Understanding Farmers’ Intention and Willingness to Install Renewable Energy Technology: A Solution to Reduce the Environmental Emissions of Agriculture. Appl. Energy 2022, 309, 118459. [Google Scholar] [CrossRef]
- Solomon, S.; Plattner, G.-K.; Knutti, R.; Friedlingstein, P. Irreversible Climate Change Due to Carbon Dioxide Emissions. Proc. Natl. Acad. Sci. USA 2009, 106, 1704–1709. [Google Scholar] [CrossRef] [PubMed]
- Jafar, H.A.; Shahrour, I.; Mroueh, H. Evaluation of Greenhouse Gas Emissions in Conflict Areas: Application to Palestine. Sustainability 2023, 15, 10585. [Google Scholar] [CrossRef]
- Drouet, J.-L.; Capian, N.; Fiorelli, J.-L.; Blanfort, V.; Capitaine, M.; Duretz, S.; Gabrielle, B.; Martin, R.; Lardy, R.; Cellier, P.; et al. Sensitivity Analysis for Models of Greenhouse Gas Emissions at Farm Level. Case Study of N2O Emissions Simulated by the CERES-EGC Model. Environ. Pollut. 2011, 159, 3156–3161. [Google Scholar] [CrossRef]
- Abbas, A.; Zhao, C.; Waseem, M.; Ahmed Khan, K.; Ahmad, R. Analysis of Energy Input–Output of Farms and Assessment of Greenhouse Gas Emissions: A Case Study of Cotton Growers. Front. Environ. Sci. 2022, 9, 826838. [Google Scholar] [CrossRef]
- Jang, W.S.; Kim, B.S. The Application of CO2 and Hydrometer Sensor for Development of Real Time Measuring Method on CO2 Emission of Construction Equipment. Korean J. Constr. Eng. Manag. 2013, 14, 78–86. (In Korean) [Google Scholar] [CrossRef]
- Kim, B.S. A study on CO2 emission factor for earth-work equipment using C-FVM. J. Korean Soc. Civ. Eng. 2014, 34, 999–1006. (In Korean) [Google Scholar]
- Kim, S.H.; Lee, D.W. Experimental Research for CO2 Emission Estimation of Medium-Scale Excavator Reflecting Work Characteristics. J. Korean Soc. Civ. Eng. 2017, 37, 717–727. (In Korean) [Google Scholar]
- Jazayeri, E.; Dadi, G.B. Construction Safety Management Systems and Methods of Safety Performance Measurement: A Review. J. Saf. Eng. 2017, 6, 15–28. [Google Scholar]
- Ahn, B.R.; Tae, Y.H.; Kim, D.Y.; Huh, Y.G. An Ordinary Management System for Updating Construction Equipment Prices in the Poom-Saem Based on the Standard Market Price. J. Korea Inst. Build. Constr. 2015, 15, 397–404. (In Korean) [Google Scholar] [CrossRef]
- Sun, H.; Park, Y. CO2 Emission Calculation Method during Construction Process for Developing BIM-Based Performance Evaluation System. Appl. Sci. 2020, 10, 5587. [Google Scholar] [CrossRef]
- Jung, U.S.; Choi, K.S. Comparative Study of Cost Estimate System in Landscape Architectural Construction—Comparison of Unit Price between Actual Construction Cost and Standard Quantity per Unit. J. Korean Inst. Landsc. Archit. 2012, 40, 97–111. (In Korean) [Google Scholar] [CrossRef]
- Land & Housing Research Institute. A Preliminary Study on the Estimated Standard for Construction Duration of Landscape Architectural Construction; Land & Housing Research Institute: Daejeon, Republic of Korea, 2020. (In Korean) [Google Scholar]
- Nowak, J.; Greenfield, J.; Hoehn, E.; Lapoint, E. Carbon storage and sequestration by trees in urban and community areas of the United States. Environ. Pollut. 2013, 178, 229–236. [Google Scholar] [CrossRef] [PubMed]
- Yoon, J.C.; Lee, K.H. A Studies of Amendment a Standard of Estimated Unit Manpower and Material of Landscape Architectural Construction Work Classification. J. Korean Inst. Landsc. Archit. 2011, 39, 119–126. (In Korean) [Google Scholar] [CrossRef]
- Yılmaz, S.; Özgüner, H.; Mumcu, S. An aesthetic approach to planting design in urban parks and greenspace. Landsc. Res. 2018, 43, 965–983. [Google Scholar] [CrossRef]
- Catalano, C.; Andreucci, M.B.; Guarino, R.; Bretzel, F.; Leone, M.; Pasta, S. Evolution of the Approaches to Planting Design of Parks and Gardens as Main Greenspaces of Green Infrastructure. Urban Serv. Ecosyst. 2021, 17, 435–452. [Google Scholar]
- Riikonen, A.; Pumpanen, J.; Mäki, M.; Nikinmaa, E. High carbon losses from established growing sites delay the carbon sequestration benefits of street tree plantings—A case study in Helsinki, Finland. Urban For. Urban Green. 2017, 26, 85–94. [Google Scholar] [CrossRef]
- Han, Y.R.; Park, H.S.; Chang, C.K. Estimation of Construction Equipment Production Rates based on Simulation; Cycle time of backhoe & loader. J. Korea Inst. Build. Constr. 2009, 9, 105–111. (In Korean) [Google Scholar]
- National Statistical Office. Main Statistics of Construction Equipment; National Statistical Office: Daejeon, Republic of Korea, 2023. (In Korean)
- Cho, S.W.; Yoo, S.J.; Park, C.G. Improving Fuel Efficiency of a Hybrid Excavator. Trans. KSME A 2015, 39, 211–217. (In Korean) [Google Scholar] [CrossRef]
- Jassim, H.; Lu, W.; Olofsson, T. Predicting Energy Consumption and CO2 Emissions of Excavators in Earthwork Operations: An Artificial Neural Network Model. Sustainability 2017, 9, 1257. [Google Scholar] [CrossRef]
Figure 1.
Process diagram for the generation of carbon dioxide during the construction of an urban park.
Figure 1.
Process diagram for the generation of carbon dioxide during the construction of an urban park.

Figure 2.
Map showing the locations of the urban parks studied.


Table 1.
Comparison of IPCC estimation methods for carbon dioxide emissions.
| Tier 1 | Tier 2 | Tier 3 | |
|---|---|---|---|
| Principle | Only applies fuel-specific IPCC emission factors to energy consumption by source, mode, and fuel | Applies emission factors based on vehicle type and emission control technology | Applies vehicle-specific emission factors based on vehicle miles traveled |
| Methods | Top-down | Bottom-up | Bottom-up |
| Pros | The most basic method | Accurately calculates emissions | |
| Cons | Vehicle type and mileage are not taken into account | Requires vehicle-specific energy consumption data | |
| Formula: Emission (tCO2) | ∑ [Fuela × EFa] | ∑ [Fuela,b,c × EFa,b,c] | ∑ [Distancea,b,c,d × EFa,b,c,d] + ∑ Ca,b,c,d |
| EF: Emission factor a: Fuel type | b: Vehicle type c: Emission control technology | d: Operating conditions C: Cold start |
Table 2.
Data collection and sources for calculating carbon dioxide emissions with the Tier 2 method.
Table 2.
Data collection and sources for calculating carbon dioxide emissions with the Tier 2 method.
| Data | Source | |
|---|---|---|
| Emission Factor | Equipment carbon emission factor from the carbon emission factor using the national LCI DB (Ministry of Land, Infrastructure and Transport) | |
| Fuel consumption | Workload | Construction Cost Estimation Data (Cases A–D) |
| Equipment usage time per unit of work | Standard Unit Productivity Data on Construction Projects (Ministry of Land, Infrastructure, and Transport) | |
| Equipment fuel efficiency | Cost Calculation Table for Construction Machinery (Construction Association of Korea) | |
Table 3.
Overview of the urban parks studied.
| Unit | Case A | Case B | Case C | Case D | |
|---|---|---|---|---|---|
| Location | Seoul | Gwangju, Gyeonggi-do | Suwon, Gyeonggi-do | Daejeon Metropolitan City | |
| Completion Year | Year | 2005 | 2026 (expected) | 2022 | 2026 (expected) |
| Area | m2 | 480,994 | 342,625 | 355,937 | 135,168 |
| Theme | Community Forest | Rainwater Forest | Arboretum | Garden | |
| Landform | Plain | Mountainous | Mountainous | Mountainous | |
| Total project cost | KRW 1 million | 248,400 | - | 77,684 | 27,090 |
| (USD 1000) | (185,823) | (-) | (58,114) | (20,265) | |
| Landscaping costs | KRW 1 million | 40,315 | 109,702 | 34,640 | 9270 |
| (USD 1000) | (30,158) | (82,066) | (25,913) | (6934) | |
| Promotion method | Public Project | Private Park Special Projects | |||
Table 4.
Carbon dioxide emissions in the construction phase of urban parks (Cases A–D).
| Unit | Case A | Case B | Case C | Case D | |
|---|---|---|---|---|---|
| Theme | Community Forest | Rainwater Forest | Arboretum | Garden | |
| Area | m2 | 480,994 | 342,625 | 355,937 | 135,168 |
| Total | tCO2 | 2033.12 (100%) | 3346.59 (100%) | 3918.78 (100%) | 1238.17 (100%) |
| tCO2 per 100 m2 area | 0.42 | 0.98 | 1.10 | 0.92 | |
| Planting | tCO2 | 1090.84 (53.7%) | 2166.93 (64.8%) | 848.16 (21.6%) | 480.90 (38.8%) |
| Paving | tCO2 | 486.39 (23.9%) | 338.96 (10.1%) | 394.18 (10.1%) | 340.34 (27.5%) |
| Facility const. | tCO2 | 455.89 (22.4%) | 840.70 (25.1%) | 2676.44 (68.3%) | 416.93 (33.7%) |
Table 5.
carbon dioxide emittance during the planting process of urban parks (Cases A–D).
| Unit | Case A | Case B | Case C | Case D | |
|---|---|---|---|---|---|
| Total number of trees | Trees | 13,628 (100%) | 12,022 (100%) | 9687 (100%) | 4505 (100%) |
| Quantity of trees for mechanized construction | Trees | 8653 (63.3%) | 11,280 (93.8%) | 6813 (70.3%) | 2720 (60.4%) |
| Quantity of transplanted trees for mechanized construction | Trees | 1086 (12.6%) | 913 (8.1%) | 232 (3.4%) | 1666 (61.3%) |
| Quantity of new trees supplied externally for mechanized construction | Trees | 7567 (87.4%) | 10,367 (91.9%) | 6581 (96.6%) | 1054 (38.8%) |
| Planting const. | tCO2 | 1090.84 (53.7%) | 2166.93 (64.8%) | 848.16 (21.6%) | 480.90 (38.8%) |
| Amount of carbon dioxide emitted during transplanting | tCO2 | 135.70 (12.4%) | 968.52 (44.7%) | 172.77 (20.4%) | 384.18 (79.9%) |
| tCO2 per 100 trees | 12.50 | 106.08 | 74.47 | 23.06 | |
| Amount of carbon dioxide emitted during planting of new trees | tCO2 | 955.14 (87.6%) | 1198.41 (55.3%) | 549.39 (64.8%) | 96.72 (20.1%) |
| tCO2 per 100 trees | 12.62 | 11.56 | 8.35 | 9.18 |
Table 6.
Carbon dioxide emittance during the paving process of urban parks (Cases A–D).
| Unit | Case A | Case B | Case C | Case D | |
|---|---|---|---|---|---|
| Total paved area | m2 | 108,074 (100%) | 29,582 (100%) | 29,851 (100%) | 21,454 (100%) |
| Wet pavement area | m2 | 28,863 (26.7%) | 4725 (16.0%) | 21,705 (72.7%) | 5572 (26.0%) |
| Block pavement area | m2 | 46,917 (43.3%) | 7838 (26.5%) | 1875 (6.3%) | 12,121 (56.5%) |
| Paving const. | tCO2 | 486.39 | 338.96 | 394.18 | 340.34 |
| tCO2 per 100 m2 of pavement area | 0.45 | 1.15 | 1.32 | 1.59 | |
| Amount of carbon dioxide emitted during wet paving | tCO2 | 108.28 (22.3%) | 53.44 (15.8%) | 215.27 (54.6%) | 69.34 (20.4%) |
| tCO2 per 100 m2 of pavement area | 0.38 | 1.13 | 0.99 | 1.24 | |
| Amount of carbon dioxide emitted during block paving | tCO2 | 137.77 (28.3%) | 106.51 (31.4%) | 26.11 (6.6%) | 233.62 (68.6%) |
| tCO2 per 100 m2 of pavement area | 0.29 | 1.36 | 1.39 | 1.93 |
Table 7.
Major construction machinery used during urban park construction and their carbon dioxide emissions (unit: tCO2).
Table 7.
Major construction machinery used during urban park construction and their carbon dioxide emissions (unit: tCO2).
| Case A | Case B | Case C | Case D | ||||
|---|---|---|---|---|---|---|---|
| Excavator | 1544.30 (76.0%) | Excavator | 2804.46 (83.8%) | Excavator | 3512.67 (89.6%) | Excavator | 1073.04 (86.7%) |
| Vibratory roller | 37.12 (1.8%) | Crane | 302.31 (9.0%) | Water truck | 26.26 (0.7%) | Crane | 73.81 (6.0%) |
| Power | 1.99 (0.1%) | Water truck | 81.94 (2.4%) | Crane | 25.14 (0.6%) | Vibratory roller | 23.34 (1.9%) |
Disclaimer/Publisher’s Note: The statements, opinions and data contained in all publications are solely those of the individual author(s) and contributor(s) and not of MDPI and/or the editor(s). MDPI and/or the editor(s) disclaim responsibility for any injury to people or property resulting from any ideas, methods, instructions or products referred to in the content. |
© 2024 by the author. Licensee MDPI, Basel, Switzerland. This article is an open access article distributed under the terms and conditions of the Creative Commons Attribution (CC BY) license (https://creativecommons.org/licenses/by/4.0/).
Share and Cite
MDPI and ACS Style
Oh, C. Characteristics and Reduction of Carbon Dioxide (CO2) Emissions during the Construction of Urban Parks in South Korea. Sustainability 2024, 16, 3405. https://doi.org/10.3390/su16083405
AMA Style
Oh C. Characteristics and Reduction of Carbon Dioxide (CO2) Emissions during the Construction of Urban Parks in South Korea. Sustainability. 2024; 16(8):3405. https://doi.org/10.3390/su16083405
Chicago/Turabian StyleOh, Changsong. 2024. "Characteristics and Reduction of Carbon Dioxide (CO2) Emissions during the Construction of Urban Parks in South Korea" Sustainability 16, no. 8: 3405. https://doi.org/10.3390/su16083405
Note that from the first issue of 2016, this journal uses article numbers instead of page numbers. See further details here.