
Liquefied Petroleum Gas Access and Consumption Expenditure: Measuring Energy Poverty through Wellbeing and Gender Equality in India

Sustainability Research Institute, School of Earth and Environment, University of Leeds, Leeds LS2 9JT, UK
*
Author to whom correspondence should be addressed.
Sustainability 2024, 16(8), 3413; https://doi.org/10.3390/su16083413
Submission received: 15 February 2024
/
Revised: 18 March 2024
/
Accepted: 15 April 2024
/
Published: 19 April 2024
Abstract
:Despite fast electrification in India, many communities still suffer from the direct and indirect effects of energy poverty. We investigate whether access to liquified petroleum gas (LPG) and consumption expenditure can be used as measures of energy poverty in India, with a particular focus on gender equality. A district-level, quantitative analysis of household survey data was performed for the energy-poor states of Bihar, Jharkhand, Madhya Pradesh, Odisha, Uttar Pradesh, and West Bengal. Wellbeing and gender equality indices were constructed from contextually relevant indicators, whilst LPG access was considered in terms of physical access, affordability, and awareness. Levels of consumption expenditure were considered based on the updated urban poverty line for India. We found that LPG access and consumption expenditure do not have a significant relationship with wellbeing or gender equality. The result indicates that the traditional economic approach of using consumption expenditure cannot capture the multidimensionality of energy poverty. This has significant implications as it challenges the status quo of energy poverty measurement. The research also adds value to existing arguments that electricity access cannot be used as a sole indicator of energy poverty, by extending the argument to access to a modern cooking fuel. LPG access was, however, strongly associated with the education of women on the health effects of smoke. Consumption expenditure is also strongly associated with female property ownership, which calls for future research on this novel relationship.
1. Introduction
The World Economic Forum [1] suggests that energy is the lifeblood of the global economy. Yet, 770 million people did not have access to electricity in 2019 and the COVID-19 pandemic reversed much of the progress made [2,3,4]. In the recent COP 26, India ambiguously pledged to cut emissions to net-zero by 2070, leaving many critics sceptical of the lacking energy infrastructure [5]. India has accelerated access to electricity and modern cooking fuel, liquified petroleum gas (LPG), through flagship programmes like the Pradhan Mantri Ujjwala Yojana (PMUY) scheme [6]. However, whilst physical access is improving, affordability is still a challenge in rural India, which is heavily dependent on traditional fuels [7]. The traditional fuels, such as biomass, are not only time consuming to gather and of low energy efficiency, but they also pose serious health risks [8]. Therefore, a more comprehensive view of access to modern cooking fuel in India is needed.
We will focus on the access to LPG as a modern cooking fuel for several reasons. First, access to LPG has been given less attention in the energy poverty literature than electricity access. Second, access to LPG is easier and less costly to secure than access to electricity, particularly in the rural areas. Third, while a fossil fuel, the transition from biomass to LPG can realise significant greenhouse gas reductions [9]. Fourth, LPG helps reduce women’s time use for fuel gathering and their exposure to smoke from biomass burning with attendant health benefits.
Consumption expenditure has often been used as a measure of poverty and can be defined as “the spending by households on goods and services to satisfy needs” ([7], p. 2). However, consumption expenditure cannot capture the multidimensionality of energy poverty [10,11,12], which extends to social provision and wellbeing, including education, health, and access to clean water [13]. Access to modern energy is a better indicator of energy poverty although its use, particularly for electricity access, is contested [14,15,16]. A lack of access to modern cooking fuel affects women more adversely than men in terms of premature death due to indoor air pollution [17]. Yet, the understanding of energy poverty as a gender issue and whether measures of energy poverty capture gender inequality are largely missing from the literature. Our aim is to determine whether LPG access and consumption expenditure can be used as measures of energy poverty, defined by wellbeing and gender equality, in India.
1.1. Theory behind Energy Poverty
The international 2030 pledge to leave no one behind has spurred a wealth of literature on energy inequalities around the world [18]. Yet, there has been a great difficulty in formulating a singular definition of energy poverty. It has been argued that this difficulty relates to how poverty itself is understood. After all, poverty is a moral question that can refer to either economic or social positions [19]. Characterising poverty has focused on income, with specific definitions dependent on international organisations’ decision to utilise poverty lines based around median national income, or absolute poverty lines of a dollar amount per day [20,21]. That is, the lack of a singular definition of poverty is the result of the promotion and use of different estimations of poverty [22,23,24].
The focus on income in the measurement of poverty has led to the energy ladder model of fuel choice in developing countries: households move upwards from dirty, inefficient fuels to more advanced fuels as income increases in a unidirectional way [25]. Yet, a meta-analysis of household data indicates that people use multiple fuels at the same time based on availability, affordability, risk management, or cooking preference [26]. Unidirectional leaping to new fuels is thus unlikely. The significance of this insight for policies seeking to accelerate electrification and LPG access in developing countries is clear: there is a need to move beyond the simple ideas about income exclusively driving energy use and fuel choice.
There is literature that seeks to better account for the multidimensionality of energy poverty. Its starting point is that the needs of people for establishing wellbeing are social constructs based on different welfare ideologies. Already Maslow [27] suggested a universal hierarchy of needs from physiological needs to the more social concepts of needs of belonging and respect. Sen [28] in turn suggested a capabilities approach to wellbeing, arguing that one should focus on what a person can do and choose to do, as opposed to what they have. These subjective perceptions of wellbeing proved pivotal for the Human Development Index (HDI) [29]. The upshot is that it is difficult to fully capture all dimensions of energy poverty for both developing and developed nations, each with their own priorities, social customs and demands. The question about energy poverty is: what should one consider as the effects of a lack of energy and how should they be measured?
1.2. Traditional Approaches to Energy Poverty
European approaches to energy poverty have been based on Boardman’s ([30], p. 30) definition that fuel-poor households are unable to “afford adequate warmth because of the energy inefficiency of the home”. The focus on warmth has remained central even after changes to the definition [31]. This kind of fuel poverty is more relevant for developed countries in which affordability is the greatest barrier to energy sufficiency. In developing countries, interpretations of energy poverty are focused on their different societal issues. Nevertheless, governments everywhere focus on economic factors when measuring energy poverty and designing policy interventions [32].
The economic threshold approach creates a monetary energy poverty line. However, the literature is undecided as to whether income is an appropriate proxy for energy poverty. Khandker et al. [33] show that there are no strong correlations between income poverty and energy poverty among rural households, unlike among urban households. An alternative economic threshold classes a household as poor and energy-poor if they spend little on goods and services like electricity. Whilst this approach goes one step further in considering what is spent on energy ([34], p. 16, [35], p. 9), limitations remain. For example, countries such as Kenya, Congo, and Mali have moderate levels of consumption expenditure on energy yet suffer from severe multidimensional energy poverty. That is, consumption expenditure understates the level of deprivation. This demonstrates that at least in developing countries, the economic and multifaceted measures of energy poverty are not the same.
Another approach to measuring energy poverty defines a physical threshold of energy consumption to determine the energy poor. For example, Goldemberg and Johansson [36] used energy consumption as a measure of energy poverty, finding strong relationships with poverty indicators like the HDI. However, there are two ways to quantify household energy consumption: measuring its total energy use or end-use energy. Whilst rural households may use a lot of energy in the form of cheap biomass, its energy efficiency is significantly lower than that of electricity or LPG [37]. End-use energy methods have helped to show that rural households in India lose around 80% of the total energy they use, 25% more than urban households [33]. So, although it is easier and more common to measure total energy use, it is not a good indicator for the real experience of energy-poor rural households.
Another key weakness with physical thresholds of energy poverty is that high consumption does not always mean an absence of energy poverty. As already noted, the rural poor may use a lot of inefficient bioenergy yet fail to meet their energy service needs; vice versa, low energy consumption may not entail energy poverty and low wellbeing. For example, in Zambia, Vietnam, and Nepal many households with a lower final energy use have achieved higher states of wellbeing if they have access to modern energy [9]. To conclude, there is no single physical threshold of energy consumption that could be used to define the energy-poor across all contexts, and even if it did exist it would add little value to emerging discussions on multifaceted energy poverty.
Foster et al. [38] used a blend of physical and economic methods—energy consumption of a household if it falls below 10% of the income poverty line, one US dollar per day. They found that access to electricity has the largest impact on energy poverty, not its pricing or household income [38]. Others have reported similar findings [32,39]. A key question therefore is, should we continue to use the traditional approach to energy poverty, or start looking at the issue at hand more broadly? The challenge of measuring energy poverty, resulting from the lack of clarity of its conceptualisation, is likely a key reason for the dominance of economic and physical approaches. The two approaches ensure objectivity and can be used to make comparisons across time, offering practical value in an uncertain field of study. Yet, energy poverty has become recognised as a multifaceted concept that should not be reduced to monetary notions. A review of alternative evidence is therefore crucial.
1.3. Beyond Energy Affordability and Consumption
The International Energy Agency (IEA) [40] has played a key role in establishing access and dependency on harmful energy sources as two key components of energy poverty. Together they help to define energy poverty as “a lack of access to electricity networks or dependence on burning solid biomass in inefficient and polluting stoves to meet household energy needs” ([41], p. 97). New indicators are also focusing specifically on access to electricity and clean cooking facilities.
A household-level analysis of energy poverty by Nathan and Hari [42] suggests that access to modern cooking fuel should be a critical variable in the definition and measurement of energy poverty. They also consider that economic measures of energy poverty are only proxies for income poverty and therefore are not highlighting the roots of energy deprivation in developing countries [42]. They focus on urban India, prompting a question of whether the same conclusions would pertain to rural communities. For example, stronger cultural and social barriers may exist in rural communities: as rural areas have a higher proportion of households that decline the use of modern energy due to personal preferences, they still have access [43].
The literature on access for energy poverty suggests new avenues for investigating technological thresholds of energy poverty: the energy poor are those who cannot access modern energy services. Better socio-economic and infrastructure characteristics, as well as higher literacy rates, have strong correlations with access to modern energy such as LPG and electricity [32]. This is not apparent when households increase their consumption of biomass and kerosene. Significant correlations also exist between the access to LPG and food calorie intake, suggests Shonali Pachauri [44]. Further studies shed light on causality between access to modern energy and wellbeing [45]. Research around access indicates that it is better tailored to multifaceted definitions of energy poverty, taking into consideration health and wellbeing, as opposed to energy consumption measures. Whether this is true in relation to the use of expenditure approaches in rural areas of developing countries has not yet been conclusively established. Furthermore, whether access alone, as a singular metric, can fully capture all elements of energy poverty is disputed [14,15,16]. One thing is certain though: electricity access is being given much more attention than access to modern cooking fuels in the academic literature and public policy [46].
In Europe, criticism of the expenditure approach has led to proposals of a consensual method to quantifying energy poverty [47,48]. In this approach, indicators are self-reported, for example by asking a household if they can afford to heat their home to a comfortable level. This approach recognises the indirect aspects of energy poverty such as social exclusion [49] and favours a bottom-up approach for understanding the household struggles. However, Boardman [50] questions the validity of the consensual approach, suggesting that energy-poor households can decline to believe that they are uncomfortably cold even if that is their reality. Subjective variables, such as a comfort level, may also have different meanings in different cultural environments. Therefore, there are limitations to adopting consensual approaches to energy poverty outside of Europe.
1.4. Composite Energy Poverty Indices
A multitude of variables are considered to help explain how energy is related to human development [51,52,53]. The IEA created an Energy Development Index (EDI) to align it with the HDI. It includes variables like electricity consumption per capita and percentage of the population with electricity access [54]. The methodology is tailored to national measurements so it cannot capture wellbeing experiences at the household level [55]. In addition, by using variables like energy consumption per capita, the EDI is favouring countries that subsidise electricity [56] and omits energy efficiency, a key aspect of sustainable development around energy. Iddrisu et al. [57] attempted to correct this weakness with a composite Sustainable Energy Development Index (SED). Not only is there a positive correlation between the SEDI, EDI, and HDI, but multiple dimensions of sustainability such as economic, social, environmental, and institutional aspects are also better captured with the SEDI [57]. This gives the SEDI a significant advantage over other indices. A high EDI or HDI score can very easily ignore energy unsustainability. For example, they would not highlight low self-sufficiency of a nation like Japan and how this may lead to knock-on effects at the household level. All in all, the SEDI recognises that, like most aggregated metrics, a masking effect is present in which strong results from some indicator variables hide very poor results from others [57].
Mirza and Szirmai [58] conducted an energy poverty survey in rural Pakistan to identify the characteristics of energy-poor and non-poor households. A composite Energy Poverty Index (EPI) was then formulated based on how rural energy markets function. For example, time spent collecting energy per week is an indicator of energy inconvenience [58]. The advantage of EPI is the focus on rural households in a developing country, an often-neglected subpopulation. The research highlighted that 92% of the rural households in the Punjab province suffer from severe energy poverty [58]. The EPI also uses energy consumption as an indicator of energy shortfall for the households, a subindex of energy poverty. This suggests that there could be a role for traditional energy poverty approaches to serve as a complementary metric. The EPI is praised by Culver [55] because it recognises the imperative of having access to modern cooking fuel, labelling households that have electricity but not LPG as still energy poor. However, the index has a narrow focus on solely the needs of a household, with little consideration for wider issues of energy deprivation, such as low wellbeing.
1.5. Wellbeing and Gender
Energy poverty is a complex concept that includes life expectancy, housing quality, education, and access to social services [13]. Yet, only a few studies have investigated and measured the link between energy and wellbeing [59,60]. The MEPI, developed by Nussbaumer et al. [15], is focusing on energy deprivation within the idea of energy poverty. Indicators include access to modern cooking fuel, lighting, access to clean air inside homes, and ownership of a telephone [15]. Incidence and intensity of energy deprivation together constitute the overall MEPI value. Consequently, the multifaceted nature of the MEPI is capturing the link between energy and wellbeing more comprehensively and across both developed and developing countries and demonstrating its wide practical value and applicability [61,62,63]. However, it does not consider the use of energy beyond domestic household use, for example, for working at home [55]. Furthermore, whilst its variables are indicators of energy poverty, small rural communities may not consider certain variables, e.g., telephone ownership, a priority.
The World Health Organisation (WHO) has played a crucial role in evidencing the association between the use of dirty fuels in households and its health effects, concluding that even in the most polluted cities, indoor pollution is far greater than outdoor pollution [64]. The ensuing health effects are not equally distributed across the population. Women and children spend more time at home than men where energy poverty is common, leading to greater exposure [17]. As a result, women are three times more likely to develop pulmonary diseases and twice as likely to suffer from lung cancer [17], placing gender at the heart of the energy poverty problem.
A research study drawing from a sample of 51 developing countries from 2002–2017 found that when energy poverty was reduced and female salaried work increased, economic advantages were conferred for the households [65]. Köhlin et al. [66] in turn conclude that substantial gender benefits result from improving access to modern energy, including greater female decision-making. Electricity access in India has also been found to significantly improve the occurrence and duration of reading by women, regardless of their level of education [67]. However, positive effects are not always guaranteed, as access to television is associated with an increase in child favouritism, for example male children sent to school instead of daughters [68]. In Asian communities where limited funds require prioritisation, boys are almost always preferred [69]. However, in Bangladesh, when families have access to electricity, the schooling of girls increases by 20% in both low- and high-income families [70]. Whether traditional measures of energy poverty fully consider gender equality is inconclusive. In South Asia, gender is given minimal attention in energy policy [71]. Therefore, energy poverty should be extended to consider gender equality and there are substantial opportunities to explore these relationships further in India.
2. Materials and Methods
The purpose of this research was to examine the relationships between the measures and effects of energy poverty, with an emphasis on gender. It examined LPG access and its relationship with wellbeing and gender equality, and consumption expenditure and its relationship with wellbeing and gender equality. The research involved a district-level quantitative analysis of data from two large-scale household surveys in the states of Bihar, Jharkhand, Madhya Pradesh, Odisha, Uttar Pradesh, and West Bengal in India.
District was the unit of analysis. The choice was inspired by Vepa et al. [72] who used a district-level analysis of agricultural development in a richer way than household-level analyses can achieve. The research design was based on the literature on energy poverty associations, which informed the use of quantitative methods and data to test the relationships [73]. Because of the exploratory nature of the research, a further national-level analysis was used to complement the district level analysis as it was important to ensure that ecological fallacies about households were avoided [74].
The research used quantitative data from household surveys to extract variables related to wellbeing, gender equality, consumption expenditure, and LPG access and to integrate them into an index. Variables were recoded about the level of wellbeing, gender equality, consumption expenditure above the poverty line, and access to LPG fuel, in a binary format. Quantitative data cases (households) were subsequently merged based on their district and what indices they fit within and then analysed using statistical testing. However, we recognise the constraints of quantitative methods, as access to energy can be subjective and personal in marginalised communities [75].
Table 1 indicates all the variables used alongside the associated index. Table 2 shows the variables accompanied with the questions chosen from the household surveys; the recoding aspects are not of importance yet and are covered in the data analysis (Section 3.3). Both variable creation and question selection were grounded on an extensive literature review and critical analysis. Short-term illness was chosen as an indicator of physical wellbeing. Cross-sectional, experimental and longitudinal studies associate physical illness with wellbeing, in particular happiness [76,77]. However, using solely short-term illness is contentious. Verbrugge et al. [78] show that serious long-term illnesses also reduce wellbeing. Therefore, one could argue that air pollution from chulhas due to poor modern energy access could directly relate to wellbeing due to both acute and chronic exposure [79]. Despite this, a reduced timescale of illness was chosen as an indicator.
Education was an obvious choice for the wellbeing index, as it contributes to economic wellbeing and personal development [81]. Lack of education is also attributed to social exclusion, as a denial of public services like schooling significantly correlates to poor social wellbeing and low perceived contribution to society [82]. It could be argued that access to education, as opposed to education completion, is more relevant. However, as primary education completion is compulsory in India, we focused on the constitutional human rights of wellbeing [80]. The social inclusion variable also fed into social wellbeing and sought to capture trust and reciprocation in districts and contributing to higher levels of wellbeing [83].
The safety indicator also relates to social cohesion. As seen in Table 2, using a survey question based around themes of connectedness to community as well as security, which can reduce mental discomfort, led to holistically capturing the peace of mind of a household [84]. The safety indicator also goes beyond external forms of crime and domestic violence, which is an impediment to multiple forms of wellbeing within a household. However, as most domestic violence is targeted at women in India, it was thought to be best excluded for an ungendered investigation of wellbeing [85].
The availability of drinking water is a contextually relevant indicator for India as over 91 million people lack access. Unsafe water supplies lead to increased chronic and acute illness, reducing the chances of completing education and participating in work. The availability of drinking water in summer was the chosen variable, as the rural states focused on in this research suffer from extreme groundwater depletion (see Table 2) [86,87]. It represents the resilience of the household and district at times of hardship. Indoor air pollution was also included as an indicator of wellbeing because its impact outweighs that of outdoor pollution in India [88]. Health impacts negatively affect economic prosperity and happiness, but the variable also indirectly relates to household education, as smoke exposure is commonly known to be harmful (see Table 2).
We sought to capture gender equality through four key measures: work, ownership, education, and maternal health [89,90,91]. Women’s employment in salaried work is not always a priority in rural communities, so the index focused on female empowerment and their ability to make decisions around work (see Table 2). A gender gap is also present in land rights in developing countries, and this deserved recognition as a variable, particularly as increased ownership can lead to reduced levels of domestic violence [92]. Maternal health also has an explicit link to gender equality and safety in rural India [93]. Finally, as most health effects of indoor air pollution inflict women, knowledge of the effects of smoke was also included [79,94].
Using consumption expenditure and LPG access variables was logical due to research aims. The LPG variable went beyond connection to include economic accessibility and affordability because affordability is still an issue in rural India [7]. Educational accessibility was also included, as households in marginalised communities may not know how to obtain an LPG connection [95]. The variable of consumption expenditure focused on how much a household spends on their needs per month. An urban poverty line of 1407 rupees, newly suggested by the independent consultation of the Rangarajan Committee, was adopted [96]. Whilst all the focused states are mostly rural, the research used a higher urban poverty line because some districts within the states could be urban.
2.1. Data Collection
Data were sourced from the India Human Development Survey 2 (IHDS II) [97] and the Access to Clean Cooking Energy and Electricity: Survey of States (ACCESS) [98]. IHDS II offered data on wellbeing and gender equality indicators for 2011–2012 whilst ACCESS provided data on LPG access and monthly consumption expenditure for 2015 [97,98]. All survey data were at the household level, quantitative, and collected from the answers to the questions indicated in Table 2.
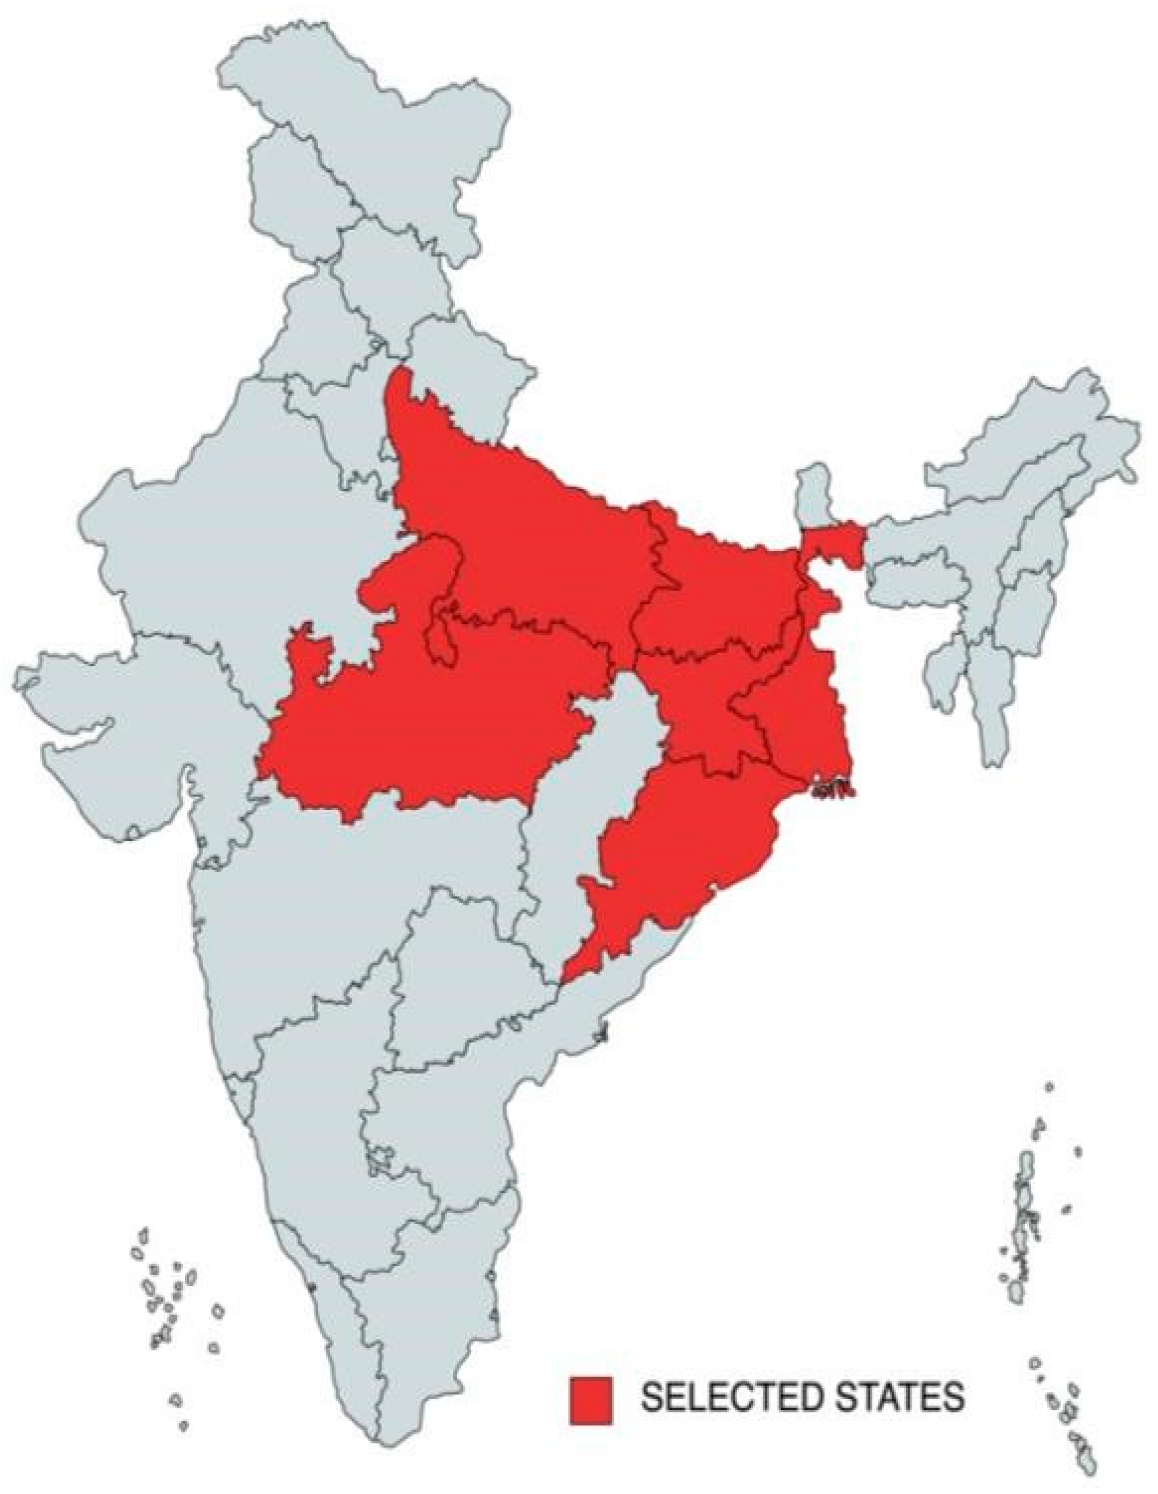
The analysis focused on the Indian states of Bihar, Jharkhand, Madhya Pradesh, Odisha, Uttar Pradesh, and West Bengal (Figure 1). Whilst IHDS II covered all Indian states, ACCESS data were limited to the above 6 states. Although the states are unrepresentative of India due to a north-eastern dominance, they are the most populated and most energy-poor states [43]. Uttar Pradesh, for example, has 166 million people and the largest share of unelectrified households unwilling to connect [43]. The states are also in the top 11 for the “largest percentage of the population living in rural areas”—from 89% in Bihar to 68% in West Bengal—excluding states with a population below 10 million ([99], p. 8).
A strength of the IHDS II is that it captures a range of direct and indirect indicators for wellbeing and gender equality. Whilst obtaining data from one survey would have been preferable, and many studies use the National Sample Survey Organisation (NSSO), a difference of 3–4 years in the datasets is small [32,100,101]. IHDS II and ACCESS were both conducted by independent research institutions to avoid political contention about the data, as Indian official statistics suffer from credibility issues [102,103]. We conducted a brief secondary data analysis (Table 3) to assess the data.
The use of household survey data aggregated to the district level was most appropriate for this research. India is a developing country where registration systems are limited, creating information gaps on poor rural communities in which energy access is most restricted [104]. An advantage of the household survey is discretion, which is particularly relevant when considering the freedom of women in the context of traditional, socially prescribed gender norms [105].
Table 4 indicates the number of cases of data for each state. The percentages were not the same for all states due to the proportionate stratified sampling based on population used in IHDS II and ACCESS. By utilising proportionate stratified sampling techniques, external validity was enhanced and the research could be better generalised to the entire population of the 6 states [106].
2.2. Data Analysis
The Statistical Package for the Social Sciences (SPSS) 28 was used to conduct a descriptive and inferential statistical analysis. IHDS II and ACCESS datasets were merged into one SPSS file. Data cleaning was performed to eliminate coding inconsistencies and to handle missing data. Recoding the variables was the most important form of data cleaning. Table 2 highlights the recoding approach, which was used to transform the data into a binary format, whereby a value of 0 would always equate to the most ideal outcome of the variable, and a value of 1 would equate to the worst possible outcome. For example, a value of 0 for education indicated that the household had completed compulsory education, whereas a value of 1 indicated that compulsory education had not been completed. Recoding of variables also involved grouping and categorising original data values together into this binary format of “ideal vs. worst outcome”. Table 2 shows that economic activity was originally a continuous variable but transformed into categories of above or below the urban poverty line.
Any districts that did not have data from both IHDS II and ACCESS were excluded. As displayed in Table 1, certain variables, like air pollution in the wellbeing index, had lower numbers of valid data points and higher levels of missing data; this limitation is explored further in Section 4.5. If cases were excluded based on not having data on all variables, this would have led to a considerably smaller amount of available household data and reduced the statistical power of the study [107]. Instead, the case values for each index were totalled and the mean calculated for each of them, in a continuous data format. This limited the impact of missing data but also preserved the integrity of the data in the sense that 0, the minimum, always indicated the best outcome (e.g., 100% of the district population with the most ideal form of wellbeing) and 1, the maximum, indicated the worst outcome (i.e., 100% of the district with the worst wellbeing).
3. Results
To conduct a district-level analysis, the scores of the indicator variables for the wellbeing, gender equality, LPG access, and consumption expenditure indices were totalled for each household and averaged for each district. Table 5 shows an extract of the means for each index for the state of Madhya Pradesh. There was a data range of 0–1 (good to bad) for each index value due to the binary nature of the recoded data. Section 4.1 first characterises the data with descriptive statistics. Then, the relationships between the measures, LPG access, and consumption expenditure, and the effects, wellbeing, and gender equality of energy poverty are tested with the relevant inferential statistics (Section 4.2 and Section 4.3). Finally, a further analysis of associations between the measures of energy poverty and individual indicator variables of wellbeing and gender equality is detailed (Section 4.4).
3.1. Descriptive Analysis
For LPG access, the minimum score of 0.429 was for the district Muzaffarnagar, Uttar Pradesh and the highest score of 0.946 was for the district Supaul, Bihar (see Appendix A). Yet, the state of Odisha had the highest average score of 0.893, indicating the worst access to LPG in the 6 states. A Kolmogorov–Smirnov test for normality yielded a nonsignificant result (p-value > 0.05), so LPG access is considered to have a normal distribution. A normal Q–Q plot of the index corroborated a normal distribution with a slight skew to the left, in line with a Skewness statistic of −0.876 (see Figure 2). An overall mean LPG score of 0.760 was obtained, and a standard deviation (SD) of 0.026. Therefore, LPG access had a much poorer average score in comparison to the other indices.
Consumption expenditure (Figure 3) was non-normally distributed, with skewing to the right and heavier tails in comparison to a normal distribution. An interquartile range of 0.024 and a median of 0.030 was found. The measure of central tendency was considerably lower than the values for the other indices, and alongside the histogram, indicates higher consumption expenditure and more “ideal” scores. All the outlier districts were in Madhya Pradesh: they were not removed as they may indicate higher consumption expenditure in the state [108].
For the wellbeing index, the minimum value 0.255 was for the district of Katni in Madhya Pradesh whilst the highest score of 0.557 was for Supaul in Bihar (see Appendix A). Figure 4 shows that Bihar had the highest average wellbeing score and the largest range of results, so, it had the poorest and most varied wellbeing. Skewness and Kurtosis statistics indicated fairly symmetrical data, −0.497 and −0.557, respectively. A Kolmogorov–Smirnov test for normality also yielded a non-significant result (p-value > 0.05) indicating a normal distribution. An overall average wellbeing score of 0.406 and an SD of 0.078 was found.
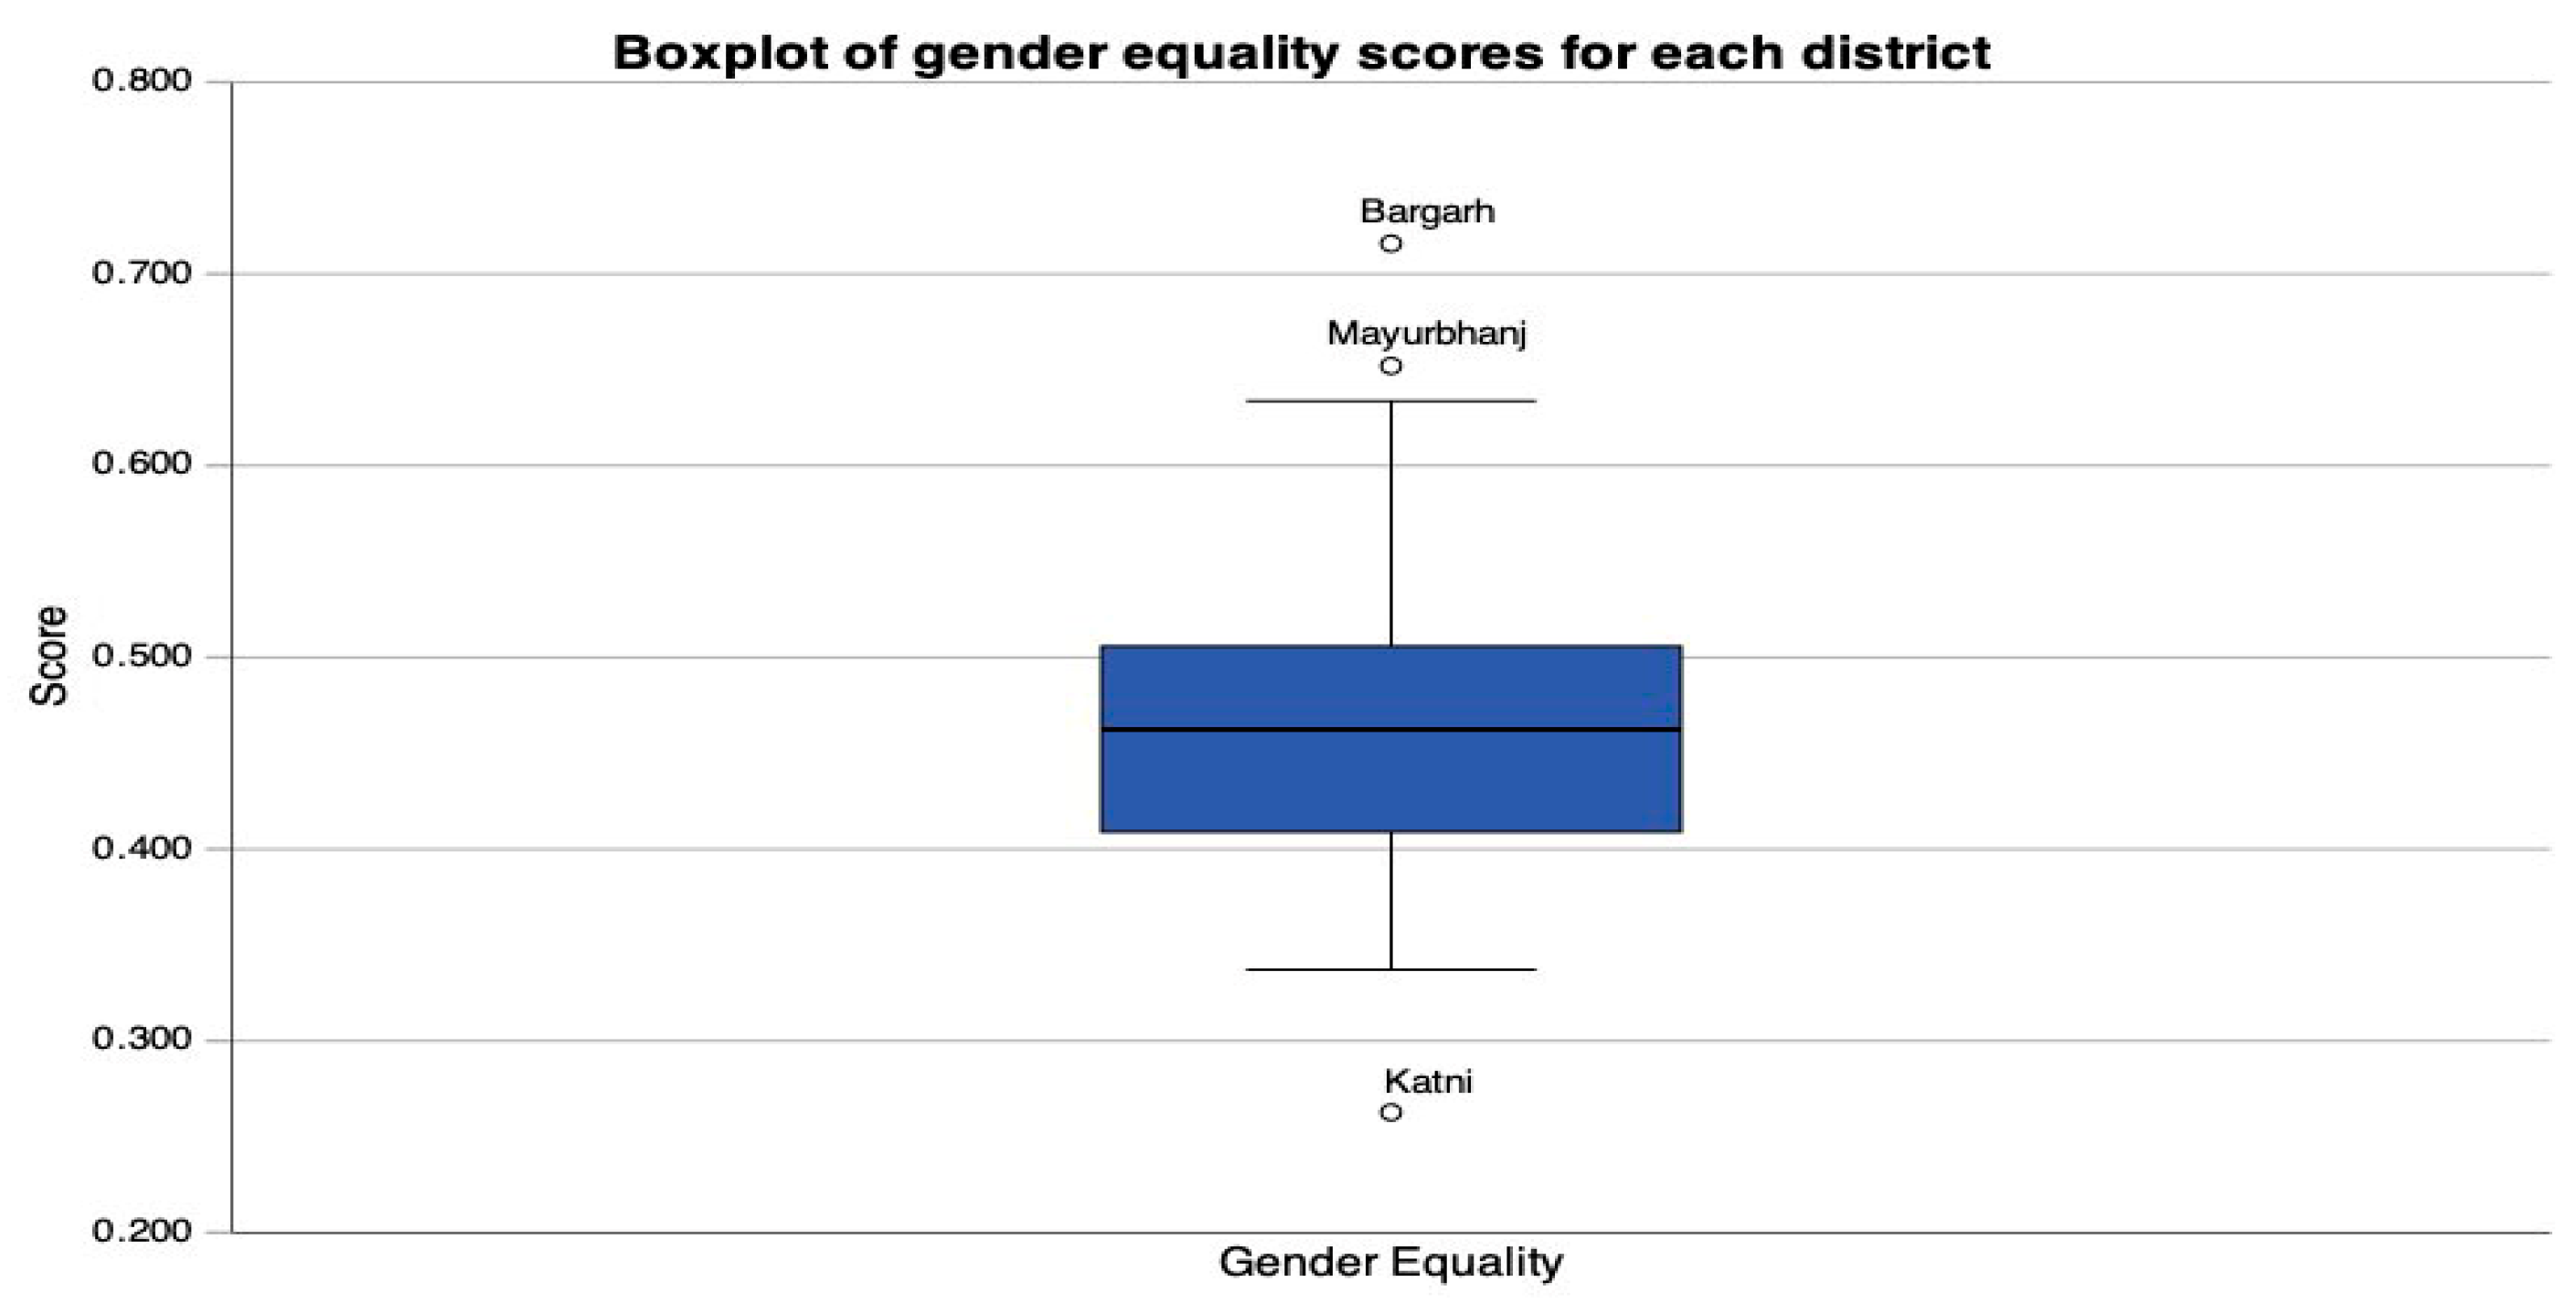
The gender equality index was similar to the wellbeing index, with a mean score of 0.466 (SD = 0.019). However, the Skewness and Kurtosis statistics of 0.561 and 0.920 indicate that the data skew slightly positive and have a more heavily tailed distribution. However, a non-significant result (p-value > 0.05) for a Kolmogorov–Smirnov test suggested a normal distribution. A boxplot highlighted disproportionate tails and unveiled three outliers, Katni, Bargarh, and Mayurbhanj from Madhya Pradesh and Odisha (see Figure 5). The outliers were not excluded from analysis because Katni also had the lowest value and thus the best score for wellbeing: the data may indicate high social development in the district as opposed to data errors. Furthermore, Bargarh and Mayurbhanj are both in Odisha, a state with a smaller population and higher regard for gender equality [109].
3.2. LPG Access
When statistically testing LPG access with wellbeing, the null hypothesis was that there is no significant relationship between them. To determine a level of association between the two continuous, normally distributed variables, a Pearson correlation test was used. At a 95% confidence level, there was no correlation between wellbeing and LPG access (Pearson’s product-moment correlation, r = 0.072, n = 27, p > 0.05). The null hypothesis was therefore confirmed. Figure 6 presents the scatterplot for the relationship between LPG access and wellbeing, which indicates that there were many districts with poor LPG access yet good wellbeing scores, which negated any positive relationship.
For LPG access and gender equality, the null hypothesis was that there is no significant relationship between them. A Pearson correlation test was used. At a 95% confidence level, there was no significant correlation between gender equality and LPG access (p > 0.05). The Pearson’s product-moment correlation (r = 0.276, n = 27) suggested a low correlation, as seen in the scatter plot in Figure 7. Districts with poorer LPG access had worse gender equality. However, many districts also had poor LPG access and good gender equality. Thus, the null hypothesis was accepted.
3.3. Consumption Expenditure
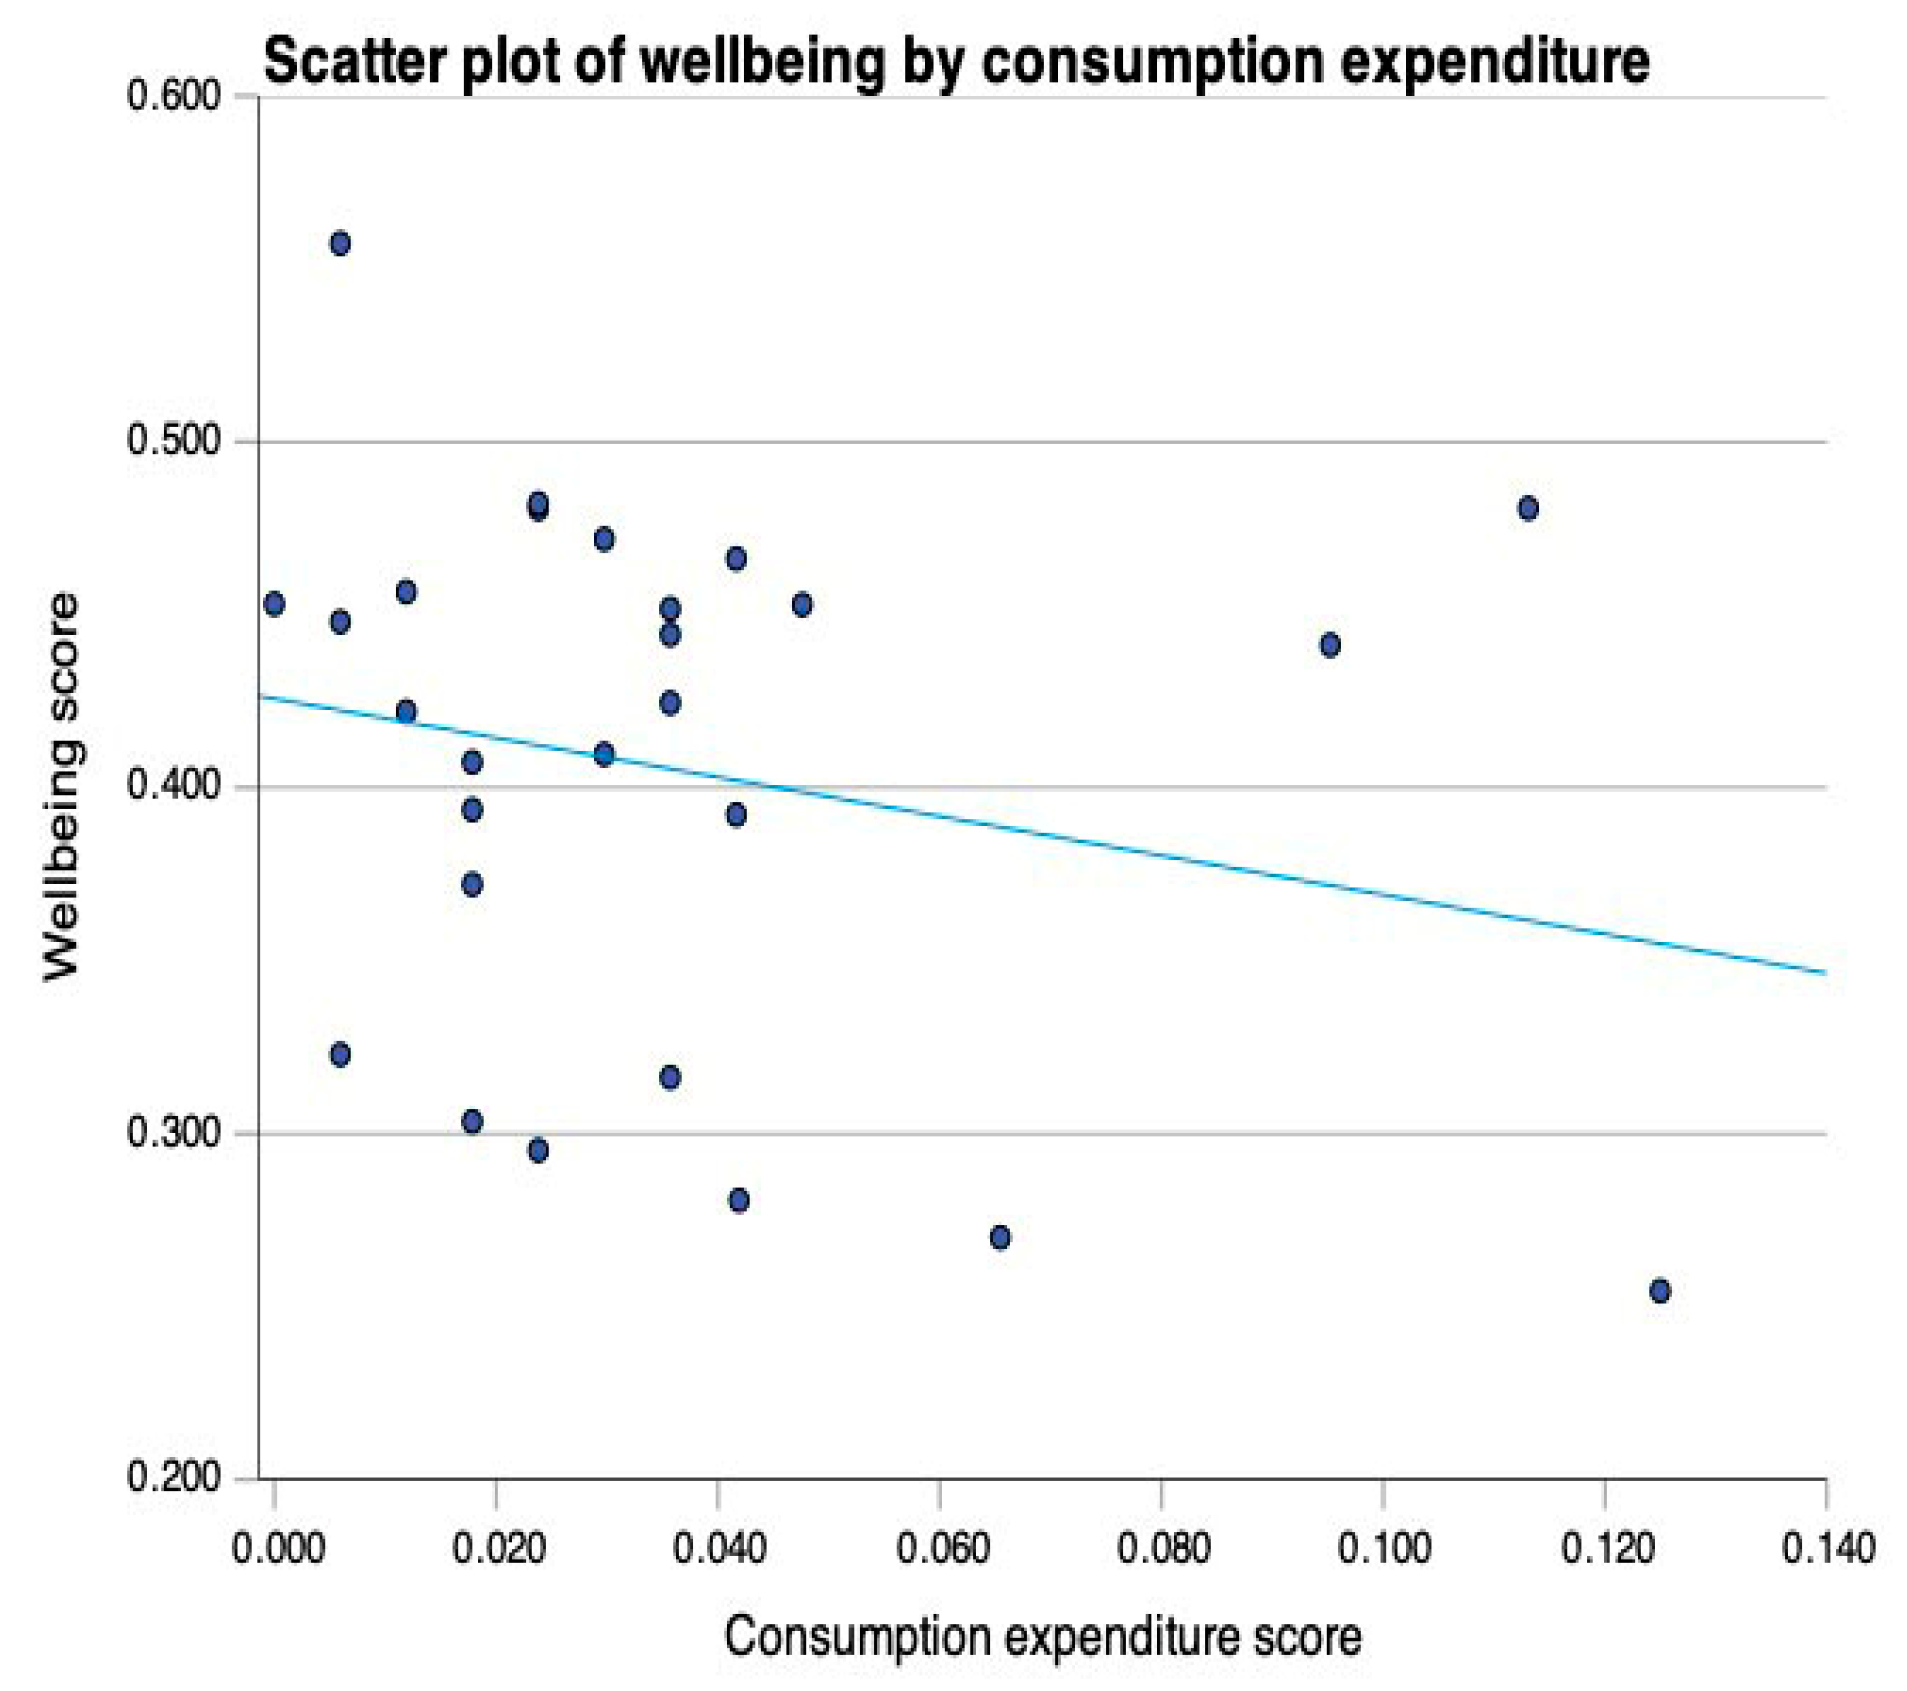
The null hypothesis was that there is no significant relationship between wellbeing and consumption expenditure. Because consumption expenditure was not normally distributed (see Figure 8), a non-parametric test was used. At a 95% confidence level, there was no significant correlation between wellbeing and consumption expenditure (Spearman’s rho correlation coefficient, r = −0.186, n = 27, p > 0.05). Therefore, the null hypothesis was accepted.
For consumption expenditure and gender equality, the null hypothesis was that there is no significant relationship between them. The Spearman’s rho correlation test was used due to a continuous but non-normal distribution of data. At a 95% confidence level, there was no significant correlation between gender equality and consumption expenditure (p > 0.05). The null hypothesis was subsequently accepted. The Spearman’s rho correlation coefficient (r = −0.367, n = 27) suggested a moderate correlation, as seen in the scatter plot in Figure 9. Despite significant clustering of low consumption expenditure and high gender equality scores, a negative relationship was present; as consumption expenditure worsened, gender equality improved somewhat.
3.4. Further Analysis of Indicator Variables
Non-significant results were found for the 4 relationships tested above. So, the association between LPG access, consumption expenditure, and the individual indicator variables were explored next. These associations were tested using all 4654 individual data cases to see if there were associations between the variables within the indices and whether masking effects could explain the lack of significance of results obtained above [57]. As short-term illness and education had many more data points than other wellbeing variables and therefore greater weighting, this concern was relevant.
The means of variables were not used in the further analysis, only the binary format of 0 or 1. Therefore, a chi-squared analysis was used. To compensate for only having two values for each variable, a Yates correction for continuity was used [110]. A chi-square test indicated a two-sided significant association between LPG access and education on health effects (χ2 = 14.04, n = 2708, df = 1, p < 0.001). This meant the rejection of the null hypothesis, which was that there is no significant relationship between female education on health effects and LPG access. Table 6 indicates that a higher proportion (92%) of women with LPG access understand the dangers of chulha smoke than women without LPG access (86.4%). A chi-square test also indicated a two-sided significant association between consumption expenditure and property ownership (χ2 = 14.83, n = 2615, df = 1, p < 0.001). This meant a rejection of the null hypothesis that there is no significant relationship between female property ownership and consumption expenditure. Table 7 highlights that women below the poverty line were much more likely (25.6%) to have their name in the ownership documents of their accommodation than women above the poverty line (11.3%). No significant associations exist between the energy poverty and wellbeing variables.
4. Discussion
The aim of this research was to determine whether LPG access and consumption expenditure could be used as measures of energy poverty in India. Consumption expenditure has no significant association with wellbeing or gender equality, and no significant associations were found for LPG access either. Next, the results are unpacked and critically evaluated. The significance, implications and limitations of the results, and future research needs are discussed in the end.
4.1. LPG Access
No significant association was found between LPG access and wellbeing, which contradicts some past literature. Phoumin and Kimura [111] used the lack of accessibility and affordability as energy poverty measures, very similar to this study’s use of LPG availability, LPG affordability, and LPG awareness. The recorded effects of energy poverty also have similar indicator variables of health, education, and earning opportunities [111]. Yet, Phoumin and Kimura [111] find significant associations between energy poverty, wellbeing, and household deprivation. For instance, energy-poor households have a higher probability of respiratory problems and therefore lower earning opportunities. It is possible that our results were insignificant due to a small number of data points (27 districts), which reduced statistical power [112]. The limitations of a district-level methodology are discussed further in Section 4.5.
The lack of a significant association between LPG access and wellbeing could exist because the used measure of energy poverty did not go beyond affordability, and consequently did not consider economic variables explicitly. Phoumin and Kimura [111] included energy expenditure into their energy poverty measure unlike this study. However, the use of energy expenditure as a measure of energy poverty has serious limitations [113,114] because vulnerable households will often limit their energy use when facing urgencies or disconnect themselves from electricity supply [115]. The insignificance of association found in this study suggests that economic methods could be used as a complementary approach to measuring energy poverty. Although energy expenditure is a controversial indicator, greater multidimensionality in the measurement of energy poverty could be achieved by combining consumption expenditure and LPG access into a singular index for statistical testing.
A change of indicator variables and questions asked in the surveys would likely be needed for there to be a significant association between LPG access and wellbeing. For example, the households were asked if they had ventilation in their cooking area and obtained a bad score if they did not have it. The premise of the variable is that energy-poor households had poor ventilation because they had no access to LPG. However, energy-poor households without LPG access could ensure that they have proper ventilation as they are reliant on dirtier fuels. In addition, households with LPG access would not be as concerned with air pollution. Health indicators could also be improved. Phoumin and Kimura [111] use health spending and respiratory disease as health indicators. They have tangible links to energy poverty and wellbeing, as energy-poor households have a higher probability for respiratory problems (physical health), higher health bills (economic health), and higher school drop-out rates (education) [116]. Short-term illness has a weaker link to respiratory illnesses and a variable linked to long-term health problems could be used instead. The further analysis found no significant association between the health indicator and LPG access and this was also the case for other wellbeing indicators. Either the choice of indicator variables and questions are not the best estimates of wellbeing affected by energy poverty, or there are issues with LPG access as a measure.
The non-significant association between access and wellbeing resonates with the argument in the literature that energy access should not be used as a stand-alone indicator for energy poverty [14,15,16]. This also seems true for access to modern cooking fuels [117]. However, the inclusion of the variables into composite indices is still accepted in the literature because strong correlations occur between access to modern cooking fuel and favourable socio-economic household characteristics [32]. So, the results do not question LPG access as a component of energy poverty measurement but highlight the need for greater multidimensionality in it.
The literature indicates that women are more likely to have serious health effects due to the lack of access to modern energy [65,70]. Yet, no significant association was found between LPG access and gender equality in Indian districts. This result could suggest that the link between measuring LPG access and gender equality is more complicated. For example, most energy poverty studies on gender equality use electricity access as the key measure. Nguyen et al. [65] use access to clean cooking fuel only as one out of seven proxies for energy poverty, the rest relating to electricity access, consumption, and transmission. The use of LPG access as a sole indicator might not readily associate with gender equality as strongly as seen with electricity indicators. Further research is needed to incorporate gendered energy poverty into the public measurement approaches as this would enable more informed policy around female empowerment.
4.2. Further Analysis with LPG Access
Despite LPG access and gender equality yielding a non-significant result, in the further analysis a significant association was found between LPG access and the education about health effects for women. This relationship is well documented, but we could establish that the relationship is specific to health effects and for India [118,119]. The results are useful for the design of future schemes for generating tangible gendered benefits in India. When LPG connections are created, women could be tutored on the health benefits of using LPG. This would not only improve women’s health but also reduce poor households’ use of biomass in their fuel mix after gaining LPG access [43]. However, the direction of the correlation should not be assumed: knowledge of adverse health effects of smoke may lead women to pursue LPG connections.
While a significant association between the education of health effects and LPG access is important, a critical lens is still required. Before the IHDS II and ACCESS data were gathered, policy in India focused on subsidising cooking fuels like LPG to improve access through greater affordability [120]. The National Programme on Improved Chulhas was also established to reduce health effects on women [121]. These programmes focused on poorer and less educated households [120]. Whilst the ability of the subsidies to increase LPG use is well documented, there are no quantified data on the education of women about using dirty and clean energy.
4.3. Consumption Expenditure
We found no significant association between consumption expenditure and wellbeing, echoing the results of Pachauri et al. [32] that there is no correlation between expenditure per capita and poverty in India. Other studies also suggest that energy expenditure alone is not an appropriate measure of energy poverty [114,122]. Therefore, the results highlight that governments should not rely on consumption expenditure alone to measure energy poverty. If developing country governments wish to pursue more progressive, multivariate energy poverty definitions, traditional economic approaches cannot support them and other measures and effects need to be explored. However, huge institutional barriers remain for the adoption of a new wellbeing index that would expose the hidden effects of energy poverty in India.
There are two issues around the results on consumption expenditure. Firstly, a Spearman’s rank correlation, a non-parametric test, was used. It is not uncommon to use non-parametric tests for statistical analysis. However, there was less statistical power in the Spearman’s rank correlation, so the tests were less likely to reject the null hypothesis [123]. Having a relatively small sample size of 27 districts (despite 4654 households within them) meant that the low statistical power was an even greater issue [124]. Consequently, a hidden significant correlation between consumption expenditure and both wellbeing and gender equality may exist.
The second issue is that economic energy poverty may not have been captured by the used variable. Damoh had a mean value of 0.113, which suggests that very few households live below the poverty line. However, government estimates of the below-poverty-line expenditure are 56.6% and 72.9% for rural and urban households in Damoh [125]. The same pertains to other districts. This could result from the use of different poverty lines. However, this research used a higher urban poverty line, which should have captured greater levels of poverty. It is difficult to conclude which expenditure assessment is correct as they come from different sources—ACCESS and the NSSO. The use of consumption expenditure may lead to high levels of variability in self-reporting, especially when compared to concepts like income.
A novel result is the non-significant negative relationship between consumption expenditure and gender equality. Expenditure may not be a useful indicator for gender equality. Many authors consider that a lack of energy access is important for the gendered impacts of energy poverty [66,67,126]. Only with access is a women’s situation improved by freeing their time and allowing them to pursue employment, increasing household income [127]. However, higher income and consumption expenditure may not be the causal factors of gender equality: it may instead be the result of better access, which leads to women’s empowerment. This finding has important implications for policy as it suggests that the subsidisation of LPG, or promotion of cash transfer programmes, does not correct the imbalance between men and women seen in energy-poor households.
4.4. Further Analysis with Consumption Expenditure
A key result of the further analysis was the significant relationship between consumption expenditure and female ownership of property. Poorer women owned their property more often than women above the poverty line. The result is counter-intuitive, as gender equality is often linked to higher labour market participation [128]. Female-led Indian households are poorer than male-led households due to low-wage occupation and childcare demands [129,130]. The association between lower consumption expenditure and higher female ownership may reflect the larger proportion of female-led households in poverty. Increasing consumption expenditure could in turn be due to a greater percentage of male-led households with higher income from salaried work [131]. Future testing of whether this confounding variable plays a significant role at the household level in the relationship between female ownership of property and consumption expenditure is essential.
The role of income in gender equality is also contested. Results from South Africa and Kenya suggest that men do not prioritise energy services like LPG for cooking no matter what their income level is [132,133]. The influence women have in the household measured by the proxy variable—ownership of property—is thus crucial to energy poverty alleviation but may have no relationship to economic poverty. The findings from Africa do not agree with our results. It is possible that this result tells of a highly contextual and geographically specific nature of the gender–energy expenditure nexus [134], calling for further research.
4.5. Limitations
The use of a district- instead of household-level analysis is a limitation of this analysis [135,136,137]. Ethical considerations were the reason for this choice. Participants gave personal information in IHDS II about family dynamics, such as the level of female decision-making, which is why it does not provide information below the district level. Because of limited granularity, the data could not be aggregated and disaggregated, e.g., to examine differences between rural and urban households. Focusing on 27 districts reduced the likelihood that insignificant results reflected a true effect, a type II error [138]. A household-level analysis could have avoided this but a district may be the more appropriate unit of analysis as social programmes are implemented at that level in India [139].
Only energy-poor states were included into this study because they require interventions the most. However, this could explain the non-significance of results: if areas of good access are not included, it is harder to observe a change from low to high access and the associated wellbeing and gender equality change. This is also true about consumption expenditure as the included states are low-income ones [140]. A significant association may thus exist between LPG access or consumption expenditure and wellbeing or gender equality.
Finally, the selection and weighting of variables and the construction of indices are subject to what is deemed most crucial in reducing energy poverty. Whilst the variables in wellbeing and gender equality indices have tangible links to energy poverty, their choice was not grounded on an empirical analysis. The decision not to use income level in the wellbeing index contradicts practice in HDI [141]. In addition, maternal deprivation has not been used earlier as an effect of energy poverty. Indices like the MEPI categorise indicators into sub-indices, giving different weights to variables related to different components of energy poverty [15]. However, whilst not all indicators of energy poverty are of the same importance, a theoretically sound framework for weighing is challenging to come by [142].
5. Conclusions
This research sought to determine whether LPG access and consumption expenditure can be used as measures of energy poverty in India, drawing from a district-level analysis of household survey data from six states in India. The contribution of this research arises from questioning the status quo of economic energy poverty measurement as it does not fully benefit the people it supposedly serves. It contributes to shifting energy poverty discussions to emerging concepts such as wellbeing and shining a light on the interplay between gender equality and energy. The results have implications for research and policy practice.
First, the LPG access and consumption expenditure were shown to be poor measures of energy poverty as they were not associated with wellbeing. This means that they should not be used alone as indicators of energy poverty. The results also highlight the need for a multidimensional energy poverty assessment, which extends to wellbeing and gender considerations. LPG access and energy expenditure may well be useful indicators as part of a much more multi-dimensional assessment.
Second, a strong association was found between the LPG access and the education of women about “chulha” smoke, but the direction of the relationship could not be established. If future research confirms that LPG access affects female health education, the grassroots education of women when LPG connections are implemented would generate significant health and wellbeing co-benefits.
Future research should deploy a similar approach to unaggregated household-level data, incorporating subjective experiences within wellbeing and gender equality. Combing both LPG access and consumption expenditure into a more multidimensional index holds promise to help unpack the complexities of the phenomenon.
Author Contributions
Conceptualization, D.T.S.B.; methodology, D.T.S.B.; investigation, D.T.S.B.; data curation, D.T.S.B.; writing—original draft preparation, D.T.S.B.; writing—review and editing, D.T.S.B. and J.P.; visualization, D.T.S.B.; supervision, J.P. All authors have read and agreed to the published version of the manuscript.
Funding
J.P. was supported by funding from the UK Economic and Social Research Council (ESRC) to the ESRC Centre for Climate Change Economics and Policy (CCCEP) (ESRC grant number ES/K006576/1, ES/R009708/1 and ES/Y008278/1).
Institutional Review Board Statement
Not applicable.
Informed Consent Statement
Not applicable.
Data Availability Statement
The India Human Development Survey 2 (IHDS II) data are publicly available at https://www.icpsr.umich.edu/web/DSDR/studies/36151 (accessed on 14 February 2024). The Access to Clean Cooking Energy and Electricity: Survey of States (ACCESS) survey data are available publicly at https://dataverse.harvard.edu/dataset.xhtml?persistentId=doi:10.7910/DVN/AHFINM (accessed on 14 February 2024).
Acknowledgments
D.T.S.B. wholeheartedly thanked his mother, Davender Bahi, and father, Gurdip Bahi, for their endless encouragement and support in his education. D.T.S.B. expressed owing a debt of gratitude to his grandparents, who sought a more prosperous life for his family and who selflessly laid the foundations for his accomplishments. J.P. expresses his gratitude for having had a chance to work with a brilliant and special student like D.T.S.B., and his immense sadness about his untimely passing away. The authors thank Julia Martin Ortega for comments on an earlier version and for the three referees for their comments on the penultimate version.
Conflicts of Interest
The authors declare no conflicts of interest.
Appendix A

Table A1.
District scores for LPG access, consumption expenditure, wellbeing, and gender equality.
| State | District | LPG Score | Consumption Expenditure Score | Wellbeing Score | Gender Equality Score |
|---|---|---|---|---|---|
| Madhya Pradesh | Katni | 0.833 | 0.125 | 0.255 | 0.263 |
| Hoshangabad | 0.589 | 0.018 | 0.372 | 0.424 | |
| Shajapur | 0.690 | 0.018 | 0.304 | 0.475 | |
| Satna | 0.798 | 0.095 | 0.441 | 0.374 | |
| Damoh | 0.875 | 0.113 | 0.481 | 0.337 | |
| Morena | 0.893 | 0.036 | 0.425 | 0.523 | |
| Odisha | Ganjam | 0.833 | 0.036 | 0.444 | 0.457 |
| Mayurbhanj | 0.929 | 0.042 | 0.392 | 0.652 | |
| Bargarh | 0.917 | 0.012 | 0.422 | 0.716 | |
| Jharkhand | Ranchi | 0.887 | 0.006 | 0.323 | 0.434 |
| Bokaro | 0.875 | 0.018 | 0.407 | 0.444 | |
| West Bengal | Nadia | 0.768 | 0.030 | 0.410 | 0.463 |
| Maldah | 0.800 | 0.000 | 0.453 | 0.499 | |
| Darjiling | 0.458 | 0.018 | 0.394 | 0.404 | |
| Bihar | Patna | 0.826 | 0.042 | 0.281 | 0.363 |
| Siwan | 0.726 | 0.024 | 0.481 | 0.521 | |
| Supaul | 0.946 | 0.006 | 0.557 | 0.504 | |
| Uttar Pradesh | Varanasi | 0.756 | 0.012 | 0.457 | 0.414 |
| Gorakhpur | 0.685 | 0.024 | 0.295 | 0.491 | |
| Sultanpur | 0.768 | 0.036 | 0.452 | 0.462 | |
| Banda | 0.875 | 0.048 | 0.453 | 0.634 | |
| Jhansi | 0.738 | 0.065 | 0.270 | 0.348 | |
| Kannauj | 0.768 | 0.030 | 0.472 | 0.507 | |
| Sitapur | 0.643 | 0.042 | 0.466 | 0.457 | |
| Bareilly | 0.625 | 0.036 | 0.316 | 0.474 | |
| Bijnor | 0.589 | 0.006 | 0.448 | 0.558 | |
| Muzaffarnagar | 0.429 | 0.024 | 0.482 | 0.378 |
References
- World Economic Forum Energy for Economic Growth—Energy Vision Update; World Economic Forum: Geneva, Switzerland, 2012.
- Sovacool, B.K.; Furszyfer Del Rio, D.; Griffiths, S. Contextualizing the COVID-19 Pandemic for a Carbon-Constrained World: Insights for Sustainability Transitions, Energy Justice, and Research Methodology. Energy Res. Soc. Sci. 2020, 68, 101701. [Google Scholar] [CrossRef] [PubMed]
- Carfora, A.; Scandurra, G.; Thomas, A. Forecasting the COVID-19 Effects on Energy Poverty across EU Member States. Energy Policy 2022, 161, 112597. [Google Scholar] [CrossRef] [PubMed]
- Mastropietro, P.; Rodilla, P.; Batlle, C. Emergency Measures to Protect Energy Consumers during the COVID-19 Pandemic: A Global Review and Critical Analysis. Energy Res. Soc. Sci. 2020, 68, 101678. [Google Scholar] [CrossRef] [PubMed]
- Maylan, A.; Chaturvedi, V. The Carbon Space Implications of Net Negative Targets. 2021. Available online: https://www.ceew.in/publications/implications-of-negative-carbon-emissions-on-global-carbon-budget-space (accessed on 14 February 2024).
- Patnaik, S.; Tripathi, S.; Jain, A. A Roadmap for Access to Clean Cooking Energy in India. Asian J. Public Aff. 2018, 11, e4. [Google Scholar] [CrossRef]
- Dabadge, A.; Sreenivas, A.; Josey, A. What has the pradhan mantri Ujjwala Yojana achieved so far? Econ. Political Wkly. 2018, 5, 69–75. [Google Scholar]
- Benti, N.E.; Gurmesa, G.S.; Argaw, T.; Aneseyee, A.B.; Gunta, S.; Kassahun, G.B.; Aga, G.S.; Asfaw, A.A. The Current Status, Challenges and Prospects of Using Biomass Energy in Ethiopia. Biotechnol. Biofuels 2021, 14, 209. [Google Scholar] [CrossRef] [PubMed]
- Baltruszewicz, M.; Steinberger, J.K.; Ivanova, D.; Brand-Correa, L.I.; Paavola, J.; Owen, A. Household Final Energy Footprints in Nepal, Vietnam and Zambia: Composition, Inequality and Links to Well-Being. Environ. Res. Lett. 2021, 16, 025011. [Google Scholar] [CrossRef]
- Stoyanova, S. An Expenditure-Based Approach to Poverty in the UK: Financial Year Ending 2017; Office of National Statistics: Newport, UK, 2018.
- Pachauri, S.; Spreng, D. Energy Use and Energy Access in Relation to Poverty. Econ. Political Wkly. 2004, 39, 271–278. [Google Scholar]
- Thomson, H.; Bouzarovski, S.; Snell, C. Rethinking the Measurement of Energy Poverty in Europe: A Critical Analysis of Indicators and Data. Indoor Built Environ. 2017, 26, 879–901. [Google Scholar] [CrossRef]
- Njiru, C.W.; Letema, S.C. Energy Poverty and Its Implication on Standard of Living in Kirinyaga, Kenya. J. Energy 2018, 2018, 3196567. [Google Scholar] [CrossRef]
- Kaygusuz, K. Energy for Sustainable Development: A Case of Developing Countries. Renew. Sustain. Energy Rev. 2012, 16, 1116–1126. [Google Scholar] [CrossRef]
- Nussbaumer, P.; Bazilian, M.; Modi, V. Measuring Energy Poverty: Focusing on What Matters. Renew. Sustain. Energy Rev. 2012, 16, 231–243. [Google Scholar] [CrossRef]
- Roy, J.; Dowd, A.-M.; Muller, A.; Pal, S.; Prata, N. Lifestyles, Well-Being and Energy. In Global Energy Assessment—Toward a Sustainable Future; Global Energy Assessment Writing Team, Ed.; Cambridge University Press and International Institute for Applied Systems Analysis: Cambridge, UK; Laxenburg; New York, NY, USA, 2012; pp. 1527–1548. [Google Scholar]
- World Health Organization. Global Health Risks: Mortality and Burden of Disease Attributable to Selected Major Risks; World Health Organization: Geneva, Switzerland, 2009. [Google Scholar]
- United Nations. Sustainable Development Group Leaving No One Behind; United Nations: San Francisco, CA, USA, 2019. [Google Scholar]
- Piachaud, D. Problems in the Definition and Measurement of Poverty. J. Soc. Policy 1987, 16, 147–164. [Google Scholar] [CrossRef]
- Bollino, C.A.; Botti, F. Energy Poverty in Europe: A Multidimensional Approach. PSL Q. Rev. 2017, 70, 473–507. [Google Scholar]
- Rademaekers, K.; Yearwood, J.; Ferreira, A.; Pye, S.; Hamilton, I.; Agnolucci, P.; Grover, D.; Karásek, J.; Anisimova, N. Selecting Indicators to Measure Energy Poverty; European Commission: Brussels, Belgium, 2016. [Google Scholar]
- Ackland, R.; Dowrick, S.; Freyens, B. Measuring Global Poverty: Why PPP Methods Matter. Rev. Econ. Stat. 2013, 95, 813–824. [Google Scholar] [CrossRef]
- Deeming, C.; Gubhaju, B. The Mis-Measurement of Extreme Global Poverty: A Case Study in the Pacific Islands. J. Sociol. 2014, 51, 689–706. [Google Scholar] [CrossRef] [PubMed]
- United Nations. Rethinking Poverty: Report on the World Social Situation 2010; United Nations: San Francisco, CA, USA, 2009. [Google Scholar]
- Kowsari, R.; Zerriffi, H. Three Dimensional Energy Profile: A Conceptual Framework for Assessing Household Energy Use. Energy Policy 2011, 39, 7505–7517. [Google Scholar] [CrossRef]
- Kroon, B.; Brouwer, R.; Beukering, P.J.H. The Energy Ladder: Theoretical Myth or Empiri-Cal Truth? Results from a Meta-Analysis. Renew. Sustain. Energy Rev. 2013, 20, 504–513. [Google Scholar] [CrossRef]
- Maslow, A.H. Motivation and Personality; Harper & Row: New York, NY, USA, 1954. [Google Scholar]
- Sen, A. Capability and Well-Being. In The Quality of Life; Oxford Academic: Oxford, UK, 1993; pp. 30–53. [Google Scholar]
- Stanton, E.A. The Human Development Index: A History; University of Massachusetts Amherst: Amherst, MA, USA, 2007. [Google Scholar]
- Boardman, B. Fuel Poverty Is Different. Policy Stud. 1991, 12, 30–41. [Google Scholar] [CrossRef]
- Buzar, S. Energy Poverty in Eastern Europe: Hidden Geographies of Deprivation; Ashgate: Burlington, MA, USA, 2007. [Google Scholar]
- Pachauri, S.; Mueller, A.; Kemmler, A.; Spreng, D. On Measuring Energy Poverty in Indian House-Holds. World Dev. 2004, 32, 2083–2104. [Google Scholar] [CrossRef]
- Khandker, S.R.; Barnes, D.F.; Samad, H.A. Are the Energy Poor Also Income Poor? Evidence from India. Energy Policy 2012, 47, 1–12. [Google Scholar] [CrossRef]
- Gordievska, O. The Multidimensional Energy Poverty Index (MEPI) and Nigeria. Master Thesis, University of Vienna, Vienna, Austria, 2015. [Google Scholar]
- Yaya, O.S.; Olalude, G.A.; Olayinka, H.A.; Jimoh, T.A.; Adebiyi, A.A. Household Expenditure in Africa: Evidence of Mean Reversion. Stat. Transit. New Ser. 2020, 24, 171–186. [Google Scholar]
- Goldemberg, J.; Johansson, T.B. Energy as an Instrument for Socio-Economic Development; UNDP: New York, NY, USA, 1995. [Google Scholar]
- Viswanathan, B.; Kavi Kumar, K.S. Cooking Fuel Use Patterns in India: 1983–2000. Energy Policy 2005, 33, 1021–1036. [Google Scholar] [CrossRef]
- Foster, V.; Tre, J.P.; Wodon, Q. Energy Prices, Energy Efficiency, and Fuel Poverty; World Bank: Washington, DC, USA, 2000. [Google Scholar]
- Sambodo, M.T.; Novandra, R. The State of Energy Poverty in Indonesia and Its Impact on Welfare. Energy Policy 2019, 132, 113–121. [Google Scholar] [CrossRef]
- International Energy Agency. Defining Energy Access: 2020 Methodology; International Energy Agency: Paris, France, 2020. [Google Scholar]
- Laldjebaev, M.; Sovacool, B.K. Energy Security, Poverty, and Sovereignty: Complex Interlinkages and Compelling Implications. In International Energy and Poverty; Routledge: Oxfordshire, UK, 2015; pp. 121–136. [Google Scholar]
- Nathan, H.S.K.; Hari, L. Towards a New Approach in Measuring Energy Poverty: Household Level Analysis of Urban India. Energy Policy 2020, 140, 111397. [Google Scholar] [CrossRef]
- Jain, A.; Tripathi, S.; Mani, S.; Patnaik, S.; Shahidi, T.; Ganesan, K. Access to Clean Cooking Energy and Electricity: Survey of States 2018; Council on Energy, Environment and Water: New Delhi, India, 2018. [Google Scholar]
- Pachauri, S. Energy Analysis of Household Consumption: Changing Patterns of Direct and Indirect Use in India; Springer: Berlin, Germany, 2014. [Google Scholar]
- Khandker, S.R.; Barnes, D.F.; Samad, H.A. Welfare Impacts of Rural Electrification: A Case Study from Bangladesh. In World Bank Policy Research Working Paper; World Bank Group: Washington, DC, USA, 2009. [Google Scholar]
- International Energy Agency. Energy Poverty: How to Make Modern Energy Access Universal? International Energy Agency: Paris, France, 2010. [Google Scholar]
- Healy, J.D. Housing, Fuel Poverty and Health: A Pan-European Analysis; Ashgate: Aldershot, UK, 2004. [Google Scholar]
- Thomson, H.; Snell, C. Quantifying the Prevalence of Fuel Poverty across the European Union. Energy Policy 2013, 52, 563–572. [Google Scholar] [CrossRef]
- Halkos, G.E.; Gkampoura, E.C. Coping with Energy Poverty: Measurements, Drivers, Impacts, and Solutions. Energies 2021, 14, 2807. [Google Scholar] [CrossRef]
- Boardman, B. Participant Benefits and Quality of Life: The Challenge of Hard to Measure Benefits. In Proceedings of the IEA Workshop on Evaluating the Co-Benefits of Low-Income Weatherisation Programmes, Dublin, Ireland, 27–28 January 2011. [Google Scholar]
- Siksnelyte-Butkiene, I. A Systematic Literature Review of Indices for Energy Poverty Assessment: A Household Perspective. Sustainability 2021, 13, 10900. [Google Scholar] [CrossRef]
- Ashagidigbi, W.M.; Babatunde, B.A.; Ogunniyi, A.I.; Olagunju, K.O.; Omotayo, A.O. Estimation and Determinants of Multidimensional Energy Poverty among Households in Nigeria. Sustainability 2020, 12, 7332. [Google Scholar] [CrossRef]
- Vigolo, V.; Sallaku, R.; Testa, F. Drivers and Barriers to Clean Cooking: A Systematic Literature Review from a Consumer Behavior Perspective. Sustainability 2018, 10, 4322. [Google Scholar] [CrossRef]
- International Energy Agency. World Energy Outlook; International Energy Agency: Paris, France, 2010. [Google Scholar]
- Culver, L.C. Energy Poverty: What You Measure Matters. In Proceedings of the Reducing Energy Poverty with Natural Gas: Changing Political, Business and Technology Paradigms Symposium, Stanford, CA, USA, 12 May 2017. [Google Scholar]
- Khatib, H. IEA World Energy Outlook 2010—A Comment. Energy Policy 2011, 39, 2507–2511. [Google Scholar] [CrossRef]
- Iddrisu, I.; Bhattacharyya, S.C. Sustainable Energy Development Index: A Multidimensional Indicator for Measuring Sustainable Energy Development. Renew. Sustain. Energy Rev. 2015, 50, 513–530. [Google Scholar] [CrossRef]
- Mirza, B.; Szirmai, A. Towards a New Measurement of Energy Poverty: A CrossCommunity Analysis of Rural Pakistan. 2010. Available online: https://www.researchgate.net/publication/46433662_Towards_a_new_measurement_of_energy_poverty_A_cross-community_analysis_of_rural_Pakistan (accessed on 14 February 2024).
- Day, R.; Walker, G.; Simcock, N. Conceptualising Energy Use and Energy Poverty Using a Capabilities Framework. Energy Policy 2016, 93, 255–264. [Google Scholar] [CrossRef]
- Rao, N.D.; Min, J.; Mastrucci, A. Energy Requirements for Decent Living in India, Brazil and South Africa. Nat. Energy 2019, 4, 1025–1032. [Google Scholar] [CrossRef]
- Okushima, S. Gauging Energy Poverty: A Multidimensional Approach. Energy 2017, 137, 1159–1166. [Google Scholar] [CrossRef]
- Sadath, A.C.; Acharya, R.H. Assessing the Extent and Intensity of Energy Poverty Using Multidimen-Sional Energy Poverty Index: Empirical Evidence from Households in India. Energy Policy 2017, 102, 540–550. [Google Scholar] [CrossRef]
- Santillán, O.S.; Cedano, K.G.; Martínez, M. Analysis of Energy Poverty in 7 Latin American Countries Using Multidimensional Energy Poverty Index. Energies 2020, 13, 1608. [Google Scholar] [CrossRef]
- Rehfuess, E. Fuel for Life: Household Energy and Health; WHO: Geneva, Switzerland, 2006. [Google Scholar]
- Nguyen, C.P.; Su, T.D.; Bui, T.D.; Dang, V.T.B.; Nguyen, B.Q. Financial Development and Energy Poverty: Global Evidence. Environ. Sci. Pollut. Res. 2021, 28, 35188–35225. [Google Scholar] [CrossRef] [PubMed]
- Kohlin, G.; Sills, E.O.; Pattanayak, S.K.; Wilfong, C. Energy, Gender and Development: What Are the Linkages? Where Is the Evidence? World Bank: Washington, DC, USA, 2011. [Google Scholar]
- World Bank. The Impact of Energy on Women’s Lives in Rural India; World Bank: Washington, DC, USA, 2004. [Google Scholar]
- Jensen, R.; Oster, E. The Power of TV: Cable Television and Women’s Status in India. Q. J. Econ. 2009, 124, 1057–1094. [Google Scholar] [CrossRef]
- Kugler, A.D.; Kumar, S. Preference for Boys, Family Size, and Educational Attainment in India. Demography 2017, 54, 835–859. [Google Scholar] [CrossRef]
- World Bank. Welfare Impacts of Rural Electrification. A Case Study from Bangladesh; World Bank: Washington, DC, USA, 2009. [Google Scholar]
- Moniruzzaman, M.; Day, R. Gendered Energy Poverty and Energy Justice in Rural Bangladesh. Energy Policy 2020, 144, 111554. [Google Scholar] [CrossRef]
- Vepa, S.S.; Viswanathan, B.; Parasar, R.; Bhavani, R.V. Child Underweight, Land Productivity and Public Services: A District-Level Analysis for India. 2016. Available online: https://www.semanticscholar.org/paper/Child-underweight%2C-land-productivity-and-public-a-Vepa-Viswanathan/76b0629b9a56b60165f3dd043d21c68cd6c9d93f (accessed on 14 February 2024).
- Saunders, M.; Lewis, P.; Thornhill, A. Research Methods for Business Students, 8th ed.; Pearson: London, UK, 2019. [Google Scholar]
- Portnov, B.A.; Dubnov, J.; Barchana, M. On Ecological Fallacy, Assessment Errors Stemming from Mis-Guided Variable Selection, and the Effect of Aggregation on the Outcome of Epidemiological Study. J. Expo. Sci. Environ. Epidemiol. 2006, 17, 106–121. [Google Scholar] [CrossRef] [PubMed]
- Allen, M. The SAGE Encyclopedia of Communication Research Methods; SAGE Publications: Los Angeles, CA, USA, 2017. [Google Scholar]
- Koivumaa-Honkanen, H.; Koskenvuo, M.; Honkanen, R.J.; Viinamaki, H.; Heikkilae, K.; Kaprio, J. Life Dissatisfaction and Subsequent Work Disability in an 11-Year Follow-Up. Psychol. Med. 2004, 34, 221–228. [Google Scholar] [CrossRef] [PubMed]
- Lyubomirsky, S.; King, L.; Diener, E. The Benefits of Frequent Positive Affect: Does Happiness Lead to Success? Psychol. Bull. 2005, 131, 803–855. [Google Scholar] [CrossRef] [PubMed]
- Verbrugge, L.M.; Reoma, J.M.; Gruber-Baldini, A.L. Short-Term Dynamics of Disability and Well-Being. J. Health Soc. Behav. 1994, 35, 97–117. [Google Scholar] [CrossRef] [PubMed]
- Sehgal, M.; Rizwan, S.A.; Krishnan, A. Disease Burden Due to Biomass Cookingfuel-Related Household Air Pollution among Women in India. Glob. Health Action 2014, 7, 25326. [Google Scholar] [CrossRef] [PubMed]
- Alam, K.; Halder, U.K. Human Rights and Right to Education in India. Int. J. Res. Anal. Rev. 2018, 5, 2183–2186. [Google Scholar]
- Land, K.C.; Leach, G. Child and Youth Well-Being Index (CWI). Energy Policy 2010, 20, 116–123. [Google Scholar]
- Boreham, P.; Povey, J.; Tomaszewski, W. An Alternative Measure of Social Wellbeing: Ana-Lysing the Key Conceptual and Statistical Components of Quality of Life. Aust. J. Soc.-Sues 2013, 48, 151–172. [Google Scholar] [CrossRef]
- Sampson, R.J. The Neighborhood Context of Well-Being. Perspect. Biol. Med. 2003, 46, 53–64. [Google Scholar] [CrossRef]
- Cummins, R.A.; Eckersley, R.; Pallant, J.; Vugt, J.; Misajon, R. Developing a National Index of Sub-Jective Wellbeing: The Australian Unity Wellbeing Index. Soc. Indic. Res. 2003, 64, 159–190. [Google Scholar] [CrossRef]
- Menon, S. The Effect of Marital Endowments on Domestic Violence in India. J. Dev. Econ. 2020, 143, 102389. [Google Scholar] [CrossRef]
- Asoka, A.; Gleeson, T.; Wada, Y.; Mishra, V. Relative Contribution of Monsoon Precipitation and Pumping to Changes in Groundwater Storage in India. Nat. Geosci. 2017, 10, 109–117. [Google Scholar] [CrossRef]
- Rodell, M.; Velicogna, I.; Famiglietti, J.S. Satellite-Based Estimates of Groundwater Depletion in India. Nature 2009, 460, 999–1002. [Google Scholar] [CrossRef] [PubMed]
- Kankaria, A.; Nongkynrih, B.; Gupta, S.K. Indoor Air Pollution in India: Implications on Health and Its Control. Indian J. Community Med. 2014, 39, 203–207. [Google Scholar] [PubMed]
- Choudhuri, P.; Desai, S. Gender Inequalities and Household Fuel Choice in India. J. Clean. Prod. 2020, 265, 121487. [Google Scholar] [CrossRef] [PubMed]
- King, E.M.; Mason, A.D. Engineering Development—Through Gender Equality in Rights, Resources, and Voice; The Word Bank: Washington, DC, USA, 2001. [Google Scholar]
- Malhotra, A.; Schuler, S.R.; Boender, C. Measuring Women’s Empowerment as a Variable in International Development. In Background Paper Prepared for the World Bank Workshop on Poverty and Gender: New Perspectives; World Bank: Washington, DC, USA, 2002. [Google Scholar]
- Grabe, S. Promoting Gender Equality: The Role of Ideology, Power, and Control in the Link Between Land Ownership and Violence in Nicaragua. Anal. Soc. Issues Public Policy 2010, 10, 146–170. [Google Scholar] [CrossRef]
- Brahmapurkar, K.P. Gender Equality in India Hit by Illiteracy, Child Marriages and Violence: A Hurdle for Sustainable Development. Pan Afr. Med. J. 2017, 28. [Google Scholar] [CrossRef]
- Austin, K.F.; Mejia, M.T. Household Air Pollution as a Silent Killer: Women’s Status and Solid Fuel Use in Developing Nations. Popul. Environ. 2017, 39, 1–25. [Google Scholar] [CrossRef]
- Saxena, V.; Bhattacharya, P. Inequalities in LPG and Electricity Consumption in India: The Role of Caste, Tribe, and Religion. Energy Sustain. Dev. 2018, 42, 44–53. [Google Scholar] [CrossRef]
- Planning Commission. Report of the Expert Group to Review the Methodology for Measurement of Poverty; Planning Commission: New Delhi, India, 2014. [Google Scholar]
- Desai, S.; Vanneman, R. India Human Development Survey-II (IHDS-II). 2018. Available online: https://www.icpsr.umich.edu/web/DSDR/studies/36151 (accessed on 14 February 2024).
- Aklin, M.; Cheng, C.; Ganesan, K.; Jain, A.; Urpelainen, J. Access to Clean Cooking Energy and Electricity: Survey of States in India (ACCESS). In Harvard. Dataverse; Harvard University: Boston, MA, USA, 2016. [Google Scholar]
- Chandramouli, C. Provisional Population Totals; Office of the Registrar General and Census Comissioner: New Delhi, India, 2011.
- Bhattacharyya, S.C. Energy Access Problem of the Poor in India: Is Rural Electrification a Remedy? Energy Policy 2006, 34, 3387–3397. [Google Scholar] [CrossRef]
- Ravindra, K.; Kaur-Sidhu, M.; Mor, S.; John, S. Trend in Household Energy Consumption Pattern in India: A Case Study on the Influence of Socio-Cultural Factors for the Choice of Clean Fuel Use. J. Clean. Prod. 2019, 213, 1024–1034. [Google Scholar] [CrossRef]
- Himanshu. India’s Economic Data: Reliable Statistics or Curated Artifacts. Mint Online 2019. Available online: https://www.livemint.com/opinion/columns/india-s-economic-data-reliable-statistics-or-curated-artefacts-1560444690637.html (accessed on 14 February 2024).
- Waghmare, A.; Mukherjee, S. The Crisis of Data Credibility in India and the Resulting Policy Challenge. Bus. Stand. Online. 2020. Available online: https://www.business-standard.com/article/economy-policy/the-crisis-of-data-credibility-in-india-and-the-resulting-policy-challenge-120022600723_1.html (accessed on 14 February 2024).
- Development Initiatives. Key Facts on Household Surveys; Development Initiatives: Bristol, UK, 2017. [Google Scholar]
- Wolff, E. Wealth Distribution. In International Encyclopedia of the Social & Behavioral Sciences; Elsevier: Amsterdam, The Netherlands, 2015; pp. 450–455. [Google Scholar]
- Arnhab, R. Survey Sampling Theory and Applications; Elsevier: Amsterdam, The Netherlands, 2017. [Google Scholar]
- Brownlee, J. A Gentle Introduction to Statistical Power and Power Analysis in Python. 2020. Available online: https://machinelearningmastery.com/statistical-power-and-power-analysis-in-python/ (accessed on 14 February 2024).
- Osborne, J.W.; Overbay, A. The Power of Outliers (and Why Researchers Should Always Check for Them. Pract. Assess. Res. Eval. 2004, 9, 6. [Google Scholar]
- Nanda, P.; Gautam, A.; Verma, R.; Khanna, A.; Khan, N.; Brahme, D.; Boyle, S.; Kumar, S. Masculinity, Intimate Partner Violence and Son Preference in India—Findings from Odisha; ICRW: Washington, DC, USA, 2014. [Google Scholar]
- Camilli, G.; Hopkins, K.D. Applicability of Chi-Square to 2x2 Contingency Tables with Small Expected Cell Frequencies. Psychol. Bull. 1978, 85, 163–167. [Google Scholar] [CrossRef]
- Phoumin, H.; Kimura, F. Cambodia’s Energy Poverty and Its Effects on Social Wellbeing: Empirical Evidence and Policy Implications. Energy Policy 2019, 132, 283–289. [Google Scholar] [CrossRef]
- Button, K.S.; Ioannidis, J.P.A.; Mokrysz, C.; Nosek, B.A.; Flint, J.; Robinson, E.S.J.; Munafò, M.R. Power Failure: Why Small Sample Size Undermines the Reliability of Neuroscience. Nat. Rev. Neurosci. 2013, 14, 365–376. [Google Scholar] [CrossRef]
- Castro-Sitiriche, M.J.; Ndoye, M. On the Links between Sustainable Wellbeing and Electric Energy Consumption. Afr. J. Sci. Technol. Innov. Dev. 2013, 5, 327–335. [Google Scholar] [CrossRef]
- Moore, R. Definitions of Fuel Poverty: Implications for Policy. Energy Policy 2012, 49, 19–26. [Google Scholar] [CrossRef]
- Herrero, S.T. Energy Poverty Indicators: A Critical Review of Methods. Indoor Built Environ. 2017, 26, 1018–1031. [Google Scholar] [CrossRef]
- Oliveras, L.; Artazcoz, L.; Borrell, C.; Palència, L.; López, M.J.; Gotsens, M.; Peralta, A.; Marí-Dell’Olmo, M. The Association of Energy Poverty with Health, Health Care Utilisation and Medication Use in Southern Europe. SSM—Popul. Health 2020, 12, 100665. [Google Scholar] [CrossRef] [PubMed]
- Irwin, B.R.; Hoxha, K.; Grépin, K.A. Conceptualising the Effect of Access to Electricity on Health in Low- and Middle-Income Countries: A Systematic Review. Glob. Public Health 2019, 15, 452–473. [Google Scholar] [CrossRef] [PubMed]
- Longe, O.M. An Assessment of the Energy Poverty and Gender Nexus towards Clean Energy Adoption in Rural South Africa. Energies 2021, 14, 3708. [Google Scholar] [CrossRef]
- Rahman, M.M.; Alam, K. The Role of Access to Electricity, Female Education, and Public Health Expenditure on Female Health Outcomes: Evidence from SAARC-ASEAN Countries. BMC Women’s Health 2021, 21, 383. [Google Scholar] [CrossRef] [PubMed]
- Balachandra, P. Dynamics of Rural Energy Access in India: An Assessment. Energy 2011, 36, 5556–5567. [Google Scholar] [CrossRef]
- Greenglass, N.; Smith, K.R. Current Improved Cookstove (ICS) Activities in South Asia: A Web-Based Survey. 2006. Available online: http://www.bioenergylists.org/files/South%20Asian%20ICS%20V1.1%2009-26-06.pdf (accessed on 14 February 2024).
- Liddell, C.; Morris, C.; McKenzie, S.J.P.; Rae, G. Measuring and Monitoring Fuel Poverty in the UK: National and Regional Perspectives. Energy Policy 2012, 49, 27–32. [Google Scholar] [CrossRef]
- Siegel, S.; Castellan, N.J. Non-Parametric Statistics for the Behavioural Sciences, 2nd ed.; McGraw-Hill: New York, NY, USA, 1988. [Google Scholar]
- Whitley, E.; Ball, J. Statistics Review 6: Nonparametric Methods. Crit. Care 2002, 6, 509–513. [Google Scholar] [CrossRef] [PubMed]
- Batra, S.P.T.; Tyagi, C.; Tyagi, M. District Wise Poverty Estimates for Madhya Pradesh No Date. Doctoral Dissertation, Goa University, Goa, India, 2008. [Google Scholar]
- Oparaocha, S.; Dutta, S. Gender and Energy for Sustainable Development. Curr. Opin. Environ. Sustain. 2011, 3, 265–271. [Google Scholar] [CrossRef]
- Cecelski, E.; Dutta, S. Mainstreaming Gender in Energy Projects—A Practical Handbook; The World Bank: Washington, DC, USA, 2011. [Google Scholar]
- Morais Maceira, H. Economic Benefits of Gender Equality in the EU. Intereconomics 2017, 52, 178–183. [Google Scholar] [CrossRef]
- Connell, J.; Brazier, J.; O’Cathain, A.; Lloyd-Jones, M.; Paisley, S. Quality of Life of People with Mental Health Problems: A Synthesis of Qualitative Research. Health Qual. Life Outcomes 2012, 10, 138. [Google Scholar] [CrossRef]
- Gangopadhyay, S.; Wadhwa, W. Are Indian Female-Headed Households More Vulnerable to Poverty? India Development Foundation: Gurgaon, India, 2004. [Google Scholar]
- Reddy, A.A.; Mittal, S.; Singha Roy, N.; Kanjilal-Bhaduri, S. Time Allocation between Paid and Un-Paid Work among Men and Women: An Empirical Study of Indian Villages. Sustainability 2021, 13, 2671. [Google Scholar] [CrossRef]
- Fingleton-Smith, E. The Lights Are on but No (Men) Are Home. The Effect of Traditional Gender Roles on Perceptions of Energy in Kenya. Energy Res. Soc. Sci. 2018, 40, 211–219. [Google Scholar] [CrossRef]
- Makan, A. Power for Women and Men: Towards a Gendered Approach to Domestic Energy Policy and Planning in South Africa. Third World Plan. Rev. 1995, 17, 183–189. [Google Scholar] [CrossRef]
- Pachauri, S.; Rao, N.D. Gender Impacts and Determinants of Energy Poverty: Are We Asking the Right Questions? Curr. Opin. Environ. Sustain. 2013, 5, 205–215. [Google Scholar] [CrossRef]
- Ahmad, S.; Baiocchi, G.; Creutzig, F. CO2 Emissions from Direct Energy Use of Urban Households in India. Environ. Sci. Technol. 2015, 49, 11312–11320. [Google Scholar] [CrossRef]
- Lee, J.; Taherzadeh, O.; Kanemoto, K. The Scale and Drivers of Carbon Footprints in Households, Cities and Regions across India. Glob. Environ. Chang. 2021, 66, 102205. [Google Scholar] [CrossRef]
- Rao, M.N.; Reddy, B.S. Variations in Energy Use by Indian Households: An Analysis of Micro Level Data. Energy 2007, 32, 143–153. [Google Scholar]
- Banerjee, A.; Chitnis, U.; Jadhav, S.; Bhawalkar, J.; Chaudhury, S. Hypothesis Testing, Type I and Type II Errors. Ind. Psychiatry J. 2009, 18, 127–131. [Google Scholar] [CrossRef]
- Mondal, S.; Bhojani, U.; Lobbo, S.; Law, S.; Maioni, A.; Belle, S. Using Social Network Analysis to Understand Multisectoral Governance in District-Level Tobacco Control Programme Implementation in India. BMJ Glob. Health 2022, 7, e006471. [Google Scholar] [CrossRef]
- Anant, T.C.A. All India Report of Sixth Economic Census; Government of India, Ministry of Statistics and Programme Implementation: New Delhi, India, 2016.
- United Nations. Development Programme New Threats to Human Security in the Anthropocene—Demanding Greater Solidarity; United Nations: San Francisco, CA, USA, 2022. [Google Scholar]
- Freudenberg, M. Composite Indicators of Country Performance: A Critical Assessment. 2003. Available online: https://www.researchgate.net/publication/273697960_Composite_Indicators_of_Country_Performance_A_Critical_Assessment (accessed on 14 February 2024).
Figure 1.
A map of India, with sections in red indicating the chosen states for this research.

Figure 2.
A normal Q–Q scatter plot of LPG access for all districts using dots to show the observed score relative to the data quantile, with a black line showing normal distribution.
Figure 2.
A normal Q–Q scatter plot of LPG access for all districts using dots to show the observed score relative to the data quantile, with a black line showing normal distribution.

Figure 3.
The distribution of consumption expenditure scores for all districts.

Figure 4.
Wellbeing scores for the Indian states, with circles representing the mean score.

Figure 5.
Gender equality scores for all districts, with three outliers represented by the circles.

Figure 6.
A scatter plot of the relationship between wellbeing and LPG access.

Figure 7.
A scatter plot of the relationship between gender equality and LPG access.

Figure 8.
A scatter plot of the relationship of wellbeing and consumption expenditure.

Figure 9.
A scatter plot of the relationship between gender equality and consumption expenditure.

Table 1.
The indicator variables for each of the four indices and number of cases available.
| Index | Variable | Valid Cases |
|---|---|---|
| Wellbeing | Short-term Illness | 2832 |
| Education Completion | 2832 | |
| Social Inclusion | 245 | |
| Safety | 245 | |
| Water Availability | 245 | |
| Air Pollution | 175 | |
| Toilet Access | 246 | |
| Gender Equality | Ownership of Property | 2734 |
| Maternal Health | 1136 | |
| Education of Health Effects | 2830 | |
| Work | 2193 | |
| Consumption Expenditure | Economic Activity | 4532 |
| LPG Access | LPG Availability | 4532 |
| LPG Affordability | ||
| LPG Awareness |
Table 2.
The variables chosen for the study, alongside the questions asked in the household surveys that give the study’s initial quantitative data. The initial coding of the data is also shown, followed by the new coding, and reasoning for this alteration.
Table 2.
The variables chosen for the study, alongside the questions asked in the household surveys that give the study’s initial quantitative data. The initial coding of the data is also shown, followed by the new coding, and reasoning for this alteration.
| Variable | Question Asked | Initial Coding | Recoding | Reasoning for Recoding |
|---|---|---|---|---|
| Short-term Illness | How long was [NAME] unable to do usual activities (incl. work, school, domestic work) in the last 30 days? | 0–30 | 0 days = 0 1–30 days = 1 | Assumption that any number of days of illness leads to reduced wellbeing [76,77]) |
| Education Completion | How many standard years has [NAME] completed? | <1, 1, 2, 3, 4, 5, 6, 7, 8, 9, 10, 11, 12, 1st year post-secondary, 2nd year post-secondary, Bachelors, over Bachelors | Compulsory education completed—7 years or more = 0 Insufficient education—under 7 years = 1 | Seven years stand as the requirement for compulsory education in India and is a human right ([80]). Insufficient education would therefore be below this criterion. |
| Social inclusion | In some villages or neighbourhoods, when there is a community problem such as water supply problem, people bond together to solve the problem. In other communities, people take care of their own families individually. What is your community like? | Bond together or Individual family | Bond together = 0 Individual family = 1 | |
| Safety | During the last twelve months, was anything stolen that belonged to you or to somebody in your household? | Yes or No | No = 0 Yes = 1 | |
| Water Availability | Is the availability of drinking water adequate in summer? | Yes or No | Yes = 0 No = 1 | |
| Air Pollution | Is there a window or vent in the cooking area? | Yes, No or Outdoors | Yes or outdoors = 0 No = 1 | Outdoor cooking gives ventilation from pollution, so was grouped with “Yes” |
| Toilet Access | Does the household have a toilet of its own? | No facility (or open fields), Traditional pit latrine, Semi-flush latrine, or Flush latrine | Pit latrine, Semi-flush latrine, or Flush latrine = 0 No facility (or open fields) = 1 | Different types of toilets were grouped together as they are all relatively sanitary and reduce chance of disease. No facility or open fields mean no household toilet available. |
| Ownership of Property | Is your name on the ownership or rental papers for your home? | Yes, No or No papers | Yes = 0 No = 1 | “No papers” data were excluded as they give no indication of gender equality. |
| Maternal Health | When you were pregnant with [NAME] did you have an antenatal check-up? | Yes or No | Yes = 0 No = 1 | |
| Education of Health Effects | Is smoke from a wood/dung burning traditional chulha good for health, harmful for health, or do you think it doesn’t really matter? | Harmful, No effect, or Does not matter | Harmful = 0 No effect or Does not matter = 1 | Responses of “no effect” or “does not matter” both indicate a lack of education of health effects, so were grouped together. |
| Work | Who has the most say in decisions about your work? | Self, Husband, Senior male, Senior female, or Other | Self = 0 Husband, Senior male, Senior female or Other = 1 | If female respondent does not have the most say in work decisions, then it indicates poor female empowerment, regardless of the person in charge of the decisions. |
| Economic Activity | How much is your expenditure on household needs in a typical month (rupees)? | Any number | Above urban poverty line (1407 rupees and above) = 0 Below urban poverty line (<1407 rupees) = 1 | Required recoding of above or below the poverty line. Urban poverty line was used despite all the states being rural as a precautionary device as some districts may have urban characteristics. |
| LPG Availability | [A] Do you use domestic gas (LPG) for cooking? | Yes or No | For Question [A] Yes = 0 No = 1 | This variable needed multiple coding |
| LPG Affordability LPG Awareness | [B] If no, why don’t you have LPG: Is it not available or too far from your village? Is it too expensive to have an LPG connection? Is the monthly cost of LPG too high? Don’t know how to get or whom to ask? Other? | For Q. [B] No = 0 Yes = 1 Values were totalled: Values of 0–1 (respondent either uses LPG or does not, but not because of access) = 0 Values of 2 and above (respondent does not use LPG and has an access issue) = 1 | Access or lack thereof. If LPG was not used but it was not stated that the reasoning was because of access issue, it is not relevant to this variable (e.g., cooking preference) | LPG Affordability LPG Awareness |
Table 3.
Secondary analysis of IHDS II and ACCESS datasets.
| IHDS II | ACCESS | |
|---|---|---|
| Purpose of data | The research program set out to document the conditions and changes to Indian households through a breadth of development indicators. | To evaluate the condition of energy access in India’s most energy-poor states through the multidimensionality of the issue. |
| Methods used | Face-to-face interviews. Stratified random sampling for rural households. Stratified sampling using probability proportional to the population for urban households. | Face-to-face interviews. A random sampling of one district from each administrative division. Sampling was stratified using probability proportional to population. |
| Population studied | A total of 42,152 households from 33 states and union territories. | A total of 9000 households in Bihar, Jharkhand, Madhya Pradesh, Odisha, Uttar Pradesh, and West Bengal. |
| Credibility of creator | Conducted by researchers from the University of Maryland and the National Council of Applied Economic Research. Funded by the U.S. National Institutes of Health and the Ford Foundation. | Conducted by Council on Energy, Environment and Water (CEEW) with support from Columbia University and Shakti Sustainable Energy Foundation. |
| Limits of the data | Large amounts of non-response problems, where respondents have not provided requested data. Information of households beyond the district level, such as the respective village, is unavailable. | Many of the questions ask respondents for rough estimates across long timescales to quantify their energy consumption, likely leading to inaccurate data. |
Table 4.
The number of cases for each state with a percentage amount per state and totals.
| State | Cases Value | Percentage |
|---|---|---|
| Uttar Pradesh | 1680 | 36.1% |
| Bihar | 503 | 10.8% |
| West Bengal | 596 | 12.8% |
| Jharkhand | 363 | 7.8% |
| Odisha | 504 | 10.8% |
| Madhya Pradesh | 1008 | 21.7% |
| Total | 4654 | 100% |
Table 5.
Mean scores for all districts in the state of Madhya Pradesh for each respective index.
| District | Wellbeing Score | Gender Equality Score | Consumption Expenditure Score | LPG Access Score |
|---|---|---|---|---|
| Katni | 0.255 | 0.263 | 0.125 | 0.833 |
| Hoshangabad | 0.372 | 0.424 | 0.018 | 0.589 |
| Shajapur | 0.304 | 0.475 | 0.018 | 0.690 |
| Satna | 0.441 | 0.374 | 0.095 | 0.798 |
| Damoh | 0.481 | 0.337 | 0.113 | 0.875 |
| Morena | 0.425 | 0.523 | 0.036 | 0.893 |
Table 6.
Female education about indoor air pollution and LPG access.
| Accessibility of LPG | Female Education on Indoor Air Pollution | Total | |
|---|---|---|---|
| Knowledge of Risks | No Knowledge of Risks | ||
| LPG Access | 589 (92%) | 51 (8%) | 640 (100%) |
| No LPG Access | 1786 (86.4%) | 282 (13.6%) | 2068 (100%) |
| Total | 2375 (87.7%) | 333 (12.3%) | 2708 (100%) |
| Chi-Squared = 14.04 | p < 0.001 | ||
Table 7.
Reported female ownership of property and consumption expenditure.
| Consumption Expenditure | Female Ownership of Property | Total | |
|---|---|---|---|
| Name on Home/Rental Papers | No Name on Home/Rental Papers | ||
| Above Poverty Line | 287 (11.3%) | 2242 (88.7%) | 2529 (100%) |
| Below Poverty Line | 22 (25.6%) | 64 (74.4%) | 86 (100%) |
| Total | 309 (11.8%) | 2306 (88.2%) | 2615 (100%) |
| Chi-Squared = 14.83 | p < 0.001 | ||
Disclaimer/Publisher’s Note: The statements, opinions and data contained in all publications are solely those of the individual author(s) and contributor(s) and not of MDPI and/or the editor(s). MDPI and/or the editor(s) disclaim responsibility for any injury to people or property resulting from any ideas, methods, instructions or products referred to in the content. |
© 2024 by the authors. Licensee MDPI, Basel, Switzerland. This article is an open access article distributed under the terms and conditions of the Creative Commons Attribution (CC BY) license (https://creativecommons.org/licenses/by/4.0/).
Share and Cite
MDPI and ACS Style
Singh Bahi, D.T.; Paavola, J. Liquefied Petroleum Gas Access and Consumption Expenditure: Measuring Energy Poverty through Wellbeing and Gender Equality in India. Sustainability 2024, 16, 3413. https://doi.org/10.3390/su16083413
AMA Style
Singh Bahi DT, Paavola J. Liquefied Petroleum Gas Access and Consumption Expenditure: Measuring Energy Poverty through Wellbeing and Gender Equality in India. Sustainability. 2024; 16(8):3413. https://doi.org/10.3390/su16083413
Chicago/Turabian StyleSingh Bahi, Dhilanveer Teja, and Jouni Paavola. 2024. "Liquefied Petroleum Gas Access and Consumption Expenditure: Measuring Energy Poverty through Wellbeing and Gender Equality in India" Sustainability 16, no. 8: 3413. https://doi.org/10.3390/su16083413
Note that from the first issue of 2016, this journal uses article numbers instead of page numbers. See further details here.