Article

The Catalytic Effect of Pt on Lignin Pyrolysis: A Reactive Molecular Dynamics Study

1
School of Metallurgical and Ecological Engineering, University of Science and Technology Beijing, Beijing 100083, China
2
School of Materials Science and Engineering, The University of New South Wales, Sydney, NSW 2052, Australia
3
Department of Functional Nanosystems and High-Temperature Materials, National University of Science and Technology “MISIS”, 119049 Moscow, Russia
4
School of Chemical Engineering, The University of Queensland, St. Lucia, QLD 4072, Australia
*
Author to whom correspondence should be addressed.
Retired.
Sustainability 2024, 16(8), 3419; https://doi.org/10.3390/su16083419
Submission received: 28 February 2024 / Revised: 15 April 2024 / Accepted: 16 April 2024 / Published: 19 April 2024

Abstract

:
Lignin is the second-largest renewable resource in nature, second only to cellulose. Lignin is one of the most significant components of biomass, and it determines the behaviour of biomass in many thermochemical processes. However, limited studies have focused on the influence of metal catalysts on lignin pyrolysis. This study aims to develop a sustainable lignin catalytic pyrolysis technology to improve biomass energy-conversion efficiency, reduce dependence on fossil fuels, and promote the development of clean energy. In this study, the impact of Pt catalyst on the pyrolysis process of hardwood lignin was simulated by using reactive force field (ReaxFF) molecular dynamics. Through the comparison of the system without catalysts, the catalyst exhibited evident attraction to lignin macromolecules, prompting their decomposition at lower temperatures. Additionally, the catalyst has the strongest adsorption capacity for H radical. The activation energy of the reaction was calculated by kinetic analysis. It was found that the addition of catalysts significantly reduced the activation energy of the reaction. By revealing the effect of Pt catalyst on the lignin pyrolysis process, it provides a theoretical basis for biomass pyrolysis and the utilization of metal catalysts in industry.

1. Introduction

Traditional fossil energy sources, including coal, oil, and natural gas, continue to dominate global energy use, but these three energy sources are non-renewable energy. Therefore, more and more attention has been paid to environmentally friendly renewable resources [1,2,3]. Biomass, as a renewable resource, is of great significance for sustainable development. The sustainable development significance of biomass research lies in its ability to promote energy transformation, protect the environment, promote sustainable development of agriculture and forestry, and promote technological innovation and industrial development. By continuously deepening biomass research, we can achieve a sustainable energy supply and promote sustainable economic and social development. The sources of biomass are very extensive [4,5,6], such as straw, wood, animal excrement, and so on. Biomass can be decomposed to produce high-value-added chemicals and fuels [7,8,9,10]. Pyrolysis, gasification, combustion, and liquefaction are the primary thermochemical processes of biomass transformation [11,12,13]. The pyrolysis method has been widely used at present, which can convert biomass into biochar, bio-oil, biogas, or other high-quality products. Biomass is mostly made up of lignin, cellulose, and hemicellulose, while lignin is one of the most significant components of biomass, second only to cellulose [14,15], accounting for 24–33% of the whole mass of softwood and 19–35% of hardwood [16].
The quality of bio-oil obtained by the direct pyrolysis of biomass is not high, and its composition is relatively complex, with high water content, high viscosity, and low energy density. Therefore, research on quality improvement is imperative. Catalytic pyrolysis is one of the most promising methods for the efficient utilization of biomass. Catalytic pyrolysis refers to the addition of catalysts in the process of pyrolysis to promote the decarbonylation, hydroxyl, carboxyl, and other reactions of volatile compounds so that more oxygen elements in bio-oil can be removed in the form of CO, CO2, and H2O, or more target products can be obtained through the directional transformation of bio-oil molecules. Uncovering the internal relationship between biomass raw materials, catalyst types, reaction conditions, and target products has important practical significance and guiding value for improving the selectivity and yield of target products, realizing the high-value utilization of biological oil, and improving the economy of the catalytic pyrolysis process of biomass.
The most important thing in the process of catalytic pyrolysis is the catalyst, which has been widely used at present [17]. Alkaline metal oxide catalysts have been studied for the catalytic pyrolysis of waste polymers [18], and Ni-based catalysts are especially used to increase the amounts of gaseous products. Wang et al. [19] reported that Ni-based catalyst has an excellent effect on generating H2-rich gas from biomass pyrolysis. However, few studies have considered the effect of Pt catalyst on the lignin pyrolysis process alone. Pt as a catalyst has the advantages of high catalytic activity, strong selectivity, convenient catalyst production, and low usage. At the same time, it has a wide range of applications and can be repeatedly regenerated and activated for use. Pt has good catalytic properties and is able to promote lignin pyrolysis at lower temperatures, which means that higher reaction efficiencies and product selectivity can be obtained under milder conditions. At the same time, the Pt catalyst helps to regulate the product distribution of lignin pyrolysis and reduce unwanted by-products. Although Pt is a bit expensive, it has high chemical stability and is able to maintain its catalytic activity at high temperatures, extending the catalyst’s service life. This is particularly important for industrial applications, as it reduces the frequency of catalyst replacement and lowers production costs.
Capturing all the intricacies of the reaction and precisely articulating the pyrolysis mechanism, however, remains a great issue due to the complexity of biomass pyrolysis and the fact that degrading reactions often take place in a relatively short amount of time. Computer simulation has developed into an effective tool for studying biomass pyrolysis processes. The high spatiotemporal resolution of the molecular dynamics (MD)-employing reaction force fields (ReaxFF) introduced by van Duin et al. [20] gives it a significant edge over other numerical techniques and allows researchers to understand complicated processes at the atomic and molecular level. ReaxFF MD can simulate complicated chemical processes without pre-defining reaction routes in macromolecular systems, in contrast to quantum mechanics (QM) approaches and conventional MD methods. ReaxFF MD has so far been used effectively for a number of intricate systems [21,22,23]. At present, the ReaxFF method [24] has been widely used in the simulation of biomass, among which the gasification process of cellulose has been studied a lot. But, the research about lignin is few in number, and many areas are still unclear. Li et al. [25] simulated the supercritical water gasification process of lignin by ReaxFF MD, and the main conclusion was that the proportion of H2 in the product increased with the increase in temperature. Han et al. [26] simulated the size effect of Ni nanocatalysts in the supercritical water gasification (SCWG) process of lignin by using ReaxFF MD.
In this paper, ReaxFF molecular dynamics simulations were used to investigate the effect of Pt catalysts on the molecular pyrolysis process of hardwood lignin on a molecular scale. The catalytic mechanism of Pt, the ratio of products, the structural evolution of lignin molecules, and the magnitude of activation energy are evaluated mainly by the control group without a catalyst. The study helps to understand the reaction mechanism of Pt-catalyzed lignin pyrolysis from the microscopic point of view and provides a reference for the use of catalysts in practical applications.

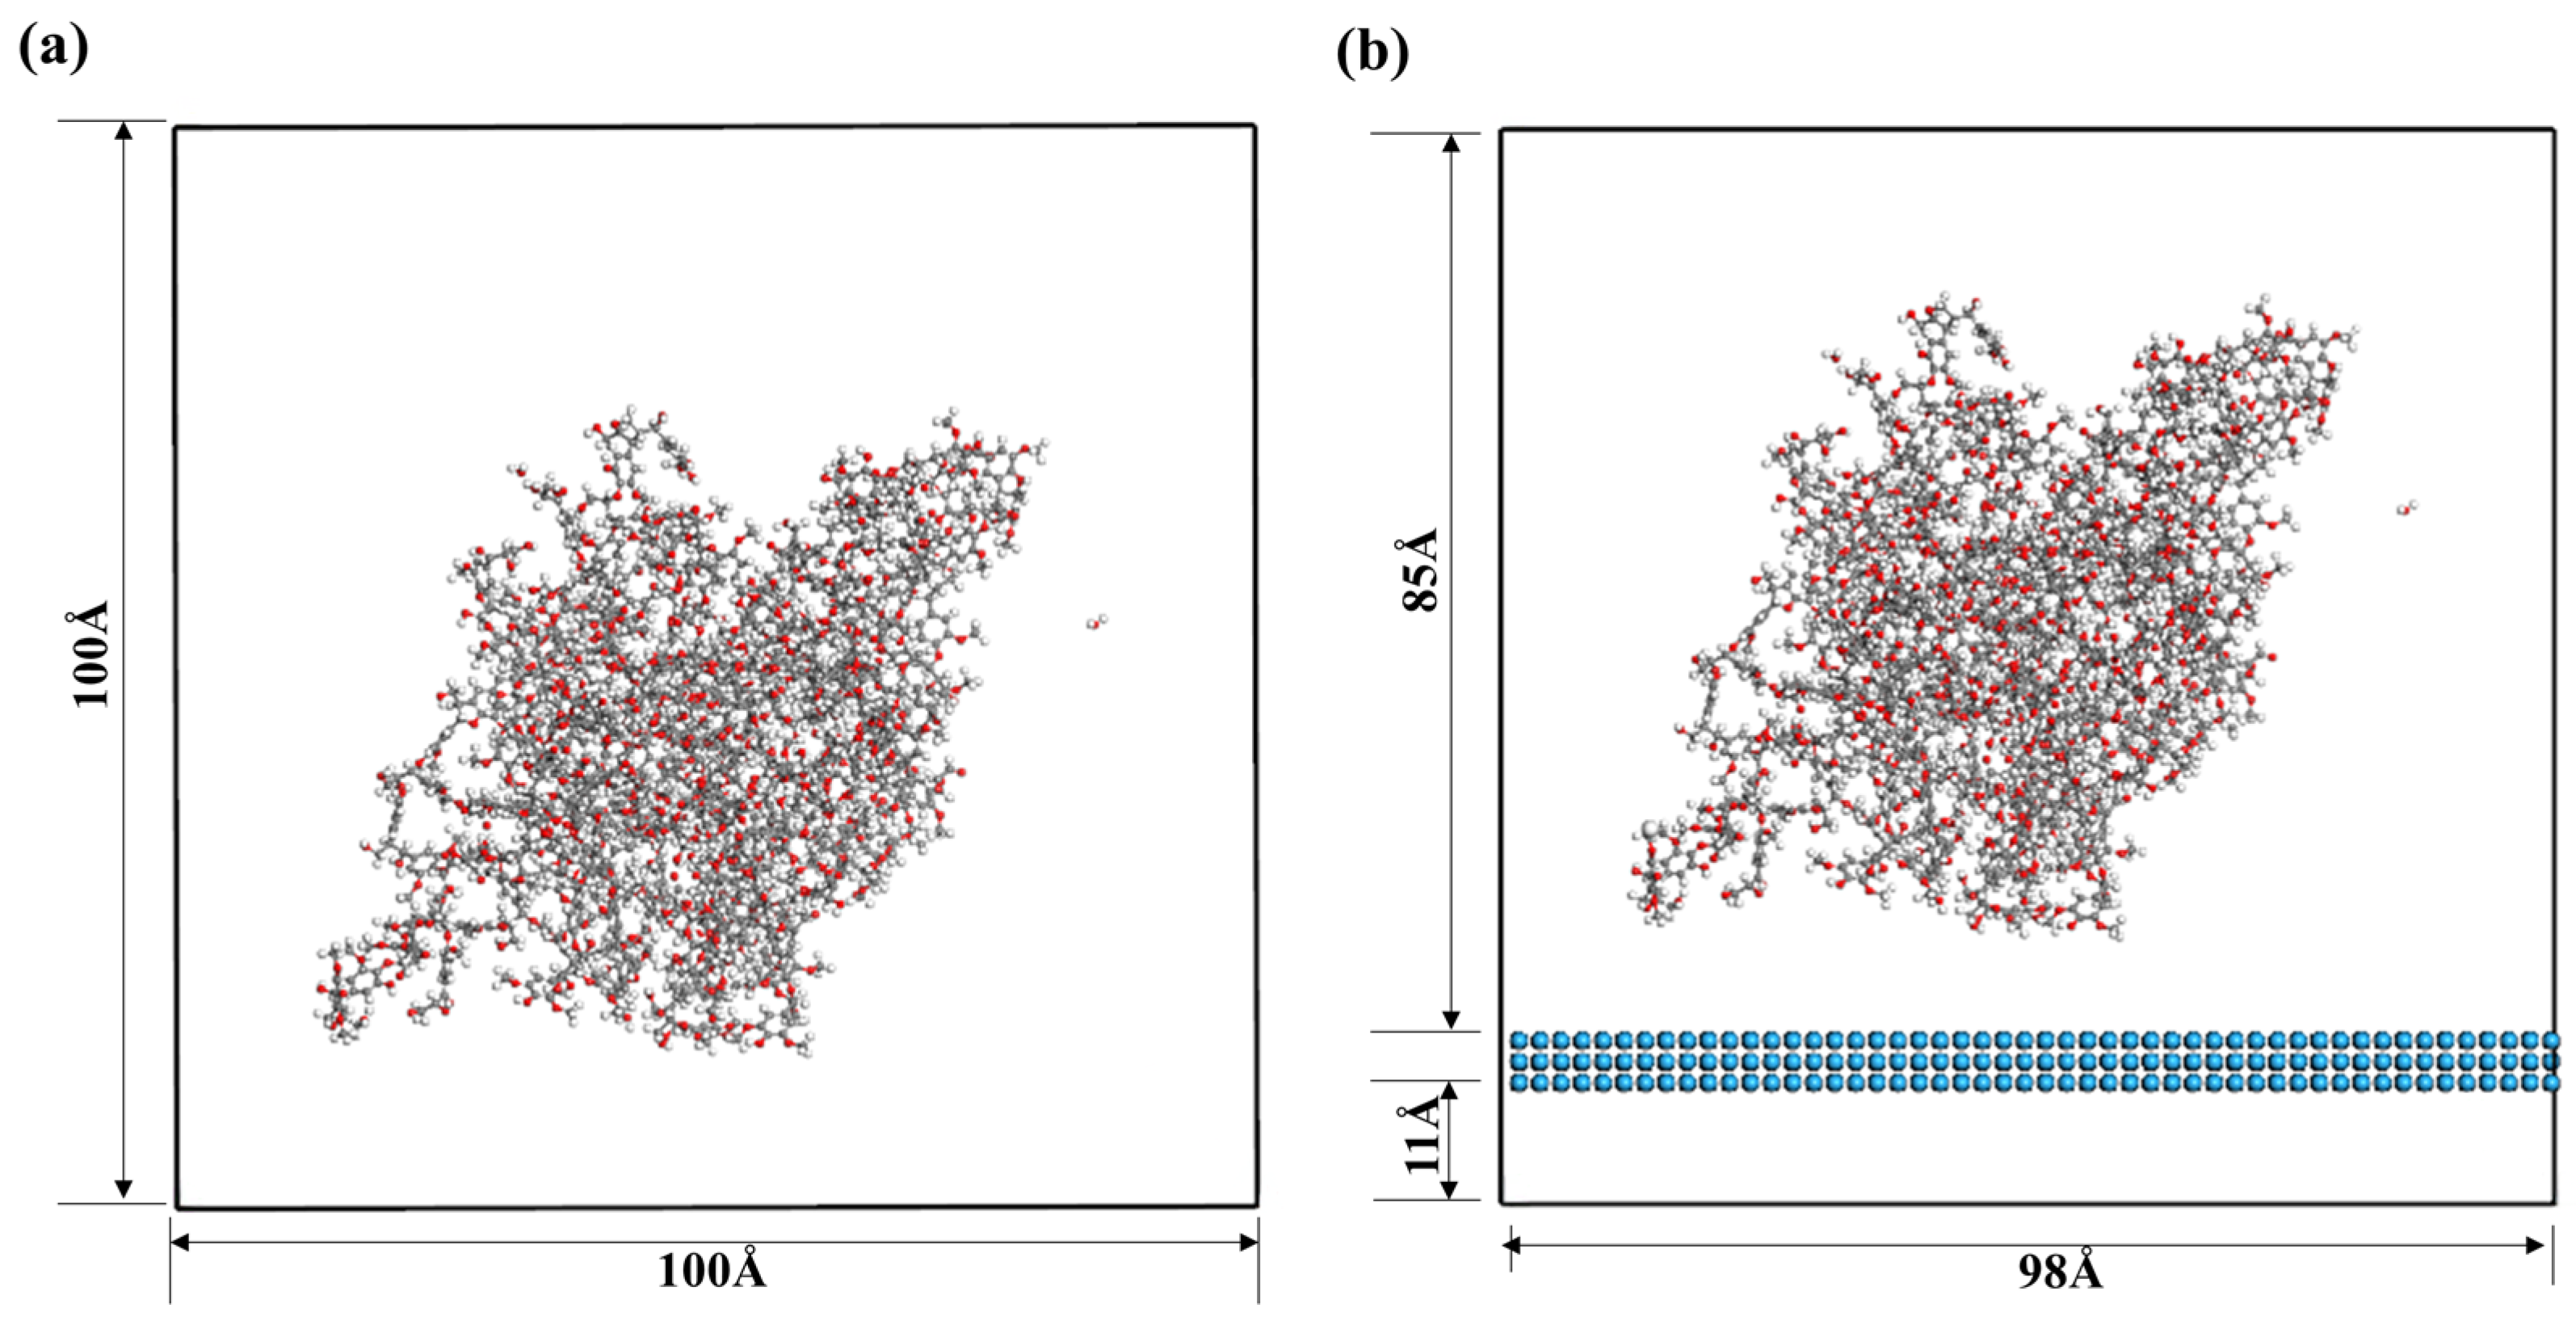
2. Materials and Methods

ReaxFF [20] is a well-known molecular force field that can simulate chemical reactions in systems, and its biggest advantage is that it can handle large-scale molecular systems with tens of thousands of atoms. The ReaxFF MD simulation method is widely used at present, especially in complex reaction processes such as pyrolysis, gasification, and oxidation.
In this study, the molecular dynamics simulation of the pyrolysis process was carried out using the large-scale atomic/molecular massively parallel simulator (LAMMPS) [27] and reactive force-field (ReaxFF) method. The ReaxFF potential parameters used were derived from Shin’s [28] paper, The reaction force field can describe the hydrocarbon conversion on the metal catalysts.
In this work, beech lignin was studied, a classic hardwood lignin. The specific lignin model is a three-dimensional (3D) lignin model constructed on the basis of the two-dimensional (2D) lignin model proposed by Nimz [29] in the last century. This lignin model is a type of lignin produced in American beech trees. The detailed 2D model structure of Nimz used in this study is provided in Supplementary Figure S1. The two monomolecular lignin models were first optimised separately by using the Dreiding potential field. Then the two optimised monomolecules were compressed into a cubic periodic simulation box to construct an amorphous lignin model. The cell box was compressed from 0.2 g/cm3 to 1.3 g/cm3. The initial density of 0.2 g/cm3 was chosen to prevent the overlap of aromatic rings and other functional groups. The lignin model was then relaxed for 200 ps at 1 atm and 298 K. Finally, thermal annealing was conducted using an NVT ensemble from 298 K to 800 K to obtain a more reasonable structure as adopted in previous studies [30]. The final lignin model is shown in Figure 1a. The catalysts were added by placing three layers of 98 Å × 98 Å Pt atoms in a cell box, as shown in Figure 1b. In the catalyst model, to prevent molecules from crossing the y boundaries and escaping from the simulation box, reflective walls were used along the y direction. Periodic boundary conditions are used in the x and z directions to eliminate the effect of edge effects. All the Pt atoms were pinned to prevent lateral movement along the y-axis. And in the model without the catalysts, periodic boundary conditions were used in the x, y, and z directions. Previous studies by Li et al. [31,32,33] showed that high temperatures can significantly accelerate chemical reactions during the simulation of reactive molecular dynamics. The pyrolysis of lignin is typically set at temperatures between 600 and 1000 K in experiments. However, in ReaxFF molecular dynamics simulations, the time scale of the simulation is on the picosecond scale, which is much shorter than the experimental time. The high temperatures used in ReaxFF MD simulations can be considered as “time-scale compressing” for the low temperatures in experiments. The main assumption of this method is based on the harmonic transition state theory [34]. Therefore, in order to accelerate the reaction speed and reduce the computational costs, temperatures of 3000 K or higher are usually used in simulations. In addition, several studies [35,36,37,38,39,40] have also chosen high temperatures above 2000 K for ReaxFF MD simulations. So, all simulations were heated from 300 K to 5000 K with an NVT ensemble. The timestep is 0.2 fs. For the system with catalysts, all Pt was optimised at 20 ps with an NPT ensemble before heating up.

3. Results

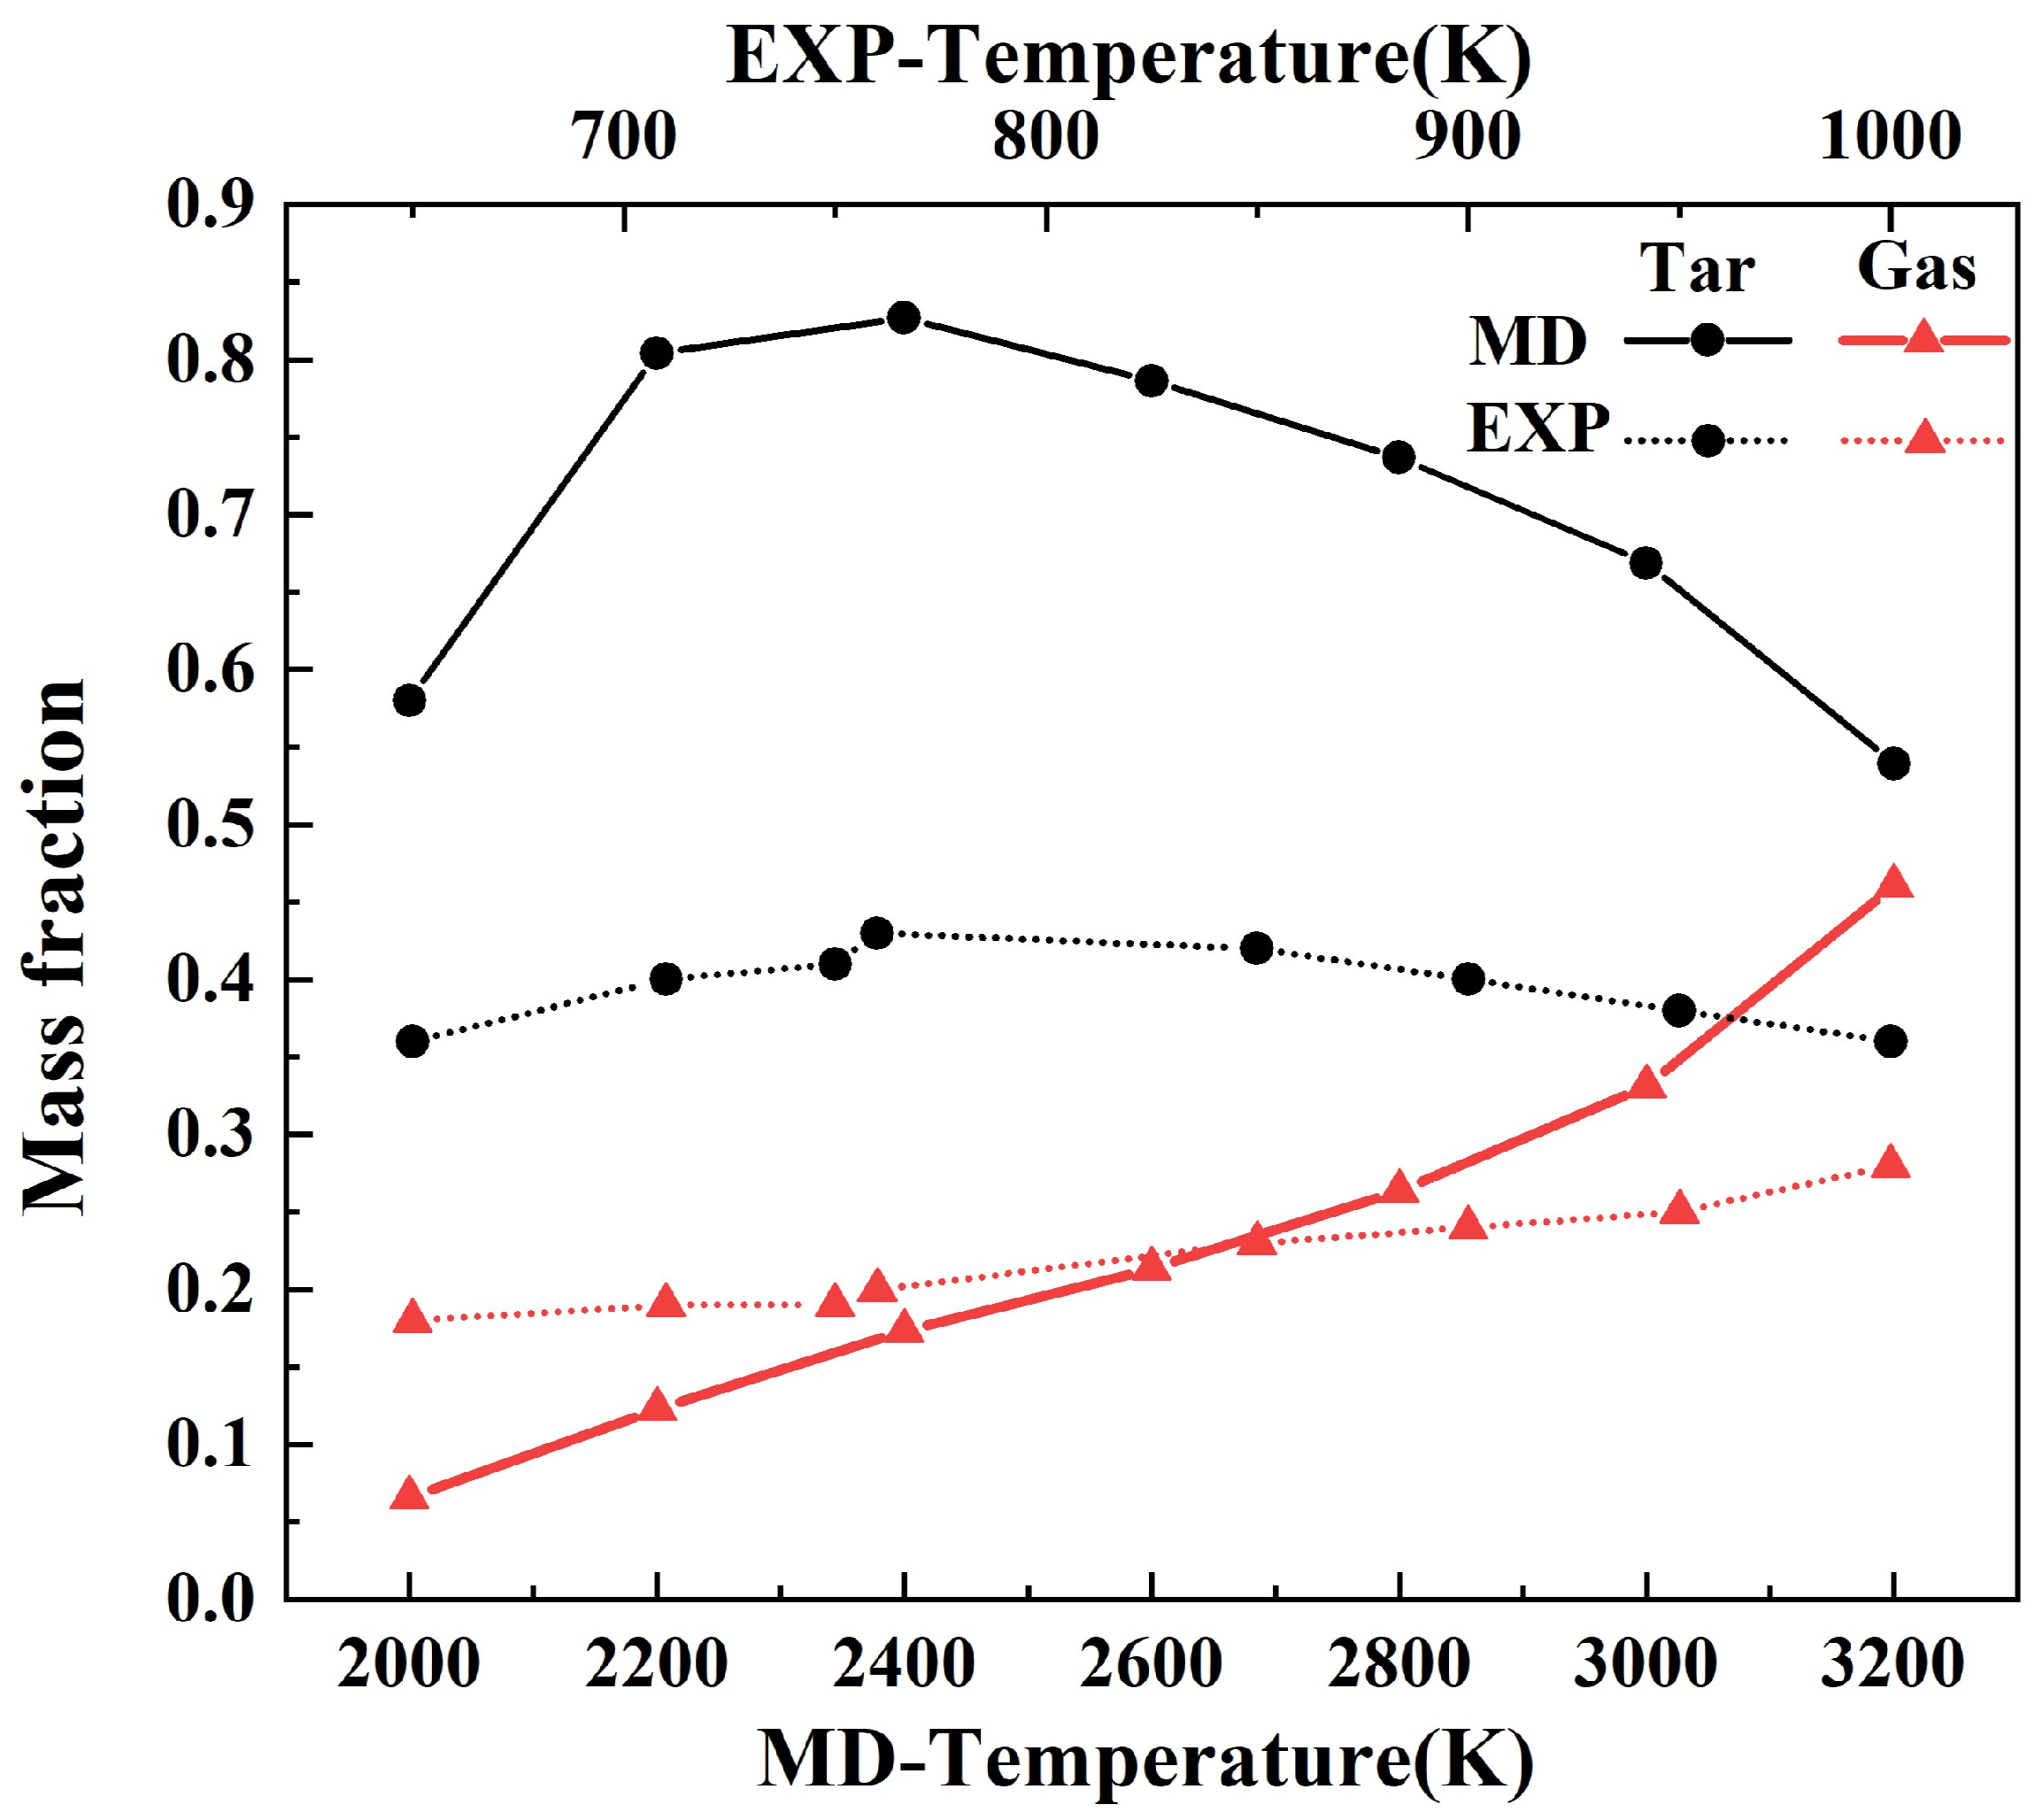
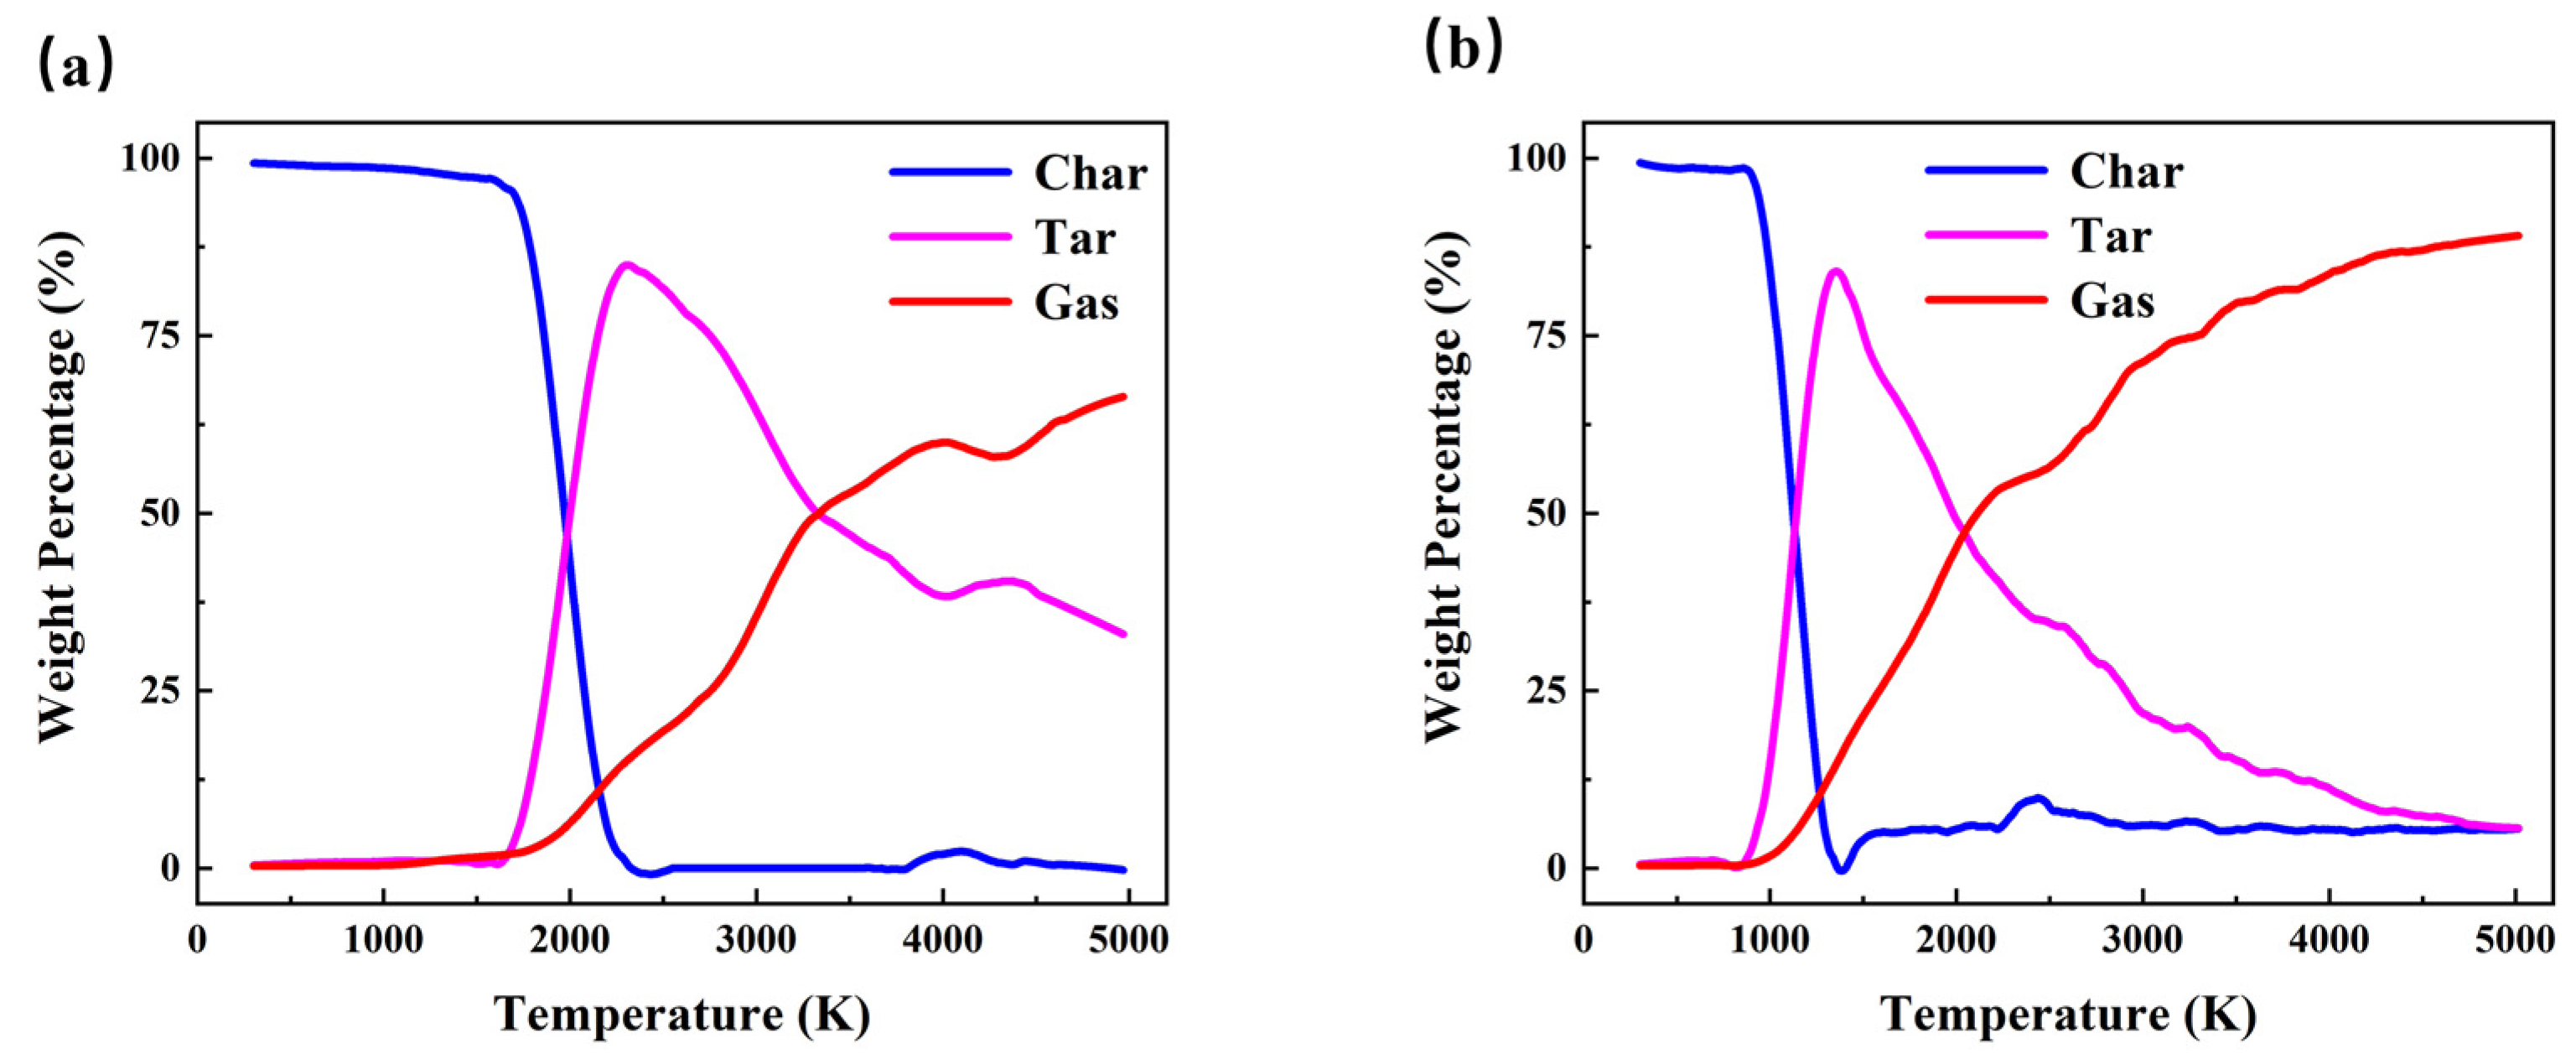
3.1. Evolution of Pyrolysis Products

The results analysed in the main text are all obtained with a heating rate of 6 k/ps heating, while the results of 2 k/ps and 4 k/ps are given in the Supplementary Figures S2 and S3.
To verify the simulation in this study, the results of the ReaxFF MD simulation were compared with the experimental data reported by Di et al. [41] As shown in Figure 2, tar and gas mass fractions were compared between the system without catalysts and the experiment. By comparing the results of the experiment and simulation, it can be seen that the trend of gas mass fraction change is basically consistent, while the mass fraction of tar in the simulation is higher than that in the experiment. This is due to the use of higher simulation temperatures in molecular dynamics simulations, which generate more tar at around 2000 K. As the temperature further increases, tar will decompose and produce a certain amount of gas. In the simulation, before 2000 K, the mass fractions of gas and tar were very low because lignin had not undergone significant decomposition and mainly existed in the form of char. Therefore, considering the changes in tar and gas at temperatures before 2000 K is not very meaningful. When the simulated temperature reaches 3200 K or above, due to the closed system chosen for simulation, the mass fraction of tar will further decrease, while the mass fraction of gas will correspondingly increase. Therefore, we chose a temperature range of 2000–3200 K for comparison with the experiment.
According to the number of carbon atoms in pyrolysis products, pyrolysis products can be divided into three categories, among which, char is defined as if the number of carbon atoms is greater than 40, tar is defined as if the number of carbon atoms is 5–40, and gas is considered as if the number of carbon atoms is less than 5 [42]. As shown in Figure 3, the weight percentage change of char, tar, and gas in the two systems is calculated separately. In Figure 3, the overall trend of (a) and (b) is basically the same. As the temperature increases, the char content gradually decreases to zero, the tar content increases first and then decreases, and the gas content basically keeps increasing. Zhang et al. [30] studied the pyrolysis process of different lignin molecules, and the overall evolution was basically consistent with this study.
The pyrolysis of lignin molecules is mainly divided into two stages, as shown in Figure 3a. Before 1600 K, lignin molecules were mainly restructured, during which the lignin molecules had not decomposed, and the char content accounted for 100%. From 1600 K to 2400 K, the char content is rapidly reduced to zero, and the lignin molecules decompose to form tar, gas, and other components. At this time, the content of tar is relatively large, and there is also a small amount of gas. After 2400 K, these components are further decomposed into gas molecules, and the content of gas rises rapidly.
For the system with catalysts, as shown in Figure 3b, the lignin molecule begins to decompose at about 1000 K, and the char content is reduced to zero at 1400 K. Compared with the system without catalysts, the overall pyrolysis process is accelerated. The temperature required for lignin molecules to start pyrolysis is lower, and the time required for each stage is shorter. This indicated that the addition of catalyst Pt significantly reduced the temperature at which lignin molecules started pyrolysis, accelerated the reaction process, and it also had a good catalytic effect. The catalyst system has a higher percentage of gas weight at 5000 K because the overall reaction process of the system without catalysts is slower, and more pyrolysis time can achieve the same product content as the catalyst system.
As shown in Figure 4, the number of some of the gas molecules in the model is calculated, mainly considering the number of H2, CO, H2O, CO2, and H radicals. Other gases are not counted due to their small quantities. As can be seen from Figure 4a, the number of molecules of various gases begins to increase gradually from 2000 K, with CO and H2 increasing at the fastest rate and in the largest quantity. Song et al. [43] studied the gasification of α-O-4 linkage lignin, whose main gas products are also CO and H2. The number of molecules of H2O increases first and then decreases, reaching a peak value at 3400 K. At the same time, the generation rate of H2 increases rapidly, which is due to the decomposition of water molecules at high temperatures, generating a large number of H radicals. These H radicals combine with each other to generate H2 molecules. It can also be seen from the graph that the increase in the number of H2 molecules corresponds to the continuous decrease in the amount of water. And the H2 formation rate slows down; the reason here is the decomposition of H2. As can be seen from Figure 4b, the overall change trend of the gas is consistent, but the gas has begun to form at 1000 K, and it takes less time for gas production to peak, which indicates that the addition of catalysts enables the generation of gas molecules at lower temperatures, thus allowing for the adoption of lower temperatures in industrial production by adding catalysts. This is consistent with the temperature at which the catalyst reduces the pyrolysis of lignin molecules, as shown in Figure 3. At the beginning of 3000 K, the amount of H2 begins to decrease and the number of H radicals increases rapidly. This is due to the decomposition of H2, which indicates that the catalyst can also promote the decomposition of H2 to some extent.

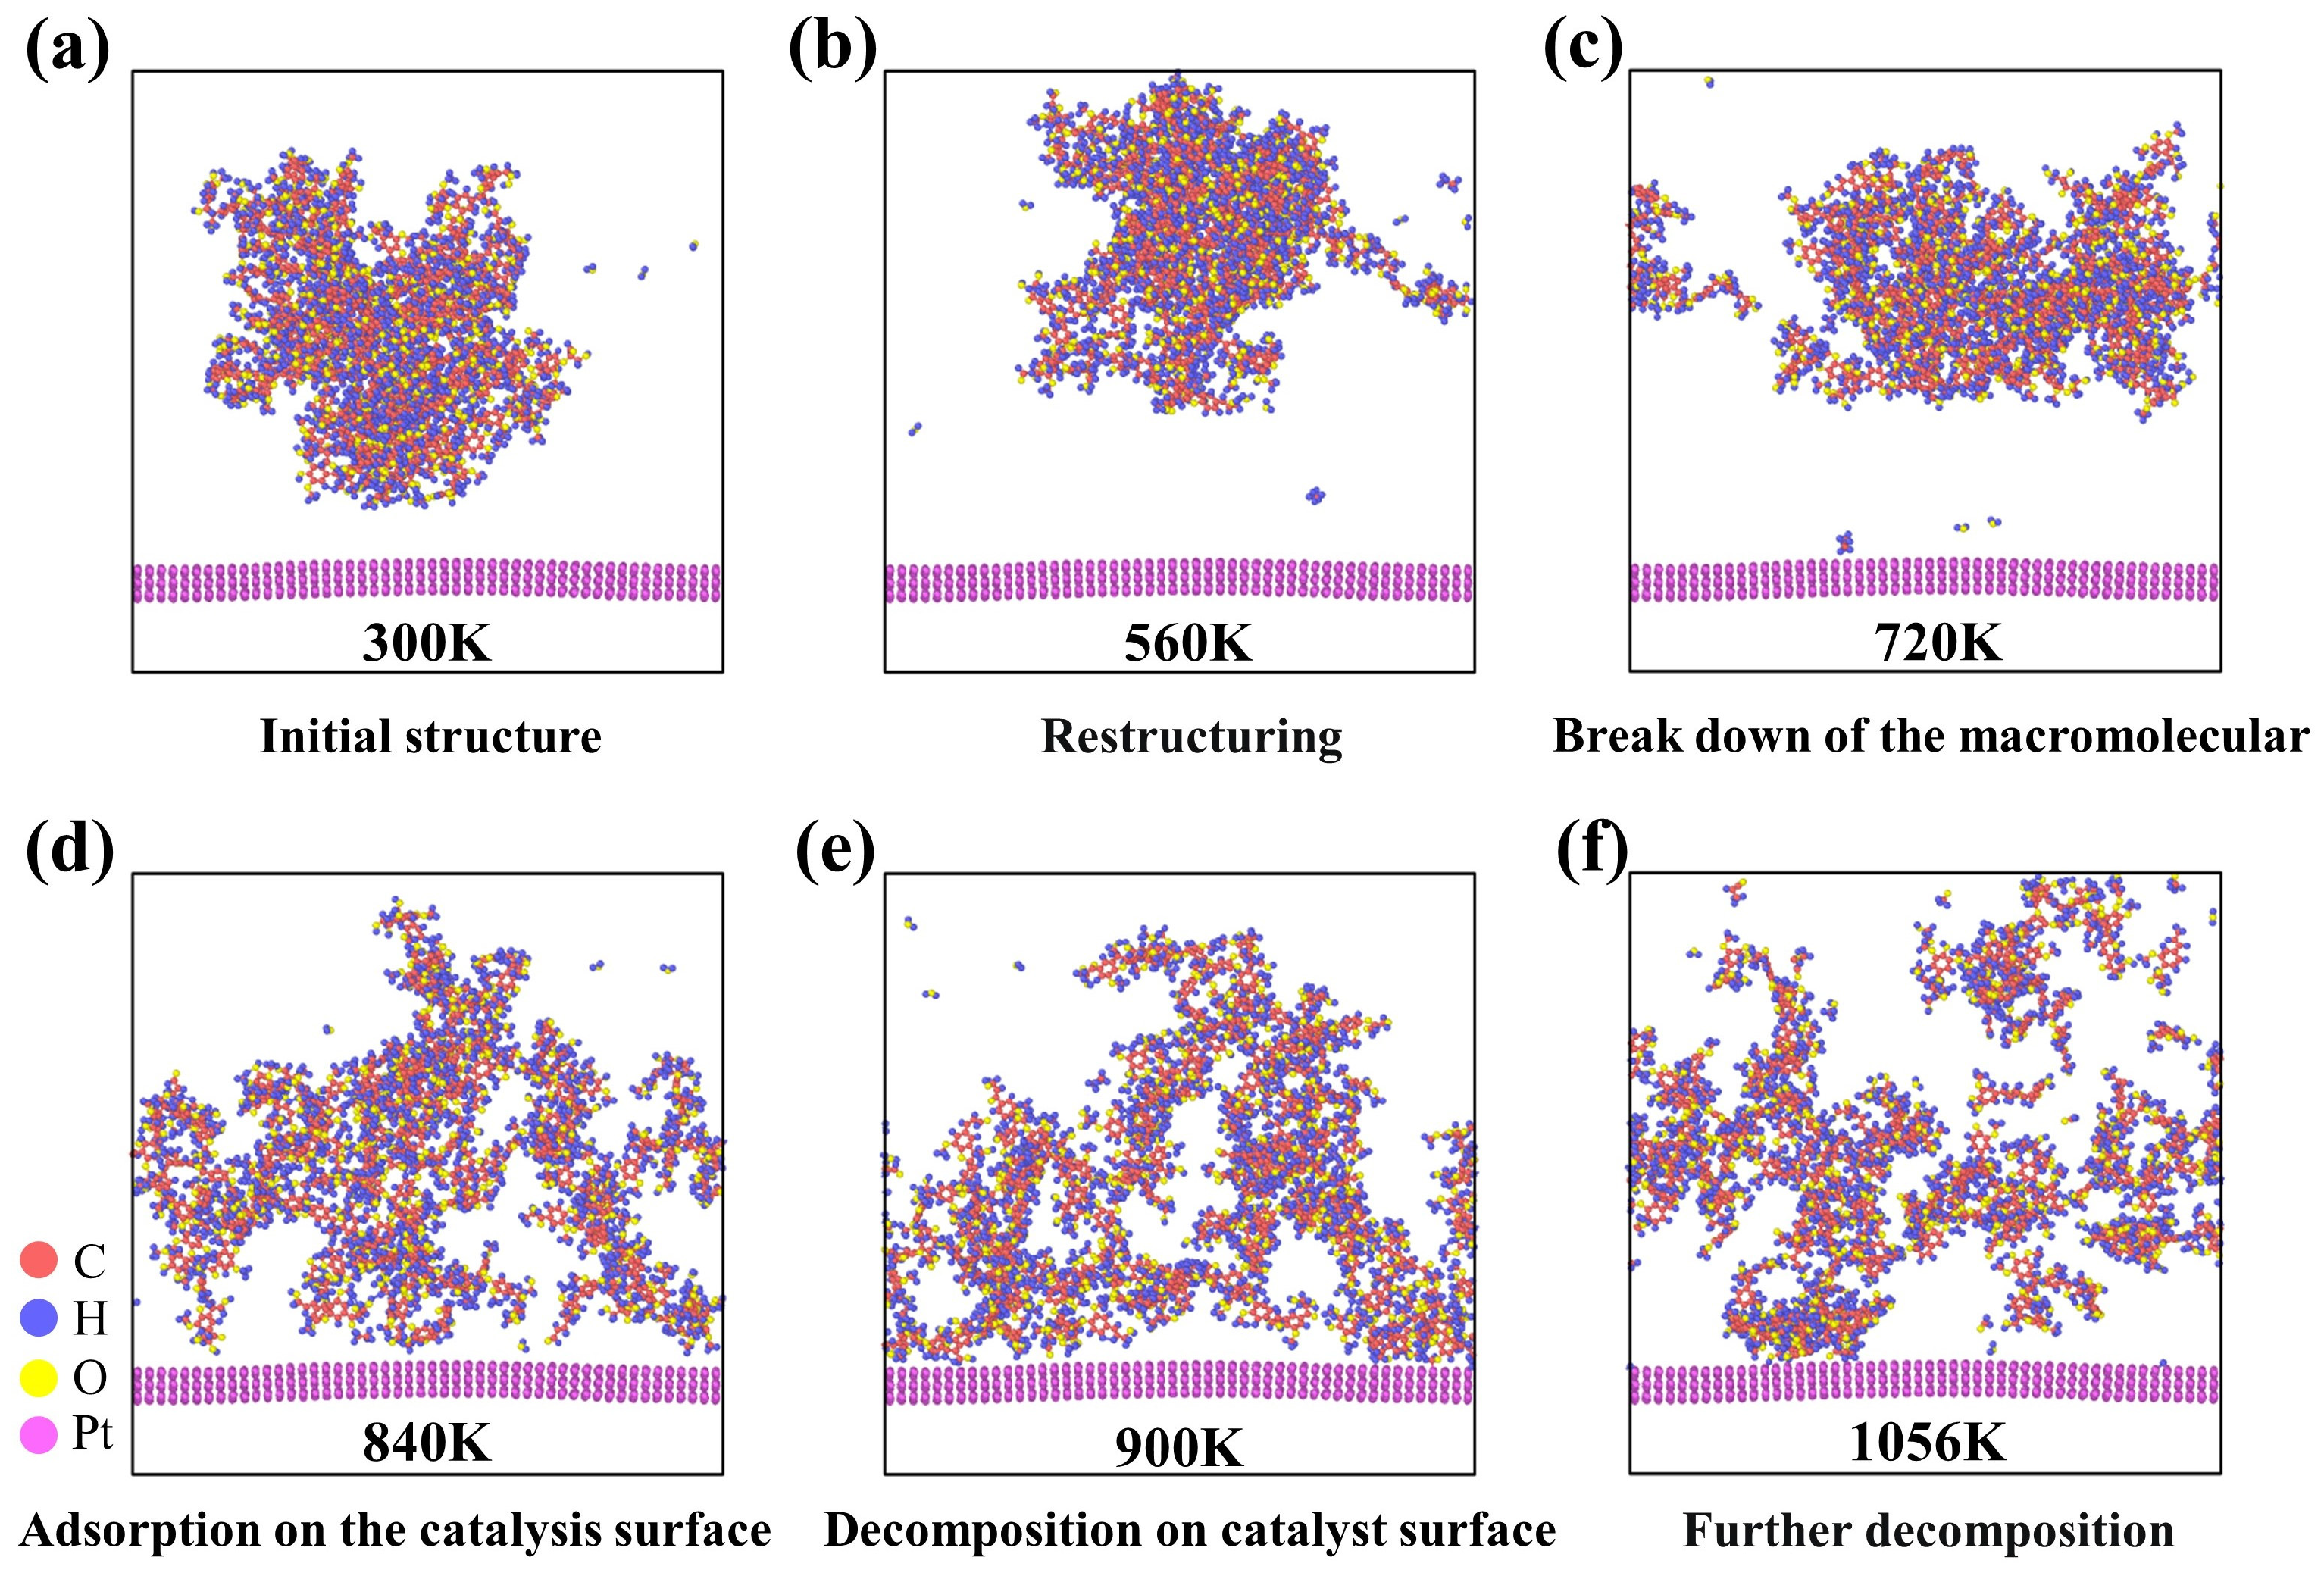
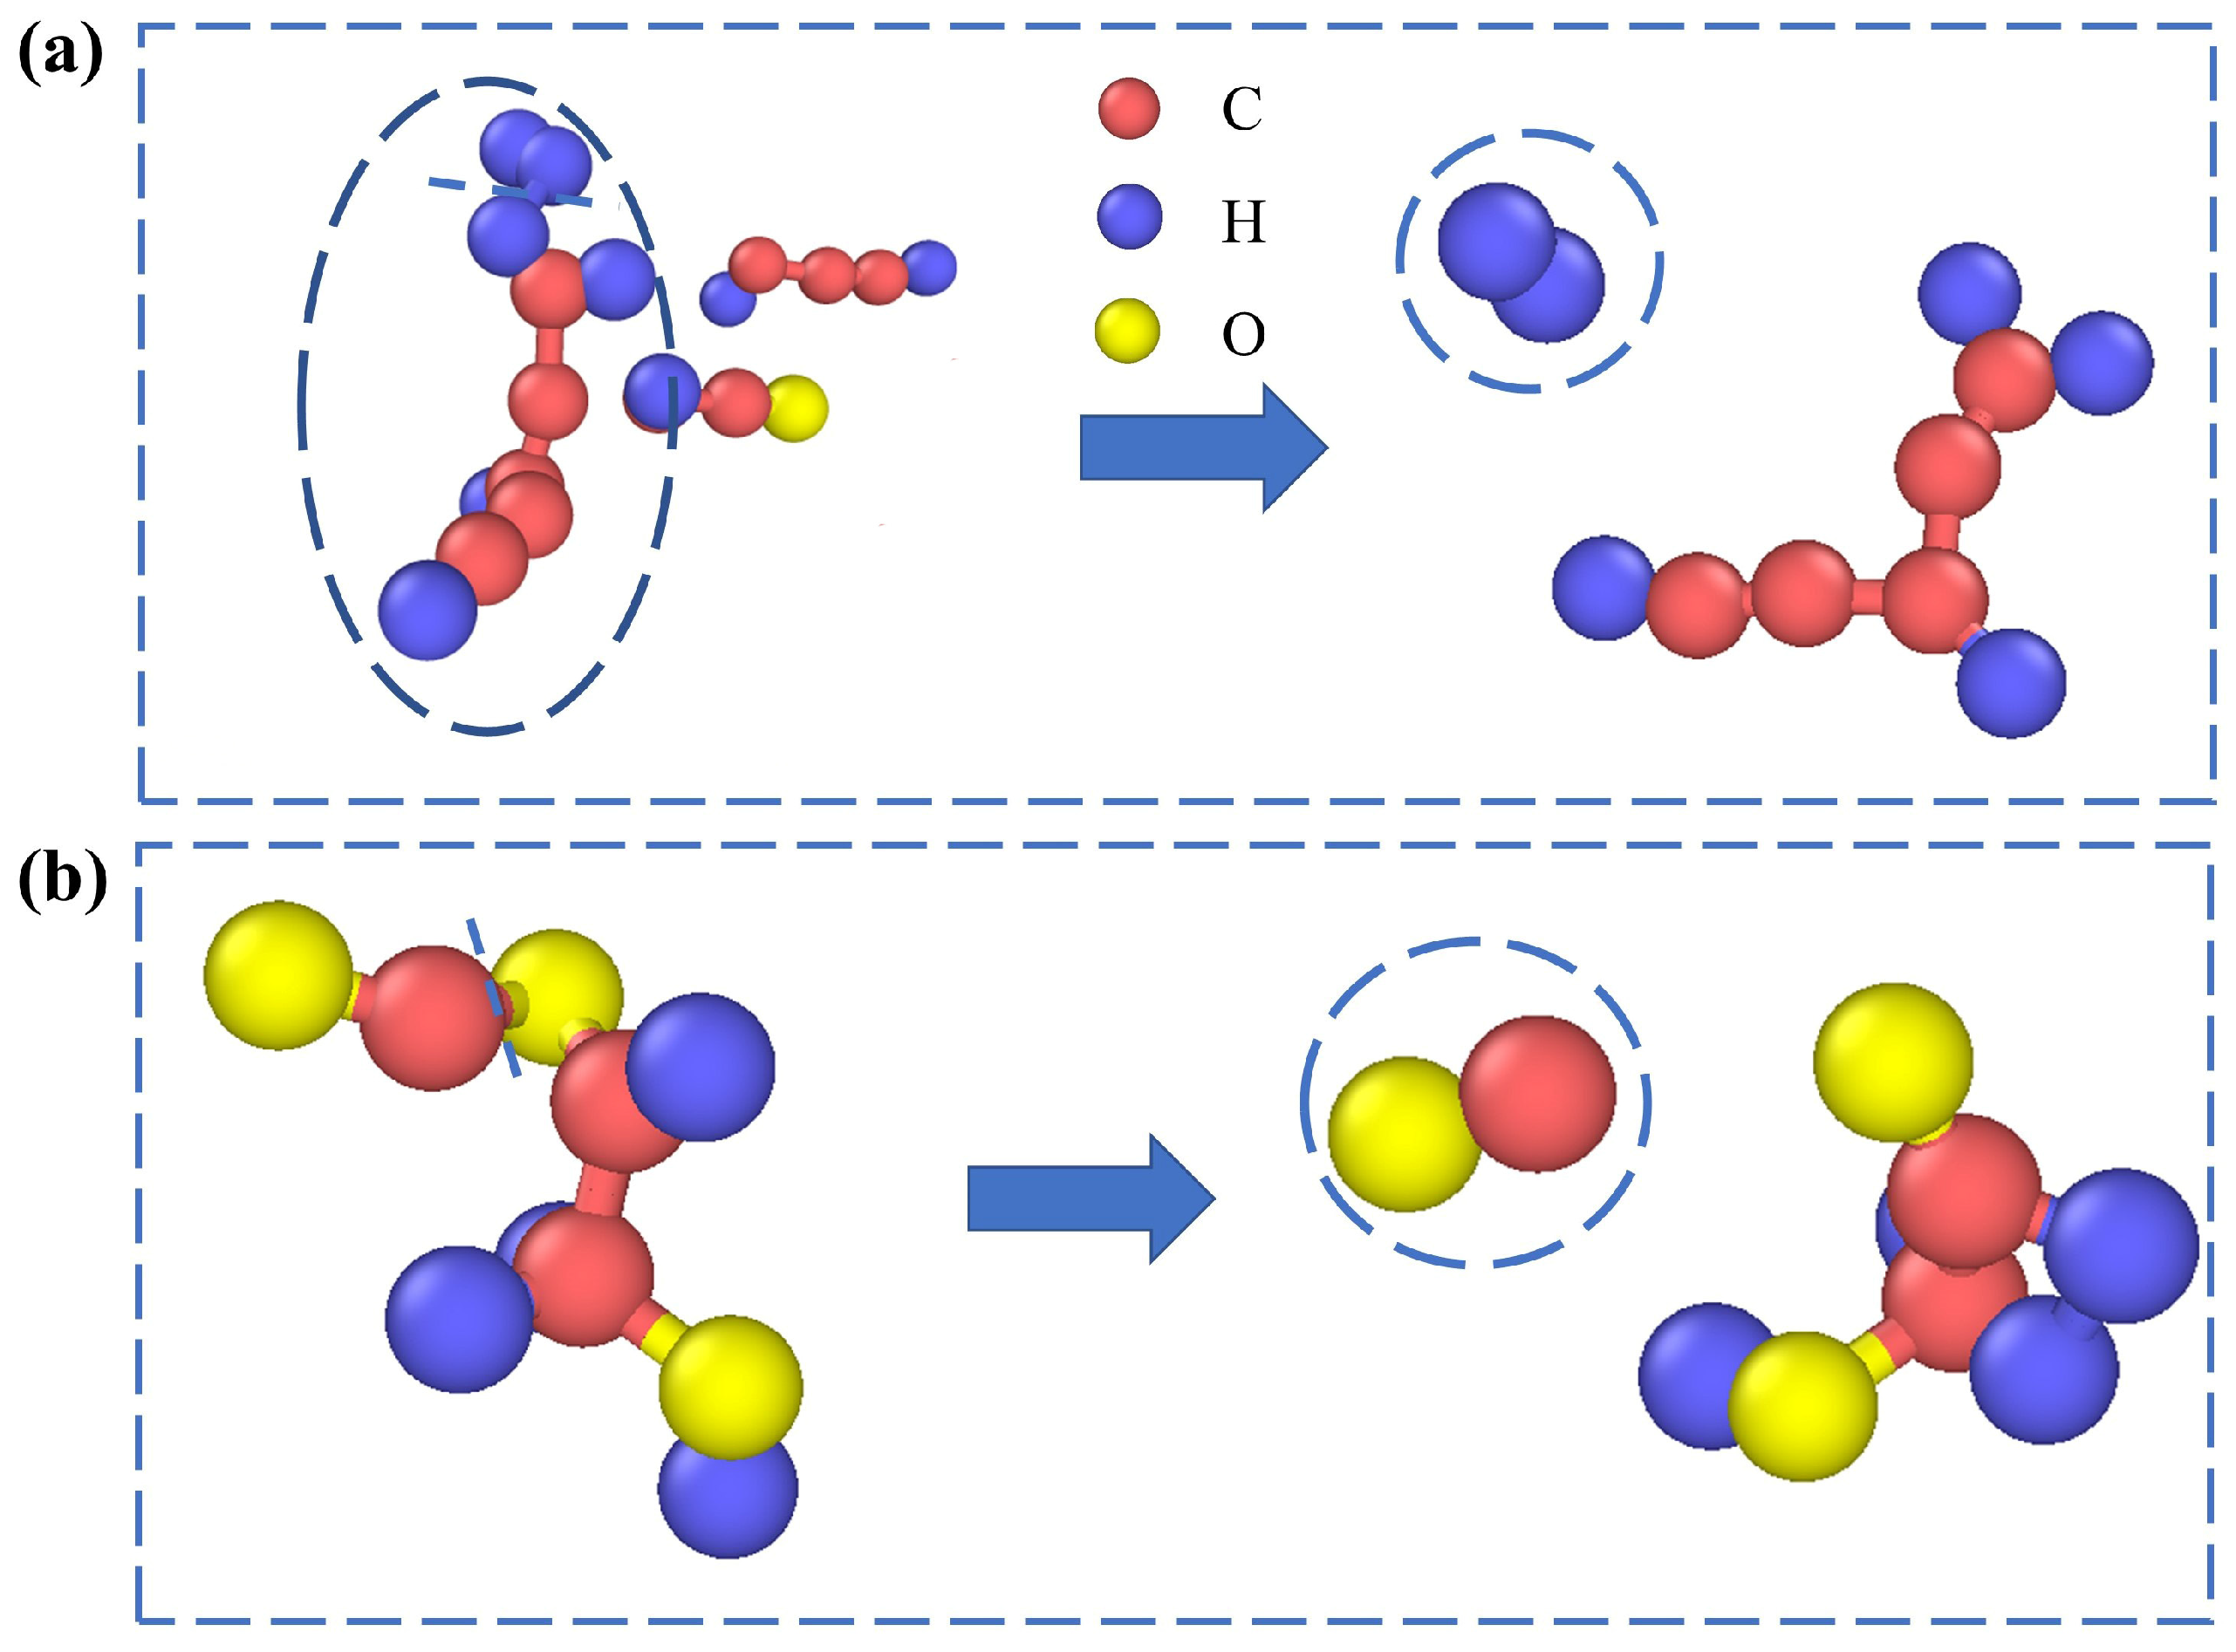
3.2. Structural Evolution of Lignin Molecules

As mentioned earlier, Pt catalysts can significantly reduce the temperature of lignin decomposition. In order to find out the effect of catalysts on the pyrolysis of lignin molecules, configuration changes were captured at several temperatures during the simulation process, as shown in Figure 5. The configuration changes in the system without catalysts were also compared, as shown in Figure 6. Figure 5a is the initial configuration, with the lignin macromolecule in the middle region of the box and three layers of Pt in the lower part of the box. With the increase in temperature, the lignin molecules began to decompose some of the middle molecular fragments, and the whole macromolecule began to gradually become dispersed. At 720 K, one molecular fragment has been separated from the macromolecule, and the volume of the entire molecule becomes larger. At 840 K, more molecular fragments appear, while the entire molecule is attracted to the catalysts, and some begin to come into direct contact with the catalysts. The reason why lignin molecules are adsorbed by Pt catalysts may be due to the presence of some active sites on the catalyst surface, which can form hydrogen bonds with functional groups such as hydroxyl or carbonyl groups in lignin, thereby promoting the adsorption of lignin molecules by the catalyst. At 900 K, many fragments have been adsorbed by the catalysts, and the entire molecule moves from the middle region to the upper part of the catalysts. At 1056 K, the number of molecules becomes very large, and these fragments begin to disperse in the box. Many are still adsorbed by the catalysts.
In Figure 6, it can be seen that from 300 K to 1056 K, the whole molecule is basically in the state of clusters, and they are distributed in the middle region of the box. There is no trend of migration to the lower part, and the lignin molecule has not been pyrolysis. Therefore, from the changes in configuration, it can be seen that the catalyst has a good catalytic effect because the catalyst can attract lignin macromolecules. This attraction will make the whole lignin molecules move towards the catalyst surface, and the volume of lignin will expand in the process of movement, which accelerates the initial pyrolysis of lignin and generates many medium molecular fragments, thus reducing the temperature at which lignin begins pyrolysis.
As shown in Figure 7, the formation processes of two main gas products, H2 and CO, were captured. As shown in Figure 7a, the end of a carbon chain is stripped of an H2 molecule by breaking the H-H bond. Figure 7b shows the process of forming a CO molecule by breaking the C=O bond on the carbon chain.
In order to explore the adsorption phenomenon of the catalysts on lignin molecules and which element the catalysts adsorbed more strongly, the configuration changes near the catalyst were observed, as shown in Figure 8. At 1190 K, the lignin molecular fragments were attracted by the catalysts, and a small amount of H was adsorbed on the catalyst surface. At 1378 K, a large amount of H began to attach to the upper surface of the catalysts. With the increase of temperature and further pyrolysis of lignin molecules, at 1461 K, it was observed that some H could move freely through the three-layer Pt, while other atoms such as C and O could not pass through the catalysts. At 1833 K, H passing through the catalysts was shown to be attached to the lower surface of the catalysts. As shown in Figure 8e, a large amount of H has been adsorbed on the lower surface of the catalysts, and some of the H atoms move to the lower part of the box, reforming H2 molecules. Therefore, the addition of catalysts can accelerate the pyrolysis process of lignin through the adsorption of H, and also accelerate the decomposition of H2, so that H can move freely through the three-layer Pt.
In order to reflect the adsorption of H by the catalysts and the penetration effect of H through the catalysis layers by quantitative analysis, the density distribution of H on the Y-axis at six temperatures was calculated, as shown in Figure 9. The Y-axis was chosen because the vertical direction of the three-layer Pt is the Y-axis. At 300 K, H exists in the lignin macromolecules and distributes in the middle region of the Y-axis. When the temperature reaches 1300 K, H begins to evenly distribute in the region above the catalysts. At this time, the lignin macromolecules have been initially decomposed, and a small amount of H2 has been generated. As shown in Figure 9c, with further pyrolysis, the H density distribution on the Y-axis appeared at a peak, and the peak position was exactly where the top-layer Pt was located, which quantitatively verified the strong adsorption of H by the catalysts in Figure 7. At 2300 K, a peak also appeared on the lower surface of the bottom layer of Pt, and there was also a small amount of H between the three layers of catalysts, which also verified that H could penetrate into the three layers of Pt and pass through the catalysts to the lower part of the box. In Figure 9e,f, it can be seen that, at 3000 K and 4300 K, the peak distribution of H density on the upper and lower surfaces of the catalysts is basically the same, and the pyrolysis of lignin has been relatively thorough. Therefore, the catalyst accelerates the generation and further decomposition of H2 to a certain extent through the adsorption of H.

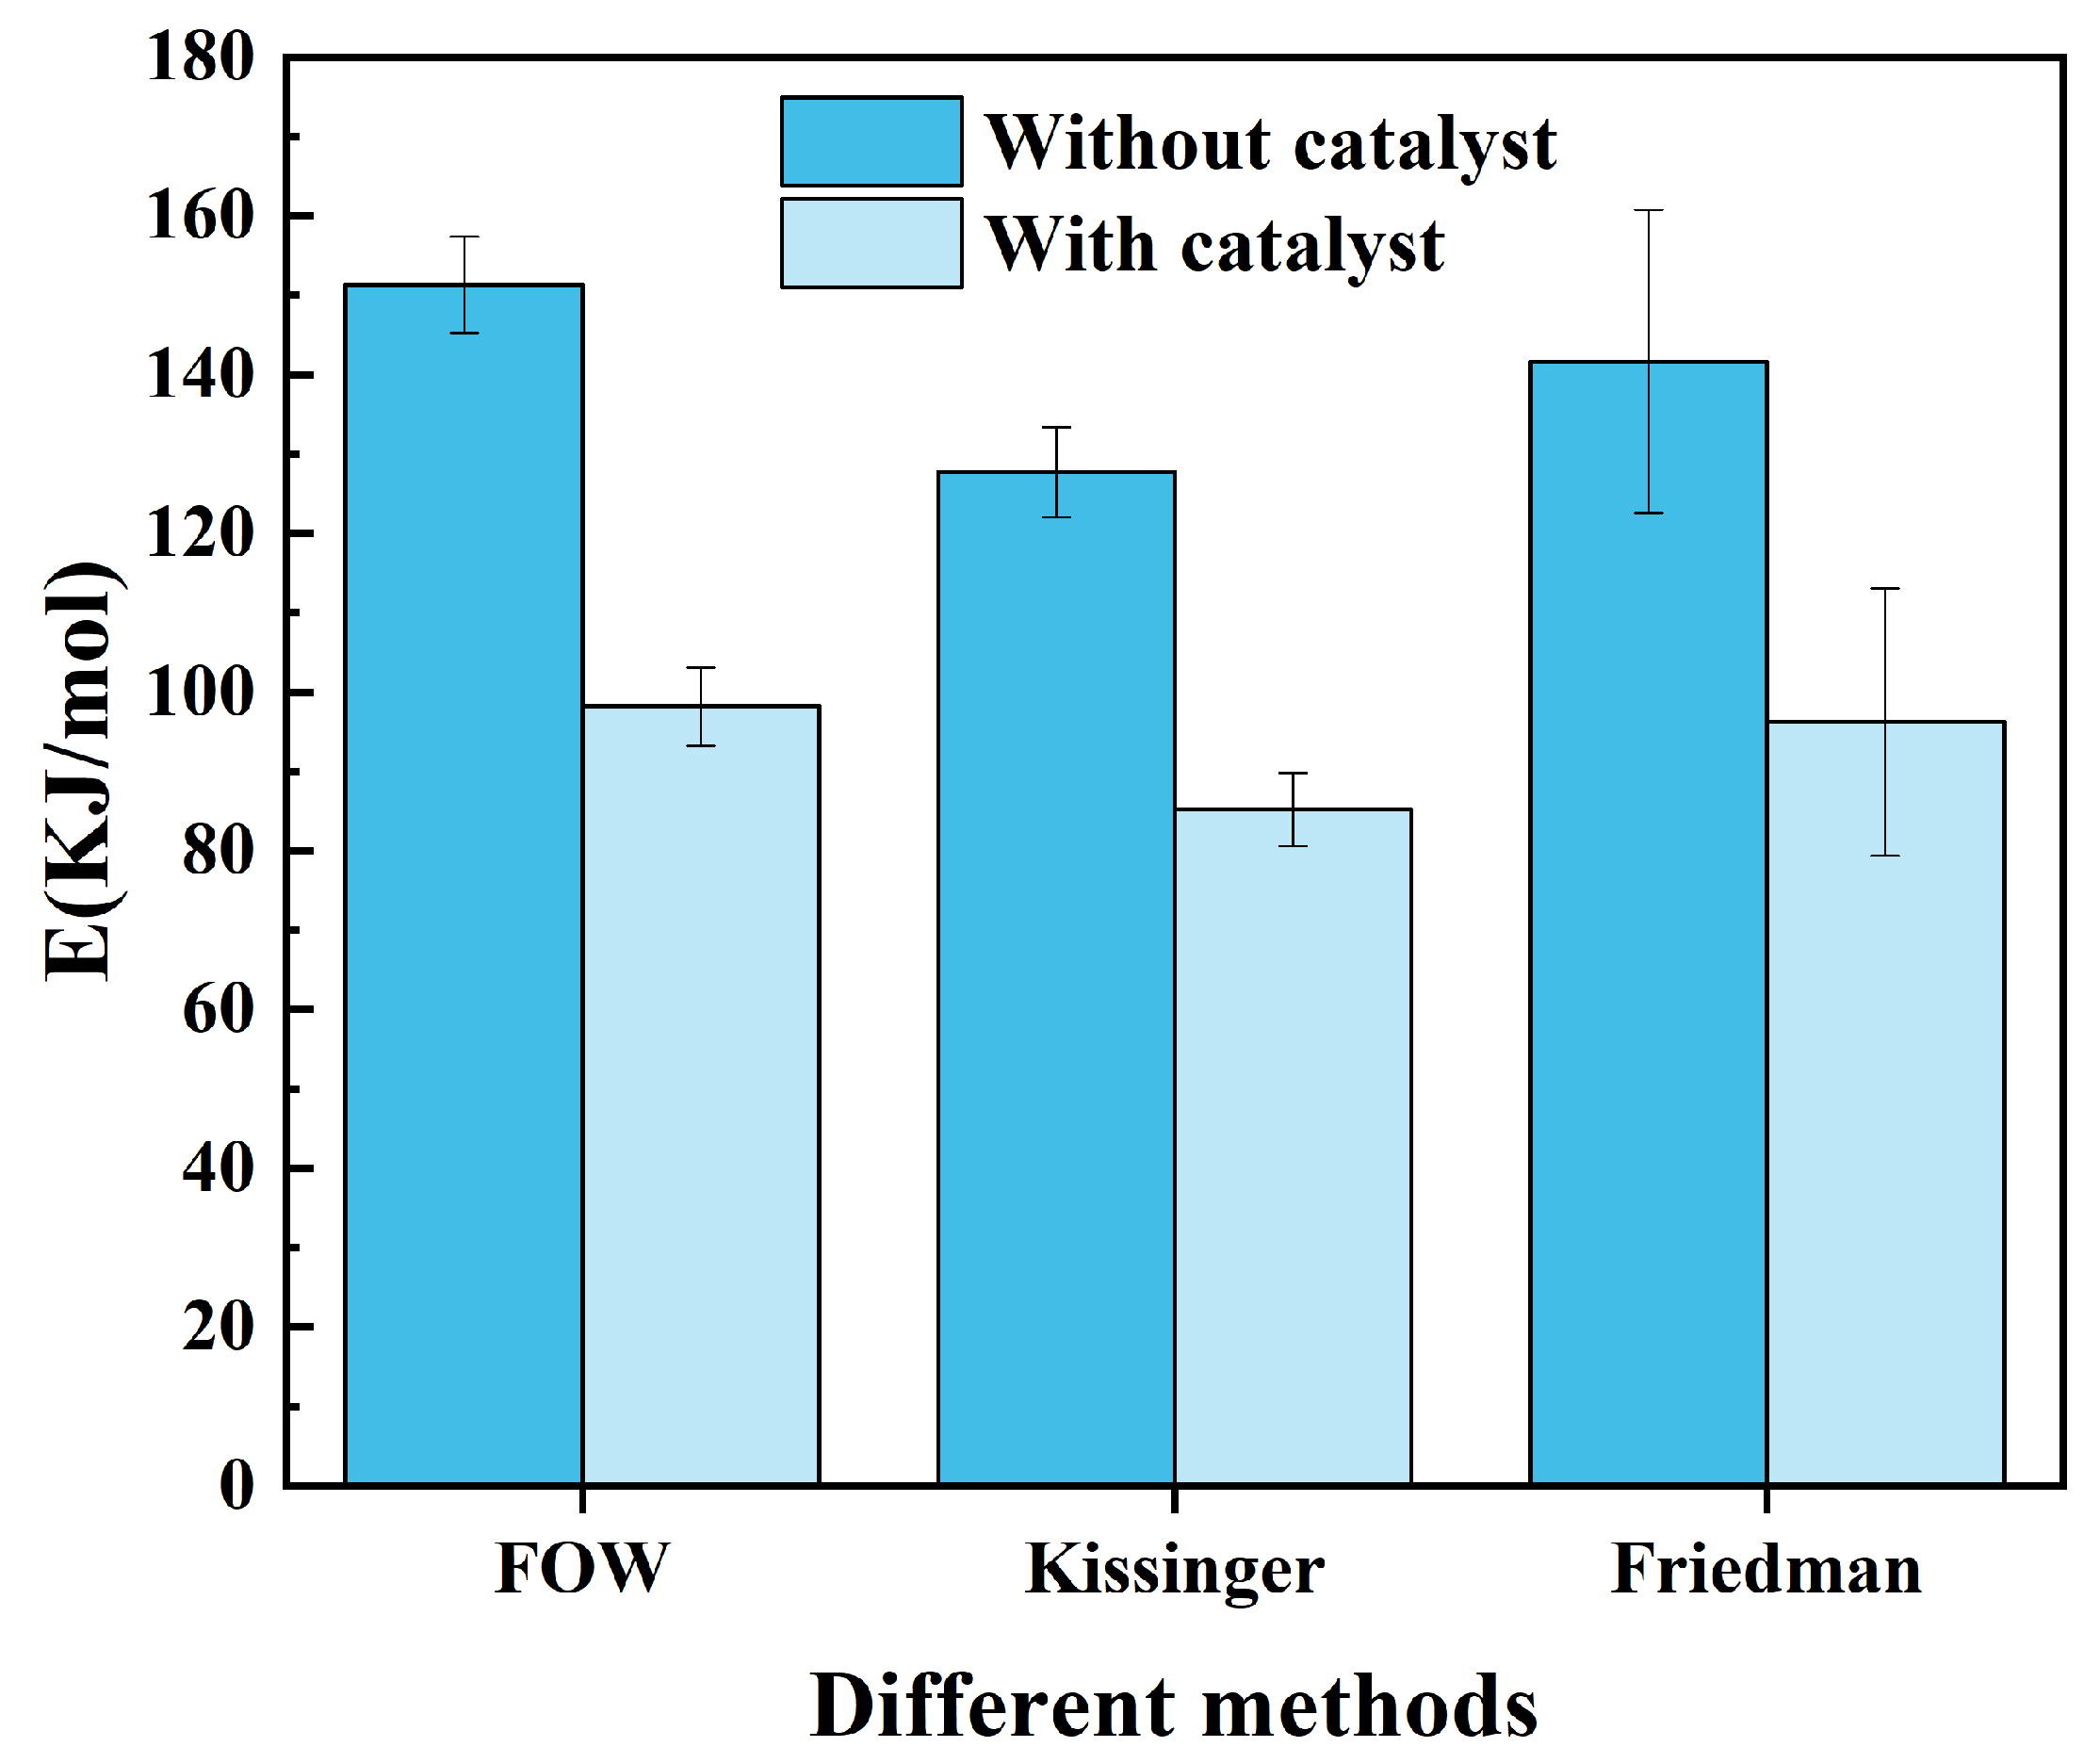
3.3. Kinetic Analysis

Kinetic analysis is an essential approach for the quantitative evaluation of the thermochemical conversion process. The Kinetics Committee of the International Union of Thermal Analysis and Calorimetry (ICTAC) recommends the use of multiple heating rates to calculate the activation energy, avoiding a single heating rate [44]. The activation energy calculation of biomass pyrolysis at 2000 K was also studied by Liu et al. [45]. Therefore, this study selected three groups of heating rates of 2 K/ps, 4 K/ps, and 6 K/ps for calculation. In the kinetic study of the thermal degradation process, some fundamental rate equations have been extensively used [46,47,48]. In this study, by fitting different equations, including the Flynn–Ozawa–Wall (FOW) method [49,50], the Kissinger–Akahira–Sunose (KAS) method [51], the and Friedman (F) method [52]. The error bars of different equation fitting were compared, as shown in Figure 10. By comparing the error bar and R2 in Table S1, finally, the Flynn-Ozawa-Wall (FOW) method was selected as the kinetic model to obtain an equation more suitable for lignin molecular pyrolysis, as shown in Equation (1).
    l o g β = l o g A E R f ( x ) 2.135 0.4567 E R T
where β is the heating rate, T is the corresponding temperature under a certain conversion rate, A (min−1) is the pre-factor, E (J/mol) is the activation energy, and R is the gas constant (8.314 J/mol·K). By fitting the logarithm of the heating rate and the relation of 1/T, the degradation activation energy can be calculated. If the relationship between the two is a straight line, then the slope is −0.4567E/R, and the activation energy can be calculated.
First, the conversion curves were calculated at different heating rates, as shown in Figure 11. As can be seen from Figure 11, with the increase in heating rate, the conversion curve as a whole shifted to the right. This indicates that the slower the heating rate is at the same temperature, the higher the conversion rate is, which is also caused by a lower heating rate and a longer pyrolysis time. In Figure 11a, the model without catalysts began to transform after 1250 K and was basically completely transformed at about 2000 K, while the model with catalysts added in Figure 11b began to transform at 750 K and was completely transformed at 1300 K, which further verified the catalytic effect of the catalysts.
Through the conversion curve, six groups of conversion rates were selected to calculate the average activation energy, as shown in Figure 12. The activation energies calculated by different conversion rates are shown in Table S1. Finally, the activation energy under the six conversion rates is averaged. It can be seen from Table S1 that the average activation energy of the system without catalysts is 151.28 kJ/mol, while the average activation energy of the system with catalysts is 98.18 kJ/mol. From the kinetic point of view, the addition of catalysts significantly reduces the activation energy of the system, reflecting the good catalytic performance of Pt.

4. Conclusions

In this study, ReaxFF MD was used to simulate the effect of catalyst Pt on lignin pyrolysis. Compared with the control group without catalysts, the main conclusions are as follows:
(1) The addition of Pt catalyst significantly reduces the temperature at which lignin starts pyrolysis and also shortens the time required for the pyrolysis process;
(2) From the configuration, it can be found that the catalyst has an obvious attraction effect on lignin macromolecules, and the lignin begins to decompose during the attraction process. So, the lignin starts to break down at a lower temperature;
(3) The catalyst has a strong adsorption effect on H, which can accelerate the generation and further decomposition of H2, and H atoms can move freely through the three-layer Pt;
(4) The activation energy of the reaction process without catalysts and with catalysts was calculated from the kinetic analysis. It was found that the addition of a catalyst significantly reduced the activation energy of the reaction, indicating from a kinetic perspective that the catalyst accelerated the reaction rate, thereby proving the good catalytic effect of Pt catalyst on lignin pyrolysis.

Supplementary Materials

The following supporting information can be downloaded at https://www.mdpi.com/article/10.3390/su16083419/s1, Table S1: Activation energy at different conversion rates; Figure S1: The detailed 2D model structures of Nimz’s lignin model. The constructed 3D model consists of 5 molecules of (a) and 2 molecules of (b); Figure S2: Char, Tar, and Gas content changes at 4 K/ps, 2 K/ps: (a) without catalysts, (b) with Pt catalysts; Figure S3: The number of molecules at 4 K/ps, 2 K/ps: (a) without catalysts, (b) with Pt catalysts; Figure S4: The Kissinger and Friedman methods fit activation energies at 4 K/ps and 2 K/ps: (a) without catalysts, (b) with Pt catalysts.

Author Contributions

W.Z.: Methodology, Formal analysis, Investigation, Data curation, Writing—original draft, Conceptualization. K.L.: Supervision, Conceptualization, Methodology, Writing—review and editing, Validation. R.K.: Review and editing. Y.K.: Review and editing. Z.L.: Formal analysis, visualization, Data curation. Y.B.: Review and editing. Z.S.: visualization, Review and editing. C.J.: visualization, Review and editing. J.Z.: Project administration, Resources, Supervision. All authors have read and agreed to the published version of the manuscript.

Funding

This research was funded by “the Young Elite Scientist Sponsorship Program by CAST, grant number YESS20210090”, the “Beijing Natural Science Foundation, grant number J210017”, and the“China Baowu Low Carbon Metallurgy Innovation Foundation, grant number BWLCF202119, BWLCF202117”.

Institutional Review Board Statement

Not applicable.

Informed Consent Statement

Not applicable.

Data Availability Statement

Data are contained within the article and Supplementary Materials.

Conflicts of Interest

The authors declare that they have no known competing financial interests or personal relationships that could have appeared to influence the work reported in this paper.

References

  1. Huo, E.; Duan, D.; Lei, H.; Liu, C.; Zhang, Y.; Wu, J.; Zhao, Y.; Huang, Z.; Qian, M.; Zhang, Q.; et al. Phenols production form Douglas fir catalytic pyrolysis with MgO and biomass-derived activated carbon catalysts. Energy 2020, 199, 117459. [Google Scholar] [CrossRef]
  2. Kim, S.K.; Han, J.Y.; Lee, H.-s.; Yum, T.; Kim, Y.; Kim, J. Production of renewable diesel via catalytic deoxygenation of natural triglycerides: Comprehensive understanding of reaction intermediates and hydrocarbons. Appl. Energy 2014, 116, 199–205. [Google Scholar] [CrossRef]
  3. Atsonios, K.; Kougioumtzis, M.-A.; Panopoulos, K.D.; Kakaras, E. Alternative thermochemical routes for aviation biofuels via alcohols synthesis: Process modeling, techno-economic assessment and comparison. Appl. Energy 2015, 138, 346–366. [Google Scholar] [CrossRef]
  4. González-García, S.; Bacenetti, J. Exploring the production of bio-energy from wood biomass. Italian case study. Sci. Total Environ. 2019, 647, 158–168. [Google Scholar] [CrossRef] [PubMed]
  5. Moset, V.; Hille, S.; Rubæk, G.H.; Møller, H.B.; Wahid, R.; Baattrup-Pedersen, A. Indicators of biomass and methane yields in vegetated buffer strips. J. Clean. Prod. 2019, 210, 907–915. [Google Scholar] [CrossRef]
  6. Nazimudheen, G.; Sekhar, N.C.; Sunny, A.; Kallingal, A.; Hasanath, B. Physiochemical characterization and thermal kinetics of lignin recovered from sustainable agrowaste for bioenergy applications. Int. J. Hydrog. Energy 2021, 46, 4798–4807. [Google Scholar] [CrossRef]
  7. Isikgor, F.H.; Becer, C.R. Lignocellulosic biomass: A sustainable platform for the production of bio-based chemicals and polymers. Polym. Chem. 2015, 6, 4497–4559. [Google Scholar] [CrossRef]
  8. Patel, M.; Zhang, X.; Kumar, A. Techno-economic and life cycle assessment on lignocellulosic biomass thermochemical conversion technologies: A review. Renew. Sustain. Energy Rev. 2016, 53, 1486–1499. [Google Scholar] [CrossRef]
  9. Tungal, R.; Shende, R.V. Hydrothermal liquefaction of pinewood (Pinus ponderosa) for H2, biocrude and bio-oil generation. Appl. Energy 2014, 134, 401–412. [Google Scholar] [CrossRef]
  10. Srirangan, K.; Akawi, L.; Moo-Young, M.; Chou, C.P. Towards sustainable production of clean energy carriers from biomass resources. Appl. Energy 2012, 100, 172–186. [Google Scholar] [CrossRef]
  11. Goyal, H.B.; Seal, D.; Saxena, R.C. Bio-fuels from thermochemical conversion of renewable resources: A review. Renew. Sustain. Energy Rev. 2008, 12, 504–517. [Google Scholar] [CrossRef]
  12. Fatehi, H.; Weng, W.; Li, Z.; Bai, X.S.; Aldén, M.J.E. Recent Development in Numerical Simulations and Experimental Studies of Biomass Thermochemical Conversion. Energy Fuels 2021, 35, 6940–6963. [Google Scholar] [CrossRef]
  13. Seo, M.W.; Lee, S.H.; Nam, H.; Lee, D.; Tokmurzin, D.; Wang, S.; Park, Y.-K. Recent advances of thermochemical conversion processes for biorefinery. Bioresour. Technol. 2022, 343, 126109. [Google Scholar] [CrossRef]
  14. Yang, M.-H.; Yeh, R.-H. The effects of composition ratios and pressure drops of R245fa/R236fa mixtures on the performance of an organic Rankine cycle system for waste heat recovery. Energy Convers. Manag. 2018, 175, 313–326. [Google Scholar] [CrossRef]
  15. Wang, Y.; Ke, L.; Peng, Y.; Yang, Q.; Du, Z.; Dai, L.; Zhou, N.; Liu, Y.; Fu, G.; Ruan, R.; et al. Characteristics of the catalytic fast pyrolysis of vegetable oil soapstock for hydrocarbon-rich fuel. Energy Convers. Manag. 2020, 213, 112860. [Google Scholar] [CrossRef]
  16. Gosselink, R.J.A. Lignin as a Renewable Aromatic Resource for the Chemical Industry; Wageningen University and Research: Wageningen, The Netherlands, 2011. [Google Scholar]
  17. Li, Z.; Zhong, Z.; Yang, Q.; Ben, H.; Seufitelli, G.V.S.; Resende, F.L.P. Parametric study of catalytic hydropyrolysis of rice husk over a hierarchical micro-mesoporous composite catalyst for production of light alkanes, alkenes, and liquid aromatic hydrocarbons. Fuel 2022, 310, 122457. [Google Scholar] [CrossRef]
  18. Al-asadi, M.; Miskolczi, N.; Eller, Z. Pyrolysis-gasification of wastes plastics for syngas production using metal modified zeolite catalysts under different ratio of nitrogen/oxygen. J. Clean. Prod. 2020, 271, 122186. [Google Scholar] [CrossRef]
  19. Wang, J.; Zhao, B.; Liu, S.; Zhu, D.; Huang, F.; Yang, H.; Guan, H.; Song, A.; Xu, D.; Sun, L.; et al. Catalytic pyrolysis of biomass with Ni/Fe-CaO-based catalysts for hydrogen-rich gas: DFT and experimental study. Energy Convers. Manag. 2022, 254, 115246. [Google Scholar] [CrossRef]
  20. van Duin, A.C.T.; Dasgupta, S.; Lorant, F.; Goddard, W.A. ReaxFF:  A Reactive Force Field for Hydrocarbons. J. Phys. Chem. A 2001, 105, 9396–9409. [Google Scholar] [CrossRef]
  21. Castro-Marcano, F.; van Duin, A.C.T. Comparison of thermal and catalytic cracking of 1-heptene from ReaxFF reactive molecular dynamics simulations. Combust. Flame 2013, 160, 766–775. [Google Scholar] [CrossRef]
  22. Gao, M.; Li, X.; Guo, L. Pyrolysis simulations of Fugu coal by large-scale ReaxFF molecular dynamics. Fuel Process. Technol. 2018, 178, 197–205. [Google Scholar] [CrossRef]
  23. Kwon, H.; Shabnam, S.; van Duin, A.C.T.; Xuan, Y. Numerical simulations of yield-based sooting tendencies of aromatic fuels using ReaxFF molecular dynamics. Fuel 2020, 262, 116545. [Google Scholar] [CrossRef]
  24. Zhang, T.; Li, X.; Qiao, X.; Zheng, M.; Guo, L.; Song, W.-l.; Lin, W.J.E. Initial Mechanisms for an Overall Behavior of Lignin Pyrolysis through Large-Scale ReaxFF Molecular Dynamics Simulations. Fuels 2016, 30, 3140–3150. [Google Scholar] [CrossRef]
  25. Li, H.; Xu, B.; Jin, H.; Luo, K.; Fan, J. Molecular dynamics investigation on the lignin gasification in supercritical water. Fuel Process. Technol. 2019, 192, 203–209. [Google Scholar] [CrossRef]
  26. Han, Y.; Chen, F.; Ma, T.; Gong, H.; Al-Shwafy, K.W.A.; Li, W.; Zhang, J.; Zhang, M.J.I.; Research, E.C. Size Effect of a Ni Nanocatalyst on Supercritical Water Gasification of Lignin by Reactive Molecular Dynamics Simulations. Ind. Eng. Chem. Res. 2019, 58, 23014–23024. [Google Scholar] [CrossRef]
  27. Plimpton, S. Fast Parallel Algorithms for Short-Range Molecular Dynamics. J. Comput. Phys. 1995, 117, 1–19. [Google Scholar] [CrossRef]
  28. Shin, Y.K.; Gai, L.; Raman, S.; van Duin, A.C. Development of a ReaxFF Reactive Force Field for the Pt-Ni Alloy Catalyst. J. Phys. Chem. A 2016, 120, 8044–8055. [Google Scholar] [CrossRef]
  29. Nimz, H. Beech Lignin—Proposal of a Constitutional Scheme. Angew. Chem. Int. Ed. Engl. 1974, 13, 313–321. [Google Scholar] [CrossRef]
  30. Zhang, T.; Li, X.; Guo, L.; Guo, X.J.E. Reaction Mechanisms in Pyrolysis of Hardwood, Softwood, and Kraft Lignin Revealed by ReaxFF MD Simulations. Fuels 2019, 33, 11210–11225. [Google Scholar] [CrossRef]
  31. Li, K.; Khanna, R.; Zhang, H.; Conejo, A.; Ma, S.; Liang, Z.; Li, G.; Barati, M.; Zhang, J. Thermal behaviour, kinetics and mechanisms of CO2 interactions with graphene: An atomic scale reactive molecular dynamic study. Chem. Eng. J. 2021, 425, 131529. [Google Scholar] [CrossRef]
  32. Li, K.; Khanna, R.; Zhang, H.; Ma, S.; Liang, Z.; Li, G.; Barati, M.; Zhang, J. Thermal behaviour during initial stages of graphene oxidation: Implications for reaction kinetics and mechanisms. Chem. Eng. J. 2021, 421, 129742. [Google Scholar] [CrossRef]
  33. Liang, Z.; Khanna, R.; Li, K.; Guo, F.; Ma, Y.; Zhang, H.; Bu, Y.; Bi, Z.; Zhang, J. Impact of oxidants O2, H2O, and CO2 on graphene oxidation: A critical comparison of reaction kinetics and gasification behavior. Chem. Eng. J. 2022, 450, 138045. [Google Scholar] [CrossRef]
  34. Sørensen, M.R.; Voter, A.F. Temperature-accelerated dynamics for simulation of infrequent events. J. Chem. Phys. 2000, 112, 9599–9606. [Google Scholar] [CrossRef]
  35. Shang, Z.; Li, H. Unraveling pyrolysis mechanisms of lignin dimer model compounds: Neural network-based molecular dynamics simulation investigations. Fuel 2024, 357, 129909. [Google Scholar] [CrossRef]
  36. Yu, J.; Dang, Q.; Wu, T.; Wu, Y.; Lei, T.; Qi, F. Catalytic hydropyrolysis of lignin: Insights into the effect of Ni catalyst and hydrogen using ReaxFF molecular dynamics simulation. J. Anal. Appl. Pyrolysis 2023, 175, 106212. [Google Scholar] [CrossRef]
  37. Jiang, C.; Liang, W.; Li, K.; Barati, M.; Conejo, A.; Guo, P.; Danaei, A.; Liang, Z.; Bu, Y.; Zhang, J. A reactive molecular dynamics study of thermal pyrolysis behavior and mechanisms of lignin during the hydrothermal process: The function of the water molecules. Bioresour. Technol. 2023, 368, 128338. [Google Scholar] [CrossRef]
  38. Rismiller, S.C.; Groves, M.M.; Meng, M.; Dong, Y.; Lin, J. Water assisted liquefaction of lignocellulose biomass by ReaxFF based molecular dynamic simulations. Fuel 2018, 215, 835–843. [Google Scholar] [CrossRef]
  39. Lele, A.; Kwon, H.; Ganeshan, K.; Xuan, Y.; van Duin, A.C.T. ReaxFF molecular dynamics study on pyrolysis of bicyclic compounds for aviation fuel. Fuel 2021, 297, 120724. [Google Scholar] [CrossRef]
  40. Castro-Marcano, F.; Russo, M.F.; van Duin, A.C.T.; Mathews, J.P. Pyrolysis of a large-scale molecular model for Illinois no. 6 coal using the ReaxFF reactive force field. J. Anal. Appl. Pyrolysis 2014, 109, 79–89. [Google Scholar] [CrossRef]
  41. Blasi, C.D.; Signorelli, G.; Russo, A.; Rea, G.J.I.; Research, E.C. Product Distribution from Pyrolysis of Wood and Agricultural Residues. Ind. Eng. Chem. Res. 1999, 38, 2216–2224. [Google Scholar] [CrossRef]
  42. Fletcher, T.H.; Kerstein, A.R.; Pugmire, R.J.; Solum, M.S.; Grant, D.M.J.E. Chemical percolation model for devolatilization. 3. Direct use of carbon-13 NMR data to predict effects of coal type. Fuels 1992, 6, 414–431. [Google Scholar] [CrossRef]
  43. Song, Z.; Bai, M.; Yang, Z.; Lei, H.; Qian, M.; Zhao, Y.; Zou, R.; Wang, C.; Huo, E. Gasification of α-O-4 linkage lignin dimer in supercritical water into hydrogen and carbon monoxide: Reactive molecular dynamic simulation study. Fuel 2022, 329, 125387. [Google Scholar] [CrossRef]
  44. Vyazovkin, S.; Burnham, A.K.; Criado, J.M.; Pérez-Maqueda, L.A.; Popescu, C.; Sbirrazzuoli, N. ICTAC Kinetics Committee recommendations for performing kinetic computations on thermal analysis data. Thermochim. Acta 2011, 520, 1–19. [Google Scholar] [CrossRef]
  45. Liu, Z.; Ku, X.; Jin, H. Pyrolysis Mechanism of Wheat Straw Based on ReaxFF Molecular Dynamics Simulations. ACS Omega 2022, 7, 21075–21085. [Google Scholar] [CrossRef] [PubMed]
  46. Oyedun, A.O.; Tee, C.Z.; Hanson, S.; Hui, C.W. Thermogravimetric analysis of the pyrolysis characteristics and kinetics of plastics and biomass blends. Fuel Process. Technol. 2014, 128, 471–481. [Google Scholar] [CrossRef]
  47. Sørum, L.; Grønli, M.G.; Hustad, J.E. Pyrolysis characteristics and kinetics of municipal solid wastes. Fuel 2001, 80, 1217–1227. [Google Scholar] [CrossRef]
  48. Woo Park, J.; Cheon Oh, S.; Pyeong Lee, H.; Taik Kim, H.; Ok Yoo, K. A kinetic analysis of thermal degradation of polymers using a dynamic method. Polym. Degrad. Stab. 2000, 67, 535–540. [Google Scholar] [CrossRef]
  49. Flynn, J.H.; Wall, L.A. General Treatment of the Thermogravimetry of Polymers. Sect. A Phys. Chem. 1966, 70A, 487–523. [Google Scholar] [CrossRef] [PubMed]
  50. Ozawa, T. A New Method of Analyzing Thermogravimetric Data. Bull. Chem. Soc. Jpn 1965, 38, 1881–1886. [Google Scholar] [CrossRef]
  51. Akahira, T.; Sunose, T. Method of determining activation deterioration constant of electrical insulating materials. Res. Rep. Chiba Inst. Technol. 1971, 16, 22–31. [Google Scholar]
  52. Friedman, H.L. Kinetics of thermal degradation of char-forming plastics from thermogravimetry. J. Polym. Sci. Part C Polym. Symp. 2007, 6, 183–195. [Google Scholar] [CrossRef]
Figure 1. Initial structure: (a) system without catalysts; (b) system with catalysts. Three layers of Pt are placed underneath the lignin molecule (C: gray, H: white, O: red, and Pt: blue).
Sustainability 16 03419 g001
Figure 2. Comparison of the gas and tar mass fractions between the ReaxFF MD simulation and the experiment [41].
Sustainability 16 03419 g002
Figure 3. Evolution of char, tar and gas contents: (a) without catalysts, (b) with Pt catalysts.
Sustainability 16 03419 g003
Figure 4. The evolution of gas compositions: (a) without catalysts, (b) with Pt catalysts.
Sustainability 16 03419 g004
Figure 5. Configuration change in the system with catalysts at (a) 300 K; (b) 560 K; (c) 720 K; (d) 840 K; (e) 900 K; (f) 1056 K.
Sustainability 16 03419 g005
Figure 6. Configuration change in the system without catalysts at (a) 300 K; (b) 560 K; (c) 720 K; (d) 840 K; (e) 900 K; (f) 1056 K.
Sustainability 16 03419 g006
Figure 7. (a) The formation process of H2 molecule; (b) the formation process of CO molecule.
Sustainability 16 03419 g007
Figure 8. The adsorption and penetration of H on the Pt catalysts at (a) 1190 K; (b) 1378 K; (c) 1461 K; (d) 1833 K; (e) 2445 K.
Sustainability 16 03419 g008
Figure 9. H density distribution on the Y-axis at (a) 300 K; (b) 1300 K; (c) 1700 K; (d) 2300 K; (e) 3000 K; (f) 4300 K; the dashed line indicates the position of three layers Pt.
Sustainability 16 03419 g009
Figure 10. Comparison of several kinetic calculation methods.
Sustainability 16 03419 g010
Figure 11. Conversion curves at different heating rates (a) without catalysts; (b) with catalysts.
Sustainability 16 03419 g011
Figure 12. The fitting of activation energies at 6 K/ps (a) without catalysts; (b) with catalysts.
Sustainability 16 03419 g012
Disclaimer/Publisher’s Note: The statements, opinions and data contained in all publications are solely those of the individual author(s) and contributor(s) and not of MDPI and/or the editor(s). MDPI and/or the editor(s) disclaim responsibility for any injury to people or property resulting from any ideas, methods, instructions or products referred to in the content.

