Article

Techno-Economic and Environmental Impact of Biomass Co-Firing with Carbon Capture and Storage in Indonesian Power Plants

1
PT. PLN (Persero) Puslitbang Ketenagalistrikan (Research Institute), Jl. PLN Duren Tiga No. 102, Pancoran, Jakarta 12760, Indonesia
2
Department of Mechanical and Industiral Engineering, Gadjah Mada University, Jl. Grafika No. 2, Yogyakarta 55281, Indonesia
*
Author to whom correspondence should be addressed.
Sustainability 2024, 16(8), 3423; https://doi.org/10.3390/su16083423
Submission received: 20 February 2024 / Revised: 29 March 2024 / Accepted: 1 April 2024 / Published: 19 April 2024
(This article belongs to the Section Energy Sustainability)

Abstract

:
This research aims to analyze the techno-economic and environmental aspects of retrofitting carbon capture and storage (CCS) technology on the existing 330 MWe pulverized coal (PC) power plant. Modeling simulations on existing PC and retrofitting PC CCS with variations in biomass co-firing (wood pellet) were carried out using the Integrated Environment Control Model (IECM) version 11.5 software. An amine-based post-combustion capture was used in this study. Coal and biomass co-firing at PC CCS reduce the net power output and thermal efficiency. Carbon neutrality occurs at 10% biomass co-firing on PC CCS. There was a 164% increase in the levelized cost of electricity (LCOE), from 0.0487 USD/kWh on PC to 0.1287 USD/kWh on PC CCS. A sensitivity analysis of fuel prices shows that at a fuel price of 25 USD/t, the LCOE of PC CCS is 0.0953 USD/kWh or higher than Indonesia’s national weighted LCOE of 0.0705 USD/kWh. The LCOE of PC CCS can be lower than the national weighted LCOE when the carbon price is higher than 80 USD/t CO2.

1. Introduction

Climate change, driven by the increase in greenhouse gases (GHGs) like CO2, CH4, NOx and fluorinated gases in the atmosphere, leads to significant environmental impacts, including rising global temperatures, rising sea levels, and a higher frequency of natural disasters such as floods and landslides [1,2,3,4,5]. The greenhouse effect, where these gases trap solar radiation reflected by the Earth’s surface, exacerbates global warming [3,5,6]. CO2, primarily from fossil fuel combustion, accounts for 60% of GHG emissions, with CH4 contributing around 18% [7,8]. The majority of CO2 emissions stem from power generation, which produced approximately 14.65 Gt CO2 from 28,000 TWh of electricity in 2022 [8,9,10,11]. The world’s sources of power generation include coal (35%), natural gas (22%), hydro (15%), and nuclear (9%), with renewables making up the remainder. Notably, coal’s share in power generation has slightly decreased globally from 38% in 2000 to 35% in 2022 [12,13]. However, in Indonesia, coal usage in power production has surged from 39% in 2010 to 66% in 2022, leading to an increase in CO2 emissions from the power sector—from 117 million tons in 2011 to 206 million tons in 2022 [14,15].
Implementing renewable energy sources like biomass can significantly reduce GHG emissions, as biomass captures CO2 during its growth and releases it upon combustion [16]. Various forms of biomass, such as wood waste, paper waste, refuse-derived fuel (RDF), wood chips, straw, sawdust, wood pellets, palm oil, and rice husk, are viable for energy production [16,17,18,19]. Biomass utilization primarily occurs through gasification or combustion, including co-firing, where biomass is burned alongside traditional fuels like coal, oil, or natural gas in power plants [20,21].
Biomass co-firing can be implemented through direct, indirect, and parallel methods. Direct co-firing, the simplest and most cost-effective approach, involves burning multiple fuels simultaneously in one boiler. Indirect co-firing employs separate boilers for each fuel type, with the biomass-generated hot flue gas used to produce steam in another boiler. Parallel co-firing also uses separate boilers for different fuels, but the steam from each boiler is merged before powering the turbine. This flexibility in methods facilitates the integration of biomass as a renewable energy source in power generation, enhancing sustainability efforts [17,20].
Biomass co-firing has been effectively adopted across the European Union in a variety of boiler types, including pulverized coal (PC), circulating fluidized bed (CFB), bubbling fluidized bed (BFB), and stoker boilers. In nations such as Austria, Denmark, Germany, the Netherlands, the UK, and Poland, biomass co-firing in PC boilers is implemented within a 3–20% heat contribution range for PCs with capacities between 125 and 350 MWe [17,22]. However, in Indonesia, experiments with biomass co-firing (using sawdust and rice husk) at 5% heat in PCs with varying CFPP capacities (100 MWe, 300 MWe, and 600 MWe) have indicated a reduction in PC efficiency, attributed to the lower caloric value of the fuel affecting combustion [23,24]. Additionally, employing wood pellets and sawdust for 5% heat co-firing in a 315 MWe PC boiler demonstrated a decrease in furnace exit gas temperature (FEGT) [25,26]. Furthermore, co-firing with biomass wood pellets at 1%, 3%, and 5% heat in a 330 MWe PC boiler resulted in lowered emissions of CO, NOx, and SOx, showcasing the environmental benefits of integrating biomass into traditional coal-fired energy production processes [27]. These outcomes underline biomass co-firing’s potential to reduce GHG emissions and improve air quality while highlighting its influence on combustion efficiency and emission reduction.
Carbon capture and storage (CCS) technology is crucial for reducing CO2 emissions from fossil fuel power plants, allowing them to continue operations without compromising CO2 emission reduction targets for climate change [28]. The global capacity for CCS has seen significant growth: from 85 million tons (Mt) of CO2 per year in 2019 to 110 Mt CO2/year in 2020, reaching 149 Mt CO2/year by 2021 [29,30,31]. Power generation projects, especially in the Americas and Europe, contribute the largest share to the global CO2 capture capacity, accounting for 37% of the annual global total with a capacity of 62.5 Mt CO2/year as of September 2021 [32]. CCS technology encompasses various methods, including direct air capture, post-combustion, pre-combustion, oxy-combustion, and chemical looping. Post-combustion CCS, in particular, showcases high CO2 absorption efficiency (80–90%), offers considerable flexibility for retrofitting existing CFPPs, and has been commercially demonstrated on a small scale [33,34,35]. The technology readiness level (TRL) for post-combustion amines stands at nine, indicating it is at the demonstration stage [28,32]. Among the CO2 separation methods—membrane, adsorption, cryogenic, chemical looping, and absorption—the chemical absorption process using monoethanolamine (MEA) is noted for its high absorption rate and cost-effectiveness, making it a viable solution for reducing greenhouse gas emissions in power generation and contributing to global efforts to combat climate change [33,34,36,37].
The Boundary Dam and Petra Nova projects represent two pioneering commercial applications of CCS technology at coal-fired power plants (CFPPs). The Boundary Dam’s Unit 3 project, spearheaded by SaskPower in 2014, is noteworthy as the world’s first integrated CCS project on a CFPP, achieving a 90% availability factor by 2019 [38,39,40]. The simulation of the CCS application demonstrated the potential to reduce CO2 emissions from 0.739 kg/kWh with existing PC using Russian coal to 0.0983 kg/kWh when retrofitted with amine-based CCS technology. Similarly, for biomass fuels like wood pellets, CO2 emissions can be reduced from 0.8775 kg/kWh to 0.1250 kg/kWh with CCS retrofitting. However, the adoption of CCS technology entails a significant increase in capital costs by 40–50% over traditional PC technology, which also leads to a rise in the levelized cost of electricity (LCOE) [41].
Both coal and biomass fuels exhibit a decrease in thermal efficiency upon integrating CCS in post-combustion PC power plants [41,42,43]. Economic analyses, including scenarios with 10% biomass co-firing with and without post-combustion CCS using MEA solvent, reveal that biomass co-firing with CCS incurs higher LCOE compared to conventional plants. Nevertheless, incentives such as carbon taxes and renewable energy certificates can mitigate the LCOE increase by about 10% in CCS-equipped CFPPs [43]. A specific study focusing on a 2 × 1000 MW ultra-supercritical PC in North West Java, Indonesia, with MEA solvent-based CCS, highlighted a 27.5% decrease in power output and a 50% rise in investment costs compared to the base plant, doubling the LCOE from 0.07 USD/kWh to 0.154 USD/kWh. Despite these economic challenges, the North West Java Basin exhibits significant CO2 storage potential, underscoring the region’s strategic importance for CCS deployment [44,45].
This study investigates the application of biomass co-firing, both with and without post-combustion CCS technology, in existing PC power plants in Indonesia, employing technological, economical, and environmental analyses. It aims to demonstrate the sustainable and economic advantages of leveraging energy and technology to reduce emissions. The research highlights the potential benefits of integrating biomass co-firing and CCS technologies in the context of strong governmental policy support, showcasing a path toward enhanced sustainability and economic efficiency in the energy sector. This research also offers to play a pivotal role in advancing toward carbon neutrality or even achieving negative CO2 emissions. This approach is instrumental in fostering sustainable development that is in harmony with environmental preservation. By integrating biomass as a renewable energy source with CCS technologies, significant reductions in CO2 emissions from power generation can be realized, contributing to the global efforts to mitigate climate change.

2. Materials and Methods

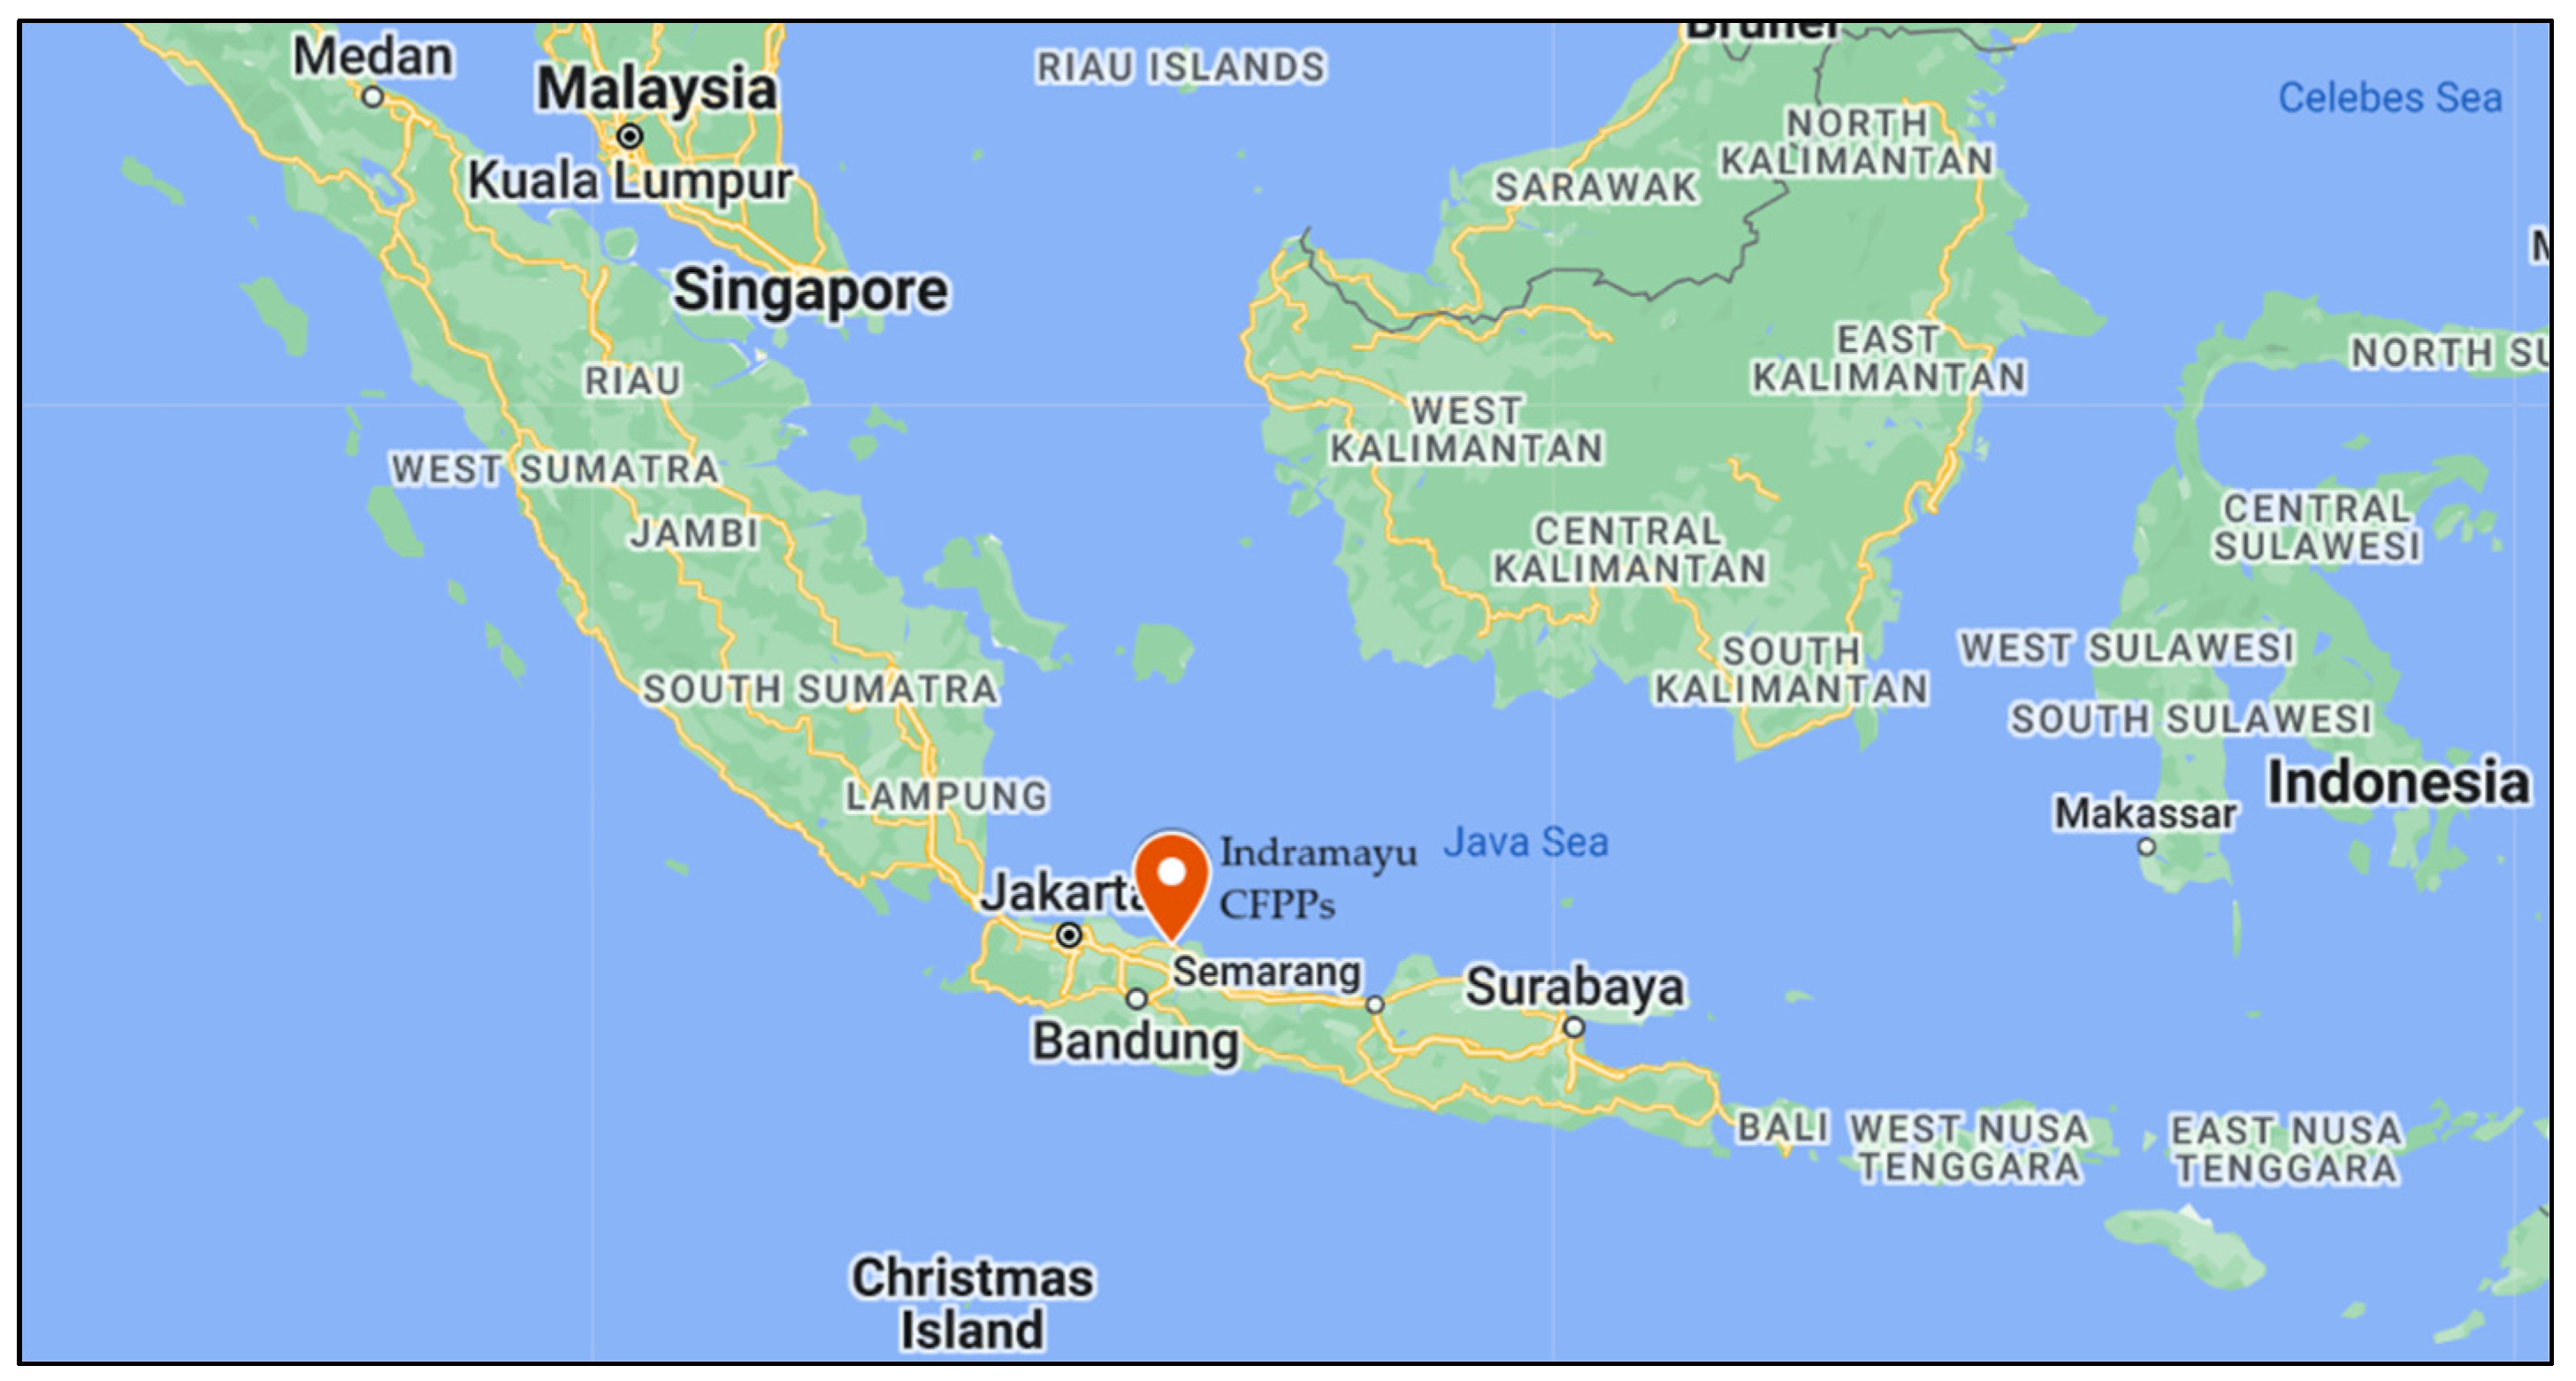
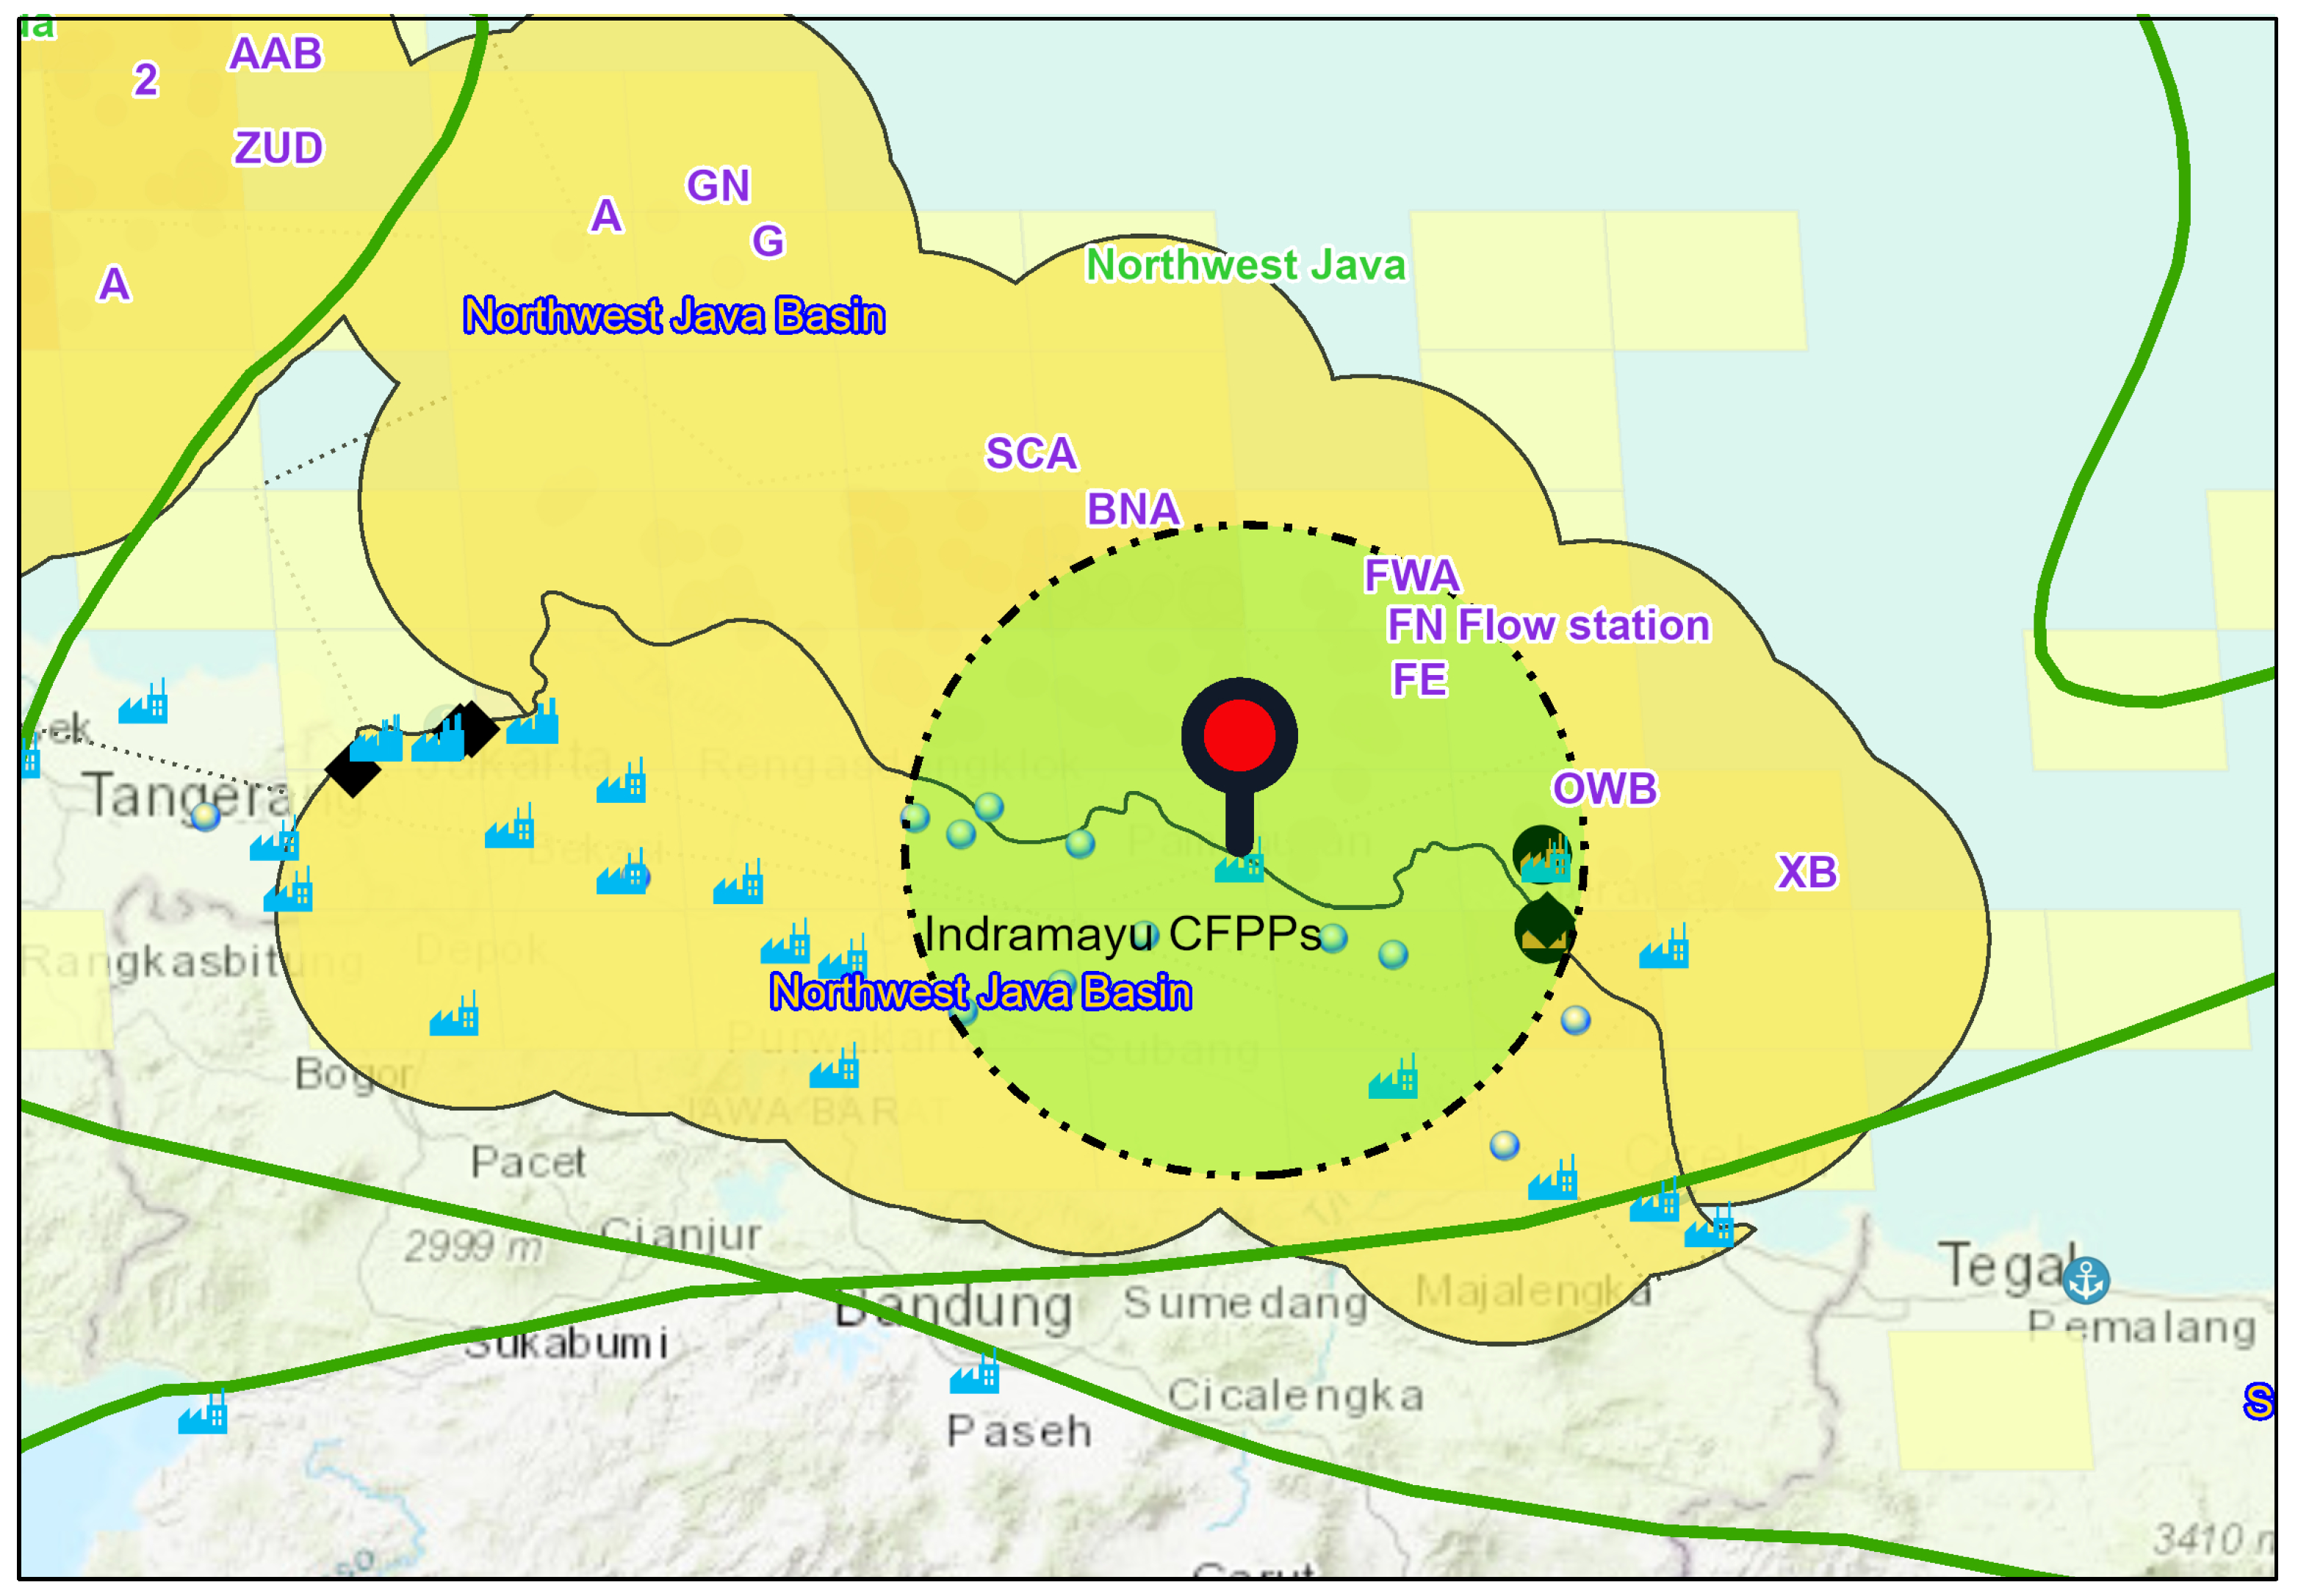
2.1. Study Case Description

This research focuses on the Indramayu CFPPs in Indonesia as a case study for retrofitting with CCS technology. Situated approximately 150 km from Jakarta (shown in Figure 1), the Indramayu CFPPs, with their 3 × 330 MWe capacity, are pivotal electricity producers within the Java–Bali power system, employing Chinese technology. Operational since 2011, these power plants utilize PC boiler technology and operate within the subcritical range using sub-bituminous coal [46]. In 2022, the Indramayu plants generated 6 TWh of electricity from over 3.6 million tons of coal. Each unit is designed for a capacity of 330 MWe (gross) and operates with a gross plant heat rate of 2114 kCal/kWh.
To address air emissions, the plants are equipped with high-efficiency electrostatic precipitators (ESP), ensuring low emission levels due to the coal’s low sulfur content (less than 0.23%), which keeps SO2 emissions under 600 mg/m3. The use of low NOx burners further ensures that NOx emission concentrations remain below 450 ppm. The location of the Indramayu CFPPs, within the North West Java Basin (shown in Figure 2), is also strategic, given the region’s abundance of oil and gas wells, both onshore and offshore, which highlights the potential for CO2 storage. This setting provides a unique opportunity for examining the viability and impacts of implementing CCS technology in a real-world scenario, underlining the relevance of the case study for enhancing sustainable energy practices.

2.2. Emission Regulation in Indonesia

Prior to 2019, the emission standards for CFPPs set by the Ministry of Environment and Forestry of the Republic of Indonesia were relatively lenient, specifying limits of SO2 emissions below 550 mg/Nm3 and NOx emissions below 550 mg/Nm3, with no established limits for CO2 emissions. Following the enactment of new regulations after 2019, these requirements have become more stringent, reducing the allowable levels of SO2 and NOx to below 200 mg/Nm3 each. Despite these tighter restrictions for sulfur dioxide and nitrogen oxides, the regulations continue to lack specific limits for carbon dioxide emissions [49].

2.3. Retrofitting Post-Combustion CCS Technology

The technical model for integrating CCS technology into existing CFPPs comprises several key components, including a boiler, selective catalytic reduction (SCR), electrostatic precipitator (ESP), and flue gas desulfurization (FGD) device. This setup, depicted in the provided figure, outlines both the existing infrastructure and the additional (retrofitting) components required for CCS implementation as shown in Figure 3. The inclusion of SCR and FGD units is essential for significantly reducing NOx and sulfur emissions, respectively, before the CO2 capture process begins. The SCR unit serves to convert NOx into nitrogen and water through a reaction with a catalyst, while the FGD unit removes sulfur dioxide (SO2) from the flue gas. These pre-treatment steps are critical for ensuring that the CO2 capture process is both efficient and effective, allowing the plant to meet more stringent emission standards and contribute to environmental sustainability. This comprehensive approach reflects a systematic effort to address various pollutants, enhancing the overall emission control strategy of CFPPs in the context of CCS retrofitting [44].

2.3.1. Selective Catalytic Reduction (SCR)

This SCR is located before the ESP, so it is called hot-SCR. This hot-SCR uses NH3 or ammonia as a catalyst and has a maximum capacity of NOx removal efficiency of 90%. This SCR requires steam, resulting in a decrease in the capacity of the main steam entering the steam turbine and causing derating [50].

2.3.2. Flue Gas Desulphurization (FGD)

The wet FGD used in this study uses limestone as a reagent. The maximum SO2 removal efficiency value is 98% [50].

2.3.3. Carbon Capture and Storage (CCS)

Amine-based post-combustion CO2 capture was used in this study. The simplest amine is MEA (monoethanolamine), which is well-proven commercially as a reagent for CO2 capture in many commercial installations around the world [51]. The maximum CO2 removal efficiency value is 90%. This technology uses steam, causing net power derating. CO2 is sent 50 km to the offshore North West Java Basin for enhanced oil recovery (EOR). This can be seen in Figure 2 marked with a circle area from the location of the PC power plants [50]. There are 74 fields in the North West Java Basin with this pipe distance. CO2 can be used in enhanced oil recovery (EOR) to increase oil and gas production. In this pipeline radius, the CO2 requirement for EOR is estimated to be more than 181 million tons of CO2 [45]. Studies show the potential CO2 storage capacity in the North West Java Basin is 171 million metric CO2 onshore and 224 million metric CO2 offshore [52,53]. This research uses offshore storage of CO2 with a capacity of 2–3 million tons of CO2/year with three wells (assuming a capacity of 1 million tons of CO2/year) with a depth of 1140 m [44].

2.4. Integrated System Approach for Techno-Economic Assessment

The Integrated Environment Control Model (IECM) software, developed by Carnegie Mellon University in collaboration with the National Energy Technology Laboratory (NETL) of the US Department of Energy, serves as a pivotal tool for simulating and conducting techno-economic analyses of emission control technologies in fossil fuel power plants [54]. It is specifically designed to assess the impact and viability of various environmental control strategies within natural gas combined cycle, integrated gasification combined cycle, and PC power plants. Furthermore, IECM has been effectively utilized in research focusing on biomass co-firing, enabling comprehensive evaluations of performance, economic, and environmental outcomes [50,55].
The extensive application and validation of IECM in scholarly research underscore its credibility and utility in the field. By employing IECM version 11.5, the current public 64-bit version, this research benefits from a robust and validated framework for modeling CCS alongside traditional PC technologies. This approach facilitates a detailed understanding of the potential environmental and economic benefits of integrating CCS and biomass co-firing in existing power generation infrastructures, supporting the development of sustainable energy solutions [41,56,57,58].
The economic evaluation within this simulation leverages the Integrated Environment Control Model (IECM) database and methodologies, specifically tailored for a Southeast Asian context, with Indonesia as the focal point. Economic analyses are calibrated to 2020 US dollars for consistency and relevance [54]. The Total Capital Requirement (TCR) encapsulates a comprehensive suite of capital expenses, including overnight, engineering, contingency, and financing costs [59,60]. Given the use of Chinese technology in the studied PC power plant, an adjustment factor of 0.4 is applied within IECM’s framework to accurately estimate capital costs [61]. This factor reflects the local versus default value ratio for construction, material, and labor costs, while construction labor requirements and seismic considerations adhere to specific adjustments of 1874 and 1, respectively. The economic assumptions underlying the simulation are meticulously detailed, incorporating fuel prices adhering to the Cost, Insurance, and Freight (CIF) standard. Table 1 shows the detailed assumptions of the simulation.
This study’s scope extends to evaluating the impacts of biomass co-firing and the integration of post-combustion CCS technology on plant performance, including net power output and overall efficiency (based on high heating value/HHV). From an environmental perspective, the focus is on the effects of implementing biomass co-firing, both with and without post-combustion CCS, on CO2 emissions.
Economically, the analysis hinges on several critical cost metrics: the LCOE, the incremental cost associated with CCS technology, and the cost of CO2 avoided. This comprehensive approach aims to not only assess the technical feasibility of such interventions but also to scrutinize their economic and environmental implications, offering a rounded perspective on the potential benefits and challenges of adopting sustainable energy technologies in the Indonesian context.

2.5. Simulation Assumptions and Scenarios

In this study (as shown in Table 1), a PC power plant with a maximum gross output of 330 MWe, equipped with a main steam boiler capable of producing up to 969 tons/hour (t/h), serves as the baseline for evaluating the impact of retrofitting CCS technology. The introduction of CCS necessitates the use of steam and auxiliary power, resulting in a reduction in the plant’s gross power output due to the upper limit on steam generation capacity. The costs associated with CO2 transportation and storage are carefully considered, with values adjusted to their 2020 USD equivalent for accuracy.
The calorific values (HHV) of the fuels used—sub-bituminous coal at 4894 kilocalories per kilogram (kcal/kg) as received (AR) and wood pellets at 4487 kcal/kg AR—indicate that wood pellets have a slightly lower energy content compared to coal. This distinction is critical for understanding the trade-offs involved in incorporating biomass co-firing into the power generation mix. Comprehensive data on the specific properties of sub-bituminous coal and wood pellets are detailed in Appendix A Table A1.
Table 2 shows the scenarios exploring the effects of biomass co-firing with varying proportions of wood pellets—0% (100% coal), 5%, 10%, and 20% WP. They are systematically analyzed to assess their impact on the existing PC infrastructure and the implications of integrating PC CCS technology. These scenarios aim to provide insights into the operational, environmental, and economic nuances of adopting biomass co-firing and CCS technologies in coal-fired power generation.

3. Results

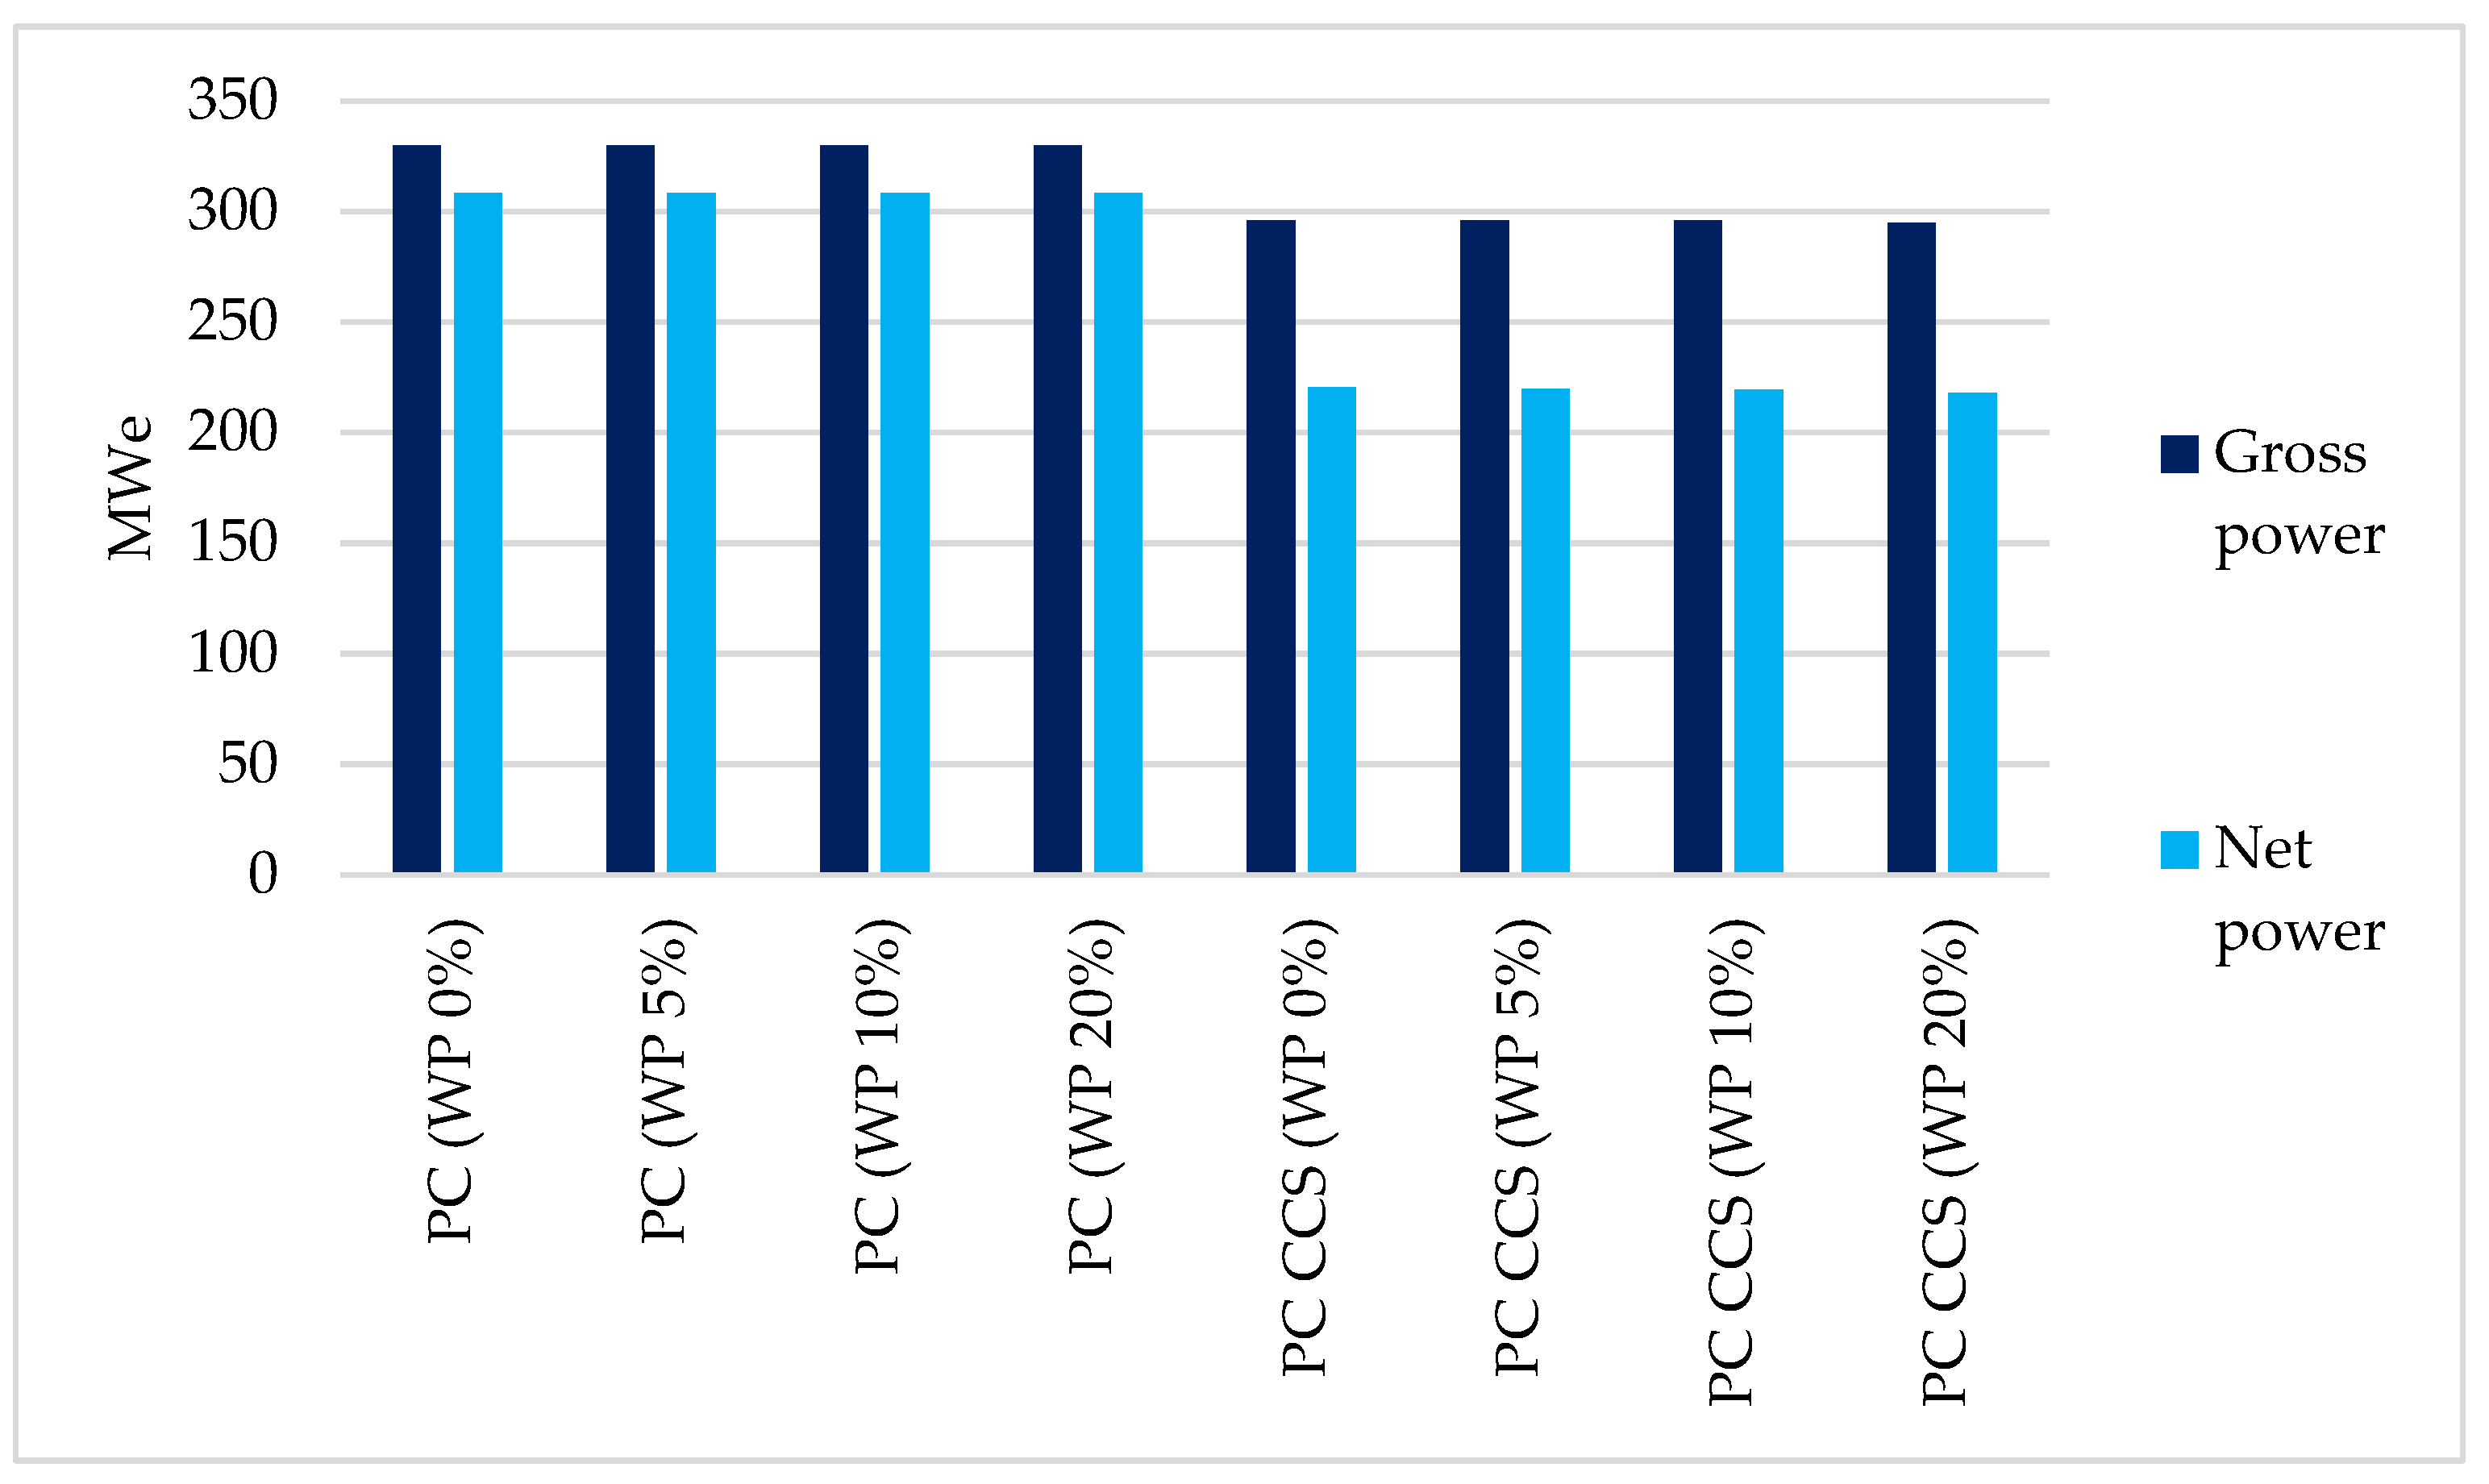
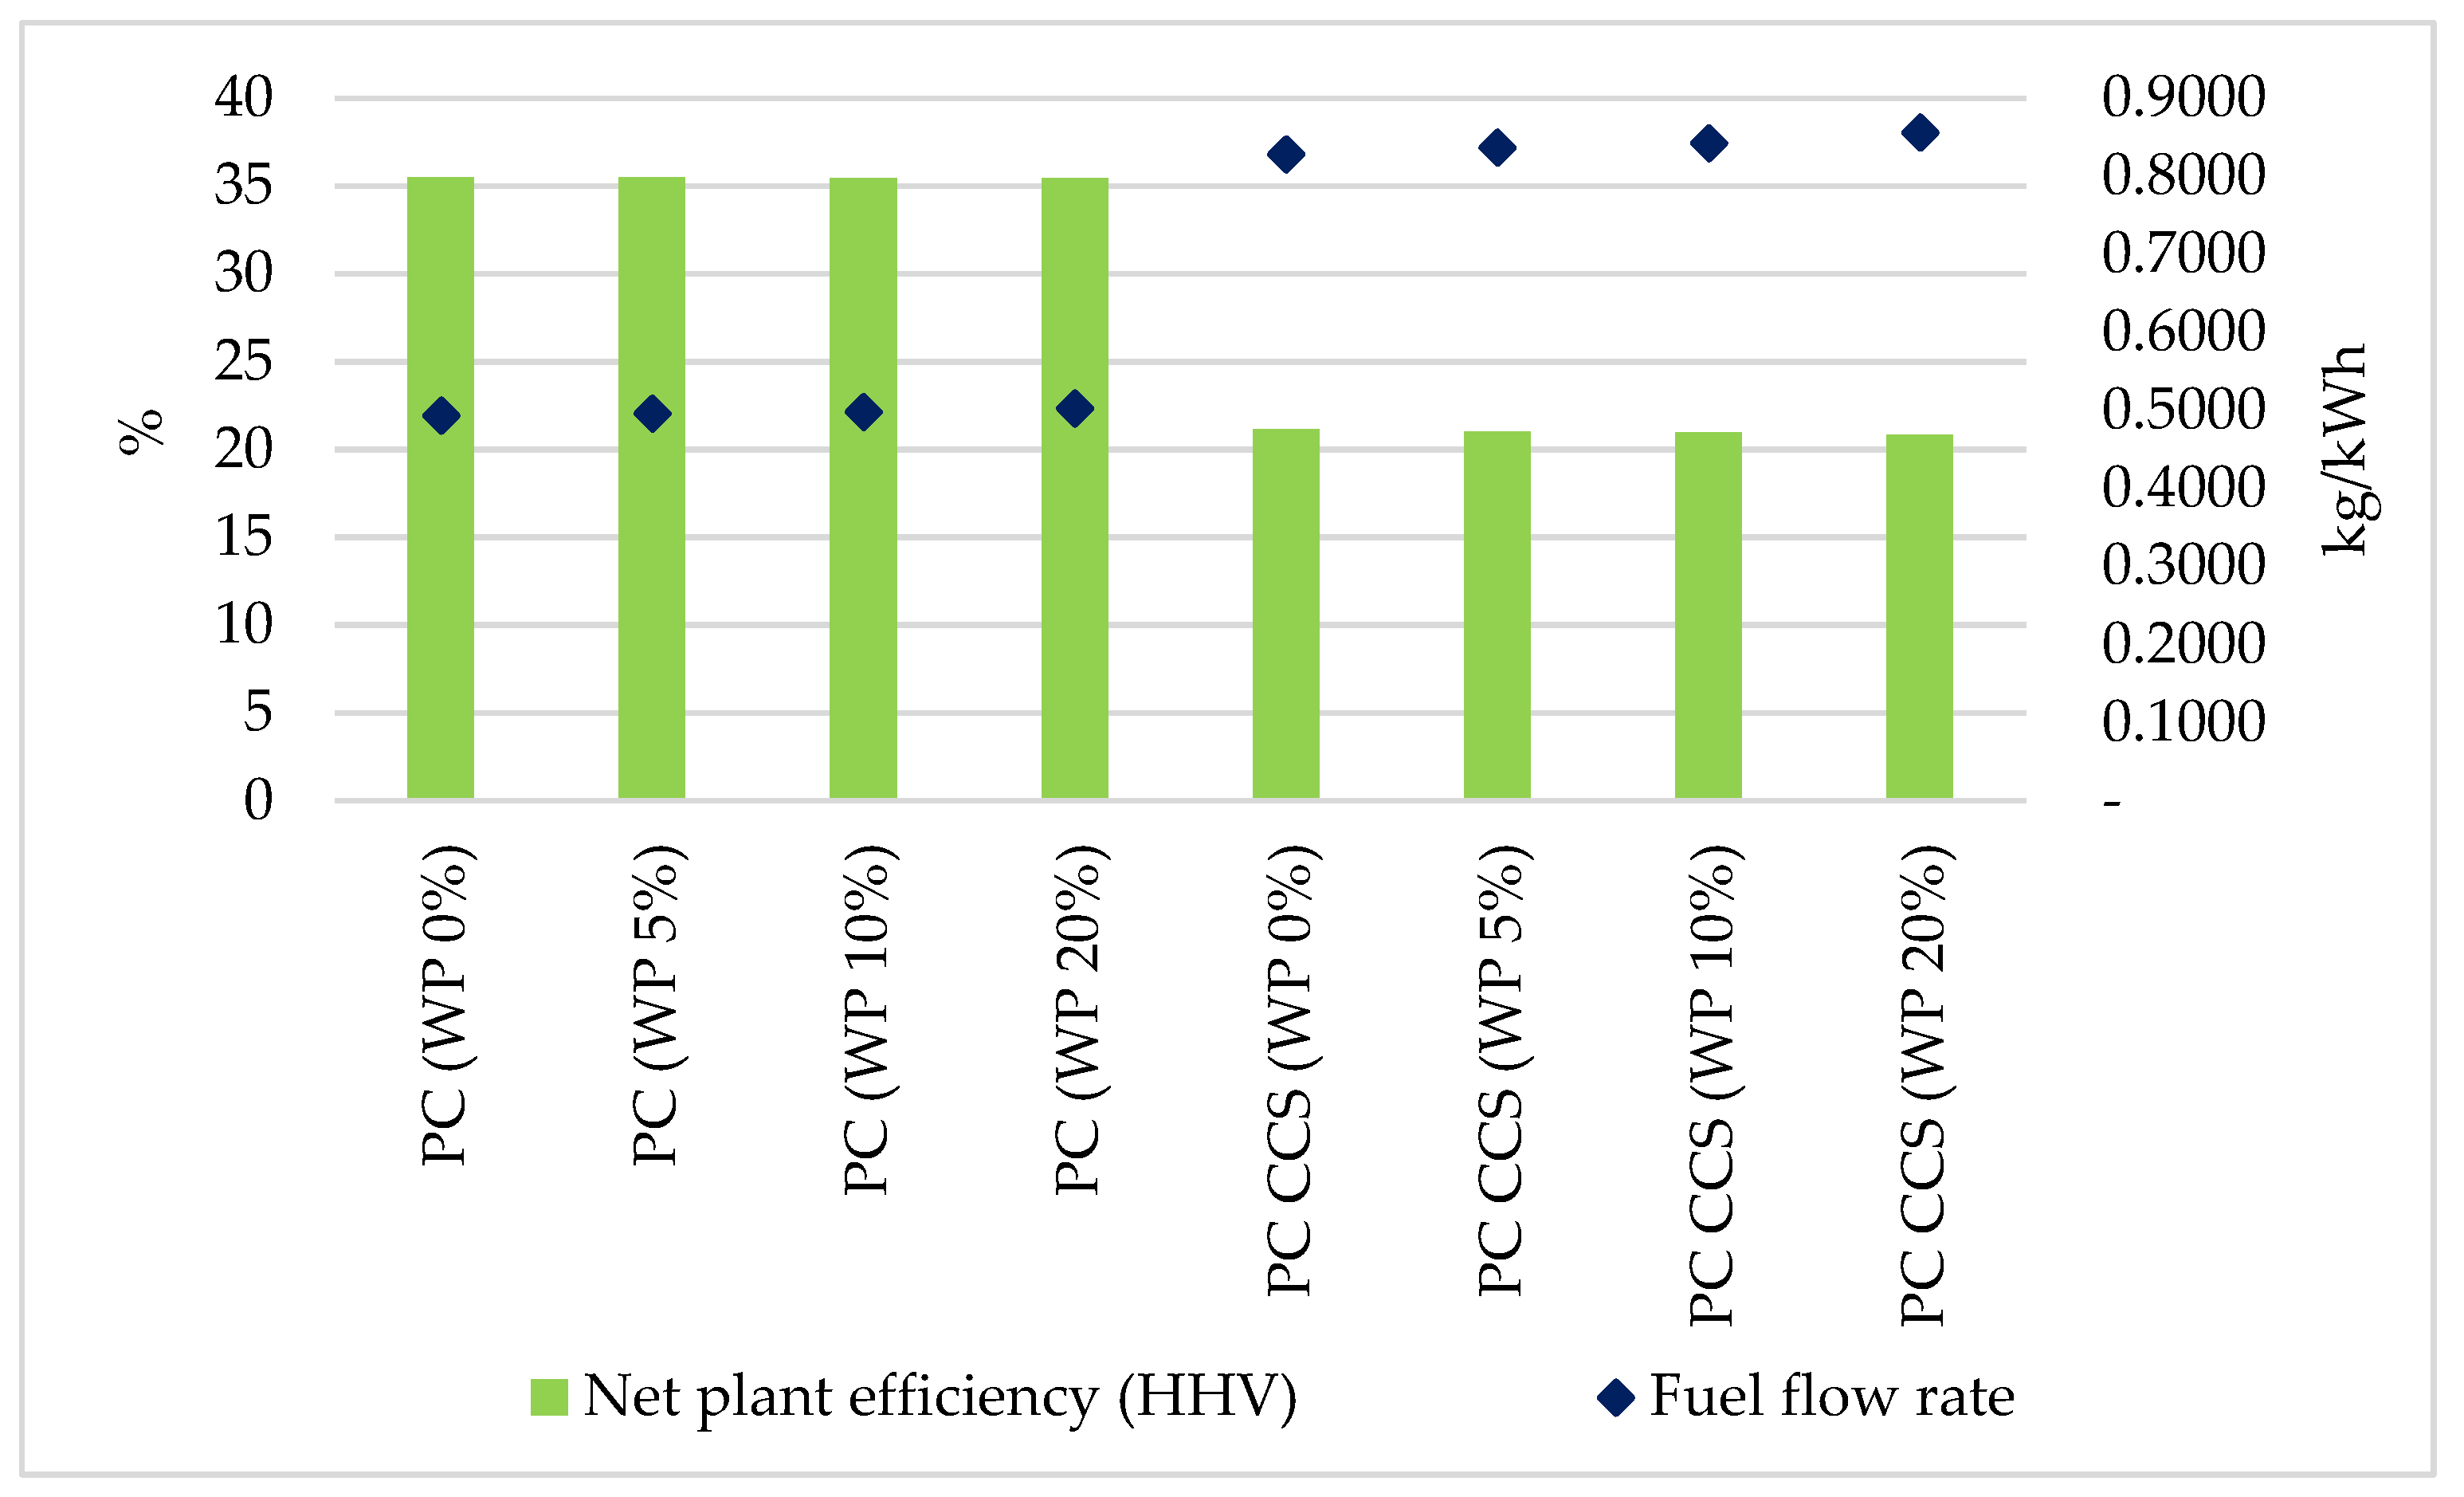
3.1. Effect of CCS on the Plant Energy Performance

Incorporating biomass co-firing into existing PC power plants, specifically at levels of 5%, 10%, and 20% by weight of wood pellets (WP), maintains the gross power output at 330 MWe and a net power of 308.5 MWe, aligning with the performance of conventional coal-fired setups. The calorific value of wood pellets is relatively similar to that of coal, which means there is not a significant difference in the energy conversion efficiency when using biomass co-firing in the boiler. This similarity allows for the seamless integration of wood pellets as a co-firing material without notably impacting the boiler’s overall energy conversion process.
However, retrofitting these plants with post-combustion CCS technology results in a notable reduction in both gross and net power outputs, regardless of the fuel mix. For plants utilizing coal exclusively, the introduction of CCS technology reduces the gross power output to 296 MWe and net power to 220.6 MWe. A similar decrease is observed with biomass co-firing: 5% WP leads to gross and net powers of 296 MWe and 219.7 MWe, respectively; 10% WP results in 296 MWe gross and 219.5 MWe net; and 20% WP decreases further to 295 MWe gross and 217.8 MWe net. These results are shown in Figure 4.
This reduction in power output is primarily due to the additional auxiliary power demands of CCS technology, including selective catalytic reduction (SCR), flue gas desulfurization (FGD), and amine-based post-combustion carbon capture systems. Specifically, the diversion of steam to SCR and carbon capture processes diminishes the steam availability for the turbine, leading to power derating. These findings highlight the trade-offs between reducing carbon emissions through CCS and maintaining power output levels in biomass co-firing and coal-based power generation scenarios.
Figure 5 illustrates a marked decrease in net plant efficiency following the retrofitting of CCS technology. Initially (at existing PC condition), the efficiency rates for the power plant using coal and various levels of biomass co-firing (5%, 10%, and 20% wood pellets, WP) are closely aligned, with coal at 35.49%, 5% WP at 35.48%, 10% WP at 35.47%, and 20% WP at 35.45%. The minor differences in fuel properties and the slightly increased fuel flow required for biomass co-firing contribute to a small drop in efficiency.
However, with the introduction of CCS technology to the plant, net efficiency significantly declines across all fuel types: down to 21.13% for coal, 21.02% for 5% WP, 20.97% for 10% WP, and 20.81% for 20% WP. This substantial reduction in efficiency is primarily due to the additional electrical energy and steam needed to operate the selective catalytic reduction (SCR), flue gas desulfurization (FGD), and CCS technologies. Additionally, the variance in calorific value between the original coal and the biomass used exacerbates the efficiency loss, highlighting the energy-costly nature of implementing CCS in efforts to reduce carbon emissions from coal-fired power plants.

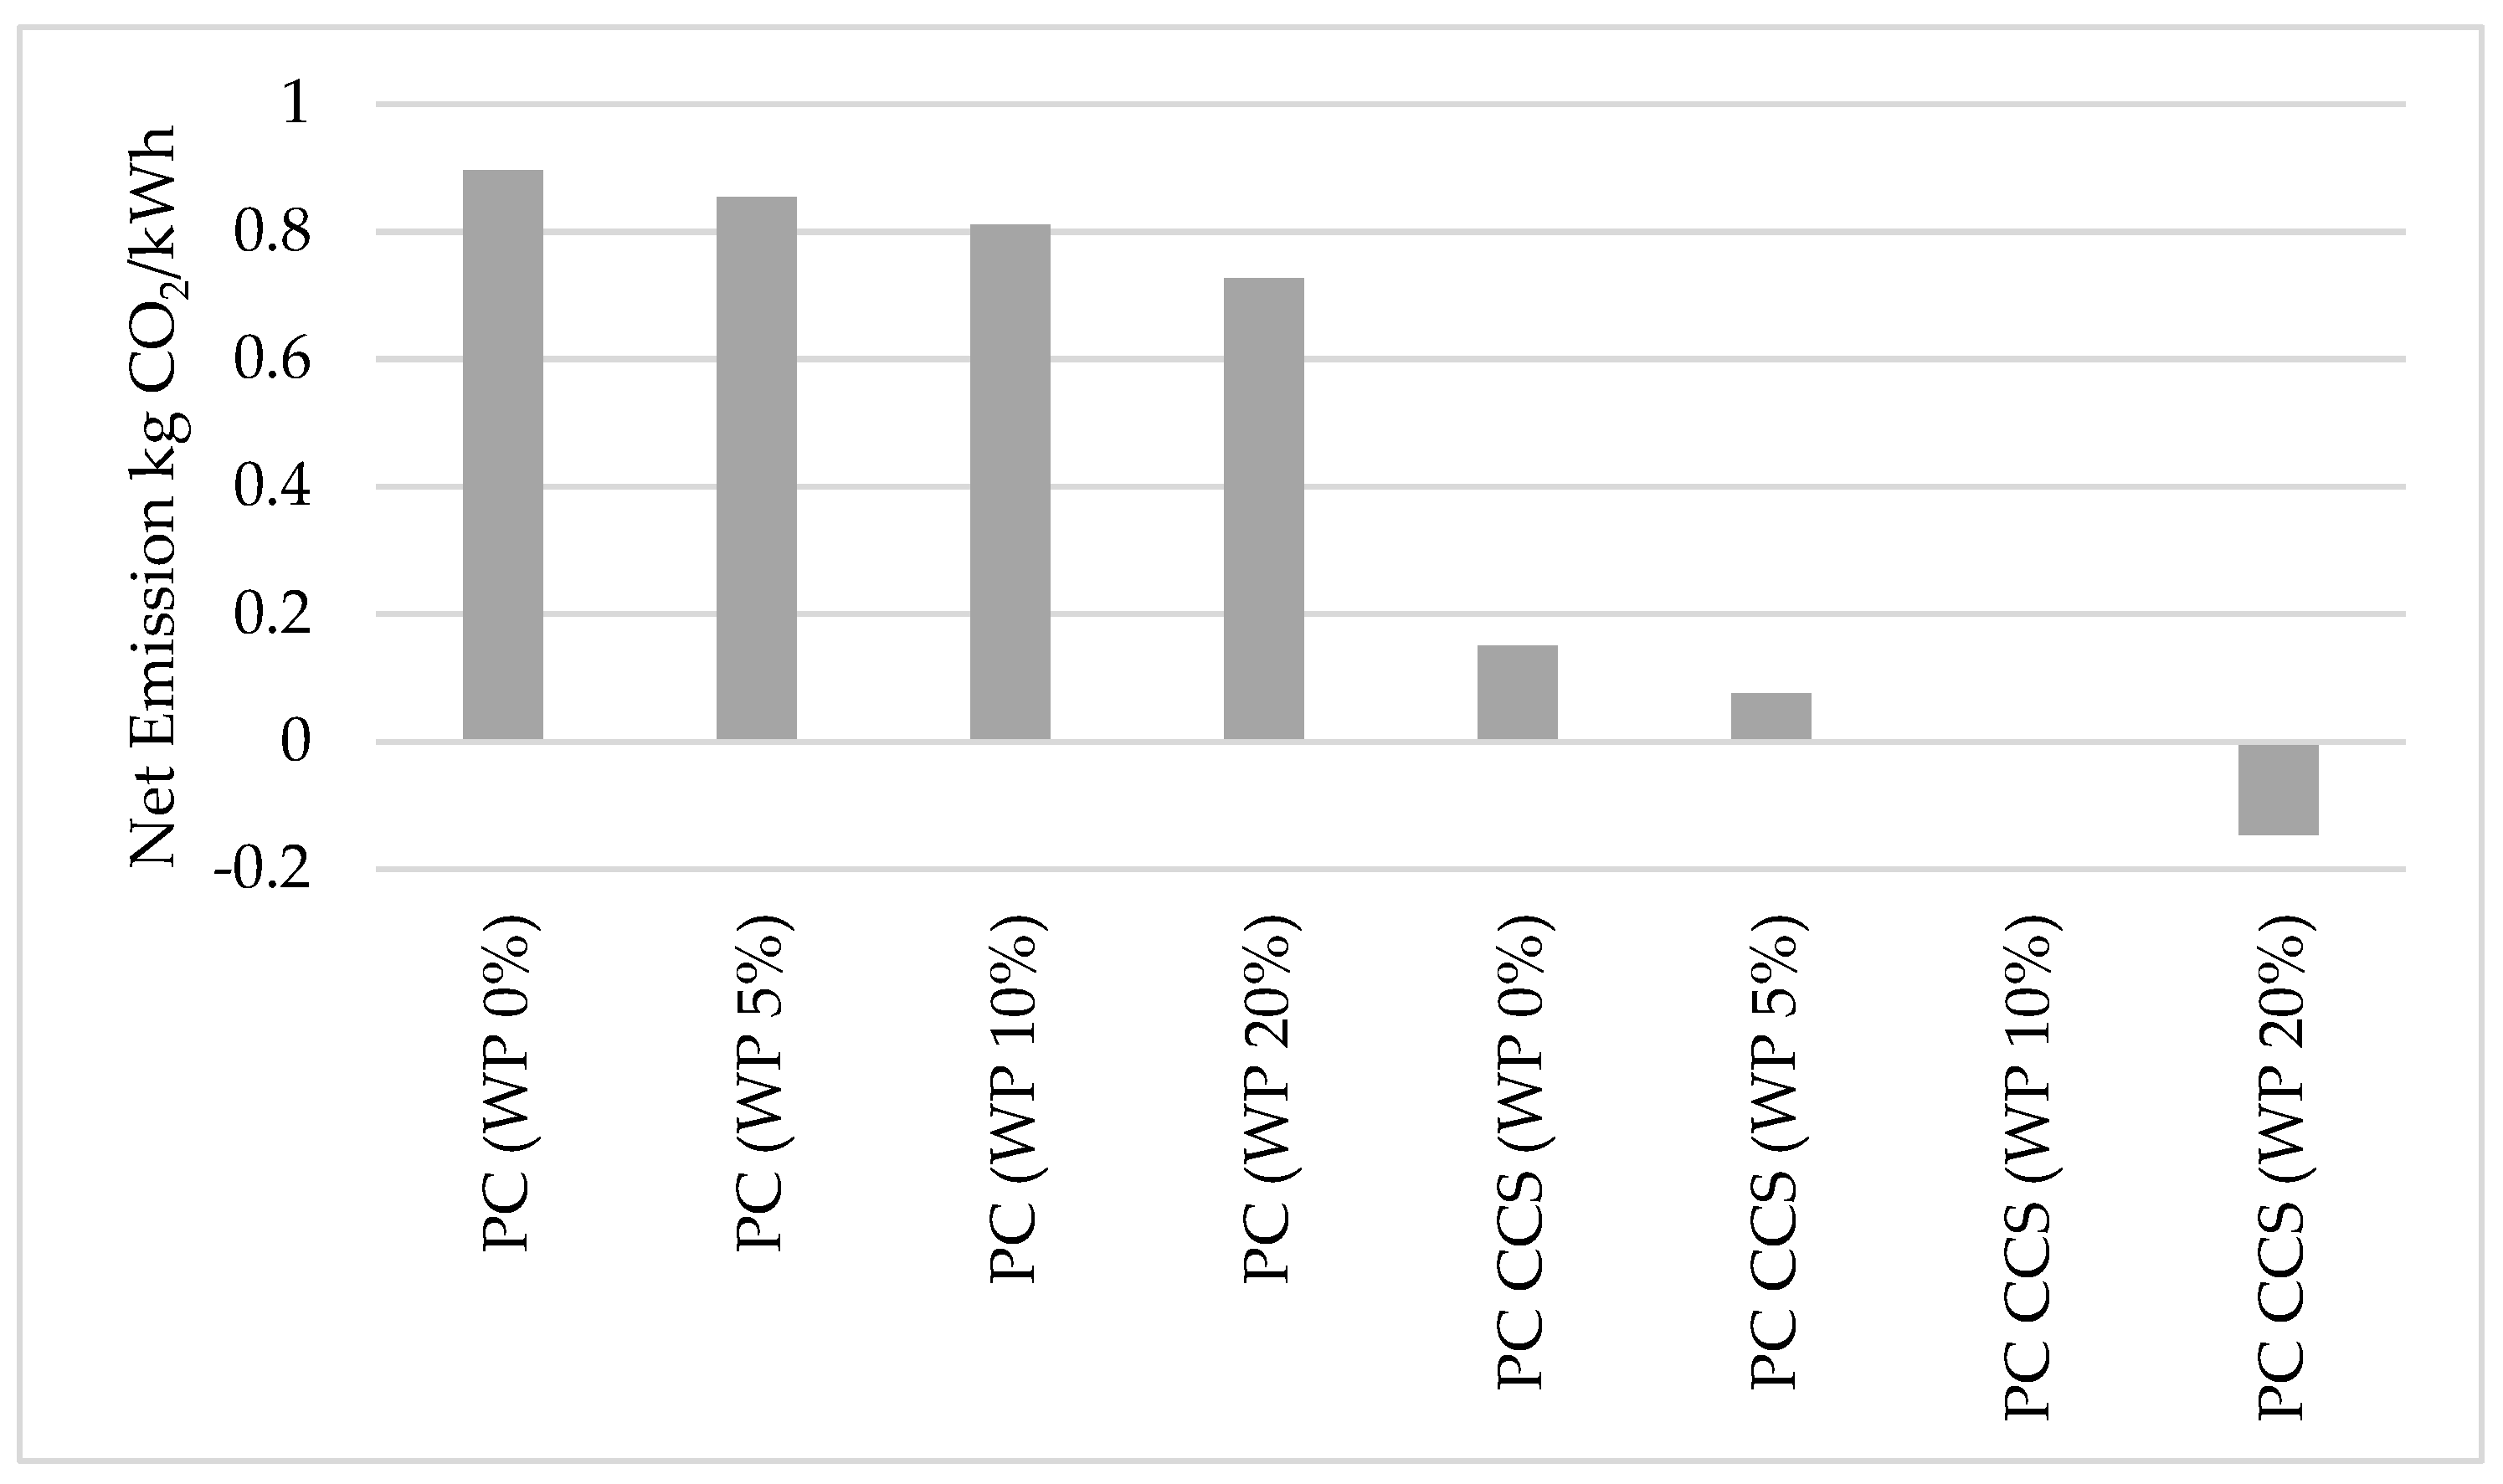
3.2. Effect of CCS on the Plant Emission

Net   emission   of   CO 2 = ( CO 2 ) ref CO 2 bio red ( CO 2 ) captured
As shown in Equation (1), the calculation of CO2 emissions from combustion in a furnace, designated as CO2 ref (kg CO2/kWh), is crucial for evaluating the environmental impact of different fuels used in PC power plants. When coal is the sole fuel, the net emission of CO2 is equivalent to CO2 ref, reflecting the direct emissions from coal combustion.
Incorporating biomass co-firing into the energy mix offers a path to reduce these net emissions. The rationale is that CO2 emissions from biomass combustion are considered to be offset by the CO2 absorbed during the biomass growth and processing stages. Consequently, emissions attributed to biomass are deducted from the total when calculating net CO2 emissions, underpinning the environmental advantage of biomass co-firing.
For PC power plants retrofitted with CCS technology, the net CO2 emissions decrease further. This reduction is twofold: firstly, due to the inherent reduction associated with biomass co-firing, as mentioned, and secondly, due to the capture of CO2 emissions facilitated by CCS technology. The combined effect of biomass co-firing and CO2 capture results in significantly lower net emissions, demonstrating a synergistic approach to mitigating the carbon footprint of electricity generation. This interaction is encapsulated in Equation (1), which mathematically models the reduction in net CO2 emissions achievable through the integration of biomass co-firing and CCS technologies in PC power plants.
Figure 6 demonstrates a clear trend where the net CO2 emissions from a PC power plant decrease progressively with the increased incorporation of biomass co-firing. In the original setup using only coal, the net CO2 emissions stand at 0.896 kg/kWh. Incorporating 5% wood pellets (WP) reduces this figure to 0.854 kg/kWh, 10% WP further lowers it to 0.811 kg/kWh, and with 20% WP, the emissions drop significantly to 0.727 kg/kWh. This reduction is attributed to the consideration of biomass emissions as effectively neutral, due to the CO2 absorbed during the growth and processing of the biomass, which is then offset against the emissions from combustion.
When CCS technology is integrated into the plant (PC CCS), the reductions in net CO2 emissions become even more pronounced. For coal, the net emissions are dramatically reduced to 0.151 kg/kWh. With biomass co-firing, the figures are even lower: 0.076 kg/kWh for 5% WP, a negligible 0.001 kg/kWh for 10% WP, and remarkably, −0.147 kg/kWh for 20% WP, indicating negative net emissions. The results for 10% WP co-firing suggest that it is possible to achieve carbon neutrality, where the net CO2 emissions are virtually zero, highlighting the potential of biomass co-firing coupled with CCS technology to significantly mitigate the carbon footprint of coal-fired power generation.

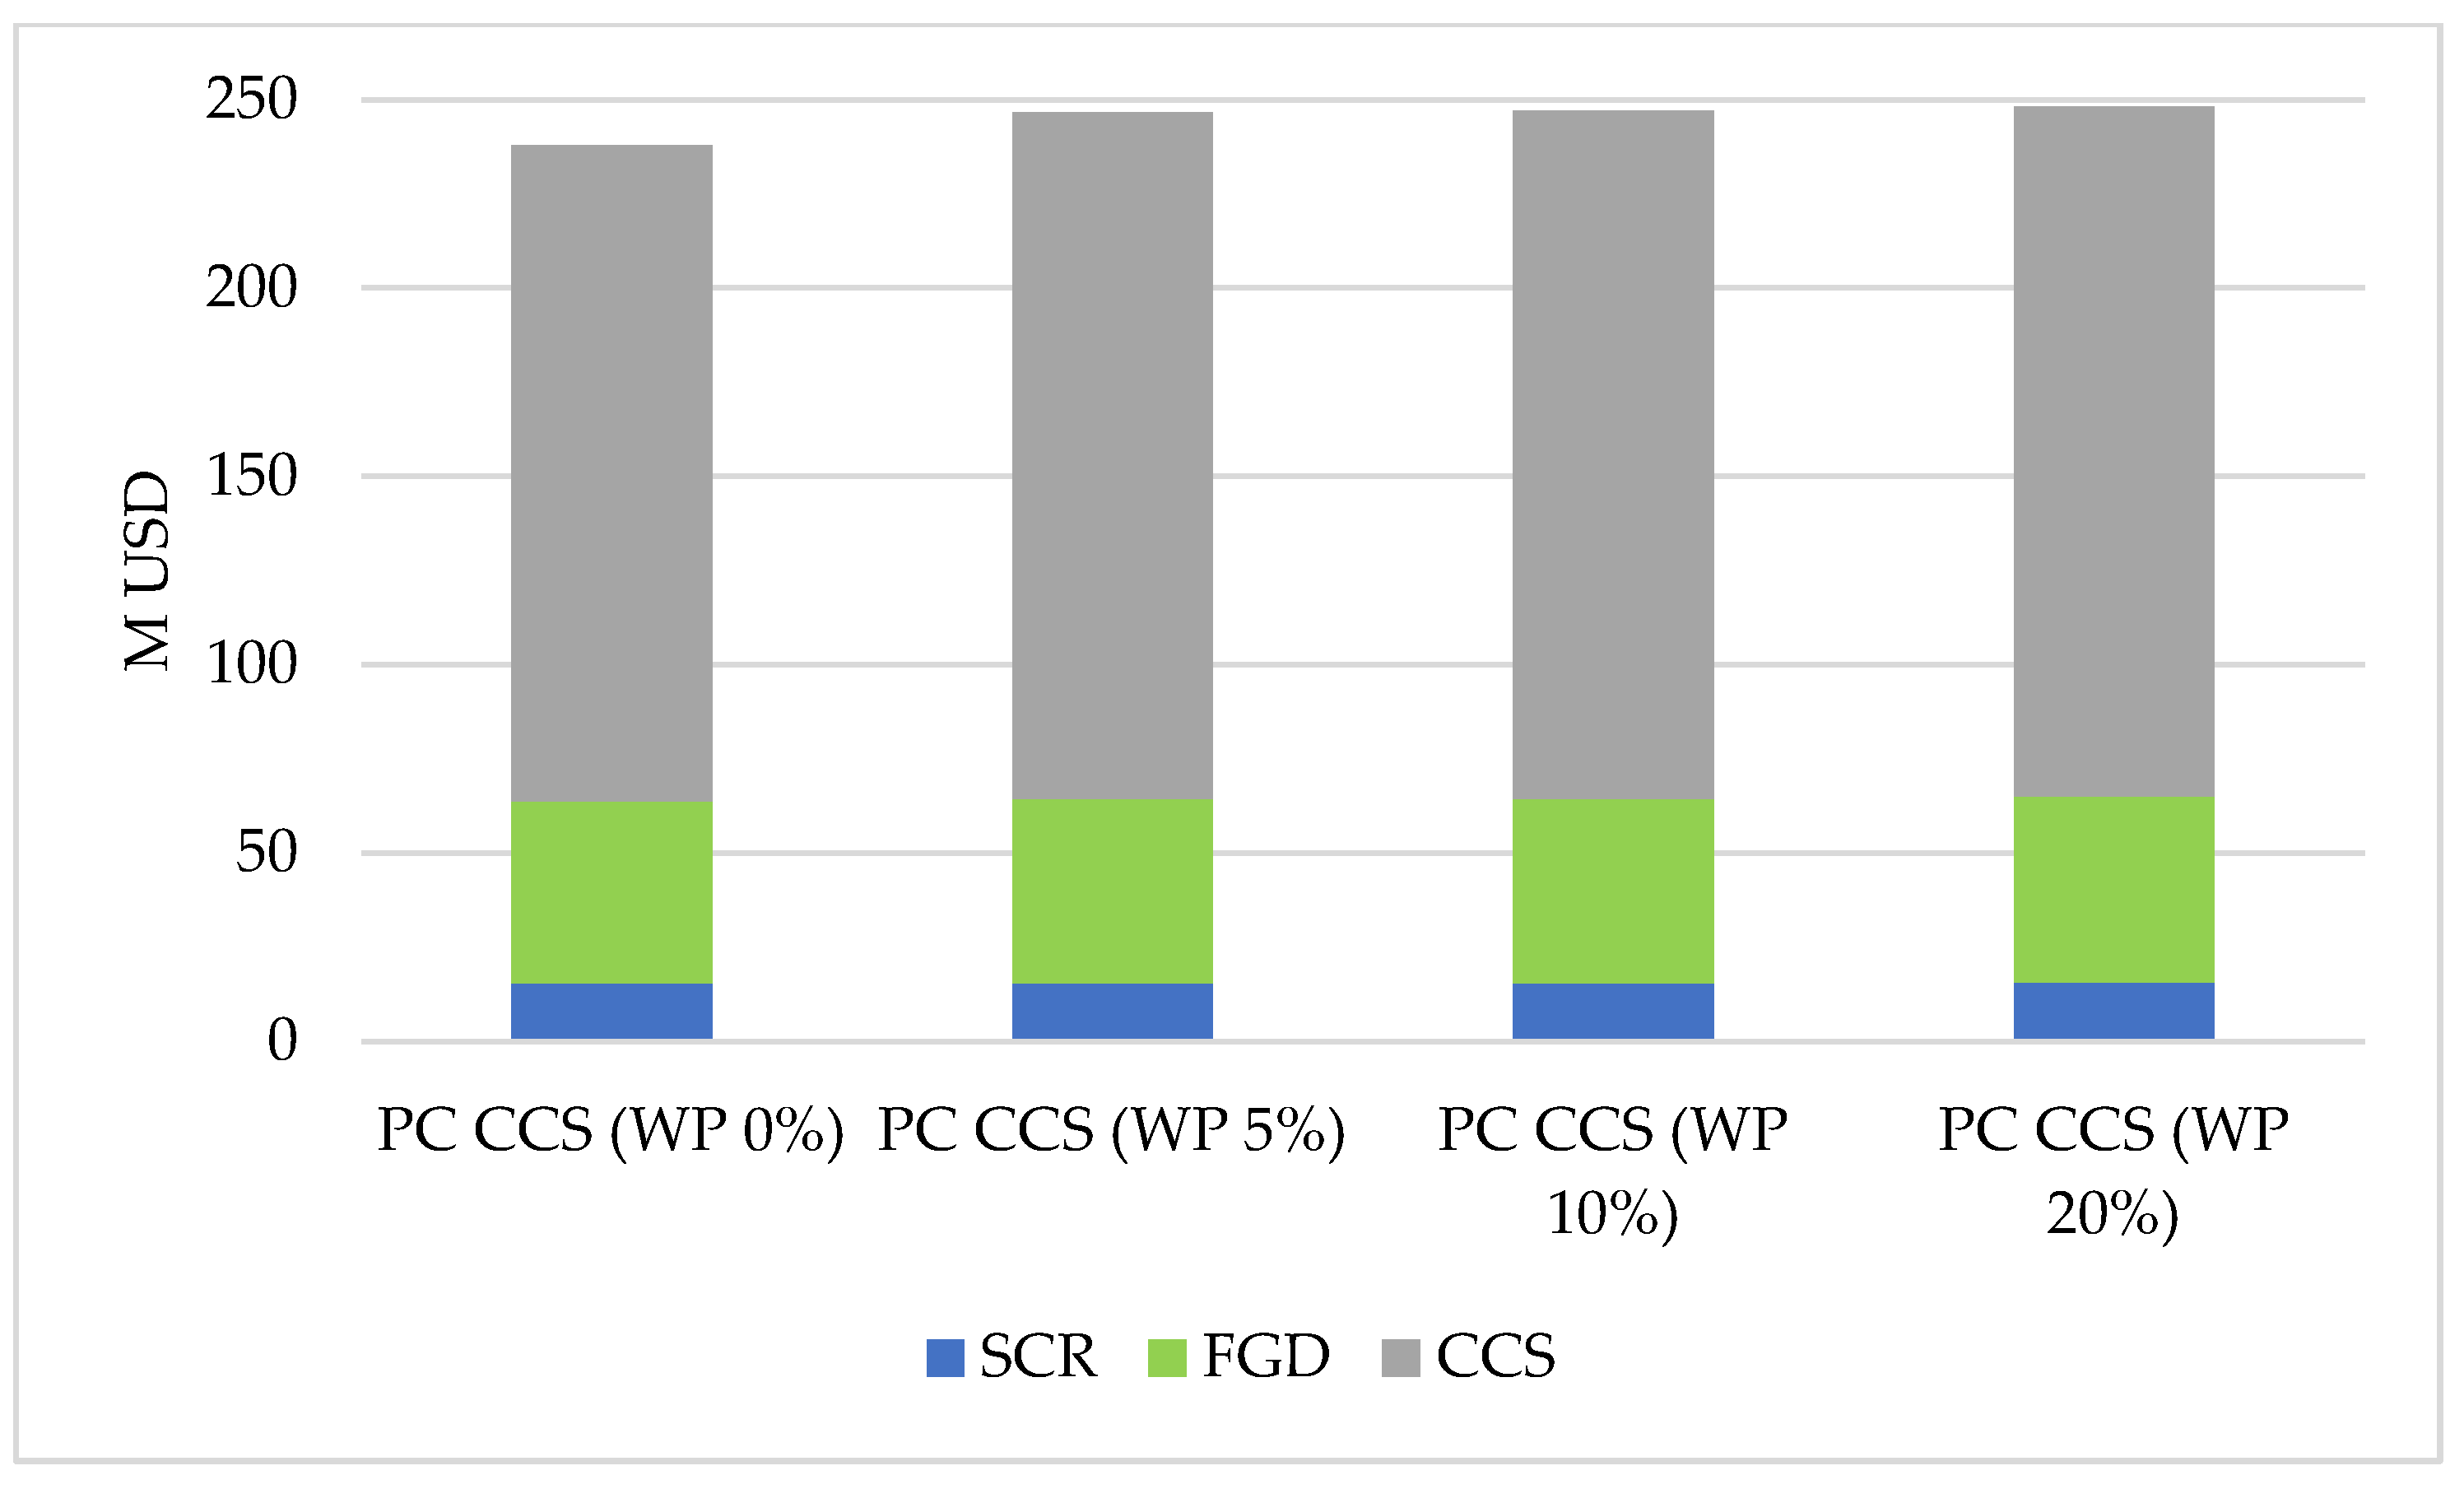
3.3. Cost of Retrofitting CCS Technology

Figure 7 and the provided capital cost data underscore the significant financial investment required for integrating carbon capture technology into existing coal-fired power plants, accounting for over 70% of the total capital costs across all scenarios. The capital costs for deploying CCS technology, alongside the introduction of biomass co-firing at different percentages (5%, 10%, and 20% wood pellets, WP), are detailed as follows: for 100% coal usage, the required capital is $237.99 million USD; for 5% WP co-firing, it rises to $246.55 million USD; for 10% WP, it slightly increases to $247.17 million USD; and for 20% WP, it reaches $248.18 million USD.
This incremental increase in capital costs with the addition of biomass co-firing is attributed to the augmented fuel rate necessary to accommodate biomass, subsequently necessitating an expansion in the CCS system’s capacity. Such financial implications highlight the complexities involved in balancing environmental benefits with the economic realities of retrofitting coal-fired power plants with CCS and biomass co-firing technologies, aiming to reduce carbon emissions.

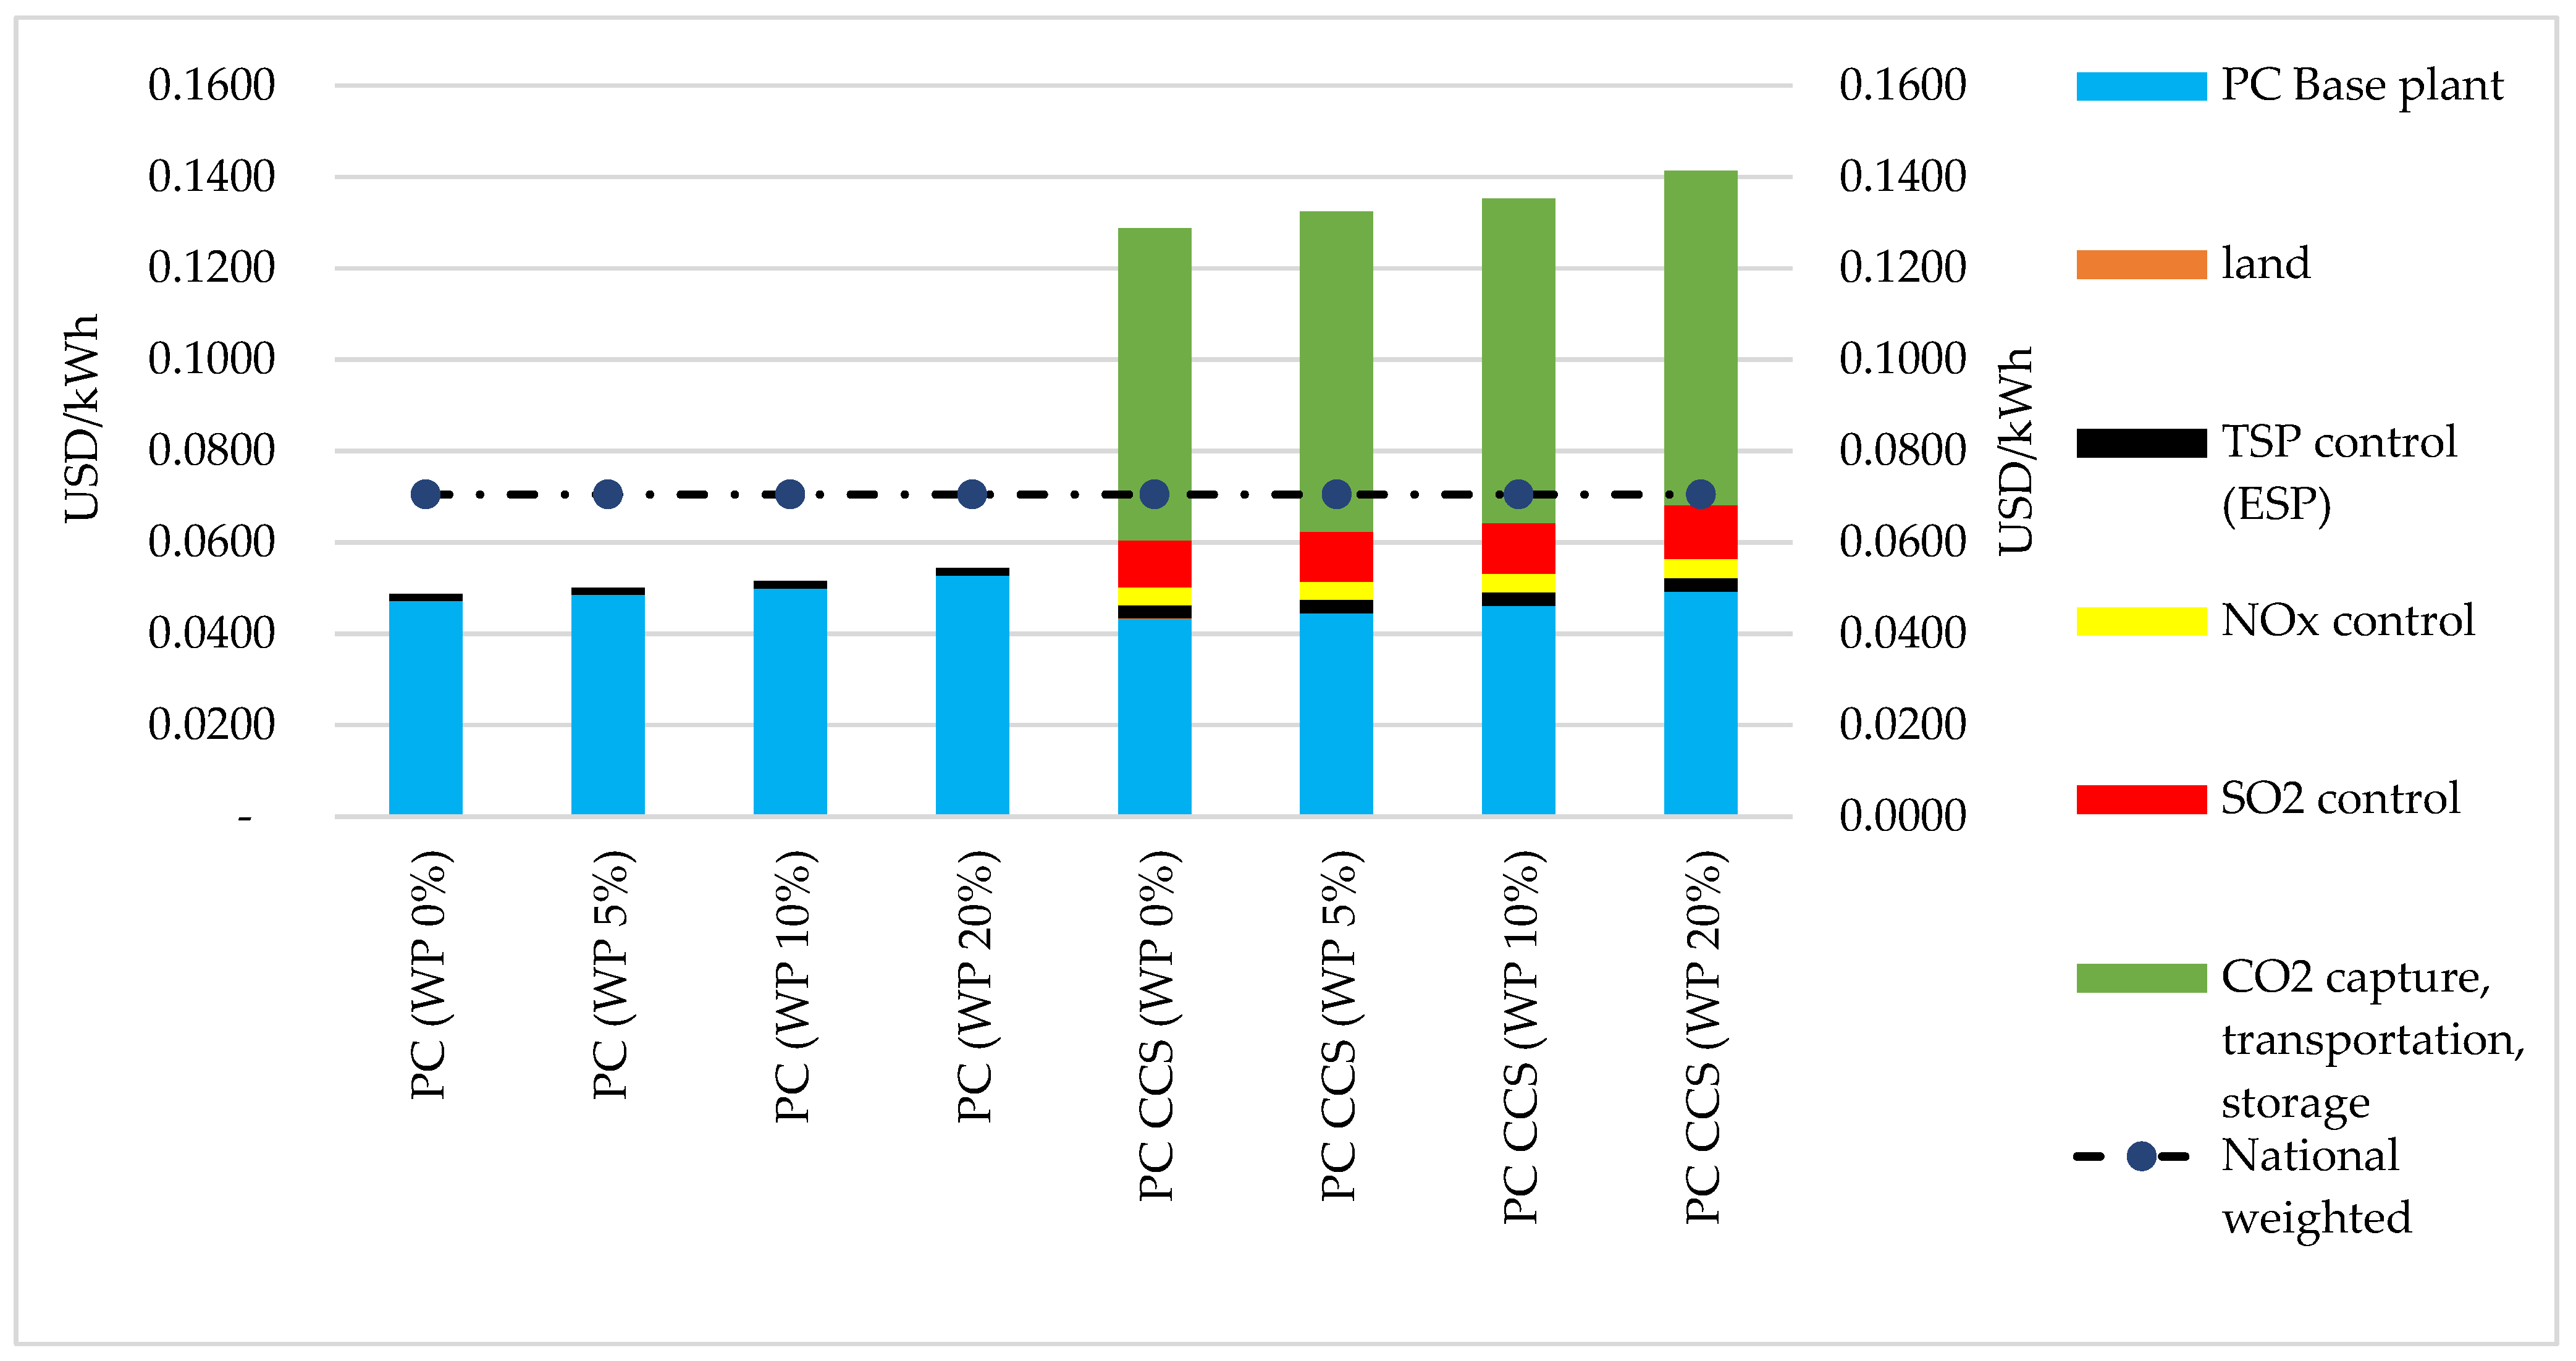
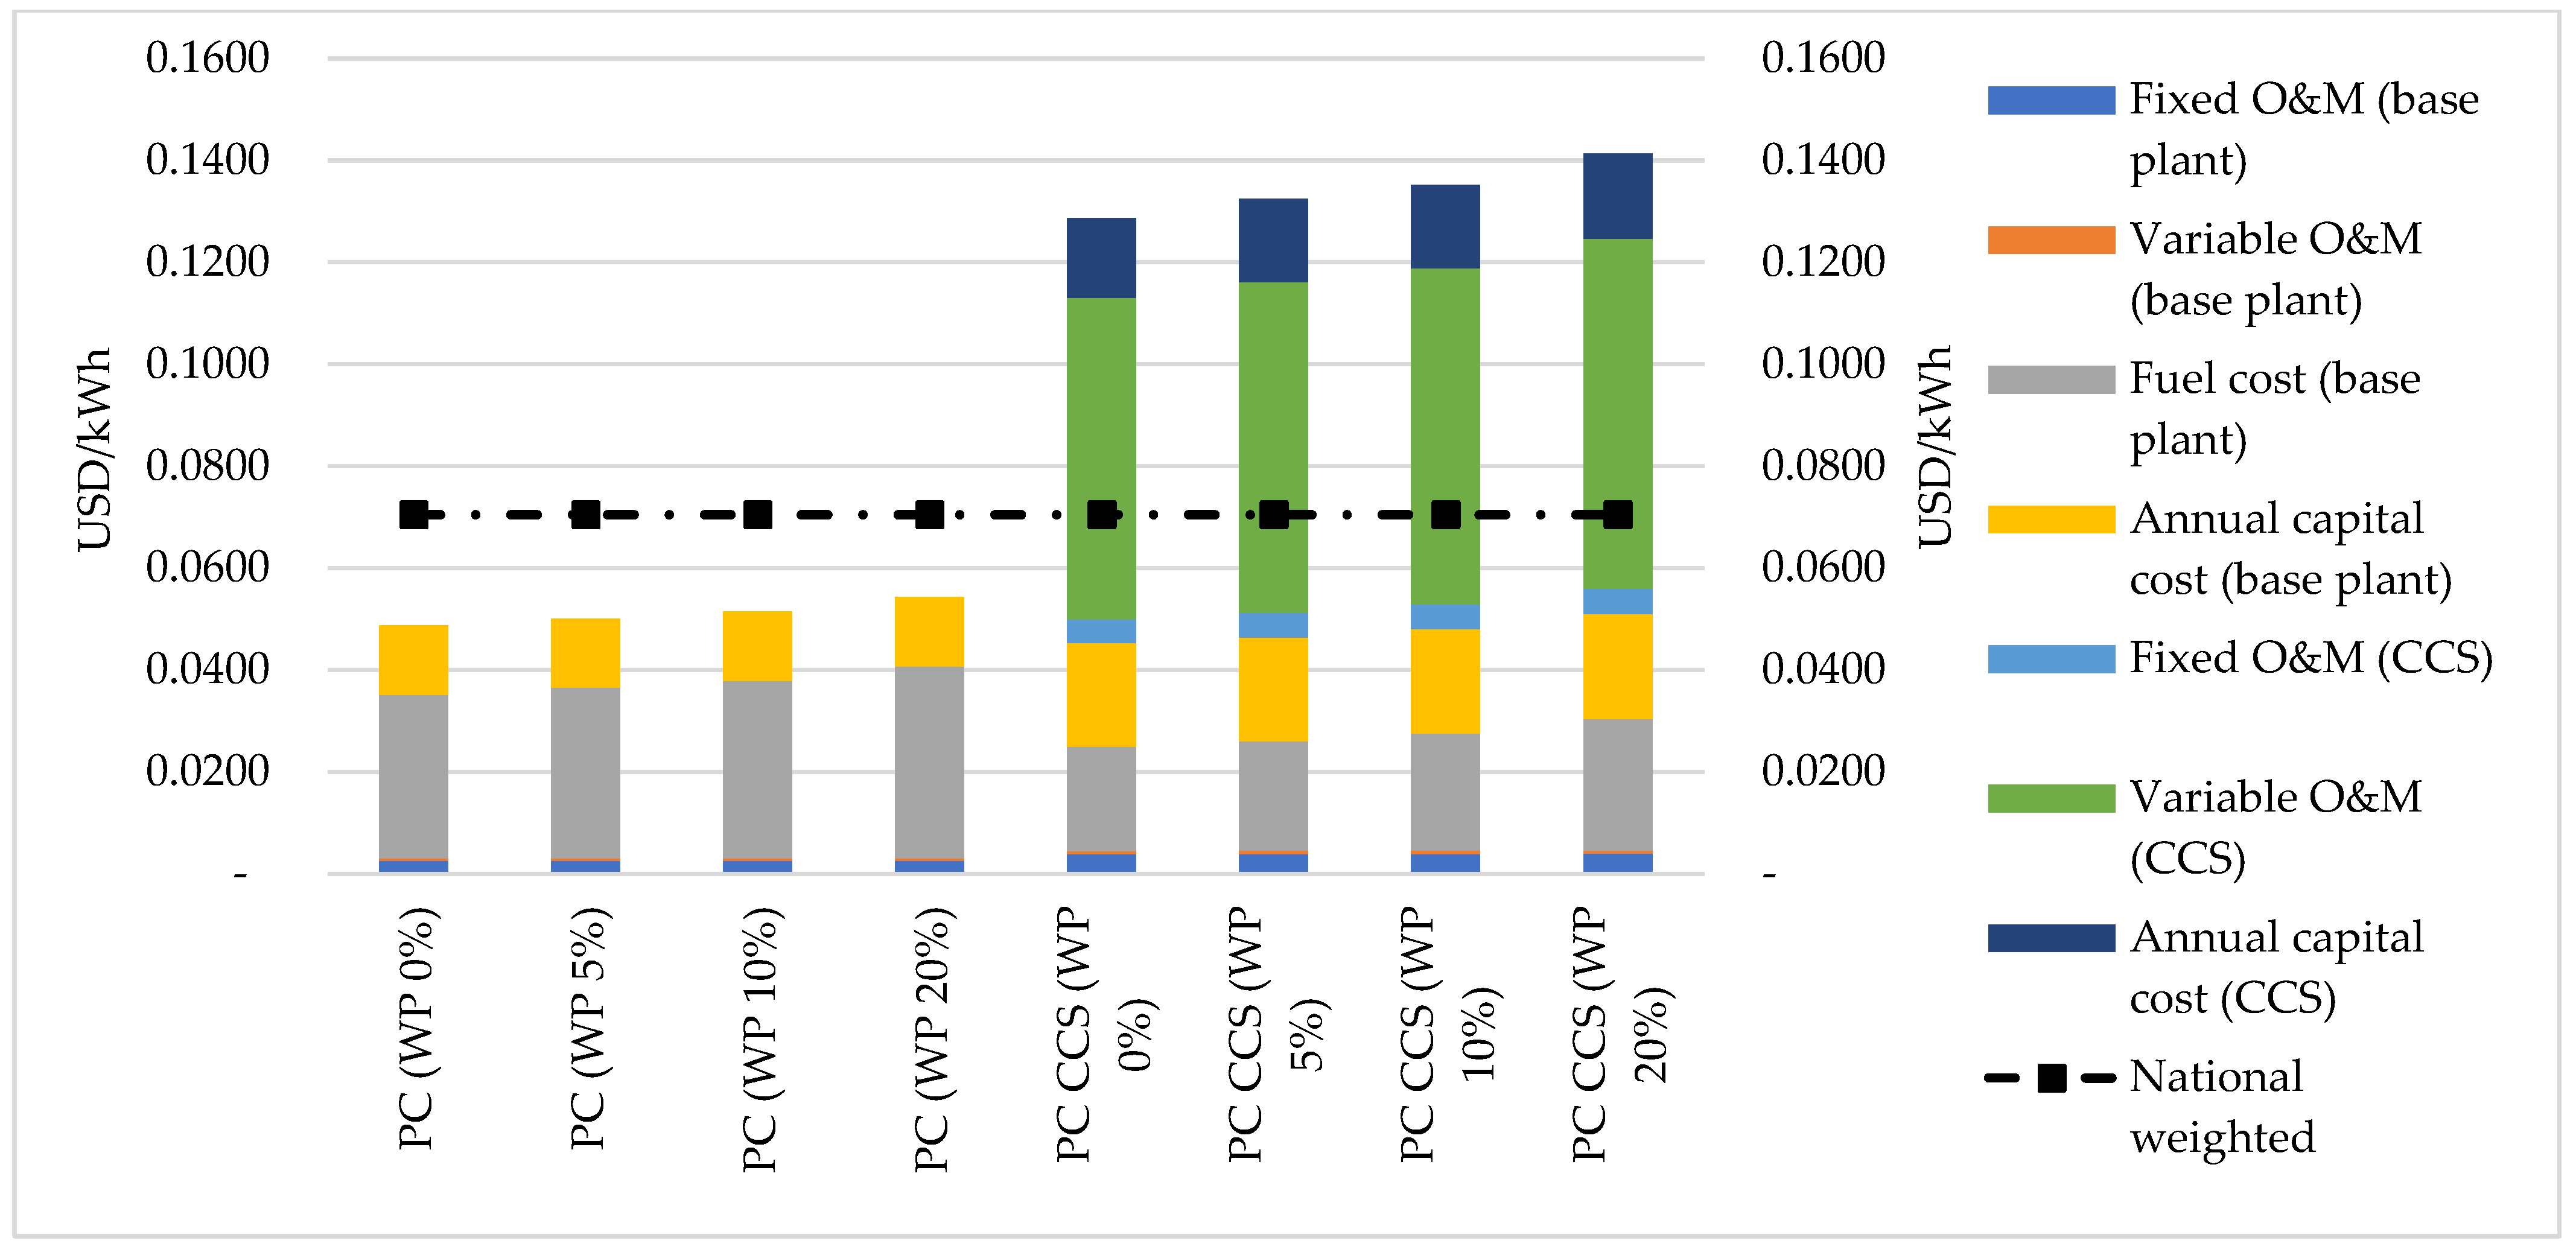
3.4. Effect of CCS on the Levelized Cost of Electricity

LCOE   ( USD / kWh ) = TLAC   ( USD   M / yr )   total   no .   of   hrs / yr Net   electric   output   kW 1000
Equation (2), as detailed in the context of the Integrated Environmental Control Model (IECM) analysis, defines the levelized cost of electricity (LCOE, in USD/kWh) as the quotient of the Total Levelized Annual Cost (TLAC, in million USD per year) over the product of total operating hours in a year and the net electrical output of the power plant [72]. The TLAC encompasses both the operational and maintenance (O&M) expenses and the annualized capital cost, representing the aggregate cost required to produce electricity on an annualized basis.
This formulation effectively captures the full economic burden of electricity generation, factoring in both the upfront capital investments needed for plant construction or retrofitting (including the integration of CCS and biomass co-firing technologies) and the ongoing costs associated with running the plant. The LCOE metric is crucial for assessing the financial viability of different energy generation options, offering a comprehensive measure that allows for the comparison of the cost-effectiveness of various fuel and technology scenarios in delivering electricity.
Figure 8 presents the LCOE for an existing PC power plant and its variations after retrofitting with CCS technology, incorporating different levels of biomass co-firing. For the existing PC setup, LCOE values are as follows: $0.0487/kWh for coal, $0.0501/kWh for 5% wood pellets (WP), $0.0515/kWh for 10% WP, and $0.0544/kWh for 20% WP. These figures, converted at an exchange rate of 1 USD to 14,300 IDR, align with actual LCOE values of CFPPs in Indonesia, which ranged from $0.0372/kWh to $0.0581/kWh between 2013 and 2022 [73,74]. Given that most CFPPs in Indonesia utilize lignite—a cheaper option compared to the sub-bituminous coal used in this study—the simulated LCOE values gravitate toward the higher end of the actual weighted LCOE range for Indonesian CFPPs.
Retrofitting with CCS technology leads to a substantial increase in LCOE, exceeding 100%: $0.1287/kWh for coal, $0.1325/kWh for 5% WP, $0.1353/kWh for 10% WP, and $0.1414/kWh for 20% WP. These values are consistent with the LCOE range of $0.100/kWh to $0.121/kWh for PC CCS systems using amine-based post-combustion carbon capture technology in various countries [75,76,77]. The marked rise in LCOE for PC CCS scenarios is largely attributed to the additional capital and operational expenses associated with implementing post-combustion CCS. The LCOE contributions from post-combustion CCS technology alone range from $0.0682/kWh to $0.0731/kWh. Detailed outcome data are in Table A2.
Comparatively, the national weighted LCOE in Indonesia stands at $0.0705/kWh. This is significantly higher than the LCOE for the existing PC plant using coal ($0.0487/kWh) but remains lower than the LCOE for PC CCS with coal ($0.1287/kWh). These insights illustrate the economic impact of integrating CCS into coal-fired power generation, especially in the context of Indonesian energy markets and the broader challenges of balancing carbon mitigation strategies with financial viability.
Figure 9 illustrates the breakdown of the LCOE for both existing PC power plants and those retrofitted with CCS technology, incorporating variations of biomass co-firing. In existing PC setups, fuel costs dominate the LCOE, accounting for over 65% of the total. This significant proportion reflects the primary expense of operating a coal-fired power plant under conventional conditions, where the cost of coal significantly influences the overall economic efficiency. Detailed outcome data are in Table A3 and Table A4.
Conversely, in PC power plants retrofitted with CCS technology, the narrative shifts dramatically, with the largest cost contribution stemming from variable operation and maintenance (O&M) costs associated with CCS, exceeding 48%. This increase is primarily due to the substantial requirements for steam and auxiliary power necessary for the CCS process, which significantly impacts the operational efficiency of the power plant. The high variable O&M costs underscore the economic challenge posed by integrating CCS into existing coal power plants, highlighting the substantial financial investment needed to capture and store CO2 emissions effectively. This change in cost structure reflects the broader implications of adopting CCS technology on the economic viability and operational dynamics of coal-fired power generation.

3.5. Cost of CO2 Avoided and Cost of CO2 Captured

The cost of CO2 avoided (Equation (3)) is a critical economic metric for evaluating CCS technology in power plants. It quantifies the expense associated with preventing or mitigating the emission of one metric ton of CO2 during the production of one kilowatt-hour (kWh) of electricity. This measure helps to assess the financial efficiency and environmental effectiveness of CCS technology by determining the additional cost incurred to avoid emitting CO2 into the atmosphere, compared to conventional power generation methods. It essentially reflects the economic trade-offs involved in reducing greenhouse gas emissions through CCS, providing a basis for comparing the cost-effectiveness of various emission reduction technologies and strategies within the energy sector [41,72].
C o s t   o f   C O 2   a v o i d e d = ( L C O E ) c c s ( L C O E ) r e f ( C O 2   e m i s s i o n ) r e f ( C O 2   e m i s s i o n ) c c s
where the variables are as follows:
  • LCOEccs: LCOE PC CCS (USD/kWh);
  • LCOEref: LCOE PC (USD/kWh);
  • CO2 emissionref: emission factor PC (tCO2/kWh);
  • CO2 emissionccs: emission factor PC CCS (tCO2/kWh).
The cost of the CO2 captured (Equation (4)) is an essential metric specifically designed to assess the financial aspect of the carbon capture process in CCS technologies. It focuses solely on the expenses incurred to capture one metric ton of CO2, excluding costs related to the transportation and storage of the captured CO2. This metric is pivotal for comparing the economic feasibility and efficiency of various CCS technologies, as it highlights the cost-effectiveness of the capture phase, independent of the subsequent stages in the CCS chain.
By isolating the capture cost, stakeholders can make more informed decisions about technology selection, based on the characteristics and financial implications of each CCS technology option. This metric allows for a detailed examination of the capture technologies’ performance, facilitating the identification of the most cost-effective solutions for reducing CO2 emissions in electric power plants and other industrial applications. It provides a clearer understanding of the economic challenges and opportunities associated with different CCS technologies, enhancing the ability to strategize and implement effective carbon reduction initiatives [41,72].
C o s t   o f   C O 2   c a p t u r e d = ( L C O E c c s ( L C O E ) r e f ) C O 2   c a p t u r e d   i n   C C S   t e c h n o l o g y
where the variables are as follows:
  • LCOEccs: LCOE PC CCS (USD/kWh);
  • LCOEref: LCOE PC (USD/kWh);
  • CO2 captured in CCS technology: difference of CO2 emission before and after;
  • CO2 capturing (t CO2/kWh).
Table 3’s data, indicating rising costs for both the CO2 avoided and captured as the proportion of biomass co-firing in PC power plants with CCS increases, underscores the financial implications of integrating biomass into the fuel mix. The incremental cost is attributed to the higher price of biomass fuels and the associated increase in the fuel flow rate required to maintain energy output when substituting a portion of coal with biomass.
Despite the escalating costs with greater biomass usage, the cost of CO2 captured using amine or monoethanolamine (MEA)-based post-combustion carbon capture technology remains aligned with a referenced baseline of $62.80 per ton of CO2 [32]. This consistency suggests that the efficiency and economics of the capture process itself are relatively stable, regardless of the slight variations in fuel composition due to biomass co-firing.
This scenario illustrates the balance that must be struck between enhancing the sustainability of power generation through biomass co-firing and managing the economic impacts of adopting CCS technologies. While biomass co-firing can reduce the carbon intensity of power generation, the financial viability of CCS as a climate mitigation strategy also depends on controlling the costs associated with capturing CO2, especially in light of the added expenses from biomass usage.

3.6. Fuel Cost Variability

The variability in fuel costs significantly impacts the LCOE for existing PC power plants. Analysis shows that with fuel prices under $80 per ton, the LCOE remains below $0.06 per kWh, positioning it competitively relative to the national weighted average LCOE of $0.0705 per kWh, as long as the fuel price does not exceed $100 per ton. This highlights the direct influence of fuel prices on the economic efficiency of coal-fired power generation, underscoring the importance of fuel cost management in maintaining competitive electricity pricing.
Figure 10, however, illustrates a stark contrast in the LCOE between existing PC plants and those retrofitted with CCS technology. Even at the same fuel price point, the LCOE for PC CCS configurations is more than double that of the existing PC setups. This discrepancy emphasizes the substantial economic burden introduced by CCS retrofitting. Notably, even at a relatively low fuel price of $25 per ton, the LCOE for PC CCS exceeds the national weighted LCOE, indicating that the inclusion of CCS technology significantly raises the cost of electricity production, irrespective of favorable fuel pricing.
This disparity underlines the financial challenge of integrating CCS into existing coal power infrastructure, where the cost benefits of lower fuel prices are overshadowed by the additional expenses associated with carbon capture and storage. It underscores the need for careful consideration of CCS’s economic implications on the overall cost of power generation and the pursuit of strategies to mitigate these impacts while advancing carbon reduction goals.

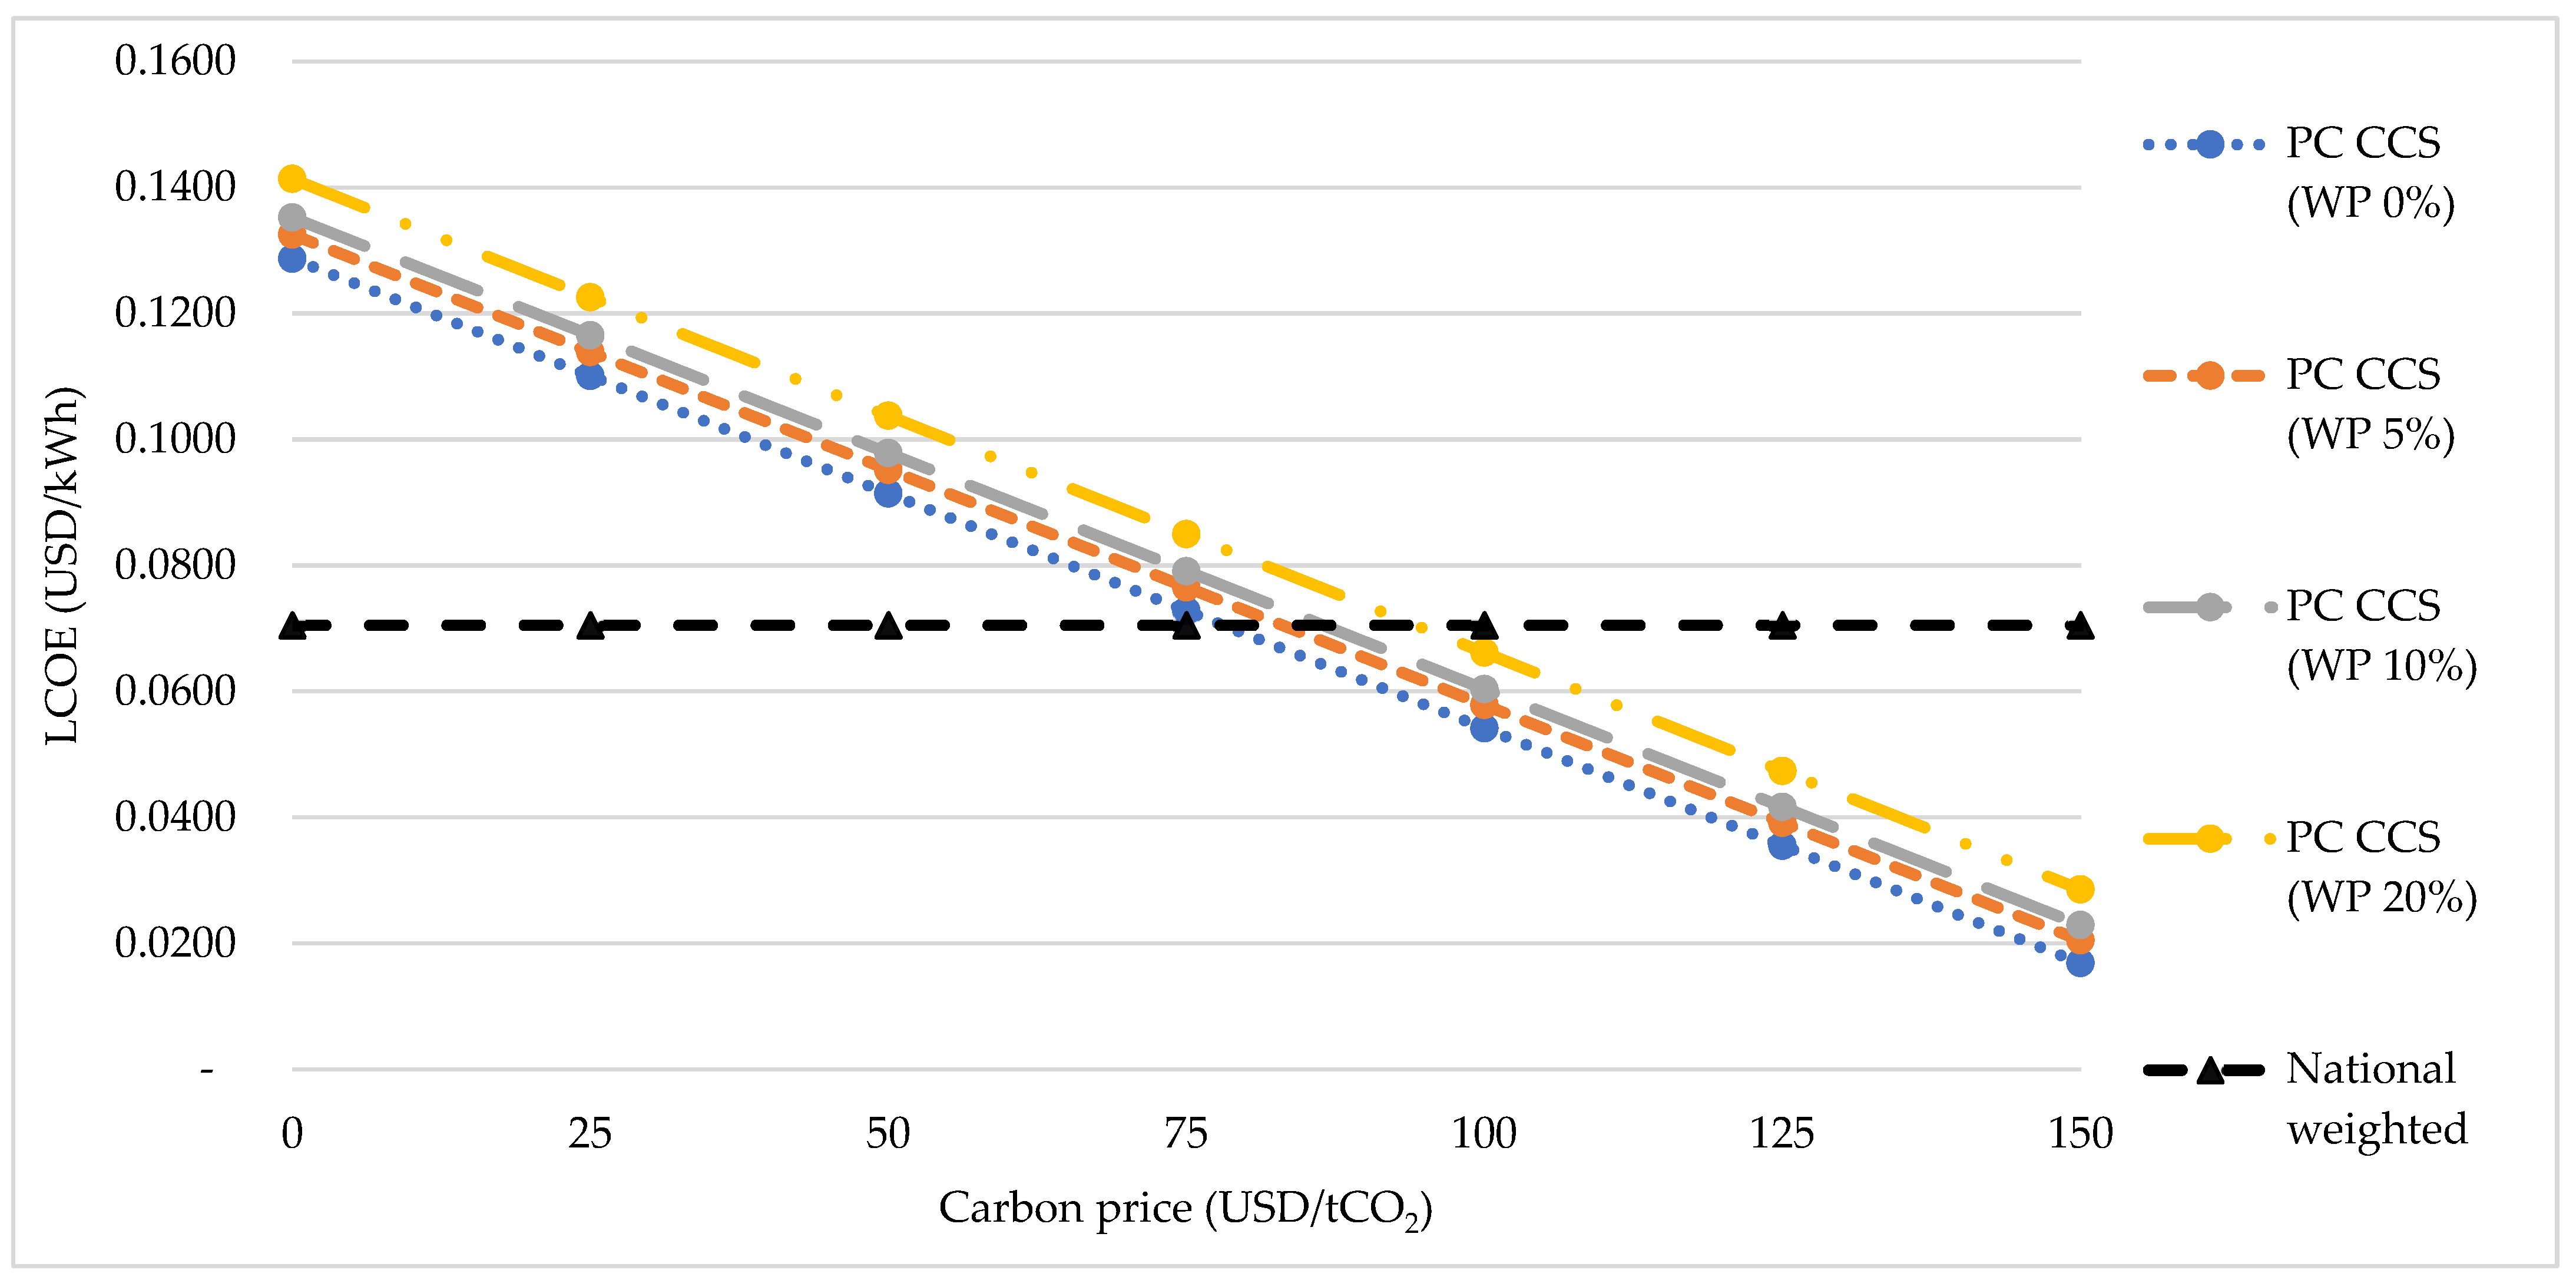
3.7. Carbon Price Variability

Carbon pricing stands as a pivotal strategy adopted by governments worldwide to stimulate the reduction in CO2 emissions and foster a technology ecosystem geared toward achieving this goal. There are primarily two instruments for carbon pricing: carbon taxes and carbon prices set through emission trading schemes (ETS) [78].
As of 2023, carbon tax policies have been implemented in various countries, each setting its own nominal tax rates. For instance, Uruguay has established a carbon tax at a rate of $155 per ton of CO2, France at $48 per ton of CO2, and South Africa at $9 per ton of CO2. These taxes directly charge emitters a fixed amount for every ton of CO2 released, incentivizing reductions in carbon emissions by making it financially beneficial to adopt cleaner technologies [79].
Conversely, the ETS operates on the principle of cap-and-trade, where a cap is set on the total amount of greenhouse gases that can be emitted. Emitters are allotted or can purchase emission allowances within this cap, and they can trade these allowances. The price of carbon under an ETS fluctuates based on supply and demand for these allowances. In 2023, notable carbon prices under ETS include $99 per ton of CO2 in the United Kingdom, $87 per ton of CO2 in the European Union, $40 per ton of CO2 in Canada, and $9 per ton of CO2 in China [78].
These carbon pricing instruments play a critical role in encouraging the adoption of carbon reduction technologies by creating financial incentives for reducing emissions. They represent an essential component of global efforts to combat climate change by pricing carbon emissions, thereby reflecting their true cost to the environment and society.
Indonesia, while not having introduced a carbon tax by 2023, has begun implementing an ETS, marking a significant step toward aligning with global carbon reduction initiatives [80]. The impact of carbon pricing on the economics of power generation, particularly for plants retrofitted with CCS technologies and utilizing biomass co-firing, is substantial. Figure 11 indicates that as the carbon price increases, the LCOE for PC CCS with biomass co-firing decreases. Specifically, at a carbon price above $80/tCO2, the LCOE of PC CCS approaches or matches the national weighted LCOE of $0.0705/kWh in Indonesia [81].
This relationship underscores the potential of carbon pricing mechanisms to improve the financial viability of CCS technologies, making them more competitive with conventional energy sources. By effectively internalizing the cost of carbon emissions, carbon pricing can play a pivotal role in facilitating the transition to cleaner energy technologies and aligning economic incentives with environmental objectives.

4. Conclusions

Techno-economic analysis of biomass (wood pellets) co-firing on existing PC and retrofitting PC CCS have been carried out. In existing PC conditions, the only environmental control technology used is ESP. Retrofitting CCS technology adds SCR, FGD, and amine-based post-combustion carbon capture technology. When using coal, the net power output reduces from 308 MWe (PC) to 220 MWe (PC CCS), or a decrease of 28%. This decrease is accompanied by a decrease in net efficiency (HHV), from 35.49% to 21.13%. In general, increasing the use of biomass co-firing in either PC or CCS can slightly reduce performance and efficiency compared to coal fuel (as reference). The decrease in performance and efficiency in the power plant after CCS retrofitting is caused by the relatively high use of steam and auxiliary power in this technology.
From an economic aspect, retrofitting CCS technology (SCR, FGD, and CCS) in this study requires capital costs as follows: SCR of 15.35 M USD, FGD of 48.44 M USD, and CCS of 174.20 M USD. When using coal fuel, there was a very significant increase in LCOE, namely, 164% between the existing PC of 0.0487 USD/kWh and a PC CCS of 0.1287 USD/kWh. This significant increase is due to the high cost of the CCS process. CCS variable costs are very expensive because of the use of steam and auxiliary power as well as consumable materials. In general, increasing the use of biomass co-firing in either PC or CCS increases the LCOE compared to coal fuel (as reference). The increase in LCOE is due to the cost of wood pellets being more expensive than coal.
The use of 10% co-firing biomass produces neutral carbon. Increasing the percentage of biomass co-firing by more than 10% in PC CCS will make the net emission of CO2 negative. At co-firing biomass of 20%, the net emission of CO2 is −0.147 kg CO2/kWh. Meanwhile, the cost of avoided and captured in PC CCS retrofitting is 107.28 USD/t and 59 USD/t. Increasing the use of biomass co-firing on PC or PC CCS increases the CO2 emission factor value due to increased fuel consumption. This increase is caused by the lower calorific value of biomass than coal. A similar increase also occurred in the costs of avoiding and capturing on PC CCS along with the increase in biomass co-firing.
A carbon price policy can be implemented to improve the economics of PC CCS. The LCOE PC CCS value will decrease along with the increase in carbon price. In this case, if the carbon price is above 80 USD/t CO2, then the LCOE PC CCS (coal fuel) value will be lower than the national weighted LCOE.
This research has demonstrated its significance in contributing to carbon neutrality, a pivotal step toward reducing GHG emissions and addressing climate change. The insights from this study are particularly compelling within the context of environmentally friendly energy policies in Indonesia. By optimizing CCS technology and biomass co-firing, alongside implementing carbon pricing mechanisms, this research offers a viable path for achieving both carbon neutrality and competitive LCOE. This approach introduces an alternative perspective to the utilization of renewable energy sources like photovoltaic and wind power, suggesting a multifaceted strategy for sustainable energy development.
A promising direction for future research is the execution of Life Cycle Assessment (LCA) studies on the combined use of biomass co-firing and CCS technologies. LCA offers a comprehensive framework for evaluating the environmental impacts of these technologies throughout their entire life cycle—from biomass cultivation or collection to the end-of-life phase of CCS infrastructure. Such studies would enable a holistic understanding of the environmental benefits and potential trade-offs associated with these technologies.
Exploring various types of biomasses and CCS technologies through LCA can provide insights into which combinations yield the most significant environmental advantages while minimizing economic impacts. This approach would help identify the most sustainable and cost-effective strategies for reducing greenhouse gas emissions in the energy sector, supporting informed decision-making for policymakers, industry stakeholders, and researchers in the pursuit of sustainable and environmentally friendly energy solutions.

Author Contributions

Conceptualization, M.A.R., A.A. and R.; methodology, M.A.R. and R.; software, M.A.R. and A.A.; validation, R., N.C. and T.W.D.H.; formal analysis, E.S.; investigation, A.A.; resources, N.C.; data curation, A.A., N.C. and T.W.D.H.; writing—original draft preparation, M.A.R. and E.S.; writing—review and editing, M.A.R. and A.A.; visualization, M.A.R. and R.; supervision, N.C. and T.W.D.H.; project administration, A.A.; funding acquisition, E.S. All authors have read and agreed to the published version of the manuscript.

Funding

This research received no external funding.

Institutional Review Board Statement

Not applicable.

Informed Consent Statement

Not applicable.

Data Availability Statement

Data is contained within the article.

Conflicts of Interest

All authors were employed by the company PT. PLN (Persero) Puslitbang Ketenagalistrikan (Research Institute). The authors declare that the research was conducted in the absence of any commercial or financial relationships that could be construed as a potential conflict of interest.

Abbreviations

CCSCarbon capture and storage
CFPPsCoal-fired power plants
CIFCost, insurance, and freight
ESPElectrostatic precipitator
FGDFlue gas desulphurization
GHGGreenhouse gasses
HHVHigh heating value
IECMIntegrated Environment Control Model
LCOELevelized cost of electricity
MEAMonoethanolamine
O&MOperation and maintenance
PCPulverized coal
PLNPerusahaan Listrik Negara (State Electricity Company of Indonesia)
SCRSelective catalytic reduction
WPWood pellet

Appendix A

Table A1. Fuel properties analysis of coal and biomass feedstock.
ItemsUnitTypical Sub
Bituminous Coal
Typical Wood
Pellet
Carbon% wt (AR)49.5947.78
Hydrogen% wt (AR)3.796.07
Oxygen% wt (AR)15.4939.39
Chlorine% wt (AR)-0.10
Sulfur% wt (AR)0.080.07
Nitrogen% wt (AR)0.850.15
Ash content% wt (AR)2.041.08
Total moisture% wt (AR)28.165.46
Caloric value (HHV)kJ/kg (AR)20,553.0018,773.61
SiO2% wt (AR)38.563.56
Al2O3% wt (AR)12.240.92
Fe2O3% wt (AR)20.075.31
CaO% wt (AR)11.3761.15
MgO% wt (AR)8.162.11
K2O% wt (AR)0.2812.92
Na2O% wt (AR)0.560.82
MnO2% wt (AR)0.180.37
TiO2% wt (AR)1.130.34
P2O5% wt (AR)0.510.57
SO3% wt (AR)6.369.86
Table A2. LCOE per component for various PC biomass co-firing scenarios without and with CCS retrofitting.
No.UnitPC (WP 0%)PC (WP 5%)PC (WP 10%)PC (WP 20%)PC CCS (WP 0%)PC CCS (WP 5%)PC CCS (WP 10%)PC CCS (WP 20%)
PC Base plantUSD/kWh0.04720.04860.05000.05280.04340.04450.04620.0492
landUSD/kWh0.0000240.0000240.0000240.0000240.0000300.0000300.0000300.000031
TSP control (ESP)USD/kWh0.00150.00150.00150.00150.00290.00290.00290.0030
NOx controlUSD/kWh----0.00400.00400.00410.0042
SO2 controlUSD/kWh----0.01030.01090.01110.0118
CO2 capture, transportation, storageUSD/kWh----0.06820.07010.07100.0731
LCOE totalUSD/kWh0.04880.05010.05150.05440.12870.13250.13530.1414
Table A3. LCOE per component for various PC biomass co-firing scenarios without CCS retrofitting.
No.UnitPC (WP 0%)PC (WP 5%)PC (WP 10%)PC (WP 20%)
Fixed O&M (base plant)USD/kWh0.00260.00260.00260.0026
Variable O&M (base plant)USD/kWh0.00050.00040.00050.0004
Fuel cost (base plant)USD/kWh0.03210.03350.03490.0377
Annual capital cost (base plant)USD/kWh0.01360.01360.01360.0136
Fixed O&M (CCS)USD/kWh----
Variable O&M (CCS)USD/kWh----
Annual capital cost (CCS)USD/kWh----
LCOE totalUSD/kWh0.04880.05010.05150.0544
Table A4. LCOE per component for various PC biomass co-firing scenarios with CCS retrofitting.
No.UnitPC CCS (WP 0%)PC CCS (WP 5%)PC CCS (WP 10%)PC CCS
(WP 20%)
Fixed O&M (base plant)USD/kWh0.00390.00390.00390.0039
Variable O&M (base plant)USD/kWh0.00060.00060.00060.0007
Fuel cost (base plant)USD/kWh0.02040.02140.02310.0259
Annual capital cost (base plant)USD/kWh0.02030.02040.02040.0206
Fixed O&M (CCS)USD/kWh0.00470.00490.00490.0050
Variable O&M (CCS)USD/kWh0.06300.06490.06590.0687
Annual capital cost (CCS)USD/kWh0.01570.01640.01650.0167
LCOE totalUSD/kWh0.12870.13250.13530.1414

References

  1. United Nations. Causes and Effects of Climate Change. Available online: https://www.un.org/en/climatechange/science/causes-effects-climate-change (accessed on 1 April 2023).
  2. EPA. Global Greenhouse Gas Emissions Data. Available online: https://www.epa.gov/ghgemissions/global-greenhouse-gas-emissions-data (accessed on 12 May 2023).
  3. National Academy of Sciences. Climate Change: Evidence and Causes: Update 2020; The National Academies Press: Washington, DC, USA, 2020; ISBN 978-0-309-67502-4. [Google Scholar]
  4. Ebi, K.L.; Vanos, J.; Baldwin, J.W.; Bell, J.E.; Hondula, D.M.; Errett, N.A.; Hayes, K.; Reid, C.E.; Saha, S.; Spector, J.; et al. Extreme Weather and Climate Change: Population Health and Health System Implications. Annu. Rev. Public Health 2020, 42, 293–315. [Google Scholar] [CrossRef] [PubMed]
  5. Abbass, K.; Qasim, M.Z.; Song, H.; Murshed, M.; Mahmood, H.; Younis, I. A Review of the Global Climate Change Impacts, Adaptation, and Sustainable Mitigation Measures. Environ. Sci. Pollut. Res. 2022, 29, 42539–42559. [Google Scholar] [CrossRef] [PubMed]
  6. Malhi, Y.; Franklin, J.; Seddon, N.; Solan, M.; Turner, M.G.; Field, C.B.; Knowlton, N. Climate Change and Ecosystems: Threats, Opportunities and Solutions. Philos. Trans. R. Soc. B Biol. Sci. 2020, 375, 104. [Google Scholar] [CrossRef]
  7. IPCC. Summary for Policymakers Sixth Assessment Report (WG3); IPCC: Geneva, Switzerland, 2022; ISBN 9781107415416. [Google Scholar]
  8. International Energy Agency. CO2 Emissions in 2022; International Energy Agency: Paris, France, 2023. [Google Scholar]
  9. Ritchie, H.; Rosado, P.; Roser, M. CO2 and Greenhouse Gas Emissions. Our World Data. 2020. Available online: https://ourworldindata.org/co2-and-greenhouse-gas-emissions (accessed on 19 February 2024).
  10. IEA. CO2 Emissions from Electricity and Heat Production by Fuel, and Share by Fuel, 2000–2021. Available online: https://www.iea.org/data-and-statistics/charts/co2-emissions-from-electricity-and-heat-production-by-fuel-and-share-by-fuel-2000-2021 (accessed on 12 May 2023).
  11. Enerdata Electricity Production. Available online: https://yearbook.enerdata.net/electricity/world-electricity-production-statistics.html (accessed on 9 August 2023).
  12. Ritchie, H.; Rosado, P.; Roser, M. Electricity Mix. Available online: https://ourworldindata.org/electricity-mix (accessed on 11 August 2023).
  13. British Petroleum. Statistical Review of World Energy 2022; British Petroleum: London, UK, 2022. [Google Scholar]
  14. CEC. Electricity Generation in China from 2011 to 2021, by Source. Available online: https://www-statista-com.ezproxy.ugm.ac.id/statistics/302233/china-power-generation-by-source/ (accessed on 9 October 2023).
  15. BP. Statistical Review of World Energy & Ember Electricity Production by Source, Indonesia. Available online: https://ourworldindata.org/grapher/electricity-prod-source-stacked?country=~IDN (accessed on 7 October 2023).
  16. European Commission. European Bioenergy Netwrok: Biomass Co-Firing, an Efficient Way to Reduce Greenhouse Gas Emissions. Available online: https://energy.ec.europa.eu/system/files/2015-02/2003_cofiring_eu_bionet_0.pdf (accessed on 3 January 2024).
  17. Al-mansour, F.; Zuwala, J. An Evaluation of Biomass Co-Firing in Europe. Biomass Bioenergy 2010, 34, 620–629. [Google Scholar] [CrossRef]
  18. Primadita, D.S.; Kumara, I.N.S.; Ariastina, W.G. A Review on Biomass for Electricity Generation in Indonesia. J. Electr. Electron. Inform. 2020, 4, 1. [Google Scholar] [CrossRef]
  19. Triani, M.; Tanbar, F.; Cahyo, N.; Sitanggang, R.; Sumiarsa, D.; Lara Utama, G. The Potential Implementation of Biomass Co-Firing with Coal in Power Plant on Emission and Economic Aspects: A Review. EKSAKTA J. Sci. Data Anal. 2022, 3, 83–94. [Google Scholar] [CrossRef]
  20. Van Loo, S.; Koppejan, J. The Handbook of Biomass Combustion & Co-Firing; Earthscan: London, UK, 2008; ISBN 9783131450715. [Google Scholar]
  21. Dzikuć, M.; Łasiński, K. Technical and Economic Aspects of Biomass Co-Firing in Coal-Fired Boilers. Int. J. Appl. Mech. Eng. 2014, 19, 849–855. [Google Scholar] [CrossRef]
  22. Roni, M.S.; Chowdhury, S.; Mamun, S.; Marufuzzaman, M.; Lein, W.; Johnson, S. Biomass Co-Firing Technology with Policies, Challenges, and Opportunities: A Global Review. Renew. Sustain. Energy Rev. 2017, 78, 1089–1101. [Google Scholar] [CrossRef]
  23. Arifin, Z.; Insani, V.F.S.; Idris, M.; Hadiyati, K.R.; Anugia, Z.; Irianto, D. Techno-Economic Analysis of Co-Firing for Pulverized Coal Boilers Power Plant in Indonesia. Int. J. Renew. Energy Dev. 2023, 12, 261–269. [Google Scholar] [CrossRef]
  24. Cahyo, N.; Triani, M.; Sitanggang, R.; Supriyanto, E.; PLN Puslitbang, P.; PLN Jl Duren Tiga Raya No, P.; Selatan, J. Simulasi Karakteristik Co-Firing Sekam Padi Pada PLTU Batubara Pulverized Coal Kapasitas 400 MWe. Rotasi 2022, 24, 43–53. [Google Scholar] [CrossRef]
  25. Cahyo, N.; Alif, H.H.; Aditya, I.A.; Saksono, H.D. Co-Firing Characteristics of Wood Pellets on Pulverized Coal Power Plant. In Proceedings of the IOP Conference Series: Materials Science and Engineering, Sanya, China, 12–14 November 2021; Volume 1098, p. 062088. [Google Scholar]
  26. Cahyo, N.; Hapsari, T.W.D.; Aprilana, A. Co-Firing Sawdust with Coal on Indonesia’s Coal-Fired Power Plant: Status and Opportunities. In Proceedings of the 2022 International Conference on Technology and Policy in Energy & Electric Power (ICT-PEP 2022), Jakarta, Indonesia, 18–20 October 2022; IEEE: Piscataway, NJ, USA, 2022; pp. 214–219. [Google Scholar] [CrossRef]
  27. Cahyo, N.; Alif, H.H.; Saksono, H.D.; Paryanto, P. Performance and Emission Characteristic of Co-Firing of Wood Pellets with Sub-Bituminous Coal in a 330 MWe Pulverized Coal Boiler. In Proceeding of the 2nd Internation Conference on Technology and Policy in Energy and Electric Power (ICT-PEP 2020), Bandung, Indonesia, 23–24 September 2020; pp. 44–47. [Google Scholar] [CrossRef]
  28. Bui, M.; Adjiman, C.S.; Anthony, E.J.; Boston, A.; Brown, S.; Fennell, P.S.; Fuss, S.; Galindo, A.; Hackett, L.A.; Hallett, J.P.; et al. Carbon Capture and Storage (CCS): The Way Forward. Energy Environ. Sci. 2018, 11, 1062–1176. [Google Scholar] [CrossRef]
  29. Page, B.; Turan, G.; Zapantis, A.; Beck, L.; Consoli, C.; Havercroft, I.; Liu, H.; Loria, P.; Schneider, A.; Tamme, E.; et al. Global Status of CCS 2019; Global CSS Institute: Melbourne, Australia, 2019. [Google Scholar]
  30. Page, B.; Turan, G.; Zapantis, A.; Burrows, J.; Consoli, C.; Erikson, J.; Havercroft, I.; Kearns, D.; Liu, H.; Dominic, R.; et al. Global Status of CCS 2020; Global CSS Institute: Melbourne, Australia, 2020. [Google Scholar]
  31. Turan, G.; Zapantis, A.; Kearns, D.; Tamme, E.; Staib, C.; Zhang, T.; Burrows, J.; Gillespie, A.; Havercroft, I.; Rassool, D.; et al. Global Status of CCS 2021; Global CSS Institute: Melbourne, Australia, 2021. [Google Scholar]
  32. Hong, W.Y. Carbon Capture Science & Technology, A Techno-Economic Review on Carbon Capture, Utilisation and Storage Systems for Achieving a Net-Zero CO2 Emissions Future. Carbon Capture Sci. Technol. 2022, 3, 100044. [Google Scholar] [CrossRef]
  33. Dubey, A.; Arora, A. Advancements in Carbon Capture Technologies: A Review. J. Clean. Prod. 2022, 373, 133932. [Google Scholar] [CrossRef]
  34. Rubin, E.S.; Mantripragada, H.; Marks, A.; Versteeg, P.; Kitchin, J. The Outlook for Improved Carbon Capture Technology. Prog. Energy Combust. Sci. 2012, 38, 630–671. [Google Scholar] [CrossRef]
  35. Wilberforce, T.; Olabi, A.G.; Taha, E.; Elsaid, K.; Ali, M. Science of the Total Environment Progress in Carbon Capture Technologies. Sci. Total Environ. 2021, 761, 143203. [Google Scholar] [CrossRef] [PubMed]
  36. Knudsen, J.N.; Jensen, J.N.; Vilhelmsen, P.; Biede, O. Experience with CO2 Capture from Coal Flue Gas in Pilot-Scale: Testing of Different Amine Solvents. Energy Procedia 2009, 1, 783–790. [Google Scholar] [CrossRef]
  37. Hasan, S.; Abbas, A.J.; Nasr, G.G. Improving the Carbon Capture Efficiency for Gas Power Plants through Amine-Based Absorbents. Sustainability 2021, 13, 72. [Google Scholar] [CrossRef]
  38. Giannaris, S.; Janowczyk, D.; Ruffini, J.; Hill, K.; Jacobs, B.; Bruce, C.; Feng, Y.; Srisang, W. SaskPower’s Boundary Dam Unit 3 Carbon Capture Facility-The Journey to Achieving Reliability. In Proceedings of the 15th International Conference on Greenhouse Gas Control Technologies, Abu Dhabi, United Arab Emirates, 15–18 March 2021. [Google Scholar]
  39. Petra Nova Parish Holding LLC. Final Scientific/Technical Report Petra Nova; Petra Nova Parish Holding: Thompsons, TX, USA, 2020. [Google Scholar]
  40. Mantripragada, H.C.; Zhai, H.; Rubin, E.S. International Journal of Greenhouse Gas Control Boundary Dam or Petra Nova–Which Is a Better Model for CCS Energy Supply? Int. J. Greenh. Gas Control 2019, 82, 59–68. [Google Scholar] [CrossRef]
  41. Al-Qayim, K.; Nimmo, W.; Pourkashanian, M. Comparative Techno-Economic Assessment of Biomass and Coal with CCS Technologies in a Pulverized Combustion Power Plant in the United Kingdom. Int. J. Greenh. Gas Control 2015, 43, 82–92. [Google Scholar] [CrossRef]
  42. Domenichini, R.; Gasparini, F.; Cotone, P.; Santos, S. Techno-Economic Evaluation of Biomass Fired or Co-Fired Power Plants with Post Combustion CO2 Capture. Energy Procedia 2011, 4, 1851–1860. [Google Scholar] [CrossRef]
  43. Khorshidi, Z.; Ho, M.T.; Wiley, D.E. Techno-Economic Study of Biomass Co-Firing with and without CO2 Capture in an Australian Black Coal-Fired Power Plant. Energy Procedia 2013, 37, 6035–6042. [Google Scholar] [CrossRef]
  44. The World Bank. Carbon Capture Storage (CCS) for Coal-Fired Power Plants in Indonesia; The World Bank: Washington, DC, USA, 2015. [Google Scholar]
  45. Susantoro, T.M.; Susantoro, T.M.; Wikantika, K.; Sunarjanto, D.; Wahyudi, P.; Kepies, S. CCUS-EOR Optimization to Achieve Zero Emission Program Targets in Northwest Java Basin CCUS-EOR Optimization to Achieve Zero Emission Program Targets in Northwest Java Basin. Evergreen 2023, 10, 1809–1818. [Google Scholar] [CrossRef]
  46. ASTM D 388-99; Standard Classification of Coals by Rank. ASTM Internation: West Conshocken, PA, USA, 2017; Volume 5.
  47. Google. Google Maps. Available online: https://www.google.com/maps/d/edit?mid=1uxU1Ws87bs9O9tr3_n5pNkz_As2RgmQ&ll=-0.6570145835678902%2C104.49307809681076&z=5 (accessed on 1 January 2024).
  48. ESRI. Oil and Gas Features-Indonesia. Available online: https://www.arcgis.com/apps/mapviewer/index.html?webmap=e27dedd8e9df46a89ca0e9e7cc3e201b (accessed on 8 February 2024).
  49. Menteri Lingkungan Hidup dan Kehutanan Republik Indonesia. Peraturan Menteri Lingkungan Hidup dan Kehutanan Republik Indonesia Nomor P.15/MENLHK/SETJEN/KUM.1/4/2019, Tentang Baku Mutu Emisi Pembangkit Listrik Tenaga Termal; Minister of Environment and Forestry of the Republic of Indonesia: Jakarta, Indonesia, 2019; pp. 1–56. [Google Scholar]
  50. IECM; Carnegie Mellon University; NETL. Pulverized Coal-Fired Power Plants and Air Pollution Controls; European Institute for Multidisciplinary Research: Brussels, Belgium, 2019. [Google Scholar]
  51. Bhown, A.S.; Freeman, B.C. Analysis and Status of Post-Combustion Carbon Dioxide Capture Technologies. Environ. Sci. Technol. 2011, 45, 8624–8632. [Google Scholar] [CrossRef] [PubMed]
  52. Hedriana, O. Assessment of CO2-EOR and Storage Capacity in South Sumatera and West Java Basins. Energy Procedia 2017, 114, 4666–4678. [Google Scholar] [CrossRef]
  53. Marbun, B.T.H.; Sinaga, S.Z.; Lie, H.S.; Promediaz, A.; Bandung, I.T. Northwest Java and East Natuna Field: Perspective To Apply Carbon Capture and Storage (CCS) in Indonesia. In Proceedings of the Carbon Management Technology Conference, Orlando, FL, USA, 7–9 February 2012. [Google Scholar] [CrossRef]
  54. IECM. Integrated Environmental Control Model (IECM) Version 11.5 (Carnegie Mellon University). Available online: https://www.cmu.edu/epp/iecm/index.html (accessed on 11 January 2024).
  55. IECM; Carnegie Mellon University; NETL. IECM Technical Documentation: Amine-Based Post Combustion CO2 Capture; European Institute for Multidisciplinary Research: Brussels, Belgium, 2019.
  56. Yang, B.; Wei, Y.M.; Hou, Y.; Li, H.; Wang, P. Life Cycle Environmental Impact Assessment of Fuel Mix-Based Biomass Co-Firing Plants with CO2 Capture and Storage. Appl. Energy 2019, 252, 113483. [Google Scholar] [CrossRef]
  57. Emenike, O.; Michailos, S.; Finney, K.N.; Hughes, K.J.; Ingham, D. Initial Techno-Economic Screening of BECCS Technologies in Power Generation for a Range of Biomass Feedstock. Sustain. Energy Technol. Assess. 2020, 40, 100743. [Google Scholar] [CrossRef]
  58. Zhai, H.; Mantripragada, H. A Technical and Economic Assessment of Advanced Carbon Capture Technologies. In Proceedings of the 14th International Conference on Greenhouse Gas Control Technologies, Melbourne, Australia, 21–25 October 2019. [Google Scholar]
  59. Zhao, L.; Xiao, Y.; Sims, K.; Wang, B.; Xu, X. Technical, Environmental, and Economic Assessment of Deploying Advanced Coal Power Technologies in the Chinese Context. Energy Policy 2008, 36, 2709–2718. [Google Scholar] [CrossRef]
  60. Wu, N.; Parsons, J.E.; Polenske, K.R. The Impact of Future Carbon Prices on CCS Investment for Power Generation in China. Energy Policy 2013, 54, 160–172. [Google Scholar] [CrossRef]
  61. Hu, B.; Zhai, H. The Cost of Carbon Capture and Storage for Coal-Fired Power Plants in China. Int. J. Greenh. Gas Control 2017, 65, 23–31. [Google Scholar] [CrossRef]
  62. Trading Economics Indonesia Interest Rate. Available online: https://tradingeconomics.com/indonesia/interest-rate (accessed on 4 September 2023).
  63. Bank of Indonesia. BI 7-Day (Reverse) Repo Rate. Available online: https://www.bi.go.id/id/statistik/indikator/bi-rate.aspx (accessed on 4 September 2023).
  64. Menteri Energi dan Sumber Daya Mineral Republik Indonesia. Peraturan Menteri Energi dan Sumber Daya Mineral Republik Indonesia Nomor, 139.K.HK.02/MEM.B/2021; Minister of Environment and Forestry of the Republic of Indonesia: Jakarta, Indonesia, 2021. [Google Scholar]
  65. Simangunsong, B.C.H.; Sitanggang, V.J.; Manurung, E.G.T.; Rahmadi, A.; Moore, G.A.; Aye, L.; Tambunan, A.H. Forest Policy and Economics Potential Forest Biomass Resource as Feedstock for Bioenergy and Its Economic Value in Indonesia. For. Policy Econ. 2017, 81, 10–17. [Google Scholar] [CrossRef]
  66. Charles, B.; Imangunsong, H.S.; Samuel, G.; Ilalahi, J.S.; Dida, M.; Aulana, G.M.; Itanggang, V.J.S.; Ganda, E.; Anurung, T.M.; Lias, E.E.; et al. Economic Value of Wood Processing Mill Residues as Feedstock for Bioenergy in Indonesia. J. Jpn. Inst. Energy 2019, 98, 110–114. [Google Scholar]
  67. PwC. Indonesian Pocket Tax Book; PwC: Jakarta, Indonesia, 2023. [Google Scholar]
  68. Gubernur Jawa Barat Republik Indonesia. Keputusan Gubernur Jawa Barat No. 561/Kep.732-Kesra/2021; Governor of West Java, Republic of Indonesia: Jakarta, Indonesia, 2022. [Google Scholar]
  69. Intratec Solutions LLC. Ammonia Price, Current, and Forecast. Available online: https://www.intratec.us/chemical-markets/ammonia-price (accessed on 31 January 2024).
  70. Intratec Solutions LLC. Monoethanolamine Price, Current and Historical. Available online: https://www.intratec.us/chemical-markets/monoethanolamine-price (accessed on 31 January 2024).
  71. Smith, E.; Morris, J.; Kheshgi, H.; Teletzke, G.; Herzog, H.; Paltsev, S. The Cost of CO2 Transport and Storage in Global Integrated Assessment Modeling. Int. J. Greenh. Gas Control 2021, 109, 103367. [Google Scholar] [CrossRef]
  72. Rubin, E.S. International Journal of Greenhouse Gas Control Understanding the Pitfalls of CCS Cost Estimates. Int. J. Greenh. Gas Control 2012, 10, 181–190. [Google Scholar] [CrossRef]
  73. PT PLN (Persero). Statistik PLN 2022; PT Perusahaan Listrik Negara: Jakarta, Indonesia, 2023. [Google Scholar]
  74. Statista. Cost of Electricity Generation from Coal in Indonesia from 2013 to 2022. Available online: https://www-statista-com.ezproxy.ugm.ac.id/statistics/1092956/indonesia-cost-of-electricity-generation-from-coal-2018/ (accessed on 30 January 2024).
  75. International Energy Agency; Nuclear Energy Agency. Projected Costs of Generating Electricity 2015 Edition; International Energy Agency: Paris, France, 2015. [Google Scholar]
  76. Minister Energy and Mineral Resources Republic of Indonesia; PT. PLN (Persero). Data Collection Survey on Power Sector in Indonesia; PT Perusahaan Listrik Negara: Jakarta, Indonesia, 2022. [Google Scholar]
  77. Shao, Y.; He, X.; Yang, C.; Zhu, Y.; Liu, C.; Shao, L.; Ni, Y. Techno-Economic Evaluation of CO2 Capture and Storage Retrofit in Decarbonizing Different Thermal Power Plants: A Case Study in China. Appl. Therm. Eng. 2024, 242, 122380. [Google Scholar] [CrossRef]
  78. The World Bank. State and Trends of Carbon Pricing 2022; The World Bank: Washington, DC, USA, 2022; ISBN 9781464818950. [Google Scholar]
  79. Statista. Carbon Tax Rates Worldwide as of 31 March 2023. Available online: https://www-statista-com.ezproxy.ugm.ac.id/statistics/483590/prices-of-implemented-carbon-pricing-instruments-worldwide-by-select-country/ (accessed on 5 February 2024).
  80. Kementerian Energi dan Sumber Daya Mineral Republik Indonesia. Peraturan Menteri ESDM, No. 16 Tahun 2022 Tata Cara Penyelenggaraan Nilai Ekonomi Karbon Subsektor Pembangkit Tenaga Listrik; Ministry of Energy and Mineral Resources of the Republic of Indonesia: Jakarta, Indonesia, 2022.
  81. Kementerian Energi dan Sumber Daya Mineral Republik Indonesia. Keputusan Menteri Energi dan Sumber Daya Mineral Republik Indonesia, No. 169.K/HK.02/MEM.M/2021; Ministry of Energy and Mineral Resources of the Republic of Indonesia: Jakarta, Indonesia, 2021.
Figure 1. Geographical location of the existing PC in the case study (modified from ref. [47]).
Sustainability 16 03423 g001
Figure 2. Position of the oil and gas field nearest to the case study location (modified from ref. [48]).
Sustainability 16 03423 g002
Figure 3. Diagram of the Indramayu CFPPs with existing and retrofitting technology (SCR, FGD, and CCS).
Sustainability 16 03423 g003
Figure 4. Graph of PC gross power and net power output without and with retrofitting of CCS technology.
Sustainability 16 03423 g004
Figure 5. Graph of PC efficiency and fuel flow rate without and with retrofitting of CCS technology.
Sustainability 16 03423 g005
Figure 6. Net emissions of CO2 without and with CCS retrofitting of PC.
Sustainability 16 03423 g006
Figure 7. Graph of capital required per environmental control technology in retrofitting CCS.
Sustainability 16 03423 g007
Figure 8. LCOE graph per component for various PC biomass co-firing scenarios without and with CCS retrofitting.
Sustainability 16 03423 g008
Figure 9. LCOE cost breakdown for various PC biomass co-firing scenarios without and with CCS retrofitting.
Sustainability 16 03423 g009
Figure 10. LCOE graph for various biomass co-firing PC scenarios without and with CCS retrofitting with varying fuel prices.
Sustainability 16 03423 g010
Figure 11. LCOE graph for various biomass co-firing PC scenarios without and with CCS retrofitting with varying carbon prices.
Sustainability 16 03423 g011
Table 1. Key techno-economic assumptions in the IECM.
ParameterUnitValueRefs.
Discount rate%10[62,63]
Sub-bituminous price (CIF)USD/ton65[64]
Wood pellet price (CIF)USD/ton115[65,66]
Effective tax rate%22[67]
Labor rate 1USD/hour5[68]
Number of Operating Shiftsshifts/day3[54]
Currency-Constant USD[54]
Year reportedyear2020[54]
Ammonia cost 2USD/ton393[69]
Amine cost 3USD/ton1190[70]
CO2 transportation 4USD/ton8.1[71]
CO2 storage 4USD/ton8.1[71]
Maximum generating
main steam (Constrain)
t/h969Commissioning test
1 Calculated from 5 times the regional minimum wage. 2 The highest value of ammonia prices in the South East Asia (SEA) region during 2018. 3 The highest value of MEA prices in China during 2018. 4 Based on 2020 USD.
Table 2. Biomass co-firing simulation scenarios with or without CCS in PC.
ScenarioDescriptionFuel
PC (WP 0%)PC (base case)Sub-bituminous
PC (WP 5%)PC (co-firing 5% wood pellets)Sub-bituminous + wood pellets
PC (WP 10%)PC (co-firing 10% wood pellets)Sub-bituminous + wood pellets
PC (WP 20%)PC (co-firing 20% wood pellets)Sub-bituminous + wood pellets
PC CCS (WP 0%)PC CCS (base case with CCS)Sub-bituminous
PC CCS (WP 5%)PC CCS (co-firing 5% wood pellets)Sub-bituminous + wood pellets
PC CCS (WP 10%)PC CCS (co-firing 10% wood pellets)Sub-bituminous + wood pellets
PC CCS (WP 20%)PC CCS (co-firing 20% wood pellets)Sub-bituminous + wood pellets
Table 3. Cost of CO2 avoided and captured at retrofitting PC CCS.
ItemUnitPC CCS (WP 0%)PC CCS (WP 5%)PC CCS (WP 10%)PC CCS (WP 20%)
Cost of CO2 avoidedUSD/t CO2107.281110.346111.799115.697
Cost of CO2 captured by CCUSD/t CO259.00060.33161.04762.634
Disclaimer/Publisher’s Note: The statements, opinions and data contained in all publications are solely those of the individual author(s) and contributor(s) and not of MDPI and/or the editor(s). MDPI and/or the editor(s) disclaim responsibility for any injury to people or property resulting from any ideas, methods, instructions or products referred to in the content.

