
Does the Water Rights Trading Policy Improve Water-Use Efficiency? An Environmental Policy Evaluation from China
School of Management, China University of Mining and Technology (Beijing), Beijing 100083, China
*
Author to whom correspondence should be addressed.
Sustainability 2024, 16(8), 3454; https://doi.org/10.3390/su16083454
Submission received: 3 March 2024
/
Revised: 3 April 2024
/
Accepted: 18 April 2024
/
Published: 20 April 2024
(This article belongs to the Special Issue Environmental Policy as a Tool for Sustainable Development)
Abstract
:As a crucial basic natural resource, water resources are the cornerstone for sustainable national economic development. This paper takes the 2014 pilot water rights trading policy (WRT) as an entry point and uses a difference-in-differences (DID) model to test the policy effect of WRT on water-use efficiency (WUE) based on panel data for 30 Chinese provinces from 2005 to 2021. The study shows that WRT can significantly improve the regional WUE, and these results remain valid after a series of robustness tests, such as the parallel trend test, placebo test, and PSM-DID. Mechanistic analysis revealed that WRT can produce the Porter effect, which affects the WUE through technological innovation. The results of the heterogeneity analysis based on the synthetic control method (SCM) showed that WRT effectively improved WUE in Jiangxi, Henan, Ningxia, Hubei, and Guangdong, but did not achieve the expected effect in Inner Mongolia or Gansu. This paper provides solid empirical support for assessing the effectiveness of WRT and accelerating the process of establishing a unified national WRT market in China by 2025.
1. Introduction
Approximately 4 billion people globally are facing severe water shortages [1]. Water scarcity and inefficient utilization have become global problems that hinder the sustainable development of national economies [2,3]. In response to the current situation, countries worldwide have also implemented several policies [4,5,6,7]. However, the public nature and scarcity of water resources often lead to a “Tragedy of the Commons”. In this case, the use of water rights trading as a market mechanism has become a key measure for solving the contradiction between supply and demand [8].
Since 1980, developed countries have gradually explored the exploration of water rights markets and achieved excellent performance [9]. In 2000, China’s first water rights trading incident in Zhejiang Province triggered widespread public concern [10]. In 2005, the Ministry of Water Resources (MWR) issued “Several Opinions on the Transfer of Water Rights”, which clarified the principles and scope of water rights trading [11]. In 2014, the central government proposed a sixteen-word policy for water management in the new period. In the same year, the MWR issued the “Notice on the Pilot Work of Water Rights”, in which seven provinces, namely, Jiangxi, Henan, Ningxia, Hubei, Guangdong, Inner Mongolia, and Gansu, were selected to carry out the pilot work of water rights trading [12]. The notice requires pilot provinces to carry out water rights reform under the premise of controlling total water consumption, forcing water resources to be used efficiently [13]. Subsequently, Shandong, Zhejiang, and other places began to explore water rights at the provincial level [14]. In 2016, the China Water Exchange was established in Beijing [15]. In 2021, the Outline of the Fourteenth Five-Year Plan explicitly proposed the development of water rights trading. In 2022, the Chinese government issued the “Guiding Opinions on Promoting the Reform of Water Rights”, proposing the initial establishment of a national unified water-use rights trading market by 2025 [16]. To date, all seven pilot provinces have been engaging in water rights trading for nearly 10 years. Therefore, has the pilot water rights trading policy (WRT) improved regional water-use efficiency (WUE)? This paper studies and analyses this topic.
Much of the current literature examining the effects of environmental equity trading policies still focuses primarily on carbon emission rights, sewage rights, energy rights, etc., while there are fewer studies on water rights trading policy. Zhang (2014) explored the positive economic effect of WRT through theoretical analysis and case verification based on analyzing the national situation of water shortages in China [17]. Ma et al. (2021) constructed a difference-in-differences (DID) model through three periods of microdata from 2007, 2012, and 2017 [18], and verified that water rights registration and trading are conducive to improving farmers’ irrigation behavior to produce water-saving effects. However, these three-period cross-sectional data cannot be used for parallel trend tests. Zhu et al. (2022) explored the positive impact of WRT on regional water quality and quantity by constructing a coupled water quality and quantity model [19]. By constructing a spatial difference-in-differences (SDID) model, Du et al. (2022) concluded that there are no spatial spillovers from policies on water rights trading [20]. Heaney et al. (2006) investigated the third-party effects of WRT in Australia and its countermeasures [21]. Fang et al. (2021) concluded that WRT helps to guarantee food security in China through the use of a DID model for estimation [22]. Liu et al. (2022) found that WRT can have an impact on Chinese corporate investment through two major mechanisms, namely, optimizing the allocation of resources and reducing corporate risk [23].
Overall, due to the late introduction of WRT in China, relatively few related studies exist. Although there is also literature focusing on the policy effects of WRT, it is not sufficient in terms of sample selection, mediation path tests, and heterogeneity analysis of different pilot provinces. In contrast, this paper may be innovative in the following aspects. First, this paper selects 17 periods of long-panel data of 30 Chinese provinces from 2005 to 2021 to obtain a more complete and updated sample, which further improves the unbiasedness and validity of the estimation results. By constructing the DID model, the overall average treatment effect and the long-term dynamic effect of WRT on WUE in seven pilot provinces can be effectively identified. In addition, this paper conducts a series of robustness tests, including a parallel trend test, placebo test, PSM-DID, etc., which are more adequate than those used in previous studies. Second, this paper explores the mediating pathway of WRT’s impact on WUE, i.e., technological innovation, which helps to complement the literature on the analysis of WUE impact mechanisms. Third, this paper innovatively introduces the synthetic control method (SCM) to the heterogeneity analysis of the seven pilot regions. Unlike previous studies that mostly divided the pilot provinces into eastern, central, and western regions for group regression, this paper uses SCM to simulate the virtual path of WUE change from 2005 to 2021 in the seven pilot provinces of Jiangxi, Henan, Ningxia, Hubei, Guangdong, Inner Mongolia, and Gansu to compare it with the actual path to realize heterogeneity analysis of the policy effects in each province. This provides a basis for the targeted implementation of WRT in the future in each pilot province. The results of this paper provide a reference for China to establish a national unified water rights trading market by 2025 to further realize the sustainable development of water resources.
2. Theoretical Mechanisms
To avoid the “Tragedy of the Commons”, water rights reform, based on confirming and registering the right to use water resources, further imposes an excessively progressive tariff on the excess use of water and empowers water users to transfer water savings within the scope of their rights [18]. On the one hand, water rights and excess progressive tariff levies strengthen water scarcity. The water subject, as a rational decision maker, will be prompted by the increase in the cost of water use to increase its awareness of water conservation, change its water-use mode, and improve the efficiency of water resource utilization [24,25]; on the other hand, the flow authority of the saved water further deepens the motivation of the water subject to conserve water and prompts further investment in water-saving technologies and profits through market transactions. Accordingly, the article proposes the following:
Hypothesis 1 (H1).
WRT improves WUE.
As a market-led environmental management system [26], WRT may enhance WUE through technological innovation and industrial structure upgrading. First, WRT may be used to improve WUE through technological innovation. Under the cost–control incentive mechanism, water users increase their investment in promoting technological innovation to minimize the loss caused by purchasing water rights indicators. In addition, the government can generate revenue from the reimbursable use of water resources, which in turn can lead to the research and development of water-saving technologies. Second, WRT may also enhance the WUE through industrial structure upgrading. At present, China’s agriculture accounts for more than 60% of the total water consumption, and the industrial and service sectors account for a relatively small amount [27] of the total water consumption. Problems such as large channel leakage loss and large water flood irrigation have led to low agricultural WUE and serious waste of water resources in China [28]. Through water rights trading, farmers can be prompted to improve their awareness of water conservation, adopt more efficient irrigation methods, and transfer saved water resource indicators to industries with higher WUE to improve the overall regional WUE. Accordingly, the article proposes the following:
Hypothesis 2 (H2).
WRT improves WUE through technological innovation.
Hypothesis 3 (H3).
WRT improves WUE through industrial structure upgrading.
Summarizing the above analysis, the theoretical mechanism of this paper is shown in Figure 1.
3. Materials and Methods
3.1. Model Setting
The DID model is a commonly used model for evaluating policy effects [29]; this model divides the experimental subjects into treatment and control groups. When the two groups satisfy the parallel trend assumption, the average treatment effect of the policy can be measured. The “Notice on the Pilot Work of Water Rights” issued in 2014 constitutes a “quasi-natural experiment”. On this basis, this study intends to select seven pilot provinces as the treatment group and other provinces as the control group and analyze the policy effects of WRT using the set DID model:
where i denotes the province, t denotes the year, and W is the water-use efficiency of a province. This paper adopts water consumption per unit of GDP as a metric; treat is a dummy variable for WRT; if a province has carried out a pilot of water rights trading, then treat = 1, and, vice versa, treat = 0; post is a time dummy variable; if the year is 2014 or after 2014, then post = 1, and, vice versa, post = 0; X represents the control variables affecting regional water-use efficiency, specifically including economic development level, water resource endowment, industrial structure, and trade openness; and represent fixed effects at the province and time level, respectively; and represents the residual term. In Equation (1), the core explanatory variable is . A negative indicates that WRT can enhance the regional WUE.
3.2. Sample and Data
Given the problems of data availability and missing data, this article excludes the sample cases of Hong Kong, Macao, Taiwan, and Tibet and finally selects panel data for 30 Chinese provinces from 2005 to 2021 for analysis. All of the data were obtained from the China Statistical Yearbook. And all of the variables were logarithmized in this paper to avoid excessive data fluctuations. Moreover, all of the price-related data in this paper were deflated with 2005 as the base period.
3.3. Variable Selection
3.3.1. Dependent Variable
The dependent variable is water-use efficiency. In this paper, the water consumption per unit of GDP is chosen for measurement. This indicator can be calculated by dividing the total regional water supply by the regional GDP; it reflects the water consumed per unit of GDP produced during the economic activities of a certain region, and it is an important indicator reflecting the regional WUE.
3.3.2. Independent Variable
The independent variable is the water rights trading policy. This paper assigns values to the variables for each province based on the “Notice on the Pilot Work of Water Rights” issued by the MWR. If a province has carried out a pilot WRT in the current year, the value is 1; otherwise, the value is 0.
3.3.3. Control Variables
3.3.4. Channel Variables
This paper selects technological innovation and industrial structure upgrading as channel variables. Technological innovation is measured by R&D expenditure per capita for industrial enterprises above a designated size. Industrial structure upgrading builds upon Yu et al. (2021) [31] and is characterized by assigning values to three subindustries and weighting them to obtain the industrial structure hierarchy coefficient. The calculation formula is as follows.
where represents the proportion of value added of industry i in GDP. The descriptive statistics of the variables are shown in Table 1.
4. Results and Discussion
4.1. Benchmark Regression Results
This article uses the DID model to test hypothesis 1, and Table 2 shows the regression results. Column (1) in the table does not incorporate control variables but simply controls for time-fixed effects and province-fixed effects; column (2) further incorporates control variables on top of column (1) as a way of avoiding possible bias in the results. The regression coefficients of WRT are significantly negative regardless of the inclusion of control variables, indicating that WRT can effectively improve WUE. By analyzing the regression results with the inclusion of control variables, it can be found that the regression coefficient of the WRT is −0.0077, which indicates that the water consumption per unit of GDP in the pilot provinces decreases by 0.77% compared with that in the nonpilot provinces. The statistical results in Table 2 verify hypothesis 1; that is, WRT can improve WUE.
According to the regression results for the control variables, the coefficient of the economic development level is significantly negative at the 1% significance level, which indicates that the economic development level can effectively improve the regional WUE. A possible reason is that economic development provides the necessary conditions and motivation, such as capital and technology, for the protection of water conservation; the coefficient of water resource endowment is significantly positive at the 1% significance level, which indicates that the better the regional water resource endowment is, the lower the WUE. This may be because, in areas with better water endowments, people are less aware of water conservation, and there is wastage of water; the industrial structure coefficient at the 1% significance level is significantly negative, indicating that an increase in the proportion of value added by secondary industry can effectively improve the WUE. This phenomenon may be because, compared with agriculture, which accounts for the vast majority of China’s total water consumption, the industry consumes less water and is more efficient in terms of water use. The trade openness coefficient at the 1% significance level is significantly negative, indicating that increased openness to the outside world can help further increase regional WUE. This may be because international trade agglomerations generate technological spillovers, which positively affect WUE.
4.2. Robustness Tests
4.2.1. Parallel Trend Test
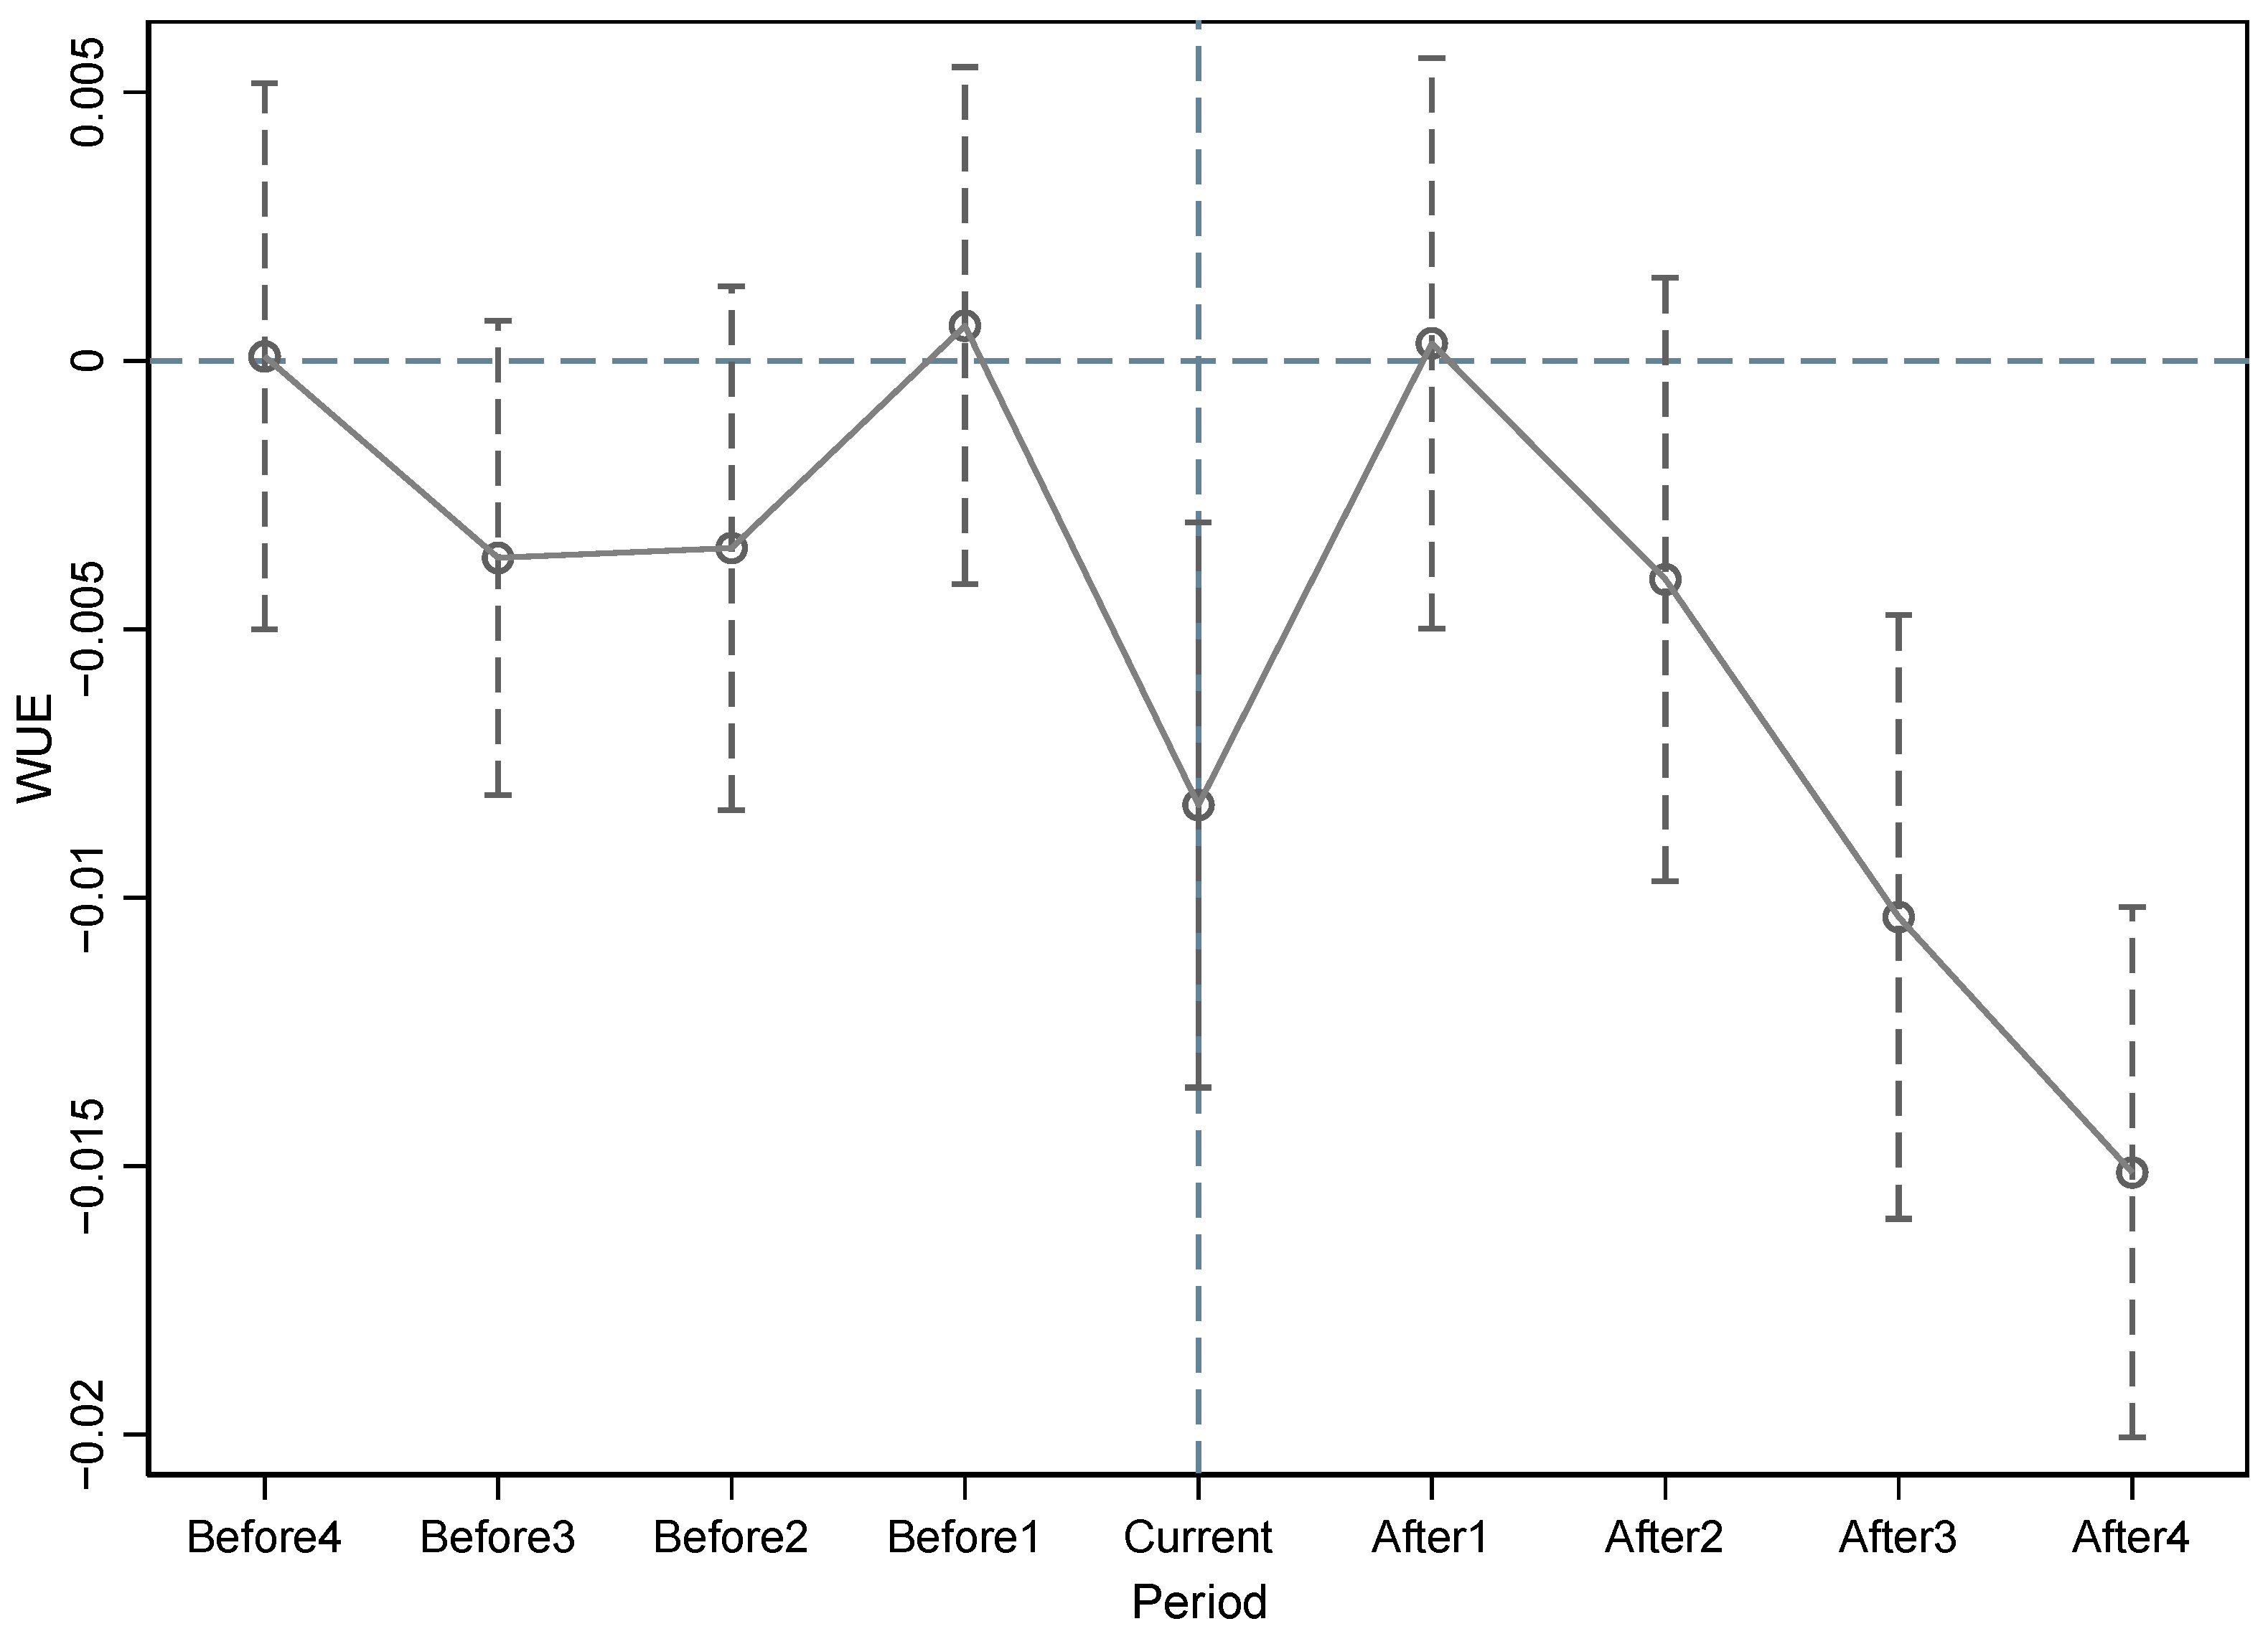
Before the DID model is applied, a parallel trend test is required [32]. In this paper, the dynamic effects model is used to test for parallel trends. The approach is to take the policy implementation in 2014 as the midpoint so that the policy window is moved forward and backward by one, two, three, and four years and analyze the effect of the policy by observing the changes in the coefficients of the independent variables. The dynamic effects are modeled as follows.
where n is the distance between the policy release time and 2014. To study the dynamic effects in the year of policy release and the 4 years before and after the policy release, n is used as an independent variable, and the rest of the variables are consistent with the meaning of Equation (1). According to the analysis in Figure 2, the regression coefficient fluctuates around the 0-axis in the first 4 years of the policy, indicating that there is no significant difference between the WUE of the two groups; the regression coefficients decreased significantly in 2014, indicating that the WUE in the pilot provinces improved significantly after policy implementation compared to that in the nonpilot provinces. However, the effect disappears after 1 year of policy implementation, which indicates that the effect is not stable enough and is recurrent. After 3 years of policy implementation, the effect becomes significant again and continues to improve in the fourth year, which indicates that there is a time lag in the improvement of WUE. At the overall level, there was a parallel trend between the two groups before 2014, and after the implementation of the policy, the pilot provinces significantly improved their WUE, which satisfied the parallel trend hypothesis.
4.2.2. Placebo Test
Drawing on the approach of Chetty et al. (2009) [33], we exclude the interference of omitted variables by randomly selecting pilot provinces for a placebo test of the model [34]. Specifically, this paper constructs dummy variables for “pseudo-WRT” by randomly generating a list of pilot provinces among all provinces. This process is repeated 500 times to obtain 500 values of based on Equation (1); then, the kernel density distribution of is plotted, as shown in Figure 3. The estimated coefficients generated based on random samples are distributed approximately 0 and follow a normal distribution. The estimated coefficients obtained from the benchmark regression results of this article are far from 0, proving that the placebo test is passed.
4.2.3. PSM-DID Model
To avoid the endogeneity problem caused by sample selection bias [35], this paper re-estimates the policy effects after matching the data with propensity scores using the caliper matching method. Before propensity score matching, a balancing test was needed. The results of the balance test reveal that the absolute value of the standardized deviation of each matched variable is less than 10%. Moreover, the t-test results for all control variables after matching do not support the original hypothesis; that is, there is no significant difference between the two groups after matching. This indicates that the matching method in this paper is appropriate and achieves a better matching effect. Column (1) of Table 3 shows the estimation results for PSM-DID. The results show that the estimated coefficients of WRT are significantly negative at the 10% level, which further validates the conclusion that WRT can effectively improve the regional WUE.
4.2.4. Other Robustness Tests
- (1)
- Expected effects test
Examining the expected effects of policy implementation is critical for analyzing the robustness of the regression results. Before the start of the WRT pilot, provinces may have made preparations for the policy in advance. To address this situation, this paper adds the WRT variable of the preceding period to the baseline regression. As shown in column (2) of Table 3, the estimated coefficients and significance of WRT are generally consistent with the original regression results, while the regression coefficients of pre-WRT are not significant. The above results prove that the expectation for WRT does not influence the estimation results in this paper.
- (2)
- Controlling for other policy impacts
The introduction of other major national water resources management policies is also likely to improve WUE, which may lead to a bias in our estimate of the effect of the WRT. In 2016, Hebei Province took the lead in launching a pilot water resources tax collection. In 2017, the state further extended its pilot scope to include the following nine provinces: Beijing, Tianjin, Shanxi, Inner Mongolia, Shandong, Henan, Sichuan, Shaanxi, and Ningxia, ultimately forming a new pattern of “1 + 9” pilots [36]. To avoid the possibility that the dummy variables we set for the WRT may contain shocks from the water resources tax policy, we need to further exclude the interference of this policy to conduct robustness tests. Based on this, this paper rearranges the regression after excluding the sample that carries out the water resources tax pilot, and the regression results are shown in column (3) of Table 3. After excluding the impact of the water resources tax policy, the WRT is still effective at enhancing the WUE of the pilot area at the 1% significance level, which indicates that the baseline regression results in this paper are robust.
- (3)
- Excluding the impact of provincial water rights pilots
After the implementation of the central WRT, the 10 provinces of Shandong, Zhejiang, Xinjiang, Fujian, Liaoning, Hebei, Hunan, Shaanxi, Shanxi, and Jilin established their own provincial water rights reform policy pilots that are in line with the development characteristics of their regions. Failure to consider the impact of provincial water rights pilots may lead to an underestimation of the effect of the central water rights trading policy. Accordingly, this paper excludes provinces with provincial water rights pilots from the control group for regression, and column (4) of Table 3 shows the results. After excluding the effect of the provincial water rights pilots, WRT still significantly improved WUE at the 1% significance level. Moreover, the regression coefficient changes from −0.0077 to −0.0118, which further strengthens the impact effect and indicates that the effect of the national provincial water rights pilots is greater than that of the provincial water rights pilots.
- (4)
- Replacing the dependent variable
The water consumption of 10 thousand RMB of industrial added value is regressed as a dependent variable to measure WUE and column (5) of Table 3 shows the results. After the dependent variable was replaced, the WRT still significantly improved the WUE, indicating that the benchmark regression results were robust.
- (5)
- Inclusion of benchmark variables to mitigate selection effects
When applying the DID model, the list of provinces for the WRT pilot would ideally be randomly selected. If the selection of pilot provinces is correlated with benchmark variables such as regional water resources, population, and economic development, this may lead to estimation bias over time. To avoid the effect of nonrandom selection, this paper includes total water supply, year-end population, and GDP as proxy variables for the baseline variable in the regression of Equation (1), and the results are shown in column (6) of Table 3. After adding the interaction term between the benchmark variable and the linear trend in time, WRT passes the test at the 5% significance level, indicating that the policy can significantly improve WUE, which is consistent with the results of the benchmark regression.
5. Mechanism and Heterogeneity Analysis
5.1. Mechanism Analysis
In this section, the path of the impact of WRT on WUE is further investigated through a mechanism test. The causal step method proposed by Baron et al. (1986) is utilized to test the specific mechanism of enhancement from two perspectives [37]: technological innovation and industrial structure upgrading. The model is set as follows:
where represents the channel variables in this paper, which are the R&D expenditure per capita for industrial enterprises above the designated size and the industrial structure hierarchy coefficient. If in Equation (3) and and in Equation (4) are significant, then WRT can improve WUE through this channel variable. Conversely, the variable is not a channel variable.
In Table 4, columns (1) and (2) test whether WRT can achieve WUE enhancement through technological innovation. Column (1) shows that WRT significantly improves technological innovation; that is, WRT can generate the Porter effect to promote technological innovation and development. In column (2), both the WRT coefficients and the technological innovation coefficients are significantly negative, indicating that WRT can enhance WUE through technological innovation. Thus, hypothesis 2 can be tested. Columns (3) and (4) of Table 4 test whether industrial structure upgrading is a suitable channel variable. Column (3) shows that WRT positively contributes to regional industrial structure upgrading at the 1% significance level. However, in column (4), the regression coefficient of industrial structure upgrading is not significant, which indicates that it is not a suitable mechanism variable; thus, hypothesis 3 is rejected. In summary, the enhancement effect of WRT on WUE is realized mainly through technological innovation.
After the directional analysis of the impact path, this paper draws on Hicks et al. (2011) to further quantify the direct and indirect effects of WRT on WUE [38], and Table 4 shows the results. The direct effect is −0.0059, and the mediated effect is −0.0018. Among them, the mediated effect accounts for 23.38% of the total effect. This indicates that 23.38% of WRT’s effect on WUE is realized through technological innovation.
5.2. Heterogeneity Analysis
Drawing on Ji et al. (2021) [39], the SCM is used to study the policy effects in different provinces. To maintain consistency with the previous paper, this paper takes 2005–2021 as the policy study interval, chooses all the control variables as predictor variables, takes 23 nonpilot provinces as the control group, and synthesizes the water consumption per unit of GDP of seven pilot provinces according to different weights. Trends in the logarithm of water consumption per unit of GDP in the pilot and synthetic pilot provinces are shown in Figure 4, with the dashed line representing the year 2014, when WRT was initiated.
Figure 4 shows that WRT effectively reduces water consumption per unit of GDP in Jiangxi, Henan, Ningxia, and Hubei, i.e., it improves WUE; however, in Guangdong, the effect is not as obvious, although consumption has decreased. A possible reason is that Guangdong Province has a developed economy, a stable water-use structure, and advanced water-saving technologies, so the room for improvement and effect of the WRT are not obvious. In addition, the region has relatively abundant water resources, and water consumption has not yet reached the “ceiling” level. Therefore, the demand and enthusiasm for WRT are insufficient, and the market is limited; it is worth noting that after the pilot of WRT, the expected results were not achieved in Inner Mongolia and Gansu. First, related to the structure of water use in the province, Inner Mongolia and Gansu have absolute proportions of water used for agriculture, while industry and services are less developed and consume less water. Water rights transactions are mainly concentrated among agricultural irrigation water users, and the number of water rights transactions transferred to industry and services is relatively small; thus, temporary borrowing of water rights between farmers has no significant impact on WUE. Second, the original water diversion program is no longer adaptable to the current water-use situation in Inner Mongolia and Gansu, and the water resource monitoring and measurement system has not yet improved, resulting in a large amount of water resources being overutilized. Under strict control of total water resources, the continued implementation of the original water-sharing program will lead to the coexistence of WRT and water resource overuse, which will lead to a situation that contradicts the expected effect of WRT.
Overall, WRT effectively improved the WUE in most of the pilot provinces and achieved better policy effects. However, as shown in Figure 4, the effect declined in all provinces until 2020, and the sustainability of WRT needed to be strengthened.
6. Conclusions and Outlook
6.1. Conclusions and Recommendations
Taking the 2014 WRT policy pilot as an entry point, this paper constructs a DID model to assess the impact of WRT on WUE based on 17 periods of panel data from 30 provinces across China from 2005 to 2021. (1) WRT can significantly improve WUE and reduce water consumption per unit of GDP by 0.77%. This conclusion still holds after the parallel trend test, placebo test, PSM-DID, and a series of other robustness tests. (2) The results of the mechanism analysis show that WRT can produce the Porter effect, which promotes the regional WUE mainly through technological innovation. (3) The results of the heterogeneity test based on the SCM showed that WRT effectively improved the WUE in Jiangxi, Henan, Ningxia, Hubei, and Guangdong but did not achieve the expected effect in Inner Mongolia or Gansu.
Based on the aforementioned findings, this paper derives several policy recommendations. (1) The WRT system should be further improved, and the construction of a unified national WRT market should be accelerated. The construction of water rights storage and transfer centers, water ecological banks, and other operating platforms should be coordinated, and innovative water rights trading financial products and trading models, such as water options and water futures, should be developed to further guide different water subjects to fulfill various forms of WRT. (2) Increase the intensity of capital investment in water-saving technologies, improve the reuse rate of water resources in industrial enterprises, reduce wastewater discharge; change crude irrigation methods in agriculture, and focus on the research and development of new water-saving irrigation equipment. (3) Improve the water resources monitoring and measurement system. Water resource monitoring and measurement are the basis for water rights trading. China should gradually establish central, basin, and local water resources monitoring and management platforms; improve water rights regulatory mechanisms; and eliminate the phenomenon of overuse of water resources. (4) Water rights trading should follow the principle of local adaptation. The government should rationally design trading modes and paths in response to the natural and social conditions of different regions to realize the efficient use of water resources and sustainable development.
6.2. Research Outlook
6.2.1. Synergies between Water Rights Trading Policy and Water Resources Tax Policy
As a public natural resource, water resources are prone to overconsumption and inefficiency in the process of development and utilization. There are three models for improving WUE: government-led, market-led, and public-led. In China, the current stage is government-led. Under the government-led model, there are usually two means to improve WUE: one is the property rights approach mentioned in this paper, i.e., intensive use of water resources through water-use rights, and the other is the Pigouvian tax, i.e., levying water resources tax. In China, WRT is still in the initial exploration stage. In the future, the questions of how to arrange the implementation direction of WRT and how to realize the coordination between WRT and water resources tax policy need to be further studied.
6.2.2. Exploring International Water Rights Trading
This paper examines the implementation of WRT in China, and the research horizon is not extended to other regions in Asia/the world, which may lead to some limitations of this paper. Currently, China’s WRT is still in the early stages, and the pilot policy may have had some positive spillover effects on neighboring provinces and municipalities. It is expected that, after China builds a unified national WRT market by 2025, exploring WRT with neighboring countries to establish a broader international WRT market may become the next development trend. This may become an effective way to solve transnational river disputes, thus realizing the sustainable development and utilization of transnational river basins and the coordinated development of neighboring countries’ economies by market means. The prosperity of international WRT cannot be separated from the coordination of countries, which need to clarify the relationship between national sovereignty and water rights, establish “basin-wide thinking” and focus on long-term interests. How to explore international WRT and establish a broader Asia/World unified WRT market requires further research.
It is worth noting that although WRT is currently effective in improving regional WUE in China with good policy outcomes, this does not mean that it is equally applicable to other countries. To fully utilize the advantages of WRT, there must be prerequisites such as water demand exceeds supply, good institutional arrangements, social and cultural acceptance, and sustained sources of funding. Whether WRT applies to other countries and its consequences need to be analyzed on a country-by-country basis. However, regardless of the applicability of WRT, it is the responsibility of each country to explore nationally appropriate ways to enhance WUE for the sustainable development of water resources.
Author Contributions
Conceptualization, N.H.; methodology, N.H.; software, N.H.; validation, N.H.; formal analysis, N.H.; resources, N.H.; data curation, N.H.; writing—original draft preparation, N.H.; writing—review and editing, N.H., Y.S. and R.D.; visualization, N.H.; supervision, Y.S.; project administration, R.D.; funding acquisition, R.D. All authors have read and agreed to the published version of the manuscript.
Funding
This research was supported by the National “14th Five-Year Plan” Key Research and Development Program of China, grant number 2022YFF0607404.
Institutional Review Board Statement
Not applicable.
Informed Consent Statement
Informed consent was obtained from all the subjects involved in the study.
Data Availability Statement
The data and estimation commands that support the findings of this paper are available upon request from the first and corresponding authors.
Conflicts of Interest
The authors declare no conflicts of interest.
References
- Mekonnen, M.M.; Hoekstra, A.Y. Four billion people facing severe water scarcity. Sci. Adv. 2016, 2, 6. [Google Scholar] [CrossRef]
- Vörösmarty, C.J.; Hoekstra, A.Y.; Bunn, S.E.; Conway, D.; Gupta, J. What scale for water governance? Science 2015, 349, 478–479. [Google Scholar] [CrossRef] [PubMed]
- Zhou, X.Y.; Yang, Y.H.; Sheng, Z.P.; Zhang, Y.Q. Reconstructed natural runoff helps to quantify the relationship between upstream water use and downstream water scarcity in China’s river basins. Hydrol. Earth Syst. Sci. 2019, 23, 2491–2505. [Google Scholar] [CrossRef]
- Kampas, A.; Petsakos, A.; Rozakis, S. Price induced irrigation water saving: Unraveling conflicts and synergies between European agricultural and water policies for a Greek Water District. Agric. Syst. 2012, 113, 28–38. [Google Scholar] [CrossRef]
- Wheeler, S.; Loch, A.; Zuo, A.; Bjornlund, H. Reviewing the adoption and impact of water markets in the Murray-Darling Basin, Australia. J. Hydrol. 2014, 518, 28–41. [Google Scholar] [CrossRef]
- Zanjanian, H.; Abdolabadi, H.; Niksokhan, M.H.; Sarang, A. Influential third party on the water right conflict: A Game Theory approach to achieve the desired equilibrium (case study: Ilam dam, Iran). J. Environ. Manag. 2018, 214, 283–294. [Google Scholar] [CrossRef] [PubMed]
- Karunananthan, M. Can the human right to water disrupt neoliberal water policies in the era of corporate policy-making? Geoforum 2019, 98, 244–253. [Google Scholar] [CrossRef]
- Sun, Y.Y.; Jia, S.F. Basis for granting water rights and classification of water rights. Res. Sci. 2016, 38, 1893–1900. [Google Scholar]
- Hanemann, M.; Young, M. Water rights reform and water marketing: Australia vs. the US West. Oxf. Rev. Econ. Policy 2020, 36, 108–131. [Google Scholar] [CrossRef]
- Chen, X.N.; Wu, F.P.; Li, F.; Zhao, Y. Tradable water in Inner Mongolia’s river-loop irrigation district under a high-quality development model. China Pop. Res. Environ. 2021, 31, 130–139. [Google Scholar]
- Zhang, J.B.; Li, M.Y.; Zhu, X.M. “Quality for Quantity”: A New Dimension of Water Rights Trading Reform-Logical Origins, Explanation of Elements, Practical Conditions and Institutional Safeguards. West. Forum 2019, 29, 93–100. [Google Scholar]
- Wei, J. Exploration of water rights trading in China. Prop. Rights Guid. 2014, 12, 56–58. [Google Scholar]
- Zhang, H.Q.; Zhou, Q.; Zhang, C.J. Evaluation of agricultural water-saving effects in the context of water rights trading: An empirical study from China’s water rights pilots. J. Clean. Prod. 2021, 313, 8. [Google Scholar] [CrossRef]
- Liu, S.Q.; Guo, S.J.; Lin, R.; Ju, D. Characteristics of China’s water rights system and exploration of water rights reforms. J. Eng. Guid. 2016, 8, 12–22. [Google Scholar]
- Liu, Y.M. The development of water rights trading in China and its pilot promotion effect. J. Econ. Water Resour. 2023, 41, 43–50+124. [Google Scholar]
- Hao, C.X.; Dong, Z.F.; Cheng, C.Y.; Long, F.; Li, X.L.; Ge, C.Z. National Environmental Economic Policy Progress Assessment Report 2022. Chinese J. Environ. Manag. 2023, 15, 58–65. [Google Scholar]
- Zhang, J.B. Positive Economic Effects of Water Rights Trading: Theoretical Analysis and Practical Verification. Rur. Econ. 2014, 3, 107–111. [Google Scholar]
- Ma, J.J.; Cui, Y.; Kong, X.Z.; Chen, Z.G. Water Rights System, Water Abstraction Permit Management and Adoption of Water Saving Technologies by Farmers-An Empirical Study of the Water Saving Effect of Water Rights Reform Based on Differential Modeling. Stat. Res. 2021, 38, 116–130. [Google Scholar]
- Zhu, J.; Chen, Y.P.; Liu, C. Impact of water rights trading policies on regional water quality and quantity. China Pop. Res. Environ. 2022, 32, 145–153. [Google Scholar]
- Du, M.; Huang, C.; Chen, Z. Evaluating the water-saving and wastewater-reducing effects of water rights trading pilots: Evidence from a quasi-natural experiment. J. Environ. Manag. 2022, 319, 115706. [Google Scholar] [CrossRef]
- Heaney, A.; Dwyer, G.; Beare, S.; Peterson, D.; Pechey, L. Third-party effects of water trading and potential policy responses. Aust. J. Agr. Resour. Econ. 2006, 50, 277–293. [Google Scholar] [CrossRef]
- Fang, L.; Fu, Y.; Chen, S.J.; Mao, H. Can water rights trading pilot policy ensure food security in China? Based on the difference-in-differences method. Water Policy 2021, 23, 1415–1434. [Google Scholar] [CrossRef]
- Liu, D.; Yu, N.Z.; Wan, H. Does water rights trading affect corporate investment? The role of resource allocation and risk mitigation channels. Econ. Model. 2022, 117, 16. [Google Scholar] [CrossRef]
- Blakeslee, D.; Fishman, R.; Srinivasan, V. Way Down in the Hole: Adaptation to Long-Term Water Loss in Rural India. Am. Econ. Rev. 2020, 110, 200–224. [Google Scholar] [CrossRef]
- Pashigian, B.P. A theory of prevention and legal defense with an application to the legal costs of companies. J. Law Econ. 1982, 25, 247–270. [Google Scholar] [CrossRef]
- Svensson, J.; Wang, Y.H.; Garrick, D.; Dai, X.P. How does hybrid environmental governance work? Examining water rights trading in China (2000–2019). J. Environ. Manag. 2021, 288, 11. [Google Scholar] [CrossRef]
- Fang, L.; Zhang, L. Does the trading of water rights encourage technology improvement and agricultural water conservation? Agric. Water Manag. 2020, 233, 8. [Google Scholar] [CrossRef]
- Zhang, B.P. Analysis of large water flood irrigation and drip irrigation conversion adjustment in Jingdian Irrigation District. Agric. Sci. Tech. Info. 2022, 14, 26–28. [Google Scholar]
- Perraillon, M.C.; Lindrooth, R.; Welton, J.M. Difference-in-Difference Research Designs. Nurs. Econ. 2019, 37, 328–331. [Google Scholar]
- Tian, G.L.; Sheng, Y.; Lu, X. Study on the Impact of Water Rights Trading Market Operation on Water Resource Utilization Efficiency in Pilot Areas. China Pop. Res. Environ. 2020, 30, 146–155. [Google Scholar]
- Yu, X.; Wang, P. Economic effects analysis of environmental regulation policy in the process of industrial structure upgrading: Evidence from Chinese provincial panel data. Sci. Total Environ. 2021, 753, 10. [Google Scholar] [CrossRef] [PubMed]
- Ryan, A.M.; Kontopantelis, E.; Linden, A.; Burgess, J.F. Now trending: Coping with non-parallel trends in difference-in-differences analysis. Stat. Methods Med. Res. 2019, 28, 3697–3711. [Google Scholar] [CrossRef]
- Chetty, R.; Looney, A.; Kroft, K. Salience and Taxation: Theory and Evidence. Am. Econ. Rev. 2009, 99, 1145–1177. [Google Scholar] [CrossRef]
- Tian, J.J.; Liu, Y.J. Effectiveness of location selection of China’s FDI for financial well-being: Role of digitalization. Transform. Bus. Econ. 2023, 22, 250–273. [Google Scholar]
- Eckert, C.; Hohberger, J. Addressing Endogeneity Without Instrumental Variables: An Evaluation of the Gaussian Copula Approach for Management Research. J. Manag. 2023, 49, 1460–1495. [Google Scholar] [CrossRef]
- Zhao, A.F.; Zhang, Y.X. An Analysis of the Impact of Water Resources Tax on Water Consumption and Water Use Efficiency—A Natural Experiment Based on the Expansion of Water Resources Tax Pilot Scheme. Tax. Res. 2021, 2, 35–41. [Google Scholar]
- Baron, R.M.; Kenny, D.A. The moderator-mediator variable distinction in social psychological research: Conceptual, strategic, and statistical considerations. J. Pers. Soc. Psy. 1986, 51, 1173–1182. [Google Scholar] [CrossRef] [PubMed]
- Hicks, R.; Tingley, D. Causal mediation analysis. Stata J. 2011, 11, 605–619. [Google Scholar] [CrossRef]
- Ji, X.L.; Yang, Z. Analysis of Carbon Trading Emission Reduction Effect and Regional Differences Based on PSM-DID and SCM. Statut. Declar. 2021, 37, 154–158. [Google Scholar]
Figure 1.
Theoretical mechanism of the impact of WRT on WUE.

Figure 2.
Parallel trend test results. Note: The circles in the figure represent the estimated coefficients of the dynamic effects of the pilot WRT, and the dashed lines are the upper and lower 90% confidence intervals.
Figure 2.
Parallel trend test results. Note: The circles in the figure represent the estimated coefficients of the dynamic effects of the pilot WRT, and the dashed lines are the upper and lower 90% confidence intervals.

Figure 3.
Placebo test results. Note: The dashed part represents the estimated coefficient (−0.0077) obtained from the results of the benchmark regression in this paper.
Figure 3.
Placebo test results. Note: The dashed part represents the estimated coefficient (−0.0077) obtained from the results of the benchmark regression in this paper.

Figure 4.
Heterogeneity analysis. Note: The x-axis represents years, and the y-axis represents the logarithm of water consumption per unit of GDP.
Figure 4.
Heterogeneity analysis. Note: The x-axis represents years, and the y-axis represents the logarithm of water consumption per unit of GDP.


Table 1.
Descriptive statistics.
| Variable Type | Variables | Symbol | Mean | SD | Min | Max | Median |
|---|---|---|---|---|---|---|---|
| Dependent variable | Water-use efficiency (water consumption per unit of GDP) | WUE | 206.1999 | 233.6903 | 16.0326 | 1952.6225 | 135.6421 |
| Independent variable | Water rights trading policy (1 if a province pilots a water rights trading policy, 0 otherwise) | WRT | 0.2333 | 0.4234 | 0.0000 | 1.0000 | 0.0000 |
| Control variables | Economic development level (real GDP per capita) | economic | 3.6607 | 2.3115 | 0.5306 | 13.4626 | 3.1201 |
| Water resource endowment (water supply per capita) | water | 506.3816 | 418.2610 | 161.2000 | 2657.4000 | 436.1500 | |
| Industrial structure (share of value added of the secondary industry in GDP) | industrial | 44.5576 | 8.7548 | 15.8337 | 61.4777 | 45.9142 | |
| Trade openness (total exports and imports/GDP) | openness | 0.2874 | 0.3237 | 0.0071 | 1.7085 | 0.1486 | |
| Channel variables | Technological innovation (R&D expenditure per capita for industrial enterprises above designated size) | technology | 642.9264 | 630.5500 | 10.2670 | 3194.0084 | 398.4043 |
| Industrial structure upgrading (industrial structure hierarchy coefficient) | upgrade | 2.3426 | 0.1346 | 2.0722 | 2.8357 | 2.3205 |
Table 2.
Benchmark regression results.
| Variable | WUE | |
|---|---|---|
| (1) | (2) | |
| WRT | −0.0224 ** | −0.0077 *** |
| (−2.49) | (−3.75) | |
| economic | −0.8570 *** | |
| (−9.47) | ||
| water | 0.8500 *** | |
| (24.74) | ||
| industrial | −0.2340 *** | |
| (−6.54) | ||
| openness | −0.4188 *** | |
| (−11.30) | ||
| _cons | 5.7090 *** | 2.3552 *** |
| (3.23 × 10¹⁴) | (8.63) | |
| Year FE | Yes | Yes |
| Province FE | Yes | Yes |
| N | 510 | 510 |
| Adjusted R2 | 0.9709 | 0.9932 |
Note: Values in parentheses are t-test values; ***, and ** indicate significance at the 1%, and 5% levels, respectively.
Table 3.
Robustness test results.
| Variable | WUE | |||||
|---|---|---|---|---|---|---|
| (1) | (2) | (3) | (4) | (5) | (6) | |
| WRT | −0.0040 * | −0.0073 *** | −0.0122 *** | −0.0118 *** | −0.0453 * | −0.0099 ** |
| (−2.04) | (−3.79) | (−3.28) | (−3.44) | (−1.80) | (−2.36) | |
| pre-WRT | −0.0004 | |||||
| (−0.31) | ||||||
| _cons | 2.3396 *** | 2.3552 *** | 2.7433 *** | 2.7416 *** | 2.8146 ** | 2.6828 *** |
| (9.66) | (8.63) | (11.54) | (10.42) | (2.40) | (9.56) | |
| Control variables | Yes | Yes | Yes | Yes | Yes | Yes |
| Baseline variable × time trend | No | No | No | No | No | Yes |
| Year FE | Yes | Yes | Yes | Yes | Yes | Yes |
| Province FE | Yes | Yes | Yes | Yes | Yes | Yes |
| N | 480 | 510 | 340 | 320 | 510 | 510 |
| Adjusted R2 | 0.9935 | 0.9932 | 0.9935 | 0.9940 | 0.8778 | 0.9940 |
Note: Values in parentheses are t-test values; ***, **, and * indicate significance at the 1%, 5%, and 10% levels, respectively.
Table 4.
Mechanism test results.
| Variable | Technology | WUE | Upgrade | WUE |
|---|---|---|---|---|
| (1) | (2) | (3) | (4) | |
| WRT | 0.1356 * | −0.0059 ** | 0.0042 *** | −0.0070 ** |
| (1.82) | (−2.61) | (4.91) | (−2.83) | |
| Technology | −0.0133 * | |||
| (−2.08) | ||||
| upgrade | −0.1558 | |||
| (−1.12) | ||||
| _cons | −5.1310 | 2.2870 *** | 1.1838 *** | 2.5396 *** |
| (−1.52) | (8.49) | (17.66) | (8.44) | |
| Control variables | Yes | Yes | Yes | Yes |
| Year FE | Yes | Yes | Yes | Yes |
| Province FE | Yes | Yes | Yes | Yes |
| N | 510 | 510 | 510 | 510 |
| Adjusted R2 | 0.7851 | 0.9934 | 0.8802 | 0.9932 |
| Intermediary effect | −0.0018 | - | ||
| Direct effect | −0.0059 | - | ||
| Total effect | −0.0077 | - | ||
| Intermediation effect as a percentage | 23.38% | - | ||
Note: Values in parentheses are t-test values; ***, **, and * indicate significance at the 1%, 5%, and 10% levels, respectively.
Disclaimer/Publisher’s Note: The statements, opinions and data contained in all publications are solely those of the individual author(s) and contributor(s) and not of MDPI and/or the editor(s). MDPI and/or the editor(s) disclaim responsibility for any injury to people or property resulting from any ideas, methods, instructions or products referred to in the content. |
© 2024 by the authors. Licensee MDPI, Basel, Switzerland. This article is an open access article distributed under the terms and conditions of the Creative Commons Attribution (CC BY) license (https://creativecommons.org/licenses/by/4.0/).
Share and Cite
MDPI and ACS Style
He, N.; Shi, Y.; Ding, R. Does the Water Rights Trading Policy Improve Water-Use Efficiency? An Environmental Policy Evaluation from China. Sustainability 2024, 16, 3454. https://doi.org/10.3390/su16083454
AMA Style
He N, Shi Y, Ding R. Does the Water Rights Trading Policy Improve Water-Use Efficiency? An Environmental Policy Evaluation from China. Sustainability. 2024; 16(8):3454. https://doi.org/10.3390/su16083454
Chicago/Turabian StyleHe, Naiming, Ying Shi, and Rijia Ding. 2024. "Does the Water Rights Trading Policy Improve Water-Use Efficiency? An Environmental Policy Evaluation from China" Sustainability 16, no. 8: 3454. https://doi.org/10.3390/su16083454
Note that from the first issue of 2016, this journal uses article numbers instead of page numbers. See further details here.