
A Review of the Use of Hydrogen in Compression Ignition Engines with Dual-Fuel Technology and Techniques for Reducing NOx Emissions
 , ,
, ,  , and
, and
Abstract
:1. Introduction
- To evaluate the main properties of H2 with respect to other carbon-based fuels. It also includes advantages and disadvantages of its use in CIEs, enumerating different strategies for introducing the gas into the engine.
- To analyze in detail the influence of the use of H2 in a CIE in dual-fuel mode in terms of performance and emissions.
- To evaluate different strategies to reduce the increase in NOx emissions associated with the use of H2.
2. Hydrogen as Fuel in Compression Ignition Engines
- Type 1: In this scenario, the values of and are adjusted to acquire the desired HES for a specific engine load. In case the HES is increased, will be increased while will be decreased while keeping the engine speed and load constant, as before. Rocha et al. [23] kept the engine load at 60% and carried out experiments for various HESs (ranging from 0 to 24%). When no H2 was injected (0% HES), the value of was recorded as 1.1072 kg/h. When the HES increased to 5%, the diesel fuel mass flow rate decreased to 1.0394 kg/h, while the hydrogen mass flow rate increased by 0.0194 kg/h. At 24% HES, the diesel fuel mass flow rate decreased to 0.9318 kg/h, while the hydrogen mass flow rate increased to 0.1021 kg/h, with no change to the initial 60% engine load.
- Type 2: When intending to maintain a constant engine load for an established , it is necessary to decrease relative to the scenario without H2, causing a higher HES. Subsequently, with higher in a subsequent test, will be further reduced, thereby increasing the HES and keeping the previously established engine load. Yilmaz et al. [46] conducted tests at three engine loads (50, 75, and 100 Nm) and two hydrogen volumetric flow rates (20 and 40 L/min). At 75 Nm, no H2 injection resulted in a 0% HES, increasing up to 8.93% and 17.35%, with 20 and 40 L/min, respectively, while keeping constant the initial engine load.
- Type 3: In this case, the test is conducted at a specified speed without any hydrogen injection. The diesel fuel mass flow rate measured at this test point is kept for the remaining points, where a specified hydrogen mass flow rate is assigned, resulting in a higher fuel quantity. To maintain a constant speed, the engine load must be increased. In this sense, the authors conducted a study where the diesel fuel mass flow rate remained constant at 1500 rpm. An increase in the hydrogen mass flow rate resulted in higher hydrogen enrichment in the fuel mixture, which in turn led to greater power output and increased engine speed. To maintain a constant speed of 1500 rpm, the brake load needed to be adjusted accordingly [47].
2.1. Effect of Hydrogen as a Dual Fuel on Combustion Performance Characteristics
2.1.1. Brake Thermal Efficiency
2.1.2. Volumetric Efficiency
2.1.3. Ignition Delay
2.1.4. Combustion Duration
2.1.5. Maximum In-Cylinder Pressure
2.2. Effect of Hydrogen as a Dual Fuel on Emission Characteristics
- The chemical reactions are not able to complete at high engine speeds, leading to the generation of CO and HC.
- Elevated temperatures in the combustion chamber, under conditions of excess air, facilitate air oxidation, leading to the formation of NOx.
- Situations with insufficient oxygen and excess fuel result in incomplete evaporation and carbonization of some fuel, causing the formation of PM.
- Fuel impurities can also produce SOx.
2.2.1. CO2 Emissions
2.2.2. CO Emissions
2.2.3. Hydrocarbons
2.2.4. Soot/PM/Smoke
2.2.5. NOx Emissions
3. Techniques for Emission Control and Enhancement of HES
3.1. Exhaust Gas Recirculation
3.2. Water Injection
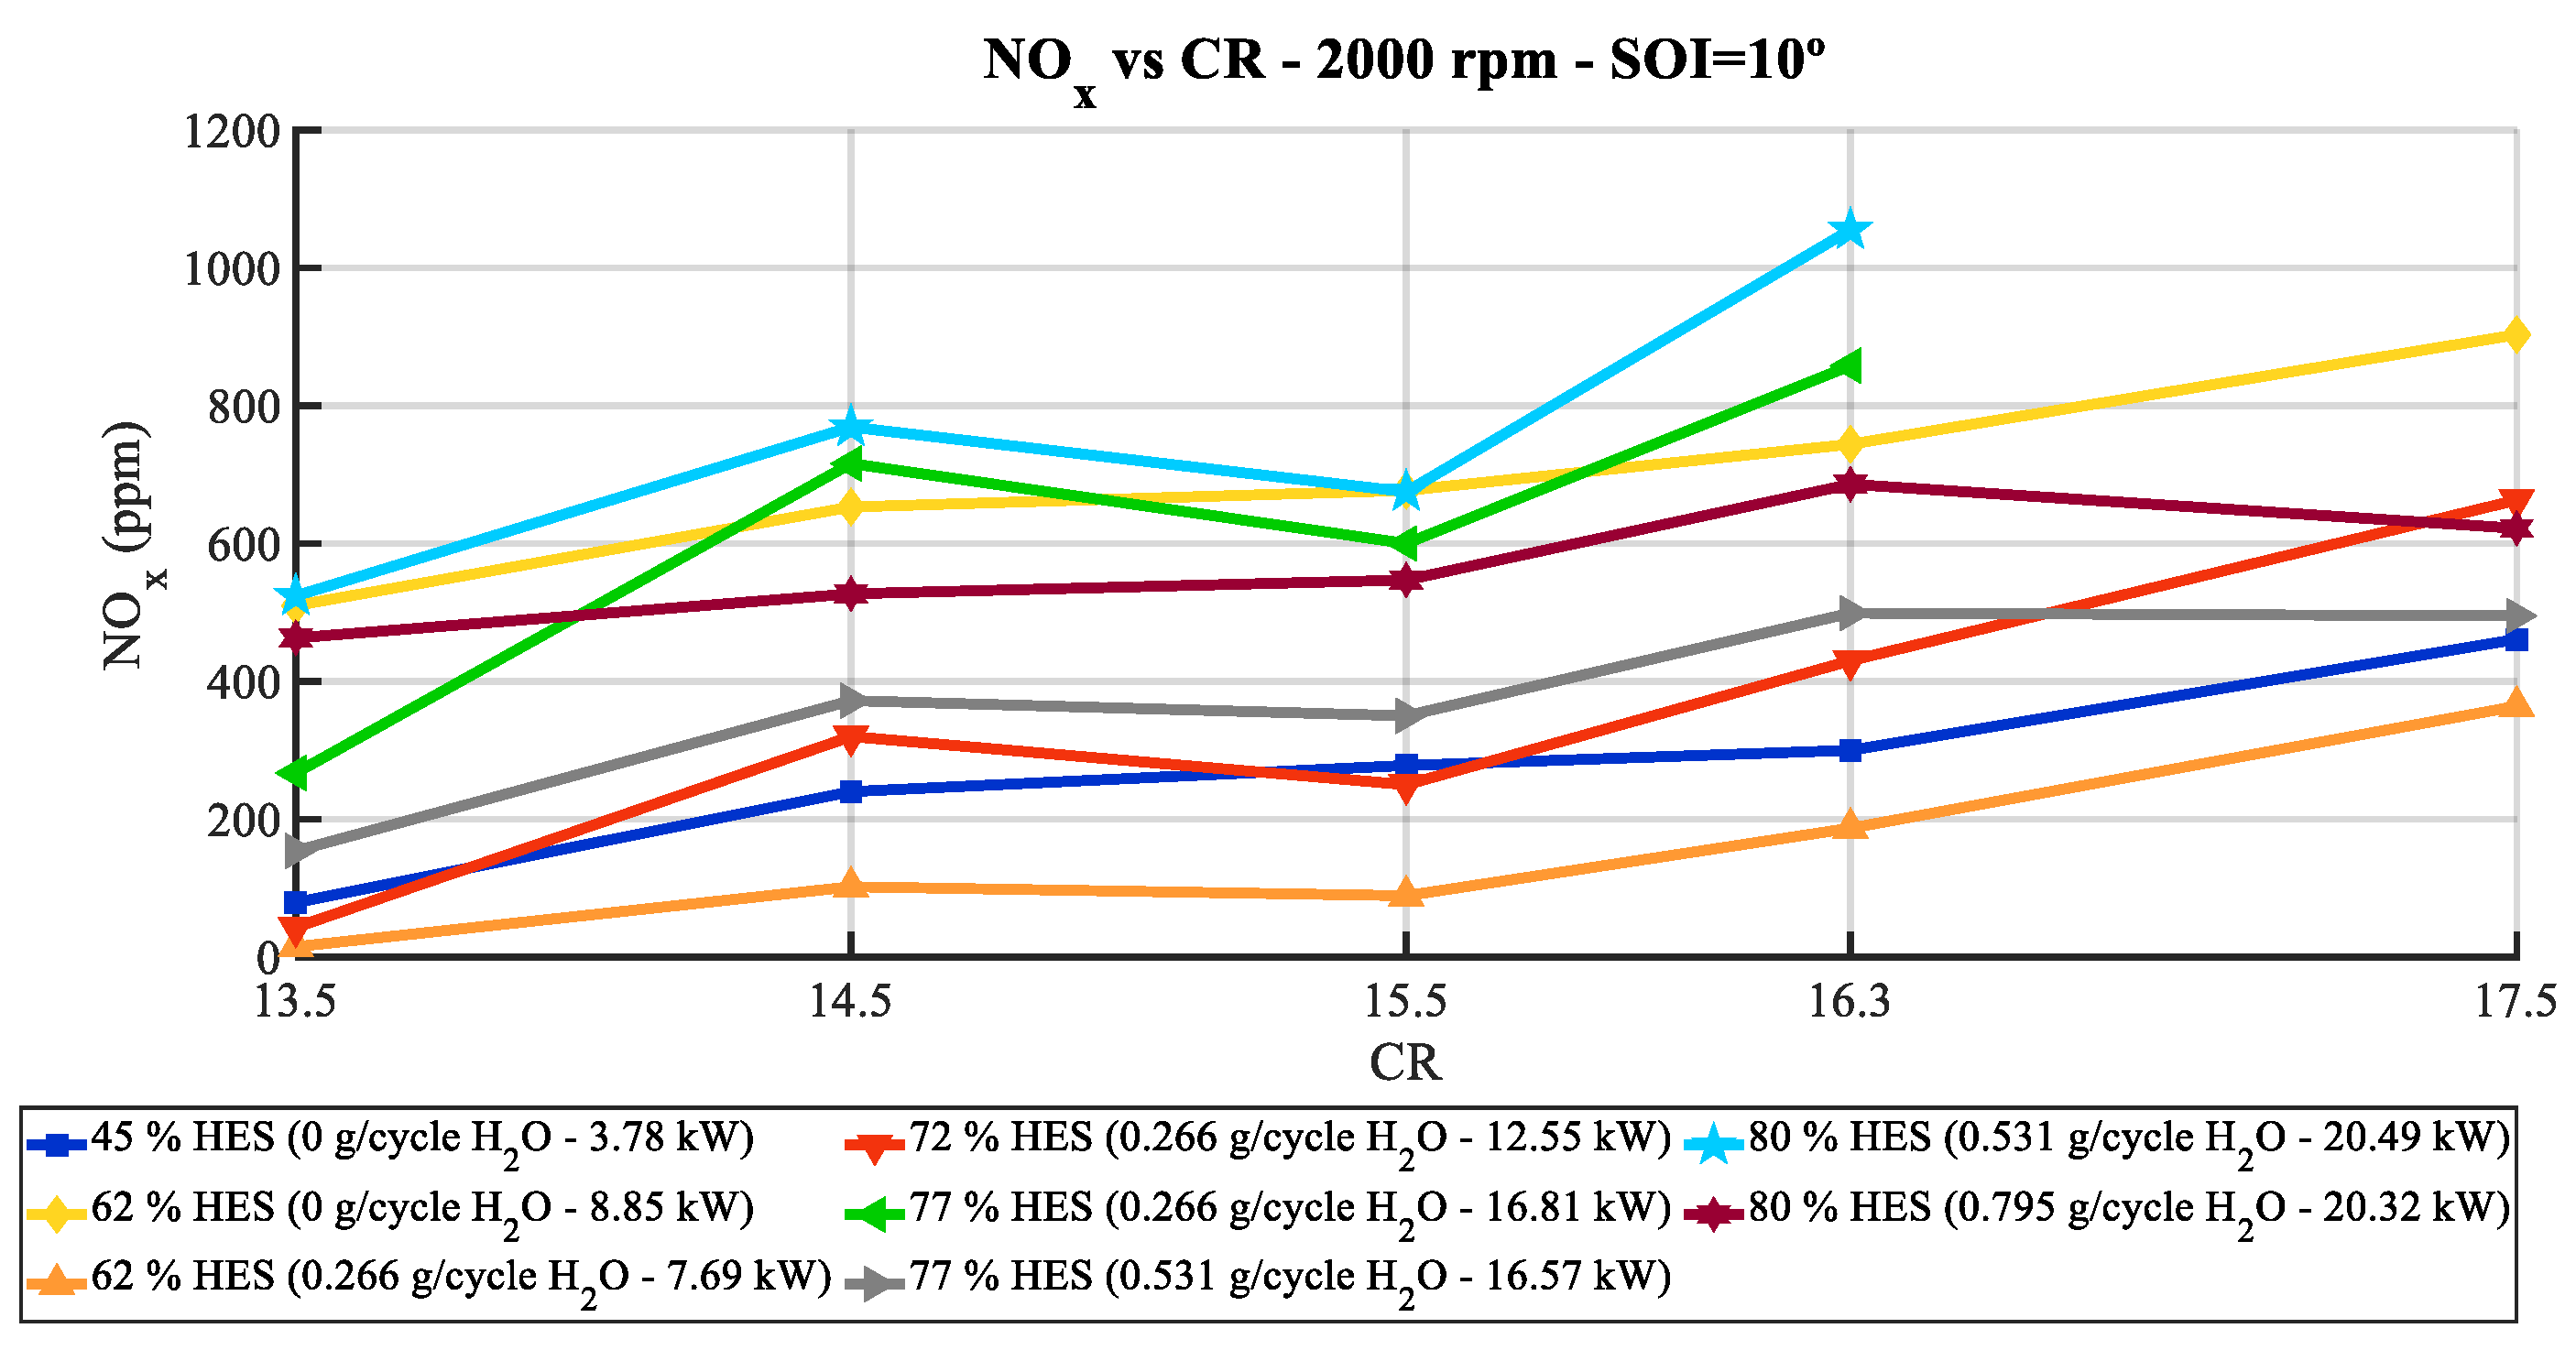
3.3. Effect of Compression Rate Reduction
4. Conclusions
- The use of H2 presents two obstacles that must be considered: knocking and backfiring. Too much H2 increases the probability of knocking. Fortunately, backfiring can be remedied by proper injection of H2 into the engine. Thus, choosing the optimal method for mixing air with H2 is crucial.
- Among H2 injection techniques (carburation, manifold, port, and direct injection), port injection provides superior outcomes for enhancing engine performance and reducing emissions. Nonetheless, direct injection shows potential as the superior option that may address the issue of backfiring. However, given the nonexistence of commercial H2 injection solutions, it remains impractical at present.
- It is unclear how H2 affects brake thermal efficiency (BTE) in terms of efficiency. While some studies have reported improved combustion and increased BTE with the addition of H2, others have found incomplete combustion due to H2. This issue, combined with higher thermal losses, may lead to lower BTE. Additionally, the introduction of H2 into the combustion chamber tends to displace a significant amount of air, resulting in a decrease in volumetric efficiency (VE).
- The inclusion of H2 in the combustion chamber, mixed with air, means that more energy is needed to increase the temperature of the mixture. This gas property justifies the increase in ignition delay (ID), as more time is required for the mixture’s ignition to occur. Furthermore, hydrogen accelerates both premixed and diffusive phases, resulting in a faster reaction compared to a reaction without hydrogen, which leads to a lower combustion duration (CD) and a higher maximum in-cylinder pressure.
- In terms of emissions, CO2. CO, HC, and soot decrease with the addition of H2. H2 is a carbon-free fuel with a significant influence on the reduction of these emissions. In addition, it seems that this fuel’s properties favor more complete combustion.
- The introduction of hydrogen in the chamber results in an increase in pressure rise rates and increased combustion temperatures. This tends to favor the Zeldovich mechanism for NOx formation. Consequently, the addition of H2 may need further NOx reduction.
- Exhaust gas recirculation (EGR), water injection (WI), and compression ratio (CR) reduction are three effective NOx reduction strategies. These approaches reduce combustion chamber temperature and, thus, NOx emissions up to 70%. Furthermore, these techniques increase the knocking limit, which in turn increases the hydrogen energy share (HES).
- These techniques have a negative impact on both performance and emissions. They reduce BTE and increase ID and CD, thus leading to a decrease in the maximum in-cylinder pressure. Furthermore, combustion with these techniques promotes incomplete combustion. This, in turn, increases the emission levels of HC and soot, while reducing the oxidation rate of CO into CO2. Despite this, the levels achieved may be lower than those observed during diesel fuel operation mode.
Author Contributions
Funding
Data Availability Statement
Conflicts of Interest
Nomenclature
| BTE | Brake thermal efficiency | ICE | Internal combustion engine |
| CA | Crank angle | ID | Ignition delay |
| CD | Combustion duration | K | Opacity |
| CIE | Compression ignition engine | LHV | Lower heating value |
| CNG | Compressed natural gas | LL | Low load |
| CR | Compression rate | ML | Medium load |
| DWE | Water–diesel fuel emulsion | NG | Natural gas |
| DWI | Direct water injection | NTP | Normal temperature and pressure conditions |
| EGR | Exhaust gas recirculation | PM | Particulate matter |
| FCV | Fuel cell vehicle | SI | Spark ignition |
| GHG | Greenhouse gases | SOC | Start of combustion |
| HC | Hydrocarbons | SOI | Start of injection |
| HES | Hydrogen energy share | TDC | Top dead centre |
| HL | High load | VE | Volumetric efficiency |
| HRR | Heat release rate | WI | Water injection |
References
- European Commission. GHG Emissions of All World Countries 2023. Available online: https://edgar.jrc.ec.europa.eu/booklet/GHG_emissions_of_all_world_countries_booklet_2023report.pdf (accessed on 28 October 2023).
- International Energy Agency. Assessing the Effects of Economic Recoveries on Global Energy Demand and CO2 Emissions in 2021. Available online: https://www.iea.org/reports/global-energy-review-2021 (accessed on 28 October 2023).
- Climate.gov. Climate Change: Atmospheric Carbon Dioxide. Available online: https://www.climate.gov/news-features/understanding-climate/climate-change-atmospheric-carbon-dioxide (accessed on 28 October 2023).
- United Nations. United Nations, The Paris Agreement. Available online: https://www.un.org/en/climatechange/paris-agreement (accessed on 8 July 2022).
- European Council. Climate Change: What the EU Is Doing. Available online: https://www.consilium.europa.eu/en/policies/climate-change/ (accessed on 8 July 2022).
- European Commission. CO2 Emission Performance Standards for Cars and Vans. Available online: https://climate.ec.europa.eu/eu-action/transport/road-transport-reducing-co2-emissions-vehicles/CO2-emission-performance-standards-cars-and-vans_en (accessed on 28 October 2023).
- BP. BP Energy Outlook 2022. Available online: https://www.bp.com/content/dam/bp/business-sites/en/global/corporate/pdfs/energy-economics/energy-outlook/bp-energy-outlook-2022.pdf (accessed on 28 October 2023).
- International Transport Forum. Executive Summary ITF Transport Outlook 2021. Available online: https://www.itf-oecd.org/sites/default/files/transport-outlook-executive-summary-2021-english.pdf (accessed on 8 July 2022).
- McKinsey & Company. Global Energy Perspective 2022 Executive Summary. Available online: https://www.mckinsey.com/~/media/McKinsey/Industries/Oil%20and%20Gas/Our%20Insights/Global%20Energy%20Perspective%202022/Global-Energy-Perspective-2022-Executive-Summary.pdf (accessed on 8 July 2022).
- Sandalci, T.; Karagöz, Y. Experimental Investigation of the Combustion Characteristics, Emissions and Performance of Hydrogen Port Fuel Injection in a Diesel Engine. Int. J. Hydrogen Energy 2014, 39, 18480–18489. [Google Scholar] [CrossRef]
- Mohsin, R.; Majid, Z.A.; Shihnan, A.H.; Nasri, N.S.; Sharer, Z. Effect of Biodiesel Blends on Engine Performance and Exhaust Emission for Diesel Dual Fuel Engine. Energy Convers. Manag. 2014, 88, 821–828. [Google Scholar] [CrossRef]
- Leiva-Candia, D.E.; García, I.L.; Lopez, I.; Serrano-Herrador, J.A.; Dorado, M.P. Descriptive and Inferential Statistics as an Exhaust Emission Comparative Tool between Different Engine Operating Conditions and Fuels. Application to Highly Oxidized Biodiesel Blended with Primary Alcohols. Fuel 2022, 324, 124453. [Google Scholar] [CrossRef]
- Dorado, M.P. Raw Materials to Produce Low-Cost Biodiesel. In Biofuels Refining and Performance, 1st ed.; McGraw-Hill Education: New York, NY, USA, 2008. [Google Scholar]
- Pinzi, S.; Leiva, D.; López-García, I.; Redel-Macías, M.D.; Dorado, M.P. Latest Trends in Feedstocks for Biodiesel Production. Biofuels Bioprod. Biorefin. 2014, 8, 126–143. [Google Scholar] [CrossRef]
- International Energy Agency. Global Hydrogen Review 2021. Available online: https://www.iea.org/reports/global-hydrogen-review-2021 (accessed on 8 July 2022).
- Muradov, N. Low to Near-Zero CO2 Production of Hydrogen from Fossil Fuels: Status and Perspectives. Int. J. Hydrogen Energy 2017, 42, 14058–14088. [Google Scholar] [CrossRef]
- Chi, J.; Yu, H. Water Electrolysis Based on Renewable Energy for Hydrogen Production. Cuihua Xuebao/Chin. J. Catal. 2018, 39, 390–394. [Google Scholar] [CrossRef]
- Dimitriou, P.; Tsujimura, T. A Review of Hydrogen as a Compression Ignition Engine Fuel. Int. J. Hydrogen Energy 2017, 42, 24470–24486. [Google Scholar] [CrossRef]
- Verhelst, S.; Wallner, T. Hydrogen-Fueled Internal Combustion Engines. Prog. Energy Combust. Sci. 2009, 35, 490–527. [Google Scholar] [CrossRef]
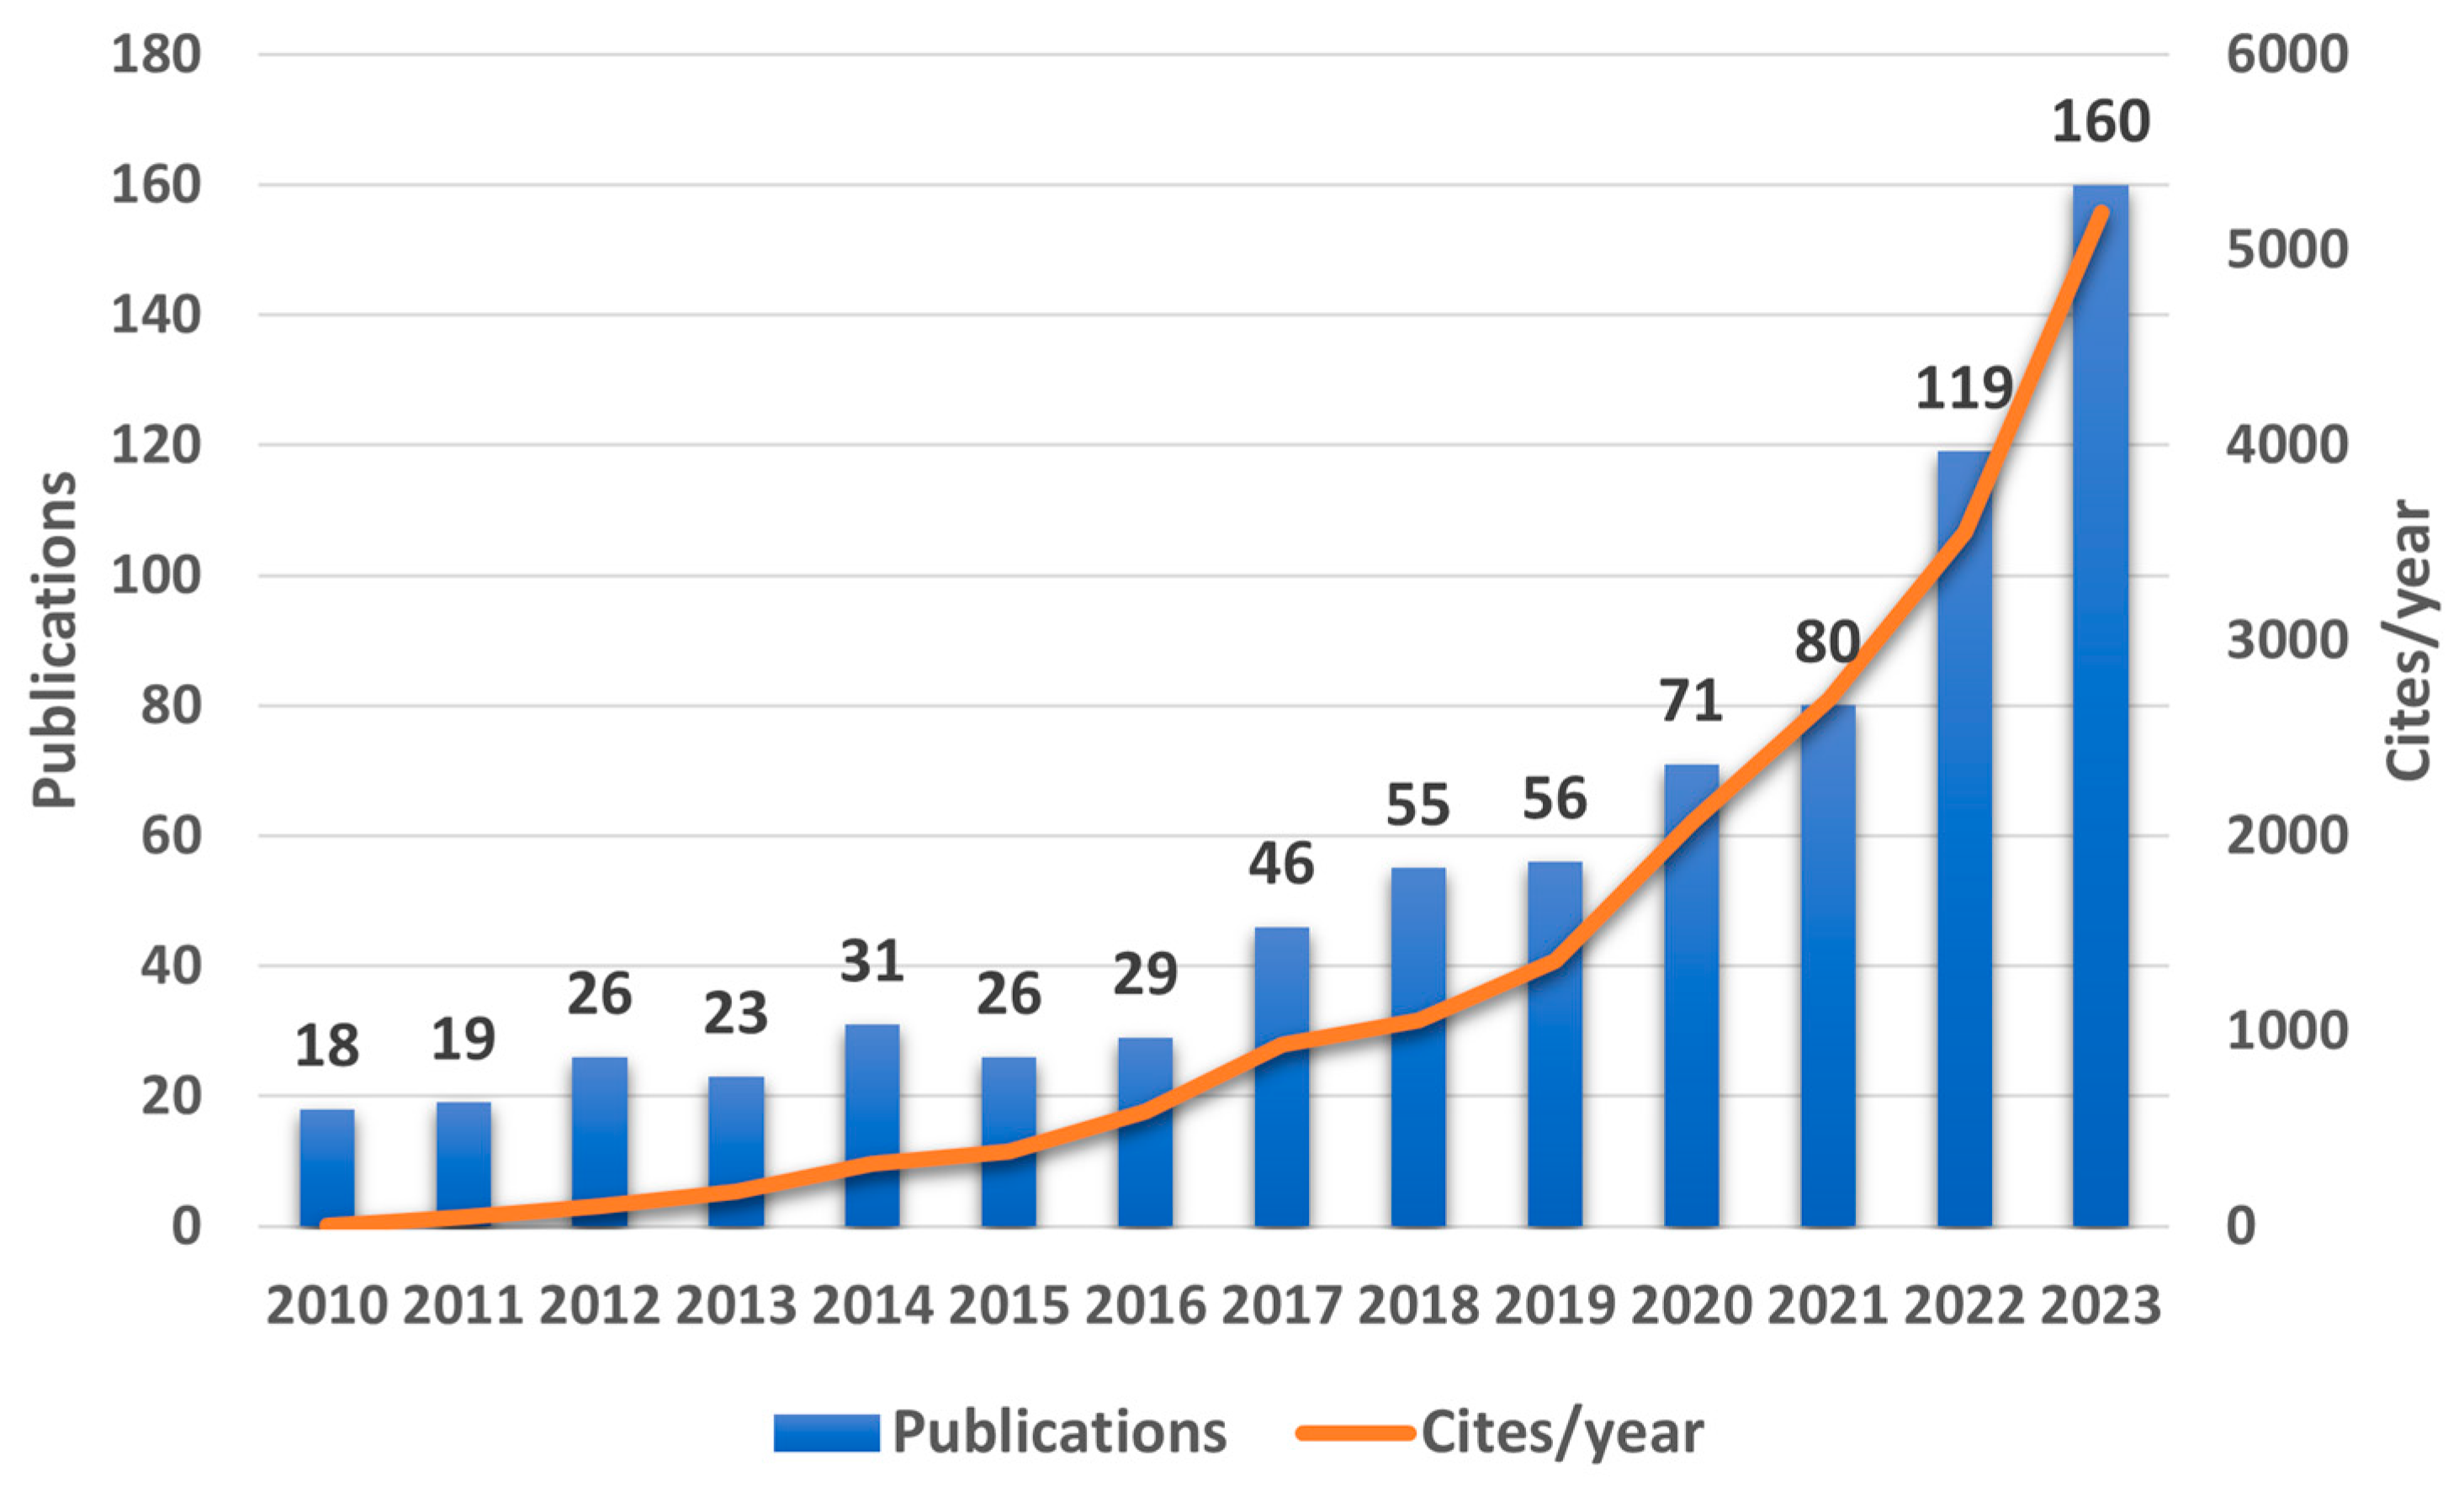
- Rueda Vázquez, J.M.; Tejada Hernández, J.; Pinzi, S.; Dorado Pérez, M.; del, P. Bibliometric Study on Dual-Fuel Injection. In Proceedings of the 12 CNIT Proceedings Book, Madrid, Spain, 29 June 2022. [Google Scholar]
- Kanth, S.; Debbarma, S. Comparative Performance Analysis of Diesel Engine Fuelled with Hydrogen Enriched Edible and Non-Edible Biodiesel. Int. J. Hydrogen Energy 2021, 46, 10478–10493. [Google Scholar] [CrossRef]
- Pinto, G.M.; de Souza, T.A.Z.; da Costa, R.B.R.; Roque, L.F.A.; Frez, G.V.; Coronado, C.J.R. Combustion, Performance and Emission Analyses of a CI Engine Operating with Renewable Diesel Fuels (HVO/FARNESANE) under Dual-Fuel Mode through Hydrogen Port Injection. Int. J. Hydrogen Energy 2023, 48, 19713–19732. [Google Scholar] [CrossRef]
- Rocha, H.M.Z.; Pereira, R.d.S.; Nogueira, M.F.M.; Belchior, C.R.P.; Tostes, M.E.; de, L. Experimental Investigation of Hydrogen Addition in the Intake Air of Compressed Ignition Engines Running on Biodiesel Blend. Int. J. Hydrogen Energy 2017, 42, 4530–4539. [Google Scholar] [CrossRef]
- Tutak, W.; Jamrozik, A.; Grab-Rogaliński, K. Co-Combustion of Hydrogen with Diesel and Biodiesel (RME) in a Dual-Fuel Compression-Ignition Engine. Energies 2023, 16, 4892. [Google Scholar] [CrossRef]
- Köse, H.; Ciniviz, M. An Experimental Investigation of Effect on Diesel Engine Performance and Exhaust Emissions of Addition at Dual Fuel Mode of Hydrogen. Fuel Process. Technol. 2013, 114, 26–34. [Google Scholar] [CrossRef]
- Zheng, S.; He, Y.; Hu, B.; Zhu, J.; Zhou, B.; Lu, Q. Effects of Radiation Reabsorption on the Flame Speed and NO Emission of NH3/H2/Air Flames at Various Hydrogen Ratios. Fuel 2022, 327, 125176. [Google Scholar] [CrossRef]
- Zheng, S.; He, Y.; Liu, H.; Yang, Y.; Han, W.; Lu, Q. Roles of Radiation Reabsorption on Flame Speed and NO Emission during Ammonia Combustion with Syngas Blending at Elevated Pressures. Int. J. Hydrogen Energy 2024, 49, 1336–1345. [Google Scholar] [CrossRef]
- Najjar, Y.S.H. Hydrogen Safety: The Road toward Green Technology. Int. J. Hydrogen Energy 2013, 38, 10716–10728. [Google Scholar] [CrossRef]
- Li, M.; Bai, Y.; Zhang, C.; Song, Y.; Jiang, S.; Grouset, D.; Zhang, M. Review on the Research of Hydrogen Storage System Fast Refueling in Fuel Cell Vehicle. Int. J. Hydrogen Energy 2019, 44, 10677–10693. [Google Scholar] [CrossRef]
- Moradi, R.; Groth, K.M. Hydrogen Storage and Delivery: Review of the State of the Art Technologies and Risk and Reliability Analysis. Int. J. Hydrogen Energy 2019, 44, 12254–12269. [Google Scholar] [CrossRef]
- Hwang, H.T.; Varma, A. Hydrogen Storage for Fuel Cell Vehicles. Curr. Opin. Chem. Eng. 2014, 5, 42–48. [Google Scholar] [CrossRef]
- Stępień, Z. A Comprehensive Overview of Hydrogen-Fueled Internal Combustion Engines: Achievements and Future Challenges. Energies 2021, 14, 6504. [Google Scholar] [CrossRef]
- Szwaja, S.; Grab-Rogalinski, K. Hydrogen Combustion in a Compression Ignition Diesel Engine. Int. J. Hydrogen Energy 2009, 34, 4413–4421. [Google Scholar] [CrossRef]
- Hairuddin, A.A.; Yusaf, T.; Wandel, A.P. A Review of Hydrogen and Natural Gas Addition in Diesel HCCI Engines. Renew. Sustain. Energy Rev. 2014, 32, 739–761. [Google Scholar] [CrossRef]
- Saravanan, N.; Nagarajan, G.; Narayanasamy, S. An Experimental Investigation on DI Diesel Engine with Hydrogen Fuel. Renew. Energy 2008, 33, 415–421. [Google Scholar] [CrossRef]
- Castro, N.; Toledo, M.; Amador, G. An Experimental Investigation of the Performance and Emissions of a Hydrogen-Diesel Dual Fuel Compression Ignition Internal Combustion Engine. Appl. Therm. Eng. 2019, 156, 660–667. [Google Scholar] [CrossRef]
- Bakar, R.A.; Widudo; Kadirgama, K.; Ramasamy, D.; Yusaf, T.; Kamarulzaman, M.K.; Sivaraos; Aslfattahi, N.; Samylingam, L.; Alwayzy, S.H. Experimental Analysis on the Performance, Combustion/Emission Characteristics of a DI Diesel Engine Using Hydrogen in Dual Fuel Mode. Int. J. Hydrogen Energy 2022, 52, 843–860. [Google Scholar] [CrossRef]
- Das, L.M. Fuel induction techniques for a hydrogen operated engine. Int. J. Hydrogen Energy 1990, 15, 833–842. [Google Scholar] [CrossRef]
- Chintala, V.; Subramanian, K.A. A Comprehensive Review on Utilization of Hydrogen in a Compression Ignition Engine under Dual Fuel Mode. Renew. Sustain. Energy Rev. 2017, 70, 472–491. [Google Scholar] [CrossRef]
- de Troya Calatayud, J.J. Alternativa a los Combustibles Fósiles. Ph.D. Thesis, Utilización de Hidrógeno a Bordo de Buques, A Coruña, Spain, 2015. [Google Scholar]
- Saravanan, N.; Nagarajan, G. Experimental Investigation in Optimizing the Hydrogen Fuel on a Hydrogen Diesel Dual-Fuel Engine. Energy Fuels 2009, 23, 2646–2657. [Google Scholar] [CrossRef]
- Mohammadi, A.; Shioji, M.; Nakai, Y.; Ishikura, W.; Tabo, E. Performance and Combustion Characteristics of a Direct Injection SI Hydrogen Engine. Int. J. Hydrogen Energy 2007, 32, 296–304. [Google Scholar] [CrossRef]
- Das, L.M. Hydrogen Engine: Research and Development (R&D) Programmes in Indian. Institute of Technology (IIT), Delhi. Int. J. Hydrogen Energy 2002, 27, 953–965. [Google Scholar]
- Laforet, C.; Brown, B.; Rogak, S.; Munshi, S. Compression Ignition of Directly Injected Natural Gas with Entrained Diesel. Int. J. Engine Res.-Int. J. Engine Res. 2010, 11, 207–218. [Google Scholar] [CrossRef]
- Liu, X.; Srna, A.; Yip, H.L.; Kook, S.; Chan, Q.N.; Hawkes, E.R. Performance and Emissions of Hydrogen-Diesel Dual Direct Injection (H2DDI) in a Single-Cylinder Compression-Ignition Engine. Int. J. Hydrogen Energy 2021, 46, 1302–1314. [Google Scholar] [CrossRef]
- Yilmaz, I.T.; Demir, A.; Gumus, M. Effects of Hydrogen Enrichment on Combustion Characteristics of a CI Engine. Int. J. Hydrogen Energy 2017, 42, 10536–10546. [Google Scholar] [CrossRef]
- Serrano, J.; Jiménez-Espadafor, F.J.; López, A. Analysis of the Effect of the Hydrogen as Main Fuel on the Performance of a Modified Compression Ignition Engine with Water Injection. Energy 2019, 173, 911–925. [Google Scholar] [CrossRef]
- Egúsquiza, J.C.C.; Braga, S.L.; Braga, C.V.M. Experimental Investigation of a Diesel Engine Operating on Natural Gas/Diesel Dual-Fuel Mode; SAE Technical Paper; SAE International: Warrendale, PA, USA, 2011; p. 12. [Google Scholar] [CrossRef]
- Barrios, C.C.; Domínguez-Sáez, A.; Hormigo, D. Influence of Hydrogen Addition on Combustion Characteristics and Particle Number and Size Distribution Emissions of a TDI Diesel Engine. Fuel 2017, 199, 162–168. [Google Scholar] [CrossRef]
- Hoang, A.T.; Pham, V.V. A Study on a Solution to Reduce Emissions by Using Hydrogen as an Alternative Fuel for a Diesel Engine Integrated Exhaust Gas Recirculation. In Proceedings of the AIP Conference Proceedings, Namakkal, India, 4 May 2020; American Institute of Physics Inc.: College Park, MD, USA, 2020; Volume 2235. [Google Scholar]
- Yilmaz, I.T.; Gumus, M. Effects of Hydrogen Addition to the Intake Air on Performance and Emissions of Common Rail Diesel Engine. Energy 2018, 142, 1104–1113. [Google Scholar] [CrossRef]
- Wu, Y.; Devi, P.B.; Anbarasu, A.; Sołowski, G.; Chanh, H.C.; Chi, N.T.L.; Nasif, O.; Alharbi, S.A.; Xia, C. Estimation of the Engine Performance and Emission Characteristics of Hydrogen Feed Vehicles with Modified Injection Fuel System. Fuel 2022, 329, 125339. [Google Scholar] [CrossRef]
- Das, S.; Kanth, S.; Das, B.; Debbarma, S. Experimental Evaluation of Hydrogen Enrichment in a Dual-Fueled CRDI Diesel Engine. Int. J. Hydrogen Energy 2022, 47, 11039–11051. [Google Scholar] [CrossRef]
- Nag, S.; Sharma, P.; Gupta, A.; Dhar, A. Experimental Study of Engine Performance and Emissions for Hydrogen Diesel Dual Fuel Engine with Exhaust Gas Recirculation. Int. J. Hydrogen Energy 2019, 44, 12163–12175. [Google Scholar] [CrossRef]
- Sharma, P.; Dhar, A. Effect of Hydrogen Supplementation on Engine Performance and Emissions. Int. J. Hydrogen Energy 2018, 43, 7570–7580. [Google Scholar] [CrossRef]
- Subramanian, B.; Thangavel, V. Experimental Investigations on Performance, Emission and Combustion Characteristics of Diesel-Hydrogen and Diesel-HHO Gas in a Dual Fuel CI Engine. Int. J. Hydrogen Energy 2020, 45, 25479–25492. [Google Scholar] [CrossRef]
- Owston, R.; Magi, V.; Abraham, J. Wall Interactions of Hydrogen Flames Compared with Hydrocarbon Flames; SAE International: Warrendale, PA, USA, 2007; Volume 116. [Google Scholar]
- Bennett, S. Modern Diesel Technology: Diesel Engines; Cengage Learning: Belmont, CA, USA, 2014; ISBN 9781305177987. [Google Scholar]
- Lakshminarayanan, P.A.; Aghav, Y. V Ignition Delay in a Diesel Engine. In Modelling Diesel Combustion; Lakshminarayanan, P.A., Aghav, Y.V., Eds.; Springer: Dordrecht, The Netherlands, 2010; pp. 59–78. ISBN 978-90-481-3885-2. [Google Scholar]
- Jabbr, A.I.; Koylu, U.O. Influence of Operating Parameters on Performance and Emissions for a Compression-Ignition Engine Fueled by Hydrogen/Diesel Mixtures. Int. J. Hydrogen Energy 2019, 44, 13964–13973. [Google Scholar] [CrossRef]
- Aldhaidhawi, M.; Chiriac, R.; Badescu, V. Ignition Delay, Combustion and Emission Characteristics of Diesel Engine Fueled with Rapeseed Biodiesel—A Literature Review. Renew. Sustain. Energy Rev. 2017, 73, 178–186. [Google Scholar] [CrossRef]
- Dhole, A.E.; Yarasu, R.B.; Lata, D.B. Investigations on the Combustion Duration and Ignition Delay Period of a Dual Fuel Diesel Engine with Hydrogen and Producer Gas as Secondary Fuels. Appl. Therm. Eng. 2016, 107, 524–532. [Google Scholar] [CrossRef]
- Lata, D.B.; Bhushan Kumar, C. Experimental Analysis of Ignition Delay in Dual-Fuel Diesel Engine with Secondary Fuel. Int. J. Res. Anal. Rev. (IJRAR) 2018, 251, 279–285. [Google Scholar]
- Juknelevicius, R.; Szwaja, S.; Pyrc, M.; Gruca, M. Influence of Hydrogen Co-Combustion with Diesel Fuel on Performance, Smoke and Combustion Phases in the Compression Ignition Engine. Int. J. Hydrogen Energy 2019, 44, 19026–19034. [Google Scholar] [CrossRef]
- Cernat, A.; Pana, C.; Negurescu, N.; Lazaroiu, G.; Nutu, C.; Fuiorescu, D. Hydrogen—An Alternative Fuel for Automotive Diesel Engines Used in Transportation. Sustainability 2020, 12, 9321. [Google Scholar] [CrossRef]
- Vimalananth, V.T.; Panithasan, M.S.; Venkadesan, G. Investigating the Effects of Injection and Induction Modes of Hydrogen Addition in a CRDI Pilot Diesel-Fuel Engine with Exhaust Gas Recirculation. Int. J. Hydrogen Energy 2022, 47, 22559–22573. [Google Scholar] [CrossRef]
- Kozak, M.; Merkisz, J. Oxygenated Diesel Fuels and Their Effect on PM Emissions. Appl. Sci. 2022, 12, 7709. [Google Scholar] [CrossRef]
- Payri González, F.; Desantes Fernández, J.M. Motores de Combustión Interna Alternativos; Reverté: Barcelona, Spain, 2011; ISBN 9788429148022. [Google Scholar]
- Ghazal, O.H. Performance and Combustion Characteristic of CI Engine Fueled with Hydrogen Enriched Diesel. Int. J. Hydrogen Energy 2013, 38, 15469–15476. [Google Scholar] [CrossRef]
- Edward, K. Chapter 18—Air Pollution. In Environmental Pollution and Control, 4th ed.; Peirce, J.J., Weiner, R.F., Vesilind, P.A., Eds.; Butterworth-Heinemann: Woburn, MA, USA, 1998; pp. 245–269. ISBN 978-0-7506-9899-3. [Google Scholar]
- Mullinger, P.; Jenkins, B. Chapter 2—The Combustion Process. In Industrial and Process Furnaces, 2nd ed.; Mullinger, P., Jenkins, B., Eds.; Butterworth-Heinemann: Oxford, UK, 2013; pp. 31–65. ISBN 978-0-08-099377-5. [Google Scholar]
- Saravanan, N.; Nagarajan, G. Performance and Emission Studies on Port Injection of Hydrogen with Varied Flow Rates with Diesel as an Ignition Source. Appl. Energy 2010, 87, 2218–2229. [Google Scholar] [CrossRef]
- Bosch, H.; Janssen, F. Catalytic Reduction of Nitrogen Oxides—A Review on the Fundamentals and Technology. Catal. Today 1988, 2, 4. [Google Scholar]
- Hoekman, S.K.; Robbins, C. Review of the Effects of Biodiesel on NOx Emissions. Fuel Process. Technol. 2012, 96, 237–249. [Google Scholar] [CrossRef]
- Warnatz, J.; Maas, U.; Dibble, R. Combustion: Physical and Chemical Fundamentals, Modeling and Simulation, Experiments, Pollutant Formation; Springer: Berlin/Heidelberg, Germany, 2006; ISBN 978-3-540-25992-3. [Google Scholar]
- Gomes Antunes, J.M.; Mikalsen, R.; Roskilly, A.P. An Investigation of Hydrogen-Fuelled HCCI Engine Performance and Operation. Int. J. Hydrogen Energy 2008, 33, 5823–5828. [Google Scholar] [CrossRef]
- Heywood, J.B. Internal Combustion Engine Fundamentals, 2nd ed.; McGraw-Hill Education: New York, NY, USA, 2018; ISBN 9781260116106. [Google Scholar]
- Talibi, M.; Hellier, P.; Ladommatos, N. The Effect of Varying EGR and Intake Air Boost on Hydrogen-Diesel Co-Combustion in CI Engines. Int. J. Hydrogen Energy 2017, 42, 6369–6383. [Google Scholar] [CrossRef]
- Wu, H.W.; Hsu, T.Z.; Lai, W.H. Dual Fuel Turbocharged Engine Operated with Exhaust Gas Recirculation. J. Mech. 2018, 34, 21–27. [Google Scholar] [CrossRef]
- Gnanamoorthi, V.; Vimalananth, V.T.; Murugan, M. Effect of EGR on ci engine fuelled with diesel and hydrogen. Int. Res. J. Eng. Technol. 2018, 5, 1642–1648. [Google Scholar]
- Vijayaragavan, M.; Subramanian, B.; Sudhakar, S.; Natrayan, L. Effect of Induction on Exhaust Gas Recirculation and Hydrogen Gas in Compression Ignition Engine with Simarouba Oil in Dual Fuel Mode. Int. J. Hydrogen Energy 2022, 47, 37635–37647. [Google Scholar] [CrossRef]
- Chaichan, M.T. Performance and Emission Characteristics of CIE Using Hydrogen, Biodiesel, and Massive EGR. Int. J. Hydrogen Energy 2018, 43, 5415–5435. [Google Scholar] [CrossRef]
- Nag, S.; Dhar, A.; Gupta, A. Hydrogen-Diesel Co-Combustion Characteristics, Vibro-Acoustics and Unregulated Emissions in EGR Assisted Dual Fuel Engine. Fuel 2022, 307, 121925. [Google Scholar] [CrossRef]
- Chintala, V.; Benaerjee, D.; Ghodke, P.K.; Porpatham, E. Hydrogen Rich Exhaust Gas Recirculation (H2EGR) for Performance Improvement and Emissions Reduction of a Compression Ignition Engine. Int. J. Hydrogen Energy 2019, 44, 18545–18558. [Google Scholar] [CrossRef]
- De Serio, D.; de Oliveira, A.; Sodré, J.R. Effects of EGR Rate on Performance and Emissions of a Diesel Power Generator Fueled by B7. J. Braz. Soc. Mech. Sci. Eng. 2017, 39, 1919–1927. [Google Scholar] [CrossRef]
- Jafarmadar, S.; Nemati, P. Analysis of Exhaust Gas Recirculation (EGR) Effects on Exergy Terms in an Engine Operating with Diesel Oil and Hydrogen. Energy 2017, 126, 746–755. [Google Scholar] [CrossRef]
- Dahake, M.R.; Malkhede, D.N. Experimental Investigation of Performance and Emissions of CRDI Diesel Engine in Dual Fuel Mode by Hydrogen Induction and Diesel Injection Coupled with Exhaust Gas Recirculation. Proc. Mater. Today 2021, 46, 2814–2819. [Google Scholar] [CrossRef]
- Yaliwal, V.S.; Banapurmath, N.R.; Soudagar, M.E.M.; Afzal, A.; Ahmadi, P. Effect of Manifold and Port Injection of Hydrogen and Exhaust Gas Recirculation (EGR) in Dairy Scum Biodiesel—Low Energy Content Gas-Fueled CI Engine Operated on Dual Fuel Mode. Int. J. Hydrogen Energy 2022, 47, 6873–6897. [Google Scholar] [CrossRef]
- Tauzia, X.; Maiboom, A.; Shah, S.R. Experimental Study of Inlet Manifold Water Injection on Combustion and Emissions of an Automotive Direct Injection Diesel Engine. Energy 2010, 35, 3628–3639. [Google Scholar] [CrossRef]
- Sahin, Z.; Tuti, M.; Durgun, O. Experimental Investigation of the Effects of Water Adding to the Intake Air on the Engine Performance and Exhaust Emissions in a Di Automotive Diesel Engine. Fuel 2014, 115, 884–895. [Google Scholar] [CrossRef]
- Tesfa, B.; Mishra, R.; Gu, F.; Ball, A.D. Water Injection Effects on the Performance and Emission Characteristics of a CI Engine Operating with Biodiesel. Renew. Energy 2012, 37, 333–344. [Google Scholar] [CrossRef]
- Lif, A.; Holmberg, K. Water-in-Diesel Emulsions and Related Systems. Adv. Colloid Interface Sci. 2006, 123–126, 231–239. [Google Scholar] [CrossRef]
- Rueda-Vázquez, J.M.; Serrano, J.; Jiménez-Espadafor, F.J.; Dorado, M.P. Experimental Analysis of the Effect of Hydrogen as the Main Fuel on the Performance and Emissions of a Modified Compression Ignition Engine with Water Injection and Compression Ratio Reduction. Appl. Therm. Eng. 2024, 238, 121933. [Google Scholar] [CrossRef]
- Serrano, J.; Jiménez-Espadafor, F.J.; López, A. Analysis of the Effect of Different Hydrogen/Diesel Ratios on the Performance and Emissions of a Modified Compression Ignition Engine under Dual-Fuel Mode with Water Injection. Hydrogen-Diesel Dual-Fuel Mode. Energy 2019, 172, 702–711. [Google Scholar] [CrossRef]
- Chintala, V.; Subramanian, K.A. Hydrogen Energy Share Improvement along with NOx (Oxides of Nitrogen) Emission Reduction in a Hydrogen Dual-Fuel Compression Ignition Engine Using Water Injection. Energy Convers. Manag. 2014, 83, 249–259. [Google Scholar] [CrossRef]
- Chintala, V.; Subramanian, K.A. An Effort to Enhance Hydrogen Energy Share in a Compression Ignition Engine under Dual-Fuel Mode Using Low Temperature Combustion Strategies. Appl. Energy 2015, 146, 174–183. [Google Scholar] [CrossRef]
- Chintala, V.; Subramanian, K.A. Experimental Investigation of Hydrogen Energy Share Improvement in a Compression Ignition Engine Using Water Injection and Compression Ratio Reduction. Energy Convers. Manag. 2016, 108, 106–119. [Google Scholar] [CrossRef]
- Karthic, S.V.; Senthil Kumar, M.; Pradeep, P.; Vinoth Kumar, S. Assessment of Hydrogen-Based Dual Fuel Engine on Extending Knock Limiting Combustion. Fuel 2020, 260, 116342. [Google Scholar] [CrossRef]
- Raju, P.; Masimalai, S. Numerical Study on a Diesel–Hydrogen Dual-Fuel Engine with Water Injection and Variable Compression Ratio. Energy Technol. 2022, 10, 2100626. [Google Scholar] [CrossRef]
- Serrano, J.; Jiménez-Espadafor, F.J.; Lora, A.; Modesto-López, L.; Gañán-Calvo, A.; López-Serrano, J. Experimental Analysis of NOx Reduction through Water Addition and Comparison with Exhaust Gas Recycling. Energy 2019, 168, 737–752. [Google Scholar] [CrossRef]
- Ghazal, O.H. Combustion Analysis of Hydrogen-Diesel Dual Fuel Engine with Water Injection Technique. Case Stud. Therm. Eng. 2019, 13, 100380. [Google Scholar] [CrossRef]
- Chintala, V.; Subramanian, K.A. Experimental Investigations on Effect of Different Compression Ratios on Enhancement of Maximum Hydrogen Energy Share in a Compression Ignition Engine under Dual-Fuel Mode. Energy 2015, 87, 448–462. [Google Scholar] [CrossRef]
- Taghavifar, H.; Anvari, S.; Parvishi, A. Benchmarking of Water Injection in a Hydrogen-Fueled Diesel Engine to Reduce Emissions. Int. J. Hydrogen Energy 2017, 42, 11962–11975. [Google Scholar] [CrossRef]
- Dell, R.M.; Moseley, P.T.; Rand, D.A.J. Chapter 4—Development of Road Vehicles with Internal-Combustion Engines. In Towards Sustainable Road Transport; Dell, R.M., Moseley, P.T., Rand, D.A.J., Eds.; Academic Press: Boston, MA, USA, 2014; pp. 109–156. ISBN 978-0-12-404616-0. [Google Scholar]
- Winterbone, D.E.; Turan, A. Chapter 16—Reciprocating Internal Combustion Engines. In Advanced Thermodynamics for Engineers, 2nd ed.; Winterbone, D.E., Turan, A., Eds.; Butterworth-Heinemann: Boston, MA, USA, 2015; pp. 345–379. ISBN 978-0-444-63373-6. [Google Scholar]
- Rosha, P.; Kumar, S.; Senthil Kumar, P.; Kowthaman, C.N.; Kumar Mohapatra, S.; Dhir, A. Impact of Compression Ratio on Combustion Behavior of Hydrogen Enriched Biogas-Diesel Operated CI Engine. Fuel 2022, 310, 122321. [Google Scholar] [CrossRef]
- Sharma, P.; Dhar, A. Compression Ratio Influence on Combustion and Emissions Characteristic of Hydrogen Diesel Dual Fuel CI Engine: Numerical Study. Fuel 2018, 222, 852–858. [Google Scholar] [CrossRef]
- Sanli, A.; Yılmaz, I.T.; Gümüş, M. Assessment of Combustion and Exhaust Emissions in a Common-Rail Diesel Engine Fueled with Methane and Hydrogen/Methane Mixtures under Different Compression Ratio. Int. J. Hydrogen Energy 2020, 45, 3263–3283. [Google Scholar] [CrossRef]
- Masood, M.; Mehdi, S.N.; Reddy, P.R. Experimental Investigations on a Hydrogen-Diesel Dual Fuel Engine at Different Compression Ratios. J. Eng. Gas. Turbine Power 2007, 129, 572–578. [Google Scholar] [CrossRef]
- Yilmaz, I.T. The Effect of Hydrogen on the Thermal Efficiency and Combustion Process of the Low Compression Ratio CI Engine. Appl. Therm. Eng. 2021, 197, 117381. [Google Scholar] [CrossRef]


| Property | Unit | Hydrogen (Gas) | Natural Gas | Diesel Fuel (Liquid) | Gasoline (Liquid) |
|---|---|---|---|---|---|
| Density at normal conditions | kg/m3 | 0.0899 | 0.7–0.9 | 820–950 | 730–780 |
| Autoignition temperature | K | 858 | 813 | 530 | 620 |
| Octane/cetane number | 130 | 120 | 40–55 | 86–98 | |
| Lower heating value | MJ/kg | 120 | 53.6 | 43.9 | 42.5 |
| Diffusivity in air | cm2/s | 0.63 | 0.24 | 0.038 | |
| Stoichiometric air–fuel ratio | 34.2 | 17.2 | 14.5 | 14.7 | |
| Flammability limits | % v/v in air | 4–76 | 5.3–15 | 0.6–5.5 | 1–7.6 |
| Minimum energy for ignition in air | mJ | 0.02 | 0.29 | 0.24 | |
| Specific heat of hydrogen gas at constant pressure (CP) | J/kgK | 14,200 | 2340 | 2050 | 2100 |
| Engine Load | HES | |||
|---|---|---|---|---|
| Type 1 | Set out in the study | Set out in the study | Varies when modifying the HES | Varies when modifying the HES |
| Type 2 | Set out in the study | Varies when modifying | Set out in the study | Varies when modifying |
| Type 3 | Varies when modifying | Varies when modifying | Set out in the study | Set out in the study |
| Ref. | H2 Enrichment and Mixing Process Type of Test | Engine Specifications | Key Findings (BTE=) Data Directly Reflected in the Document (BTE≈) Approximately Measured Data in the Document’s Figures |
|---|---|---|---|
| [49] | 0–25% HES Manifold inj. Type 1 | Four cylinders Max. power: 103 kW at 4000 rpm Max. torque: 320 Nm at 1750–2500 rpm Turbocharged | (2000 rpm, 15% load, no H2) BTE = 27.96% |
| (2000 rpm, 15% load, 25% HES) BTE = 28.94% | |||
| (2000 rpm, 30% load, no H2) BTE = 35.95% | |||
| (2000 rpm, 30% load, 25% HES) BTE = 34.12% | |||
| (2000 rpm, 45% load, no H2) BTE = 37.43% | |||
| (2000 rpm, 45% load, 25% HES) BTE = 36.44% | |||
| [50] | 25 L/min Carburetor Type 2 | Four cylinders Max. power: 60 kW at 2200 rpm Max. torque: 290 Nm at 1400 rpm Naturally aspirated MEP = 0.689 MPa | (2200 rpm, 25% load, no H2) BTE ≈ 12% |
| (2200 rpm, 25% load, 25 L/min) BTE ≈ 13% | |||
| (2200 rpm, 50% load, no H2) BTE ≈ 16% | |||
| (2200 rpm, 50% load, 25 L/min) BTE ≈ 18% | |||
| (2200 rpm, 100% load, no H2) BTE = 21.85% | |||
| (2200 rpm, 100% load, 25 L/min) BTE = 23.5% | |||
| [51] | 0–40 L/min Carburetor Type 2 | Four cylinders Max. power: 48 kW at 4000 rpm Max. torque: 160 Nm at 1750 rpm Turbocharged | (1750 rpm, 50 Nm, no H2) BTE = 32% |
| (1750 rpm, 50 Nm, 20 L/min) BTE = 32% | |||
| (1750 rpm, 50 Nm, 40 L/min) BTE = 32% | |||
| (1750 rpm, 75 Nm, no H2) BTE = 35% | |||
| (1750 rpm, 75 Nm, 20 L/min) BTE = 35% | |||
| (1750 rpm, 75 Nm, 40 L/min) BTE = 36% | |||
| (1750 rpm, 100 Nm, no H2) BTE = 38% | |||
| (1750 rpm, 100 Nm, 20 L/min) BTE = 39% | |||
| (1750 rpm, 100 Nm, 40 L/min) BTE = 37% | |||
| [52] | 0–30% HES Direct inj. Type 1 | Two cylinders Max. power: 21 kW at 2200 rpm Max. torque: No data Naturally aspirated | (1800 rpm, no H2) BTE = 29.5% |
| (1800 rpm, 10% HES) BTE = 30% | |||
| (1800 rpm, 20% HES) BTE = 32.2% | |||
| (1800 rpm, 30% HES) BTE = 35% | |||
| [21] | 7 L/min Manifold inj. Type 2 | Single cylinder Max. power: 5.2 kW at 1500 rpm Max. torque: No data Naturally aspirated | (1500 rpm, 30% load, no H2) BTE ≈ 14.5% |
| (1500 rpm, 30% load, 7 L/min) BTE ≈ 15% | |||
| (1500 rpm, 50% load, no H2) BTE ≈ 21% | |||
| (1500 rpm, 50% load, 7 L/min) BTE ≈ 22% | |||
| (1500 rpm, 100% load, no H2) BTE ≈ 26% | |||
| (1500 rpm, 100% load, 7 L/min) BTE ≈ 26.5% | |||
| [53] | 0–10 L/min (0–28% HES) Manifold inj. Type 2 | Single cylinder Max. power: 5.2 kW at 1500 rpm Max. torque: No data Naturally aspirated | (1500 rpm, 30% load, no H2) BTE ≈ 13% |
| (1500 rpm, 30% load, 7 L/min) BTE ≈ 18% | |||
| (1500 rpm, 30% load, 10 L/min) BTE ≈ 17% | |||
| (1500 rpm, 90% load, no H2) BTE ≈ 26% | |||
| (1500 rpm, 90% load, 7 L/min) BTE ≈ 32% | |||
| (1500 rpm, 90% load, 10 L/min) BTE ≈ 30% | |||
| (1500 rpm, 100% load, no H2) BTE ≈ 25% | |||
| (1500 rpm, 100% load, 7 L/min) BTE ≈ 30% | |||
| (1500 rpm, 100% load, 10 L/min) BTE ≈ 27.5% | |||
| [54] | 0–30% HES Manifold inj. Type 1 | Single cylinder Max. power: 5.2 kW at 1500 rpm Max. torque: No data Naturally aspirated | (1500 rpm, 25% load, no H2) BTE ≈ 15% |
| (1500 rpm, 25% load, 30% HES) BTE ≈ 14% | |||
| (1500 rpm, 50% load, no H2) BTE ≈ 20.5% | |||
| (1500 rpm, 50% load, 30% HES) BTE ≈ 20.5% | |||
| (1500 rpm, 100% load, no H2) BTE ≈ 29% | |||
| (1500 rpm, 100% load, 30% HES) BTE ≈ 31% | |||
| [22] | 0–0.08 kg/h (0–28% HES) Port inj. Type 2 | Single cylinder Max. power: 7.4 kW at 3600 rpm Max. torque: 28 Nm at 2000 rpm Naturally aspirated | (1800 rpm, 10 Nm, no H2) BTE = 20.78% |
| (1800 rpm, 10 Nm, 7.5% HES) BTE ≈ 20.4% | |||
| (1800 rpm, 10 Nm, 17.5% HES) BTE ≈ 19.5% | |||
| (1800 rpm, 10 Nm, 28% HES) BTE = 19.59% | |||
| [55] | 0–20% HES Manifold inj. Type 1 | Single cylinder Max. power: 5.2 kW at 1500 rpm Max. torque: No data Naturally aspirated | (1500 rpm, 25% load, no H2) BTE ≈ 16% |
| (1500 rpm, 25% load, 10% HES) BTE ≈ 16% | |||
| (1500 rpm, 25% load, 20% HES) BTE ≈ 15.5% | |||
| (1500 rpm, 50% load, no H2) BTE ≈ 24.5% | |||
| (1500 rpm, 50% load, 10% HES) BTE ≈ 23.7% | |||
| (1500 rpm, 50% load, 20% HES) BTE ≈ 23.5% | |||
| (1500 rpm, 75% load, no H2) BTE ≈ 28.2% | |||
| (1500 rpm, 75% load, 10% HES) BTE ≈ 28% | |||
| (1500 rpm, 75% load, 20% HES) BTE ≈ 27.5% | |||
| [56] | 0–36 L/min (0–86% HES) Manifold inj. Type 2 | Single cylinder Max. power: 5.97 kW at 2200 rpm Max. torque: No data Naturally Aspirated | (1850 rpm, 4 Nm load, no H2) BTE ≈ 13% |
| (1850 rpm, 4 Nm load, 6 L/min) BTE ≈ 13% | |||
| (1850 rpm, 4 Nm load, 18 L/min) BTE ≈ 10% | |||
| (1850 rpm, 4 Nm load, 36 L/min) BTE ≈ 10% | |||
| (1850 rpm, 20 Nm load, no H2) BTE ≈ 31% | |||
| (1850 rpm, 20 Nm load, 6 L/min) BTE ≈ 29.5% | |||
| (1850 rpm, 20 Nm load, 18 L/min) BTE ≈ 29% | |||
| (1850 rpm, 20 Nm load, 36 L/min) BTE ≈ 29% |
| Ref. | H2 Enrichment and Mixing Process Type of Test | Engine Specifications | Key Findings (VE=) Data Directly Reflected in the Document (VE≈) Approximately Measured Data in the Document’s Figures |
|---|---|---|---|
| [23] | 0–10% mass fraction (0–24% HES) Manifold inj. Type 2 | Single cylinder Max. power: 7.35 kW at 3600 rpm Max. torque: No data Naturally aspirated | (3600 rpm, 60% load, no H2) VE = 79.9% |
| (3600 rpm, 60% load, 2% mass) VE = 79.5% | |||
| (3600 rpm, 60% load, 6% mass) VE = 78.7% | |||
| (3600 rpm, 60% load, 8% mass) VE = 77% | |||
| (3600 rpm, 60% load, 10% mass) VE = 75.4% | |||
| [54] | 0–30% HES Manifold inj. Type 1 | Single cylinder Max. power: 5.2 kW at 1500 rpm Max. torque: No data Naturally aspirated | (1500 rpm, 25% load, no H2) VE ≈ 68.5% |
| (1500 rpm, 25% load, 10% HES) VE ≈ 67.5% | |||
| (1500 rpm, 25% load, 30% HES) VE ≈ 67% | |||
| (1500 rpm, 50% load, no H2) VE ≈ 67% | |||
| (1500 rpm, 50% load, 10% HES) VE ≈ 66.5% | |||
| (1500 rpm, 50% load, 30% HES) VE ≈ 65.5% | |||
| (1500 rpm, 100% load, no H2) VE ≈ 65.5% | |||
| (1500 rpm, 100% load, 10% HES) VE ≈ 64% | |||
| (1500 rpm, 100% load, 30% HES) VE ≈ 62% | |||
| [55] | 0–20% HES Manifold inj. Type 1 | Single cylinder Max. power: 5.2 kW at 1500 rpm Max. torque: No data Naturally aspirated | (1500 rpm, 50% load, no H2) VE = 75.8% |
| (1500 rpm, 50% load, 10% HES) VE = 74.8% | |||
| (1500 rpm, 50% load, 20% HES) VE = 73.9% | |||
| (1500 rpm, 75% load, no H2) VE = 75.6% | |||
| (1500 rpm, 75% load, 10% HES) VE = 73.7% | |||
| (1500 rpm, 75% load, 20% HES) VE = 72.2% | |||
| [56] | 0–36 L/min (0–86% HES) Manifold inj. Type 2 | Single cylinder Max. power: 5.97 kW at 2200 rpm Max. torque: No data | (1850 rpm, 20 Nm, 6 L/min) BTE = 8.8% higher than 36 lpm |
| Ref. | H2 Enrichment and Mixing Process Type of Test | Engine Specifications | Key Findings (ID=) Data Directly Reflected in the Document (ID≈) Approximately Measured Data in the Document’s Figures |
|---|---|---|---|
| [46] | 0–40 L/min (0–24% HES) Carburetor Type 2 | Four cylinders Max. power: 48 kW at 4000 rpm Max. torque: 160 Nm at 1750 rpm Turbocharged | (1750 rpm, 50 Nm, no H2) ID = 17° CA |
| (1750 rpm, 50 Nm, 20 L/min) ID = 26° CA | |||
| (1750 rpm, 50 Nm, 40 L/min) ID = 25° CA | |||
| (1750 rpm, 75 Nm, no H2) ID = 26° CA | |||
| (1750 rpm, 75 Nm, 20 L/min) ID = 29° CA | |||
| (1750 rpm, 75 Nm, 40 L/min) ID = 28° CA | |||
| (1750 rpm, 100 Nm, 0, 20, 40 L/min) ID = 27° CA | |||
| [62] | 0–50% HES Carburetor Type 1 | Four cylinders Max. power: 62.5 kW at 1500 rpm Max. torque: No data Turbocharged | (1500 rpm, 13% load, no H2) ID = 11° CA |
| (1500 rpm, 13% load, 30% HES) ID = 13° CA | |||
| (1500 rpm, 13% load, 50% HES) ID = 11° CA | |||
| (1500 rpm, 40% load, no H2) ID = 9° CA | |||
| (1500 rpm, 40% load, 30% HES) ID = 10.5° CA | |||
| (1500 rpm, 40% load, 50% HES) ID = 9.5° CA | |||
| (1500 rpm, 80% load, no H2) ID = 8° CA | |||
| (1500 rpm, 80% load, 30% HES) ID = 9.5° CA | |||
| (1500 rpm, 80% load, 50% HES) ID = 9° CA | |||
| [63] | 0–50% HES Carburetor Type 1 | Four cylinders Max. power: 62.5 kW at 1500 rpm Max. torque: No data Turbocharged | (1500 rpm, 40% load, no H2) ID = 10° CA |
| (1500 rpm, 40% load, 30% HES) ID = 13° CA | |||
| (1500 rpm, 40% load, 50% HES) ID = 10° CA | |||
| (1500 rpm, 80% load, no H2) ID = 9° CA | |||
| (1500 rpm, 80% load, 30% HES) ID = 11° CA | |||
| (1500 rpm, 80% load, 50% HES) ID = 9° CA | |||
| [23] | 0–10% mass fraction (0–24% HES) Manifold inj. Type 2 | Single cylinder Max. power: 7.35 kW at 3600 rpm Max. torque: No data Naturally aspirated | (3600 rpm, 60% load, no H2) ID = 15.68° CA |
| (3600 rpm, 60% load, 2% mass) ID = 15.34° CA | |||
| (3600 rpm, 60% load, 6% mass) ID = 15.24° CA | |||
| (3600 rpm, 60% load, 8% mass) ID = 15.15° CA | |||
| (3600 rpm, 60% load, 10% mass) ID = 15.03° CA | |||
| [24] | 0–34% HES Manifold inj. Type 1 | Single cylinder Max. power: 7 kW at 1500 rpm Max. torque: No data Naturally aspirated | (1500 rpm, 100% load, no H2) ID = 18° CA |
| (1500 rpm, 100% load, 4% HES) ID = 18° CA | |||
| (1500 rpm, 100% load, 7% HES) ID = 18° CA | |||
| (1500 rpm, 100% load, 12% HES) ID = 18° CA | |||
| (1500 rpm, 100% load, 23% HES) ID = 19° CA | |||
| (1500 rpm, 100% load, 34% HES) ID = 18° CA | |||
| [53] | 0–10 L/min (0–28% HES) Manifold inj. Type 2 | Single cylinder Max. power: 5.2 kW at 1500 rpm Max. torque: 84.4 Nm at 1200 rpm Naturally aspirated | (1500 rpm, 30% load, no H2) ID = 7° CA |
| (1500 rpm, 30% load, 10 L/min) ID = 8° CA | |||
| (1500 rpm, 60% load, no H2) ID = 6° CA | |||
| (1500 rpm, 60% load, 10 L/min) ID = 7° CA | |||
| (1500 rpm, 90% load, no H2) ID = 5° CA | |||
| (1500 rpm, 90% load, 10 L/min) ID = 7° CA | |||
| [22] | 0–0.08 kg/h (0–28% HES) Port inj. Type 2 | Single cylinder Max. power: 7.4 kW at 3600 rpm Max. torque: 28 Nm at 2000 rpm Naturally aspirated | (1800 rpm, 10 Nm, no H2) ID ≈ 12.5° CA |
| (1800 rpm, 10 Nm, 7.37% HES) ID ≈ 12.8° CA | |||
| (1800 rpm, 10 Nm, 17.52% HES) ID ≈ 12.9° CA | |||
| (1800 rpm, 10 Nm, 28.60% HES) ID =13.03° CA | |||
| [64] | 0–50% HES Manifold inj. Type 2 | Single cylinder Max. power: 13.2 kW at 1500 rpm Max. torque: No data Naturally aspirated | (965 rpm, ML, no H2) ID = 22° CA |
| (965 rpm, ML, 15% HES) ID = 21° CA | |||
| (965 rpm, ML, 41% HES) ID = 17° oCA | |||
| (965 rpm, NL, no H2) ID = 20° CA | |||
| (965 rpm, NL, 14% HES) ID = 21° CA | |||
| (965 rpm, NL, 33% HES) ID = 15° CA |
| Ref. | H2 Enrichment and Mixing Process Type of Test | Engine Specifications | Key Findings (CD=) Data Directly Reflected in the Document (CD≈) Approximately Measured Data in the Document’s Figures |
|---|---|---|---|
| [46] | 0–40 L/min Carburetor Type 2 | Four cylinders Max. power: 48 kW at 4000 rpm Max. torque: 160 Nm at 1750 rpm Turbocharged | (1750 rpm, 50 Nm, no H2) CD = 66° CA |
| (1750 rpm, 50 Nm, 20 L/min) CD = 90° CA | |||
| (1750 rpm, 50 Nm, 40 L/min) CD = 95° CA | |||
| (1750 rpm, 75 Nm, no H2) CD = 87° CA | |||
| (1750 rpm, 75 Nm, 20 L/min) CD = 88° CA | |||
| (1750 rpm, 75 Nm, 40 L/min) CD = 91° CA | |||
| (1750 rpm, 100 Nm, no H2) CD = 92° CA | |||
| (1750 rpm, 100 Nm, 20 L/min) CD = 89° CA | |||
| (1750 rpm, 100 Nm, 40 L/min) CD = 89° CA | |||
| [62] | 0–50% HES Carburetor Type 1 | Four cylinders Max. power: 62.5 kW at 1500 rpm Max. torque: No data Turbocharged | (1500 rpm, 13% load, no H2) CD = 23° CA |
| (1500 rpm, 13% load, 30% HES) CD = 25.5° CA | |||
| (1500 rpm, 13% load, 50% HES) CD = 24° CA | |||
| (1500 rpm, 40% load, no H2) CD = 25° CA | |||
| (1500 rpm, 40% load, 30% HES) CD = 24° CA | |||
| (1500 rpm, 40% load, 50% HES) CD = 23° CA | |||
| (1500 rpm, 80% load, no H2) CD = 30° CA | |||
| (1500 rpm, 80% load, 30% HES) CD = 27.5° CA | |||
| (1500 rpm, 80% load, 50% HES) CD = 26° CA | |||
| [24] | 0–34% HES Manifold inj. Type 1 | Single cylinder Max. power: 7 kW at 1500 rpm Max. torque: No data Naturally aspirated | (1500 rpm, 100% load, no H2) CD = 53° CA |
| (1500 rpm, 100% load, 4% HES) CD = 52° CA | |||
| (1500 rpm, 100% load, 7% HES) CD = 49° CA | |||
| (1500 rpm, 100% load, 12% HES) CD = 47° CA | |||
| (1500 rpm, 100% load, 23% HES) CD = 43° CA | |||
| (1500 rpm, 100% load, 34% HES) CD = 52° CA | |||
| [53] | 0–10 L/min (0–28% HES) Manifold inj. Type 2 | Single cylinder Max. power: 5.2 kW at 1500 rpm Max. torque: 84.4 Nm at 1200 rpm Naturally aspirated | (1500 rpm, 30% load, no H2) CD ≈ 26° CA |
| (1500 rpm, 30% load, 10 L/min) CD ≈ 27° CA | |||
| (1500 rpm, 90% load, no H2) CD ≈ 30° CA | |||
| (1500 rpm, 90% load, 10 L/min) CD ≈ 28° CA | |||
| (1500 rpm, 100% load, no H2) CD ≈ 32° CA | |||
| (1500 rpm, 100% load, 10 L/min) CD ≈ 28° CA | |||
| [22] | 0–0.08 kg/h (0–28% HES) Port inj. Type 2 | Single cylinder Max. power: 7.4 kW at 3600 rpm Max. torque: 28 Nm at 2000 rpm Naturally aspirated | (1800 rpm, 10 Nm, no H2) CD = 26.66° CA |
| (1800 rpm, 10 Nm, 7.5% HES) CD ≈ 25.5° CA | |||
| (1800 rpm, 10 Nm, 17.5% HES) CD ≈ 22.2° CA | |||
| (1800 rpm, 10 Nm, 28% HES) CD = 22.66° CA | |||
| [56] | 0–36 L/min (0–86% HES) Manifold inj. Type 2 | Single cylinder Max. power: 5.97 kW at 2200 rpm Max. torque: No data | (1850 rpm, 4 Nm load, no H2) CD ≈ 30° CA |
| (1850 rpm, 4 Nm load, 6 L/min) CD ≈ 33° CA | |||
| (1850 rpm, 4 Nm load, 18 L/min) CD ≈ 32° CA | |||
| (1850 rpm, 4 Nm load, 36 L/min) CD ≈ 33° CA | |||
| (1850 rpm, 20 Nm load, no H2) CD ≈ 38° CA | |||
| (1850 rpm, 20 Nm load, 6 L/min) CD ≈ 45 ° CA | |||
| (1850 rpm, 20 Nm load, 18 L/min) CD ≈ 58° CA | |||
| (1850 rpm, 20 Nm load, 36 L/min) CD ≈ 61° CA | |||
| [64] | 0–50% HES Manifold inj. Type 2 | Single cylinder Max. power: 13.2 kW at 1500 rpm Max. torque: No data Naturally aspirated | (965 rpm, ML, no H2) CD ≈ 65° CA |
| (965 rpm, ML, 15% HES) CD ≈ 58° CA | |||
| (965 rpm, ML, 41% HES) CD ≈ 56° CA | |||
| (965 rpm, NL, no H2) CD ≈ 70° CA | |||
| (965 rpm, NL, 14% HES) CD ≈ 66° CA | |||
| (965 rpm, NL, 33% HES) CD ≈ 56° CA |
| Ref. | H2 Enrichment and Mixing Process Type of Test | Engine Specifications | Key Findings (Pmax=) Data Directly Reflected in the Document (Pmax≈) Approximately Measured Data in the Document’s Figures |
|---|---|---|---|
| [49] | 0–25% HES Manifold inj. Type 1 | Four cylinders Max. power: 103 kW at 4000 rpm Max. torque: 320 Nm at 1750–2500 rpm Turbocharged | (2000 rpm, 15% load, no H2) Pmax = 50.74 bar |
| (2000 rpm, 15% load, 25% HES) Pmax = 52.25 bar | |||
| (2000 rpm, 45% load, no H2) Pmax = 71.93 bar | |||
| (2000 rpm, 45% load, 25% HES) Pmax = 69.97 bar | |||
| [51] | 0–40 L/min Carburetor Type 2 | Four cylinders Max. power: 48 kW at 4000 rpm Max. torque: 160 Nm at 1750 rpm Turbocharged | (1750 rpm, 50 Nm, no H2) Pmax = 65.7 bar |
| (1750 rpm, 50 Nm, 20 L/min) Pmax = 66.7 bar | |||
| (1750 rpm, 50 Nm, 40 L/min) Pmax = 73 bar | |||
| (1750 rpm, 100 Nm, no H2) Pmax = 93 bar | |||
| (1750 rpm, 100 Nm, 20 L/min) Pmax = 94 bar | |||
| (1750 rpm, 100 Nm, 40 L/min) Pmax = 94 bar | |||
| [65] | 0–21% HES Manifold inj. Type 1 | Four cylinders Max. power: 55 kW at 3900 rpm Max. torque: 156 Nm at 2000 rpm Turbocharged | (2000 rpm, 55% load, no H2) Pmax ≈ 82 bar |
| (2000 rpm, 55% load, 7% HES) Pmax ≈ 90 bar | |||
| (2000 rpm, 55% load, 13% HES) Pmax ≈ 92 bar | |||
| (2000 rpm, 55% load, 21% HES) Pmax ≈ 98 bar | |||
| [21] | 7 L/min Manifold inj. Type 1 | Single cylinder Max. power: 5.2 kW at 1500 rpm Max. torque: No data Naturally aspirated | (1500 rpm, 100% load, no H2) Pmax = 61.26 bar |
| (1500 rpm, 100% load, 7 L/min) Pmax = 68.72 bar | |||
| [23] | 0–10% HES Manifold inj. Type 2 | Single cylinder Max. power: 7.35 kW at 3600 rpm Max. torque: No data Naturally aspirated | (3600 rpm, 60% load, no H2) Pmax = 56.1 bar |
| (3600 rpm, 60% load, 2% HES) Pmax = 57.4 bar | |||
| (3600 rpm, 60% load, 8% HES) Pmax = 59.1 bar | |||
| (3600 rpm, 60% load, 10% HES) Pmax = 61.2 bar | |||
| [24] | 0–34% HES Manifold inj. Type 1 | Single cylinder Max. power: 7 kW at 4200 rpm Max. torque: No data Naturally aspirated | (1500 rpm, 100% load, no H2) Pmax ≈ 60 bar |
| (1500 rpm, 100% load, 34% HES) Pmax = 71 bar | |||
| [53] | 0–10 L/min (0–28% HES) Manifold inj. Type 2 | Single cylinder Max. power: 5.2 kW at 1500 rpm Max. torque: 84.4 Nm at 1200 rpm Naturally aspirated | (1500 rpm, 100% load, no H2) Pmax = 69 bar |
| (1500 rpm, 100% load, 7 L/min) Pmax = 77.69 bar | |||
| (1500 rpm, 100% load, 10 L/min) Pmax ≈ 76 bar | |||
| [22] | 0–0.08 kg/h (0–28% HES) Port inj. Type 2 | Single cylinder Max. power: 7.4 kW at 3600 rpm Max. torque: 28 Nm at 2000 rpm Naturally aspirated | (1800 rpm, 10 Nm, no H2) Pmax = 70.69 bar |
| (1800 rpm, 10 Nm, 7.5% HES) Pmax ≈ 71 bar | |||
| (1800 rpm, 10 Nm, 17.5% HES) Pmax ≈ 72 bar | |||
| (1800 rpm, 10 Nm, 28% HES) Pmax = 79.89 bar | |||
| [56] | 0–36 L/min (0–86% HES) Manifold inj. Type 2 | Single cylinder Max. power: 5.97 kW at 2200 rpm Max. torque: No data | (1850 rpm, 20 Nm load, no H2) Pmax ≈ 59 bar |
| (1850 rpm, 20 Nm load, 6 L/min) Pmax ≈ 58.5 bar | |||
| (1850 rpm, 20 Nm load, 18 L/min) Pmax ≈ 54 bar | |||
| (1850 rpm, 20 Nm load, 36 L/min) Pmax ≈ 51 bar | |||
| [64] | 0–50% HES Manifold inj. Type 2 | Single cylinder Max. power: 13.2 kW at 1500 rpm Max. torque: No data Naturally aspirated | (965 rpm, ML, no H2) Pmax = 58 bar |
| (965 rpm, ML, 15% HES) Pmax = 56 bar | |||
| (965 rpm, ML, 41% HES) Pmax = 64 bar | |||
| (965 rpm, NL, no H2) Pmax = 65.5 bar | |||
| (965 rpm, NL, 14% HES) Pmax = 65.5 bar | |||
| (965 rpm, NL, 33% HES) Pmax = 78 bar | |||
| [66] | 0–15 L/min Manifold inj. Type 2 | Single cylinder Max. power: 5.2 kW at 1500 rpm Max. torque: No data Naturally aspirated | (1500 rpm, 100% load, no H2) Pmax = 65.12 bar |
| (1500 rpm, 100% load, 3 L/min) Pmax = 65.77 bar | |||
| (1500 rpm, 100% load, 9 L/min) Pmax = 67.79 bar | |||
| (1500 rpm, 100% load, 15 L/min) Pmax = 70.98 bar |
| Ref. | H2 Enrichment and Mixing Process Type of Test | Engine Specifications | Key Findings (CO2=) Data Directly Reflected in the Document (CO2≈) Approximately Measured Data in the Document’s Figures |
|---|---|---|---|
| [36] | 0–80% HES Manifold inj. Type 1 | Four cylinders Max. power: 58 kW at 4500 rpm Max. torque: 145 Nm at 2350 rpm Turbocharged | (2400 rpm, 30% load, no H2) CO2 ≈ 950 g/kWh |
| (2400 rpm, 30% load, 30% HES) CO2 ≈ 900 g/kWh | |||
| (2400 rpm, 30% load, 80% HES) CO2 ≈ 500 g/kWh | |||
| (2400 rpm, 60% load, no H2) CO2 ≈ 700 g/kWh | |||
| (2400 rpm, 60% load, 30% HES) CO2 ≈ 600 g/kWh | |||
| (2400 rpm, 60% load, 60% HES) CO2 ≈ 400 g/kWh | |||
| (2400 rpm, 100% load, no H2) CO2 ≈ 650 g/kWh | |||
| (2400 rpm, 100% load, 30% HES) CO2 ≈ 500 g/kWh | |||
| (2400 rpm, 100% load, 40% HES) CO2 ≈ 450 g/kWh | |||
| [49] | 0–25% HES Manifold inj. Type 1 | Four cylinders Max. power: 103 kW at 4000 rpm Max. torque: 320 Nm at 1750–2500 rpm Turbocharged | (2000 rpm, 15% load, no H2) CO2 = 6.09% vol |
| (2000 rpm, 15% load, 25% HES) CO2 = 5.03% vol | |||
| (2000 rpm, 30% load, no H2) CO2 = 7.36% vol | |||
| (2000 rpm, 30% load, 25% HES) CO2 = 6.58% vol | |||
| (2000 rpm, 45% load, no H2) CO2 = 7.92% vol | |||
| (2000 rpm, 45% load, 25% HES) CO2 = 7.15% vol | |||
| [51] | 0–40 L/min Carburetor Type 2 | Four cylinders Max. power: 48 kW at 4000 rpm Max. torque: 160 Nm at 1750 rpm Turbocharged | (1750 rpm, 50 Nm, no H2) CO2 ≈ 5.1% vol |
| (1750 rpm, 50 Nm, 20 L/min) CO2 ≈ 4.5% vol | |||
| (1750 rpm, 50 Nm, 40 L/min) CO2 ≈ 4.4% vol | |||
| (1750 rpm, 100 Nm, no H2) CO2 ≈ 9.7% vol | |||
| (1750 rpm, 100 Nm, 20 L/min) CO2 ≈ 9.5% vol | |||
| (1750 rpm, 100 Nm, 40 L/min) CO2 ≈ 7.5% vol | |||
| [65] | 0–21% HES Manifold inj. Type 1 | Four cylinders Max. power: 55 kW at 3900 rpm Max. torque: 156 Nm at 2000 rpm Turbocharged | (2000 rpm, 55% load, no H2) CO2 ≈ 7.2% vol |
| (2000 rpm, 55% load, 7% HES) CO2 ≈ 6.9% vol | |||
| (2000 rpm, 55% load, 13% HES) CO2 ≈ 6.6% vol | |||
| (2000 rpm, 55% load, 21% HES) CO2 ≈ 6.2% vol | |||
| [21] | 7 L/min Manifold inj. Type 1 | Single cylinder Max. power: 5.2 kW at 1500 rpm Max. torque: No data Naturally aspirated | (1500 rpm, 30% load, no H2) CO2 ≈ 2.6% vol |
| (1500 rpm, 30% load, 7 L/min) CO2 ≈ 2.4% vol | |||
| (1500 rpm, 50% load, no H2) CO2 ≈ 4% vol | |||
| (1500 rpm, 50% load, 7 L/min) CO2 ≈ 3.9% vol | |||
| (1500 rpm, 100% load, no H2) CO2 ≈ 7% vol | |||
| (1500 rpm, 100% load, 7 L/min) CO2 ≈ 6.9% vol | |||
| [23] | 0–10% HES Manifold inj. Type 2 | Single cylinder Max. power: 7.35 kW at 3600 rpm Max. torque: No data Naturally aspirated | (3600 rpm, 60% load, no H2) CO2 = 6.71% vol |
| (3600 rpm, 60% load, 6% HES) CO2 = 5.82% vol | |||
| (3600 rpm, 60% load, 8% HES) CO2 = 5.63% vol | |||
| (3600 rpm, 60% load, 10% HES) CO2 = 5.38% vol | |||
| [24] | 0–34% HES Manifold inj. Type 1 | Single cylinder Max. power: 7 kW at 4200 rpm Max. torque: No data Naturally aspirated | (1500 rpm, 100% load, no H2) CO2 = 7.80% vol |
| (1500 rpm, 100% load, 4% HES) CO2 = 7.17% vol | |||
| (1500 rpm, 100% load, 7% HES) CO2 = 6.98% vol | |||
| (1500 rpm, 100% load, 12% HES) CO2 = 6.47% vol | |||
| (1500 rpm, 100% load, 23% HES) CO2 = 6.29% vol | |||
| (1500 rpm, 100% load, 34% HES) CO2 = 4.61% vol | |||
| [54] | 0–30% HES Manifold inj. Type 1 | Single cylinder Max. power: 5.2 kW at 1500 rpm Max. torque: No data Naturally aspirated | (1500 rpm, 25% load, no H2) CO2 ≈ 1700 g/kWh |
| (1500 rpm, 25% load, 10% HES) CO2 ≈ 1400 g/kWh | |||
| (1500 rpm, 25% load, 30% HES) CO2 ≈ 1250 g/kWh | |||
| (1500 rpm, 50% load, no H2) CO2 ≈ 1100 g/kWh | |||
| (1500 rpm, 50% load, 10% HES) CO2 ≈ 950 g/kWh | |||
| (1500 rpm, 50% load, 30% HES) CO2 ≈ 800 g/kWh | |||
| (1500 rpm, 100% load, no H2) CO2 ≈ 850 g/kWh | |||
| (1500 rpm, 100% load, 10% HES) CO2 ≈ 750 g/kWh | |||
| (1500 rpm, 100% load, 30% HES) CO2 ≈ 550 g/kWh | |||
| [22] | 0–0.08 kg/h (0–28% HES) Port inj. Type 2 | Single cylinder Max. power: 7.4 kW at 3600 rpm Max. torque: 28 Nm at 2000 rpm Naturally aspirated | (1800 rpm, 10 Nm, no H2) CO2 ≈ 690 g/kWh |
| (1800 rpm, 10 Nm, 7.5% HES) CO2 ≈ 675 g/kWh | |||
| (1800 rpm, 10 Nm, 17.5% HES) CO2 ≈ 650 g/kWh | |||
| (1800 rpm, 10 Nm, 28% HES) CO2 ≈ 620 g/kWh | |||
| [55] | 0–20% HES Manifold inj. Type 1 | Single cylinder Max. power: 5.2 kW at 1500 rpm Max. torque: No data Naturally aspirated | (1500 rpm, 25% load, no H2) CO2 ≈ 37,000 ppm |
| (1500 rpm, 25% load, 20% HES) CO2 ≈ 32,000 ppm | |||
| (1500 rpm, 50% load, no H2) CO2 ≈ 52,000 ppm | |||
| (1500 rpm, 50% load, 20% HES) CO2 ≈ 43,000 ppm | |||
| (1500 rpm, 75% load, no H2) CO2 ≈ 65,000 ppm | |||
| (1500 rpm, 75% load, 20% HES) CO2 ≈ 56,000 ppm | |||
| [56] | 0–36 L/min (0–86% HES) Manifold inj. Type 2 | Single cylinder Max. power: 5.97 kW at 2200 rpm Max. torque: No data | (1850 rpm, 12 Nm load, no H2) CO2 ≈ 5% vol |
| (1850 rpm, 12 Nm load, 12 L/min) CO2 ≈ 4.5% vol | |||
| (1850 rpm, 12 Nm load, 24 L/min) CO2 ≈ 2.5% vol | |||
| (1850 rpm, 12 Nm load, 36 L/min) CO2 ≈ 2.25% vol | |||
| (1850 rpm, 20 Nm load, no H2) CO2 ≈ 7.5% vol | |||
| (1850 rpm, 20 Nm load, 12 L/min) CO2 ≈ 7% vol | |||
| (1850 rpm, 20 Nm load, 24 L/min) CO2 ≈ 6% vol | |||
| (1850 rpm, 20 Nm load, 36 L/min) CO2 ≈ 5% vol | |||
| [64] | 0–50% HES Manifold inj. Type 2 | Single cylinder Max. power: 13.2 kW at 1500 rpm Max. torque: No data Naturally aspirated | (965 rpm, ML, no H2) CO2 ≈ 4.6% vol |
| (965 rpm, ML, 15% HES) CO2 ≈ 4.4% vol | |||
| (965 rpm, ML, 41% HES) CO2 ≈ 3.4% vol | |||
| (965 rpm, NL, no H2) CO2 ≈ 6.9% vol | |||
| (965 rpm, NL, 14% HES) CO2 ≈ 6.7% vol | |||
| (965 rpm, NL, 33% HES) CO2 ≈ 5.7% vol |
| Ref. | H2 Enrichment and Mixing Process Type of Test | Engine Specifications | Key Findings (CO=) Data Directly Reflected in the Document (CO≈) Approximately Measured Data in the Document’s Figures |
|---|---|---|---|
| [50] | 25 L/min Carburetor Type 2 | Four cylinders Max. power: 60 kW at 2200 rpm Max. torque: No data Naturally aspirated | (2200 rpm, 25% load, no H2) CO ≈ 0.24% vol |
| (2200 rpm, 25% load, 25 L/min) CO ≈ 0.06% vol | |||
| (2200 rpm, 50% load, no H2) CO ≈ 0.26% vol | |||
| (2200 rpm, 50% load, 25 L/min) CO ≈ 0.09% vol | |||
| (2200 rpm, 100% load, no H2) CO ≈ 0.85% vol | |||
| (2200 rpm, 100% load, 25 L/min) CO ≈ 0.41% vol | |||
| [52] | 0–30% HES Direct inj. Type 1 | Two cylinders Max. power: 21 kW at 2200 rpm Max. torque: No data Naturally aspirated | (50% load, no H2) CO ≈ 2.8 g/kWh |
| (50% load, 10% HES) CO ≈ 2.6 g/kWh | |||
| (50% load, 20% HES) CO ≈ 2.4 g/kWh | |||
| (50% load, 30% HES) CO ≈ 1.7 g/kWh | |||
| (100% load, no H2) CO ≈ 4.2 g/kWh | |||
| (100% load, 10% HES) CO ≈ 3.7 g/kWh | |||
| (100% load, 20% HES) CO ≈ 3.6 g/kWh | |||
| (100% load, 30% HES) CO ≈ 3 g/kWh | |||
| [21] | 7 L/min Manifold inj. Type 1 | Single cylinder Max. power: 5.2 kW at 1500 rpm Max. torque: No data Naturally aspirated | (1500 rpm, 30% load, no H2) CO ≈ 0.085% vol |
| (1500 rpm, 30% load, 7 L/min) CO ≈ 0.082% vol | |||
| (1500 rpm, 50% load, no H2) CO ≈ 0.08% vol | |||
| (1500 rpm, 50% load, 7 L/min) CO ≈ 0.07% vol | |||
| (1500 rpm, 100% load, no H2) CO ≈ 0.14% vol | |||
| (1500 rpm, 100% load, 7 L/min) CO ≈ 0.12% vol | |||
| [23] | 0–10% HES Manifold inj. Type 2 | Single cylinder Max. power: 7.35 kW at 3600 rpm Max. torque: No data Naturally aspirated | (3600 rpm, 60% load, no H2) CO = 1850.3 ppm |
| (3600 rpm, 60% load, 2% HES) CO = 1137.2 ppm | |||
| (3600 rpm, 60% load, 6% HES) CO = 801.6 ppm | |||
| (3600 rpm, 60% load, 8% HES) CO = 751.5 ppm | |||
| (3600 rpm, 60% load, 10% HES) CO = 676.4 ppm | |||
| [24] | 0–34% HES Manifold inj. Type 1 | Single cylinder Max. power: 7 kW at 4200 rpm Max. torque: No data Naturally aspirated | (1500 rpm, 100% load, no H2) CO = 7.80% vol |
| (1500 rpm, 100% load, 4% HES) CO = 7.17% vol | |||
| (1500 rpm, 100% load, 7% HES) CO = 6.98% vol | |||
| (1500 rpm, 100% load, 12% HES) CO = 6.47% vol | |||
| (1500 rpm, 100% load, 23% HES) CO = 6.29% vol | |||
| (1500 rpm, 100% load, 34% HES) CO = 4.61% vol | |||
| [54] | 0–30% HES Manifold inj. Type 1 | Single cylinder Max. power: 5.2 kW at 1500 rpm Max. torque: No data Naturally aspirated | (1500 rpm, 25% load, no H2) CO ≈ 37 g/kWh |
| (1500 rpm, 25% load, 10% HES) CO ≈ 27 g/kWh | |||
| (1500 rpm, 25% load, 30% HES) CO ≈ 20 g/kWh | |||
| (1500 rpm, 50% load, no H2) CO ≈ 16 g/kWh | |||
| (1500 rpm, 50% load, 10% HES) CO ≈ 13 g/kWh | |||
| (1500 rpm, 50% load, 30% HES) CO ≈ 10 g/kWh | |||
| (1500 rpm, 100% load, no H2) CO ≈ 9 g/kWh | |||
| (1500 rpm, 100% load, 10% HES) CO ≈ 8 g/kWh | |||
| (1500 rpm, 100% load, 30% HES) CO ≈ 5 g/kWh | |||
| [22] | 0–0.08 kg/h (0–28% HES) Port inj. Type 2 | Single cylinder Max. power: 7.4 kW at 3600 rpm Max. torque: 28 Nm at 2000 rpm Naturally aspirated | (1800 rpm, 10 Nm, no H2) CO ≈ 14 g/kWh |
| (1800 rpm, 10 Nm, 7.5% HES) CO ≈ 12.7 g/kWh | |||
| (1800 rpm, 10 Nm, 17.5% HES) CO ≈ 11 g/kWh | |||
| (1800 rpm, 10 Nm, 28% HES) CO ≈ 8 g/kWh | |||
| [55] | 0–20% HES Manifold inj. Type 1 | Single cylinder Max. power: 5.2 kW at 1500 rpm Max. torque: No data Naturally aspirated | 1500 rpm, 25% load, no H2) CO ≈ 590 ppm |
| (1500 rpm, 25% load, 20% HES) CO ≈ 550 ppm | |||
| (1500 rpm, 50% load, no H2) CO ≈ 340 ppm | |||
| (1500 rpm, 50% load, 20% HES) CO ≈ 300 ppm | |||
| (1500 rpm, 75% load, no H2) CO ≈ 270 ppm | |||
| (1500 rpm, 75% load, 20% HES) CO ≈ 210 ppm | |||
| [64] | 0–50% HES Manifold inj. Type 2 | Single cylinder Max. power: 13.2 kW at 1500 rpm Max. torque: No data Naturally aspirated | (965 rpm, ML, no H2) CO ≈ 1500 ppm |
| (965 rpm, ML, 15% HES) CO ≈ 1200 ppm | |||
| (965 rpm, ML, 41% HES) CO ≈ 800 ppm | |||
| (965 rpm, NL, no H2) CO ≈ 2800 ppm | |||
| (965 rpm, NL, 14% HES) CO ≈ 3200 ppm | |||
| (965 rpm, NL, 33% HES) CO ≈ 2800 ppm | |||
| [66] | 0–15 L/min Manifold inj. Type 2 | Single cylinder Max. power: 5.2 kW at 1500 rpm Max. torque: No data Naturally aspirated | (1500 rpm, 0% load, no H2) CO ≈ 14 g/kWh |
| (1500 rpm, 0% load, 15 L/min) CO = 9.89 g/kWh | |||
| (1500 rpm, 100% load, no H2) CO = 59.95 g/kWh | |||
| (1500 rpm, 100% load, 15 L/min) CO = 52.97 g/kWh |
| Ref. | H2 Enrichment and Mixing Process Type of Test | Engine Specifications | Key Findings (HC=) Data Directly Reflected in the Document (HC≈) Approximately Measured Data in the Document’s Figures |
|---|---|---|---|
| [49] | 0–25% HES Manifold inj. Type 1 | Four cylinders Max. power: 103 kW at 4000 rpm Max. torque: 320 Nm at 1750–2500 rpm Turbocharged | (2000 rpm, 15% load, no H2) HC = 21.20 ppm |
| (2000 rpm, 15% load, 25% HES) HC = 16.89 ppm | |||
| (2000 rpm, 30% load, no H2) HC = 15.07 ppm | |||
| (2000 rpm, 30% load, 25% HES) HC = 9.92 ppm | |||
| (2000 rpm, 45% load, no H2) HC = 8.39 ppm | |||
| (2000 rpm, 45% load, 25% HES) HC = 5.17 ppm | |||
| [50] | 25 L/min Carburetor Type 2 | Four cylinders Max. power: 60 kW at 2200 rpm Max. torque: No data Naturally aspirated | (2200 rpm, 25% load, no H2) HC ≈ 185 ppm |
| (2200 rpm, 25% load, 25 L/min) HC ≈ 100 ppm | |||
| (2200 rpm, 50% load, no H2) HC ≈ 200 ppm | |||
| (2200 rpm, 50% load, 25 L/min) HC ≈ 105 ppm | |||
| (2200 rpm, 100% load, no H2) HC ≈ 345 ppm | |||
| (2200 rpm, 100% load, 25 L/min) HC ≈ 110 ppm | |||
| [51] | 0–40 L/min Carburetor Type 2 | Four cylinders Max. power: 48 kW at 4000 rpm Max. torque: 160 Nm at 1750 rpm Turbocharged | 1750 rpm, 50 Nm, no H2) HC ≈ 41 ppm |
| (1750 rpm, 50 Nm, 20 L/min) HC ≈ 30 ppm | |||
| (1750 rpm, 50 Nm, 40 L/min) HC ≈ 33 ppm | |||
| (1750 rpm, 75 Nm, no H2) HC ≈ 39 ppm | |||
| (1750 rpm, 75 Nm, 20 L/min) HC ≈ 32 ppm | |||
| (1750 rpm, 75 Nm, 40 L/min) HC ≈ 36 ppm | |||
| (1750 rpm, 100 Nm, no H2) HC ≈ 40 ppm | |||
| (1750 rpm, 100 Nm, 20 L/min) HC ≈ 35 ppm | |||
| (1750 rpm, 100 Nm, 40 L/min) HC ≈ 37 ppm | |||
| [52] | 0–30% HES Direct inj. Type 1 | Two cylinders Max. power: 21 kW at 2200 rpm Max. torque: No data Naturally aspirated | (50% load, no H2) HC ≈ 0.37 g/kWh |
| (50% load, 10% HES) HC ≈ 0.30 g/kWh | |||
| (50% load, 20% HES) HC ≈ 0.28 g/kWh | |||
| (50% load, 30% HES) HC ≈ 0.25 g/kWh | |||
| (100% load, no H2) HC ≈ 0.39 g/kWh | |||
| (100% load, 10% HES) HC = 0.37 g/kWh | |||
| (100% load, 20% HES) HC = 0.32 g/kWh | |||
| (100% load, 30% HES) HC = 0.28 g/kWh | |||
| [65] | 0–21% HES Manifold inj. Type 1 | Four cylinders Max. power: 55 kW at 3900 rpm Max. torque: 156 Nm at 2000 rpm Turbocharged | (2000 rpm, 55% load, no H2) HC ≈ 7 ppm |
| (2000 rpm, 55% load, 7% HES) HC ≈ 6 ppm | |||
| (2000 rpm, 55% load, 13% HES) HC ≈ 5 ppm | |||
| (2000 rpm, 55% load, 21% HES) HC ≈ 5 ppm | |||
| [21] | 7 L/min Manifold inj. Type 1 | Single cylinder Max. power: 5.2 kW at 1500 rpm Max. torque: No data Naturally aspirated | (1500 rpm, 30% load, no H2) HC ≈ 18 ppm |
| (1500 rpm, 30% load, 7 L/min) HC ≈ 17 ppm | |||
| (1500 rpm, 50% load, no H2) HC ≈ 27 ppm | |||
| (1500 rpm, 50% load, 7 L/min) HC ≈ 24 ppm | |||
| (1500 rpm, 100% load, no H2) HC ≈ 46 ppm | |||
| (1500 rpm, 100% load, 7 L/min) HC ≈ 45 ppm | |||
| [23] | 0–10% HES Manifold inj. Type 2 | Single cylinder Max. power: 7.35 kW at 3600 rpm Max. torque: No data Naturally aspirated | (3600 rpm, 60% load, no H2) HC = 435.4 ppm |
| (3600 rpm, 60% load, 2% HES) HC = 258.4 ppm | |||
| (3600 rpm, 60% load, 6% HES) HC = 142.2 ppm | |||
| (3600 rpm, 60% load, 8% HES) HC = 59.9 ppm | |||
| (3600 rpm, 60% load, 10% HES) HC = 9 ppm | |||
| [24] | 0–34% HES Manifold inj. Type 1 | Single cylinder Max. power: 7 kW at 4200 rpm Max. torque: No data Naturally aspirated | (1500 rpm, 100% load, no H2) HC = 81 ppm |
| (1500 rpm, 100% load, 4% HES) HC = 86 ppm | |||
| (1500 rpm, 100% load, 7% HES) HC = 89 ppm | |||
| (1500 rpm, 100% load, 12% HES) HC = 96 ppm | |||
| (1500 rpm, 100% load, 23% HES) HC = 88 ppm | |||
| (1500 rpm, 100% load, 34% HES) HC = 87 ppm | |||
| [54] | 0–30% HES Manifold inj. Type 1 | Single cylinder Max. power: 5.2 kW at 1500 rpm Max. torque: No data Naturally aspirated | (1500 rpm, 25% load, no H2) HC ≈ 65 g/kWh |
| (1500 rpm, 25% load, 10% HES) HC ≈ 62 g/kWh | |||
| (1500 rpm, 25% load, 30% HES) HC ≈ 60 g/kWh | |||
| (1500 rpm, 50% load, no H2) HC ≈ 38 g/kWh | |||
| (1500 rpm, 50% load, 10% HES) HC ≈ 35 g/kWh | |||
| (1500 rpm, 50% load, 30% HES) HC ≈ 32 g/kWh | |||
| (1500 rpm, 100% load, no H2) HC ≈ 29 g/kWh | |||
| (1500 rpm, 100% load, 10% HES) HC ≈ 23 g/kWh | |||
| (1500 rpm, 100% load, 30% HES) HC ≈ 20 g/kWh | |||
| [22] | 0–0.08 kg/h (0–28% HES) Port inj. Type 2 | Single cylinder Max. power: 7.4 kW at 3600 rpm Max. torque: 28 Nm at 2000 rpm Naturally aspirated | (1800 rpm, 10 Nm, no H2) HC ≈ 0.13 g/kWh |
| (1800 rpm, 10 Nm, 7.5% HES) HC ≈ 0.13 g/kWh | |||
| (1800 rpm, 10 Nm, 17.5% HES) HC ≈ 0.12 g/kWh | |||
| (1800 rpm, 10 Nm, 28% HES) HC ≈ 0.10 g/kWh | |||
| [55] | 0–20% HES Manifold inj. Type 1 | Single cylinder Max. power: 5.2 kW at 1500 rpm Max. torque: No data Naturally aspirated | (1500 rpm, 25% load, no H2) HC = 381 ppm |
| (1500 rpm, 25% load, 20% HES) HC = 399.6 ppm | |||
| (1500 rpm, 50% load, no H2) HC = 456.06 ppm | |||
| (1500 rpm, 50% load, 20% HES) HC = 436.58 ppm | |||
| (1500 rpm, 75% load, no H2) HC = 446.32 ppm | |||
| (1500 rpm, 75% load, 20% HES) HC = 419.85 ppm | |||
| [56] | 0–36 L/min (0–86% HES) Manifold inj. Type 2 | Single cylinder Max. power: 5.97 kW at 2200 rpm Max. torque: No data | (1850 rpm, 12 Nm load, no H2) HC ≈ 30 ppm |
| (1850 rpm, 12 Nm load, 12 L/min) HC ≈ 55 ppm | |||
| (1850 rpm, 12 Nm load, 24 L/min) HC ≈ 60 ppm | |||
| (1850 rpm, 12 Nm load, 36 L/min) HC ≈ 80 ppm | |||
| (1850 rpm, 20 Nm load, no H2) HC ≈ 70 ppm | |||
| (1850 rpm, 20 Nm load, 12 L/min) HC ≈ 100 ppm | |||
| (1850 rpm, 20 Nm load, 24 L/min) HC ≈ 135 ppm | |||
| (1850 rpm, 20 Nm load, 36 L/min) HC ≈ 125 ppm | |||
| [64] | 0–50% HES Manifold inj. Type 2 | Single cylinder Max. power: 13.2 kW at 1500 rpm Max. torque: No data Naturally aspirated | (965 rpm, ML, no H2) HC ≈ 85 ppm |
| (965 rpm, ML, 15% HES) HC ≈ 90 ppm | |||
| (965 rpm, ML, 41% HES) HC ≈ 80 ppm | |||
| (965 rpm, NL, no H2) HC ≈ 95 ppm | |||
| (965 rpm, NL, 14% HES) HC ≈ 105 ppm | |||
| (965 rpm, NL, 33% HES) HC ≈ 95 ppm |
| Ref. | H2 Enrichment and Mixing Process Type of Test | Engine Specifications | Key Findings (PM=) Data Directly Reflected in the Document (PM≈) Approximately Measured Data in the Document’s Figures |
|---|---|---|---|
| [49] | 0–25% HES Manifold inj. Type 1 | Four cylinders Max. power: 103 kW at 4000 rpm Max. torque: 320 Nm at 1750–2500 rpm Turbocharged | (2000 rpm, 15% load, no H2) PM = 7.12 × 10⁷ #/cc |
| (2000 rpm, 15% load, 25% HES) PM = 4.75 × 10⁷ #/cc | |||
| (2000 rpm, 30% load, no H2) PM = 1.00 × 10⁸ #/cc | |||
| (2000 rpm, 30% load, 25% HES) PM = 8.48 × 10⁷ #/cc | |||
| (2000 rpm, 45% load, no H2) PM = 1.43 × 10⁸ #/cc | |||
| (2000 rpm, 45% load, 25% HES) PM = 9.39 × 10⁷ #/cc | |||
| [36] | 0–80% HES Manifold inj. Type 1 | Four cylinders Max. power: 58 kW at 4500 rpm Max. torque: 145 Nm at 2350 rpm Turbocharged | (2400 rpm, 30% load, no H2) K ≈ 0.20 m−1 |
| (2400 rpm, 30% load, 30% HES) K ≈ 0.05 m−1 | |||
| (2400 rpm, 30% load, 80% HES) K ≈ 0.05 m−1 | |||
| (2400 rpm, 60% load, no H2) K ≈ 0.22 m−1 | |||
| (2400 rpm, 60% load, 30% HES) K ≈ 0.21 m−1 | |||
| (2400 rpm, 60% load, 60% HES) K ≈ 0.17 m−1 | |||
| (2400 rpm, 100% load, no H2) K ≈ 0.97 m−1 | |||
| (2400 rpm, 100% load, 30% HES) K ≈ 0.55 m−1 | |||
| (2400 rpm, 100% load, 40% HES) K ≈ 0.95 m−1 | |||
| [65] | 0–21% HES Manifold inj. Type 1 | Four cylinders Max. power: 55 kW at 3900 rpm Max. torque: 156 Nm at 2000 rpm Turbocharged | (2000 rpm, 55% load, no H2) K ≈ 2.1 m−1 |
| (2000 rpm, 55% load, 7% HES) K ≈ 1.6 m−1 | |||
| (2000 rpm, 55% load, 13% HES) K ≈ 1.7 m−1 | |||
| (2000 rpm, 55% load, 21% HES) K ≈ 1.8 m−1 | |||
| [21] | 7 L/min Manifold inj. Type 1 | Single cylinder Max. power: 5.2 kW at 1500 rpm Max. torque: No data Naturally aspirated | (1500 rpm, 30% load, no H2) HC ≈ 18 ppm |
| (1500 rpm, 30% load, 7 L/min) HC ≈ 17 ppm | |||
| (1500 rpm, 50% load, no H2) HC ≈ 27 ppm | |||
| (1500 rpm, 50% load, 7 L/min) HC ≈ 24 ppm | |||
| (1500 rpm, 100% load, no H2) HC ≈ 46 ppm | |||
| (1500 rpm, 100% load, 7 L/min) HC ≈ 45 ppm | |||
| [24] | 0–34% HES Manifold inj. Type 1 | Single cylinder Max. power: 7 kW at 4200 rpm Max. torque: No data Naturally aspirated | (1500 rpm, 100% load, no H2) smoke ≈ 863 mg/m3 |
| (1500 rpm, 100% load, 4% HES) smoke ≈ 640 mg/m3 | |||
| (1500 rpm, 100% load, 7% HES) smoke ≈ 336 mg/m3 | |||
| (1500 rpm, 100% load, 12% HES) smoke ≈ 203 mg/m3 | |||
| (1500 rpm, 100% load, 23% HES) smoke ≈ 134 mg/m3 | |||
| (1500 rpm, 100% load, 34% HES) smoke ≈ 143 mg/m3 | |||
| [54] | 0–30% HES Manifold inj. Type 1 | Single cylinder Max. power: 5.2 kW at 1500 rpm Max. torque: No data Naturally aspirated | (1500 rpm, 25% load, no H2) PM ≈ 5.00 × 10⁷ #/cc |
| (1500 rpm, 25% load, 10% HES) PM ≈ 4.50 × 10⁷ #/cc | |||
| (1500 rpm, 25% load, 30% HES) PM ≈ 4.00 × 10⁷ #/cc | |||
| (1500 rpm, 50% load, no H2) PM ≈ 3.50 × 10⁷ #/cc | |||
| (1500 rpm, 50% load, 10% HES) PM ≈ 3.50 × 10⁷ #/cc | |||
| (1500 rpm, 50% load, 30% HES) PM ≈ 2.90 × 10⁷ #/cc | |||
| (1500 rpm, 100% load, no H2) PM ≈ 5.60 × 10⁷ #/cc | |||
| (1500 rpm, 100% load, 10% HES) PM ≈ 5.00 × 10⁷ #/cc | |||
| (1500 rpm, 100% load, 30% HES) PM ≈ 3.50 × 10⁷ #/cc | |||
| [22] | 0–0.08 kg/h (0–28% HES) Port inj. Type 2 | Single cylinder Max. power: 7.4 kW at 3600 rpm Max. torque: 28 Nm at 2000 rpm Naturally aspirated | (1800 rpm, 10 Nm, no H2) PM = 18.64 g/kWh |
| (1800 rpm, 10 Nm, 7.5% HES) PM ≈ 14.5 g/kWh | |||
| (1800 rpm, 10 Nm, 17.5% HES) PM ≈ 12.0 g/kWh | |||
| (1800 rpm, 10 Nm, 28% HES) PM = 5.95 g/kWh | |||
| [55] | 0–20% HES Manifold inj. Type 1 | Single cylinder Max. power: 5.2 kW at 1500 rpm Max. torque: No data Naturally aspirated | (1500 rpm, 25% load, no H2) PM ≈ 1.6 × 10⁷ #/cc |
| (1500 rpm, 25% load, 20% HES) PM ≈ 1.3 × 10⁷ #/cc | |||
| (1500 rpm, 50% load, no H2) PM ≈ 4.8 × 10⁷ #/cc | |||
| (1500 rpm, 50% load, 20% HES) PM ≈ 3.7 × 10⁷ #/cc | |||
| (1500 rpm, 75% load, no H2) PM ≈ 5.3 × 10⁷ #/cc | |||
| (1500 rpm, 75% load, 20% HES) PM ≈ 4.1 × 10⁷ #/cc | |||
| [56] | 0–36 L/min (0–86% HES) Manifold inj. Type 2 | Single cylinder Max. power: 5.97 kW at 2200 rpm Max. torque: No data | (1850 rpm, 12 Nm load, no H2) smoke ≈ 62% vol |
| (1850 rpm, 12 Nm load, 12 L/min) smoke ≈ 50% vol | |||
| (1850 rpm, 12 Nm load, 24 L/min) smoke ≈ 32% vol | |||
| (1850 rpm, 12 Nm load, 36 L/min) smoke ≈ 19% vol | |||
| (1850 rpm, 20 Nm load, no H2) smoke ≈ 70% vol | |||
| (1850 rpm, 20 Nm load, 12 L/min) smoke ≈ 78% vol | |||
| (1850 rpm, 20 Nm load, 24 L/min) smoke ≈ 60% vol | |||
| (1850 rpm, 20 Nm load, 36 L/min) smoke ≈ 48% vol | |||
| [64] | 0–50% HES Manifold inj. Type 2 | Single cylinder Max. power: 13.2 kW at 1500 rpm Max. torque: No data Naturally aspirated | (965 rpm, ML, no H2) smoke ≈ 24% vol |
| (965 rpm, ML, 15% HES) smoke ≈ 18% vol | |||
| (965 rpm, ML, 41% HES) smoke ≈ 13% vol | |||
| (965 rpm, NL, no H2) smoke ≈ 21% vol | |||
| (965 rpm, NL, 14% HES) smoke ≈ 14% vol | |||
| (965 rpm, NL, 33% HES) smoke ≈ 6% vol |
| Ref. | H2 Enrichment and Mixing Process Type of Test | Engine Specifications | Key Findings (NOx=) Data Directly Reflected in the Document (NOx≈) Approximately Measured Data in the Document Figures |
|---|---|---|---|
| [49] | 0–25% HES Manifold inj. Type 1 | Four cylinders Max. power: 103 kW at 4000 rpm Max. torque: 320 Nm at 1750–2500 rpm Turbocharged | (2000 rpm, 15% load, no H2) NOx = 101.03 ppm |
| (2000 rpm, 15% load, 25% HES) NOx = 101.63 ppm | |||
| (2000 rpm, 30% load, no H2) NOx = 156.74 ppm | |||
| (2000 rpm, 30% load, 25% HES) NOx = 134.13 ppm | |||
| (2000 rpm, 45% load, no H2) NOx = 228.83 ppm | |||
| (2000 rpm, 45% load, 25% HES) NOx = 253.59 ppm | |||
| [52] | 0–30% HES Direct inj. Type 1 | Two cylinders Max. power: 21 kW at 2200 rpm Max. torque: No data Naturally aspirated | (25% load, no H2) NOx = 6.1 g/kWh |
| (25% load, 10% HES) NOx = 6.3 g/kWh | |||
| (25% load, 20% HES) NOx = 6.6 g/kWh | |||
| (25% load, 30% HES) NOx = 7 g/kWh | |||
| (50% load, no H2) NOx ≈ 6.5 g/kWh | |||
| (50% load, 10% HES) NOx ≈ 6.8 g/kWh | |||
| (50% load, 20% HES) NOx ≈ 7.1 g/kWh | |||
| (50% load, 30% HES) NOx ≈ 7.5 g/kWh | |||
| (100% load, no H2) NOx ≈ 8.80 g/kWh | |||
| (100% load, 10% HES) NOx = 9.6 g/kWh | |||
| (100% load, 20% HES) NOx = 9.8 g/kWh | |||
| (100% load, 30% HES) NOx = 10.2 g/kWh | |||
| [65] | 0–21% HES Manifold inj. Type 1 | Four cylinders Max. power: 55 kW at 3900 rpm Max. torque: 156 Nm at 2000 rpm Turbocharged | (2000 rpm, 55% load, no H2) NOx ≈ 192 ppm |
| (2000 rpm, 55% load, 7% HES) NOx ≈ 150 ppm | |||
| (2000 rpm, 55% load, 13% HES) NOx ≈ 160 ppm | |||
| (2000 rpm, 55% load, 21% HES) NOx ≈ 185 ppm | |||
| [21] | 7 L/min Manifold inj. Type 2 | Single cylinder Max. power: 5.2 kW at 1500 rpm Max. torque: No data Naturally aspirated | (1500 rpm, 30% load, no H2) NOx ≈ 300 ppm |
| (1500 rpm, 30% load, 7 L/min) NOx ≈ 350 ppm | |||
| (1500 rpm, 50% load, no H2) NOx ≈ 650 ppm | |||
| (1500 rpm, 50% load, 7 L/min) NOx ≈ 750 ppm | |||
| (1500 rpm, 100% load, no H2) NOx ≈ 1400 ppm | |||
| (1500 rpm, 100% load, 7 L/min) NOx ≈ 1500 ppm | |||
| [23] | 0–10% HES Manifold inj. Type 2 | Single cylinder Max. power: 7.35 kW at 3600 rpm Max. torque: No data Naturally aspirated | (3600 rpm, 60% load, no H2) NOx = 182.4 ppm |
| (3600 rpm, 60% load, 2% HES) NOx = 221.25 ppm | |||
| (3600 rpm, 60% load, 6% HES) NOx = 224.38 ppm | |||
| (3600 rpm, 60% load, 8% HES) NOx = 236.93 ppm | |||
| (3600 rpm, 60% load, 10% HES) NOx = 270.50 ppm | |||
| [24] | 0–34% HES Manifold inj. Type 1 | Single cylinder Max. power: 7 kW at 4200 rpm Max. torque: No data Naturally aspirated | (1500 rpm, 100% load, no H2) NO = 476 ppm |
| (1500 rpm, 100% load, 4% HES) NO = 514 ppm | |||
| (1500 rpm, 100% load, 7% HES) NO = 613 ppm | |||
| (1500 rpm, 100% load, 12% HES) NO = 707 ppm | |||
| (1500 rpm, 100% load, 23% HES) NO = 775 ppm | |||
| (1500 rpm, 100% load, 34% HES) NO = 984 ppm | |||
| [37] | 21.4–49.6 L/min Manifold inj. Type 2 | Single cylinder Max. power: 10.3 kW at 3000 rpm Max. torque: 36 Nm at 2000 rpm Naturally aspirated | (2000 rpm, 5 Nm, 21.4 L/min) NOx ≈ 400 ppm |
| (2000 rpm, 5 Nm, 36.2 L/min) NOx ≈ 220 ppm | |||
| (2000 rpm, 5 Nm, 49.6 L/min) NOx ≈ 70 ppm | |||
| (2000 rpm, 15 Nm, 21.4 L/min) NOx ≈ 750 ppm | |||
| (2000 rpm, 15 Nm, 36.2 L/min) NOx ≈ 750 ppm | |||
| (2000 rpm, 15 Nm, 49.6 L/min) NOx ≈ 750 ppm | |||
| (2000 rpm, 20 Nm, 21.4 L/min) NOx ≈ 880 ppm | |||
| (2000 rpm, 20 Nm, 36.2 L/min) NOx ≈ 900 ppm | |||
| (2000 rpm, 20 Nm, 49.6 L/min) NOx ≈ 1000 ppm | |||
| [54] | 0–30% HES Manifold inj. Type 1 | Single cylinder Max. power: 5.2 kW at 1500 rpm Max. torque: No data Naturally aspirated | (1500 rpm, 25% load, no H2) NOx ≈ 15 g/kWh |
| (1500 rpm, 25% load, 10% HES) NOx ≈ 14 g/kWh | |||
| (1500 rpm, 25% load, 30% HES) NOx ≈ 12 g/kWh | |||
| (1500 rpm, 50% load, no H2) NOx ≈ 13.5 g/kWh | |||
| (1500 rpm, 50% load, 10% HES) NOx ≈ 13 g/kWh | |||
| (1500 rpm, 50% load, 30% HES) NOx ≈ 12.5 g/kWh | |||
| (1500 rpm, 100% load, no H2) NOx ≈ 10.5 g/kWh | |||
| (1500 rpm, 100% load, 10% HES) NOx ≈ 10.5 g/kWh | |||
| (1500 rpm, 100% load, 30% HES) NOx ≈ 10 g/kWh | |||
| [22] | 0–0.08 kg/h (0–28% HES) Port inj. Type 2 | Single cylinder Max. power: 7.4 kW at 3600 rpm Max. torque: 28 Nm at 2000 rpm Naturally aspirated | (1800 rpm, 10 Nm, no H2) NOx ≈ 9.2 g/kWh |
| (1800 rpm, 10 Nm, 7.5% HES) NOx ≈ 9.8 g/kWh | |||
| (1800 rpm, 10 Nm, 17.5% HES) NOx ≈ 11.5 g/kWh | |||
| (1800 rpm, 10 Nm, 28% HES) NOx ≈ 15.5 g/kWh | |||
| [55] | 0–20% HES Manifold inj. Type 1 | Single cylinder Max. power: 5.2 kW at 1500 rpm Max. torque: No data Naturally aspirated | (1500 rpm, 25% load, no H2) NOx = 427.56 ppm |
| (1500 rpm, 25% load, 20% HES) NOx = 372.37 ppm | |||
| (1500 rpm, 50% load, no H2) NOx = 746.31 ppm | |||
| (1500 rpm, 50% load, 20% HES) NOx = 661.52 ppm | |||
| (1500 rpm, 75% load, no H2) NOx = 1016.3 ppm | |||
| (1500 rpm, 75% load, 20% HES) NOx = 1104.88 ppm | |||
| [56] | 0–36 L/min (0–86% HES) Manifold inj. Type 2 | Single cylinder Max. power: 5.97 kW at 2200 rpm Max. torque: No data | (1850 rpm, 12 Nm load, no H2) NOx ≈ 200 ppm |
| (1850 rpm, 12 Nm load, 12 L/min) NOx ≈ 100 ppm | |||
| (1850 rpm, 12 Nm load, 24 L/min) NOx ≈ 120 ppm | |||
| (1850 rpm, 12 Nm load, 36 L/min) NOx ≈ 100 ppm | |||
| (1850 rpm, 20 Nm load, no H2) NOx ≈ 450 ppm | |||
| (1850 rpm, 20 Nm load, 12 L/min) NOx ≈ 410 ppm | |||
| (1850 rpm, 20 Nm load, 24 L/min) NOx ≈ 520 ppm | |||
| (1850 rpm, 20 Nm load, 36 L/min) NOx ≈ 600 ppm |
| Ref. | H2 Enrichment and Mixing Process Type of Test | Engine Specifications | Key Findings (NOx=) Data Directly Reflected in the Document (NOx≈) Approximately Measured Data in the Document’s Figures |
|---|---|---|---|
| [50] | 25 L/min Carburetor Type 2 | Four cylinders Max. power: 60 kW at 2200 rpm Max. torque: No data Naturally aspirated | (2200 rpm, 100% load, no H2, 0% EGR) NOx = 535 ppm |
| (2200 rpm, 100% load, 25 L/min, 0% EGR) NOx = 590 ppm | |||
| (2200 rpm, 100% load, 25 L/min, 10% EGR) NOx = 504 ppm | |||
| (2200 rpm, 100% load, 25 L/min, 20% EGR) NOx = 463 ppm | |||
| [78] | 0–41% HES Manifold inj. Type 1 | Four cylinders Max. power: 85 kW at 4000 rpm Max. torque: No data Turbocharged | (1200 rpm, 8.5 bar MEP, 29% HES, 0% O2 red.) NOx ≈ 14 g/kWh |
| (1200 rpm, 8.5 bar MEP, 29% HES, 1% O2 red.) NOx ≈ 13 g/kWh | |||
| (1200 rpm, 8.5 bar MEP, 29% HES, 2% O2 red.) NOx ≈ 8 g/kWh | |||
| (1200 rpm, 8.5 bar MEP, 29% HES, 3% O2 red.) NOx ≈ 4 g/kWh | |||
| (1200 rpm, 11.5 bar MEP, 29% HES, 0% O2 red.) NOx ≈ 14 g/kWh | |||
| (1200 rpm, 11.5 bar MEP, 29% HES, 1% O2 red.) NOx ≈ 10 g/kWh | |||
| (1200 rpm, 11.5 bar MEP, 29% HES, 2% O2 red.) NOx ≈ 5 g/kWh | |||
| (1200 rpm, 11.5 bar MEP, 29% HES, 3% O2 red.) NOx ≈ 2 g/kWh | |||
| [79] | 0–8 L/min Manifold inj. Type 2 | Four cylinders Max. power: 78.3 kW at 2500 rpm Max. torque: No data Turbocharged | (1500 rpm, 40% load, no H2, 0% EGR) NOx = 980 ppm |
| (1500 rpm, 40% load, no H2, 10% EGR) NOx ≈ 300 ppm | |||
| (1500 rpm, 40% load, no H2, 20% EGR) NOx ≈ 200 ppm | |||
| (1500 rpm, 40% load, 4 L/min, 0% EGR) NOx ≈ 1200 ppm | |||
| (1500 rpm, 40% load, 4 L/min, 10% EGR) NOx ≈ 400 ppm | |||
| (1500 rpm, 40% load, 4 L/min, 20% EGR) NOx ≈ 280 ppm | |||
| (1500 rpm, 40% load, 8 L/min, 0% EGR) NOx ≈ 1400 ppm | |||
| (1500 rpm, 40% load, 8 L/min, 10% EGR) NOx ≈ 440 ppm | |||
| (1500 rpm, 40% load, 8 L/min, 20% EGR) NOx = 283 ppm | |||
| [54] | 0–30% HES Manifold inj. Type 1 | Single cylinder Max. power: 5.2 kW at 1500 rpm Max. torque: No data Naturally aspirated | (1500 rpm, 100% load, no H2) NOx ≈ 10.5 g/kWh |
| (1500 rpm, 100% load, 10% HES, 0% EGR) NOx ≈ 10.5 g/kWh | |||
| (1500 rpm, 100% load, 10% HES, 5% EGR) NOx ≈ 7.5 g/kWh | |||
| (1500 rpm, 100% load, 10% HES, 10% EGR) NOx ≈ 6 g/kWh | |||
| (1500 rpm, 100% load, 30% HES, 0% EGR) NOx ≈ 10.5 g/kWh | |||
| (1500 rpm, 100% load, 30% HES, 5% EGR) NOx ≈ 8 g/kWh | |||
| (1500 rpm, 100% load, 30% HES, 10% EGR) NOx ≈ 7 g/kWh | |||
| [66] | 0–15 L/min Manifold inj. Type 2 | Single cylinder Max. power: 5.2 kW at 1500 rpm Max. torque: No data Naturally aspirated | (1500 rpm, 50% load, no H2, 0% EGR) NOx ≈ 12.5 g/kWh |
| (1500 rpm, 50% load, 15 L/min, 0% EGR) NOx ≈ 17.5 g/kWh | |||
| (1500 rpm, 50% load, 15 L/min, 10% EGR) NOx ≈ 14 g/kWh | |||
| (1500 rpm, 100% load, no H2, 0% EGR) NOx = 9.5 g/kWh | |||
| (1500 rpm, 100% load, 15 L/min, 0% EGR) NOx = 12.9 g/kWh | |||
| (1500 rpm, 100% load, 15 L/min, 10% EGR) NOx = 10.49 g/kWh | |||
| [80] | 2 L/min Manifold inj. Type 2 | Single cylinder Max. power: 5.2 kW at 1500 rpm Max. torque: No data Naturally aspirated | (1500 rpm, 80% load, no H2, 0% EGR) NOx = 1300 ppm |
| (1500 rpm, 80% load, 2 L/min, 0% EGR) NOx = 1604 ppm | |||
| (1500 rpm, 80% load, 2 L/min, 20% EGR) NOx = 1150 ppm | |||
| (1500 rpm, 100% load, no H2, 0% EGR) NOx ≈ 1100 ppm | |||
| (1500 rpm, 100% load, 2 L/min, 0% EGR) NOx ≈ 1500 ppm | |||
| (1500 rpm, 100% load, 2 L/min, 20% EGR) NOx ≈ 950 ppm | |||
| [81] | 30 L/min Manifold inj. Type 2 | Single cylinder Max. power: 5.2 kW at 1500 rpm Max. torque: No data Naturally aspirated | (1500 rpm, 25% load, no H2, 0% EGR) NOx ≈ 9.5 g/kWh |
| (1500 rpm, 25% load, 30 L/min, 0% EGR) NOx ≈ 13 g/kWh | |||
| (1500 rpm, 25% load, 30 L/min, 30% EGR) NOx ≈ 9.8 g/kWh | |||
| (1500 rpm, 50% load, no H2, 0% EGR) NOx ≈ 6.8 g/kWh | |||
| (1500 rpm, 50% load, 30 L/min, 0% EGR) NOx ≈ 10 g/kWh | |||
| (1500 rpm, 50% load, 30 L/min, 30% EGR) NOx ≈ 7 g/kWh | |||
| (1500 rpm, 100% load, no H2, 0% EGR) NOx = 5.09 g/kWh | |||
| (1500 rpm, 100% load, 30 L/min, 0% EGR) NOx = 6.8 g/kWh | |||
| (1500 rpm, 100% load, 30 L/min, 30% EGR) NOx = 4.56 g/kWh |
| Ref. | H2 Enrichment and Mixing Process Type of Test | Engine Specifications | Key Findings (NOx=) Data Directly Reflected in the Document (NOx≈) Approximately Measured Data in the Document Figures |
|---|---|---|---|
| [47] | 0–2 kg/h Manifold inj. Type 3 | Four cylinders Max. power: 63 kW at 4000 rpm Max. torque: 220 Nm at 1800 rpm Turbocharged | (1500 rpm, SOI = 10°,0.3 kg/h H2, 0 kg/h H2O) NOx ≈ 850 ppm |
| (1500 rpm, SOI = 10°, 0.3 kg/h H2, 16 kg/h H2O) NOx ≈ 240 ppm | |||
| (1500 rpm, SOI = 10°, 0.6 kg/h H2, 16 kg/h H2O) NOx ≈ 750 ppm | |||
| (1500 rpm, SOI = 10°, 0.6 kg/h H2, 32 kg/h H2O) NOx ≈ 300 ppm | |||
| (1500 rpm, SOI = 10°, 0.9 kg/h H2, 32 kg/h H2O) NOx ≈ 810 ppm | |||
| (1500 rpm, SOI = 10°, 0.9 kg/h H2, 48 kg/h H2O) NOx ≈ 690 ppm | |||
| [93] | 0–85% HES Manifold inj. Type 3 | Four cylinders Max. power: 63 kW at 4000 rpm Max. torque: 220 Nm at 1800 rpm Turbocharged | (1500 rpm, SOI = 10°, 62% HES, 0 g/cycle H2O) NOx = 677 ppm |
| (1500 rpm, SOI = 10°, 62% HES, 0.266 g/cycle H2O) NOx = 89 ppm | |||
| (1500 rpm, SOI = 10°, 77% HES, 0.266 g/cycle H2O) NOx = 600 ppm | |||
| (1500 rpm, SOI = 10°, 77% HES, 0.531 g/cycle H2O) NOx = 350 ppm | |||
| (1500 rpm, SOI = 10°, 80% HES, 0.531 g/cycle H2O) NOx = 675 ppm | |||
| (1500 rpm, SOI = 10°, 80% HES, 0.795 g/cycle H2O) NOx = 547 ppm | |||
| [94] | 0–1.6 H2/diesel mass ratio Manifold inj. Type 3 | Four cylinders Max. power: 63 kW at 4000 rpm Max. torque: 220 Nm at 1800 rpm Turbocharged | (2000 rpm, SOI = 10°, H2/diesel ≈ 0.55, 0 kg/h H2O) NOx ≈ 900 ppm |
| (2000 rpm, SOI = 10°, H2/diesel ≈ 0.6, 16 kg/h H2O) NOx ≈ 350 ppm | |||
| (2000 rpm, SOI = 10°, H2/diesel ≈ 0.85, 16 kg/h H2O) NOx ≈ 620 ppm | |||
| (2000 rpm, SOI = 10°, H2/diesel ≈ 0.85, 32 kg/h H2O) NOx ≈ 250 ppm | |||
| (2000 rpm, SOI = 10°, H2/diesel ≈ 1.15, 32 kg/h H2O) NOx ≈ 450 ppm | |||
| (2000 rpm, SOI = 10°, H2/diesel ≈ 1.18, 48 kg/h H2O) NOx ≈ 380 ppm | |||
| [95] | 20% HES Manifold inj. Type 1 | Single cylinder Max. power: 7.4 kW at 1500 rpm Max. torque: No data Naturally aspirated | (1500 rpm, 100% load, 20% HES, 0 g/kWh H2O) NOx = 8.67 g/kWh |
| (1500 rpm, 100% load, 20% HES, 130 g/kWh H2O) NOx = 8.24 g/kWh | |||
| (1500 rpm, 100% load, 20% HES, 200 g/kWh H2O) NOx = 6.62 g/kWh | |||
| (1500 rpm, 100% load, 20% HES, 270 g/kWh H2O) NOx = 5.47 g/kWh | |||
| [96] | 0–36% HES Manifold inj. Type 1 | Single cylinder Max. power: 7.4 kW at 1500 rpm Max. torque: No data Naturally aspirated | (1500 rpm, 100% load, 15% HES, 0 g/kWh H2O) NOx ≈ 9.3 g/kWh |
| (1500 rpm, 100% load, 15% HES, 200 g/kWh H2O) NOx ≈ 6.2 g/kWh | |||
| (1500 rpm, 100% load, 18% HES, 0 g/kWh H2O) NOx = 9.7 g/kWh | |||
| (1500 rpm, 100% load, 18% HES, 200 g/kWh H2O) NOx = 6.6 g/kWh | |||
| [97] | 0–66% HES Manifold inj. Type 1 | Single cylinder Max. power: 7.4 kW at 1500 rpm Max. torque: No data Naturally aspirated | (1500 rpm, 100% load, 32% HES, 130 g/kWh H2O) NOx = 9.7 g/kWh |
| (1500 rpm, 100% load, 32% HES, 270 g/kWh H2O) NOx = 6.5 g/kWh | |||
| (1500 rpm, 100% load, 32% HES, 340 g/kWh H2O) NOx ≈ 6 g/kWh | |||
| (1500 rpm, 100% load, 32% HES, 410 g/kWh H2O) NOx = 5.1 g/kWh | |||
| [98] | 0–6.5% HES Manifold inj. Type 1 | Single cylinder Max. power: 3.7 kW at 1500 rpm Max. torque: No data Naturally aspirated | (1500 rpm, 100% load, no H2, 0% H2O) NO = 289 ppm |
| (1500 rpm, 100% load, 6.5% HES, 0% H2O) NO = 465 ppm | |||
| (1500 rpm, 100% load, 6.5% HES, 5% H2O) NO ≈ 370 ppm | |||
| [99] | 0–8% HES Manifold inj. Type 1 | Single cylinder Max. power: 3.7 kW at 1500 rpm Max. torque: No data Naturally aspirated | Numerical study |
| (1500 rpm, 100% load, 8% HES, 0% H2O) Pmax ≈ 12 MPa | |||
| (1500 rpm, 100% load, 8% HES, 3% H2O) Pmax ≈ 11.8 MPa | |||
| (1500 rpm, 100% load, 8% HES, 5% H2O) Pmax ≈ 11 MPa | |||
| (1500 rpm, 100% load, 8% HES, 7% H2O) Pmax ≈ 10.5 MPa |
| Ref. | H2 Enrichment and Mixing Process Type of Test | Engine Specifications | Key Findings (NOx=) Data Directly Reflected in the Document (NOx≈) Approximately Measured Data in the Document’s Figures |
|---|---|---|---|
| [93] | 0–85% HES Manifold inj. Type 3 | Four cylinders Max. power: 63 kW at 4000 rpm Max. torque: 220 Nm at 1800 rpm Turbocharged | (1500 rpm, SOI = 10°, 62% HES, CR 17.5:1) NOx = 903 ppm |
| (1500 rpm, SOI = 10°, 62% HES, CR 16.3:1) NOx = 744 ppm | |||
| (1500 rpm, SOI = 10°, 62% HES, CR 15.5:1) NOx = 677 ppm | |||
| (1500 rpm, SOI = 10°, 62% HES, CR 14.5:1) NOx = 653 ppm | |||
| (1500 rpm, SOI = 10°, 62% HES, CR 13.5:1) NOx = 510 ppm | |||
| (2500 rpm, SOI = 10°, 70% HES, CR 17.5:1) NOx = 868 ppm | |||
| (2500 rpm, SOI = 10°, 70% HES, CR 16.3:1) NOx = 469 ppm | |||
| (2500 rpm, SOI = 10°, 70% HES, CR 15.5:1) NOx = 302 ppm | |||
| (2500 rpm, SOI = 10°, 70% HES, CR 14.5:1) NOx = 273 ppm | |||
| (2500 rpm, SOI = 10°, 70% HES, CR 13.5:1) NOx = 208 ppm | |||
| [97] | 0–66% HES Manifold inj. Type 1 | Single cylinder Max. power: 7.4 kW at 1500 rpm Max. torque: No data Naturally aspirated | (1500 rpm, 100% load, no H2, CR 19.5:1, No WI) Tcyl = 1876 K |
| (1500 rpm, 100% load, 19% HES, CR 19.5:1, WI) Tcyl = 1784 K | |||
| (1500 rpm, 100% load, 19% HES, CR 16.5:1, WI) Tcyl = 1437 K | |||
| (1500 rpm, 100% load, 19% HES, CR 15.4:1, WI) Tcyl = 1248 K | |||
| [99] | 0–8% HES Manifold inj. Type 1 | Single cylinder Max. power: 3.7 kW at 1500 rpm Max. torque: No data Naturally aspirated | Numerical study |
| (1500 rpm, 100% load, 8% HES, CR 16.5:1) Pmax ≈ 11.5 MPa | |||
| (1500 rpm, 100% load, 8% HES, CR 16:1) Pmax ≈ 11.2 MPa | |||
| (1500 rpm, 100% load, 8% HES, CR 15.5:1) Pmax ≈ 11 MPa | |||
| (1500 rpm, 100% load, 8% HES, CR 15:1) Pmax ≈ 10.5 MPa | |||
| [102] | 0–63% HES Manifold inj. Type 1 | Single cylinder Max. power: 7.4 kW at 1500 rpm Max. torque: No data Naturally aspirated | (1500 rpm, 100% load, no H2, CR 19.5:1) NOx = 6.8 g/kWh |
| (1500 rpm, 100% load, 19% HES, CR 19.5:1) NOx = 9.7 g/kWh | |||
| (1500 rpm, 100% load, 19% HES, CR 16.5:1) NOx = 5.5 g/kWh | |||
| (1500 rpm, 100% load, 19% HES, CR 15.4:1) NOx = 5 g/kWh | |||
| (1500 rpm, 100% load, 58.8% HES, CR 16.5:1) NOx ≈ 7 g/kWh | |||
| (1500 rpm, 100% load, 62.6% HES, CR 15.4:1) NOx ≈ 6.3 g/kWh | |||
| [106] | 0.5 kg/h (H2-enriched biogas) (HEB) Manifold inj. Type 2 | Single cylinder Max. power: 3.5 kW at 1500 rpm Max. torque: No data Naturally aspirated | (1500 rpm, 0 bar, 0.5 kg/h HEB, CR 18:1) NOx ≈ 10.2 g/kWh |
| (1500 rpm, 0 bar, 0.5 kg/h HEB, CR 17:1) NOx ≈ 9.2 g/kWh | |||
| (1500 rpm, 0 bar, 0.5 kg/h HEB, CR 16:1) NOx = 7.4 g/kWh | |||
| (1500 rpm, 2.1 bar, 0.5 kg/h HEB, CR 18:1) NOx ≈ 15 g/kWh | |||
| (1500 rpm, 2.1 bar, 0.5 kg/h HEB, CR 17:1) NOx ≈ 12 g/kWh | |||
| (1500 rpm, 2.1 bar, 0.5 kg/h HEB, CR 16:1) NOx ≈ 10.5 g/kWh | |||
| (1500 rpm, 3.5 bar, 0.5 kg/h HEB, CR 18:1) NOx = 16.5 g/kWh | |||
| (1500 rpm, 3.5 bar, 0.5 kg/h HEB, CR 17:1) NOx = 13.2 g/kWh | |||
| (1500 rpm, 3.5 bar, 0.5 kg/h HEB, CR 16:1) NOx = 12.6 g/kWh | |||
| [107] | 0–55% HES Manifold inj. Type 1 | Single cylinder Max. power: 7.4 kW at 1500 rpm Max. torque: No data Naturally aspirated | Numerical study |
| (1500 rpm, 100% load, 10% HES, CR 19.5:1) NOx ≈ 19.5 g/kWh | |||
| (1500 rpm, 100% load, 10% HES, CR 16.5:1) NOx ≈ 16.5 g/kWh | |||
| (1500 rpm, 100% load, 10% HES, CR 14.5:1) NOx ≈ 16 g/kWh | |||
| (1500 rpm, 100% load, 30% HES, CR 19.5:1) NOx ≈ 23 g/kWh | |||
| (1500 rpm, 100% load, 30% HES, CR 16.5:1) NOx ≈ 21.5 g/kWh | |||
| (1500 rpm, 100% load, 30% HES, CR 14.5:1) NOx ≈ 14.7 g/kWh | |||
| (1500 rpm, 100% load, 55% HES, CR 19.5:1) NOx ≈ 25.5 g/kWh | |||
| (1500 rpm, 100% load, 55% HES, CR 16.5:1) NOx ≈ 23.5 g/kWh | |||
| (1500 rpm, 100% load, 55% HES, CR 14.5:1) NOx ≈ 14.5 g/kWh |
Disclaimer/Publisher’s Note: The statements, opinions and data contained in all publications are solely those of the individual author(s) and contributor(s) and not of MDPI and/or the editor(s). MDPI and/or the editor(s) disclaim responsibility for any injury to people or property resulting from any ideas, methods, instructions or products referred to in the content. |
© 2024 by the authors. Licensee MDPI, Basel, Switzerland. This article is an open access article distributed under the terms and conditions of the Creative Commons Attribution (CC BY) license (https://creativecommons.org/licenses/by/4.0/).
Share and Cite
Rueda-Vázquez, J.M.; Serrano, J.; Pinzi, S.; Jiménez-Espadafor, F.J.; Dorado, M.P. A Review of the Use of Hydrogen in Compression Ignition Engines with Dual-Fuel Technology and Techniques for Reducing NOx Emissions. Sustainability 2024, 16, 3462. https://doi.org/10.3390/su16083462
Rueda-Vázquez JM, Serrano J, Pinzi S, Jiménez-Espadafor FJ, Dorado MP. A Review of the Use of Hydrogen in Compression Ignition Engines with Dual-Fuel Technology and Techniques for Reducing NOx Emissions. Sustainability. 2024; 16(8):3462. https://doi.org/10.3390/su16083462
Chicago/Turabian StyleRueda-Vázquez, Juan Manuel, Javier Serrano, Sara Pinzi, Francisco José Jiménez-Espadafor, and M. P. Dorado. 2024. "A Review of the Use of Hydrogen in Compression Ignition Engines with Dual-Fuel Technology and Techniques for Reducing NOx Emissions" Sustainability 16, no. 8: 3462. https://doi.org/10.3390/su16083462