
Experimental Study on the Mechanical Strength, Deformation Behavior and Infiltration Characteristics of Coral Sand

1
Jiangsu Key Laboratory of Urban Underground Engineering & Environmental Safety, Institute of Geotechnical Engineering, Southeast University, Nanjing 211189, China
2
School of Civil Engineering, Sun Yat-sen University, Zhuhai 519082, China
3
Southern Marine Science and Engineering Guangdong Laboratory, Zhuhai 519082, China
4
State Key Laboratory for Tunnel Engineering, Guangzhou 510275, China
*
Author to whom correspondence should be addressed.
Sustainability 2024, 16(8), 3479; https://doi.org/10.3390/su16083479
Submission received: 17 December 2023
/
Revised: 5 April 2024
/
Accepted: 15 April 2024
/
Published: 22 April 2024
(This article belongs to the Special Issue Sustainability and Engineering Design)
Abstract
:In this investigation, coral sand is presented as a sustainable substitute for conventional river and machine-manufactured sand. This study comprehensively investigated the macro-scale strength, deformation, and permeability characteristics of coral sand, alongside analyzing the mechanical behavior, deformation, and permeability under various conditions and in relation to distinct particle characteristics. It revealed that coral sand primarily consists of biotite and high-Mg calcite, featuring abundant internal pore space. Its compressive properties resemble clayey soils, displaying minimal unloading rebound and predominant plastic deformation during compression. In direct shear tests, the stress–strain relationship follows an approximate hyperbola, with no pronounced strain softening. Describing particle fragmentation in the process proves challenging, making indicators like internal friction angle less applicable in engineering. Triaxial tests indicate a rapid initial bias stress increase, followed by a gradual decrease post-stress peak, suggesting a strain softening phenomenon. As surrounding pressure rises, the axial strain needed to reach peak strength also increases. The permeability coefficient of coral sand correlates linearly with pore ratio increase, represented by 10e. The complex interaction of multiple factors influences the strength, deformation, and permeability of coral sand blown fill mixes, with specimen porosity having the greatest impact. The design and construction of high-weight foundation elements in coral sand blown fill projects should consider porosity effects.
1. Introduction
Reefs are rare terrestrial resources in tropical oceans, and are reliance bases for human habitation, oil and gas resource development, and the protection of national maritime rights and interests [1,2]. Coral sand is a special kind of geotechnical material, formed by the remains of reef-forming coral communities after a long period of compaction, lithification and formation of geotechnical material, in situ deposition, or near-source transport deposition of debris [3]. Studies have shown that coral aggregate is a natural light aggregate [1,2,4] and can be used to replace some construction aggregates [5,6,7,8,9,10], and marine large-scale infrastructure construction and island roadland blowing projects often use coral sand produced in dredged harbor land and channel excavation as construction material for island construction [11]. Due to the complex environment and unique internal structure of coral bodies, coral sand particles exhibit distinct properties. They are weak, highly irregular in shape, prone to breaking, and loose, with numerous pores. Furthermore, their behavior in terms of stress-strain relationships, strength characteristics, and shear swelling significantly differs from that of typical terrestrial sands. With increasing cell pressure, particle fragmentation develops and differences in mechanical properties increase [12].
Since the 1960s, in the exploration of marine resources development, engineering problems caused by loose accumulations of coral reefs and reef flat sediment stratigraphy have occurred frequently, such as in the construction of oil platforms in the Bass Strait of Australia, the North Rankin “A” oil platform on the Northwest Shelf, etc., and in situ sedimentation or near-source transport deposition of coral reefs and other marine organism skeleton remnants after their fragmentation. After the coral reef breakup and disintegration, the fragments and other marine skeleton remains are deposited in situ or near-source transported and deposited, because most of their depositional processes are not long-distance transported, and they retain the fine internal pore structure in the native bioskeleton, which results in the calcareous sand particles macroscopically displaying the special properties of easy to break up, difficult to saturate, and high compression, which make the plastic deformation loading capacity of the foundations and the pile bearing capacity low, and influences the shear characteristics of the soil body [12,13,14,15,16].
At present, there is relatively little domestic experience on reef sand blowing materials for large geotechnical structures [11,17], and there is insufficient knowledge of the particle characteristics and basic physical and mechanical properties of coral sand blowing materials obtained in different ways. It has been shown that particle fragmentation significantly affects the engineering and mechanical properties of the soil. coral sand can be crushed at low stress levels, and the crushing process has a complex relationship with physical composition, particle size gradation, particle shape, pore ratio, effective stress state, effective stress path, etc. [13,14,15,16,18]. The strength index of coral sand decreases as the surrounding pressure increases, and particle fragmentation gradually decreases after a certain degree, and the influence on mechanical properties also tends to stabilize, especially after large shear tends to a constant volume, constant stress state (similar to the critical state) [3].
Therefore, this paper intends to analyze the particle properties and aggregate characteristics of coral sand based on its chemical composition, mineral composition, particle morphology, etc., and use an indoor one-dimensional compression test, shear test, and permeability test to study the compression performance, strength index, compaction state, and permeability characteristics and their interrelationships, to reveal the basic mechanical and permeability characteristics of coral sand blowing materials in different states and under different particle characteristics, to analyze the correlation between strength, deformation and permeability coefficient, to provide the necessary scientific basis for the construction of geotechnical engineering for the development of South China Sea islands and reefs, and to provide grading schemes and data support for the subsequent guidance of coral sand blowing projects. The study’s practical insights serve as a valuable guide for sustainable and effective geo-engineering applications. Engineers and practitioners can incorporate these findings into their design and construction processes for effective and sustainable outcomes.
2. Materials and Test Methods
2.1. Raw Materials
The test material is taken from the loose coral debris strung from a sea area in the South China Sea, which can be mainly divided into coral sand and coral reef rock after being rinsed with pure water, dried, and sieved an initial time. The amount of coral sand with a particle size greater than 2 mm is very small. The 0.5 mm particle content is more than 50% and the main particle shapes are spindle, block, branch, and flake, as shown in Figure 1. Coral sand particle size, particle shape, particle gradation, and other physical properties have a direct impact on the engineering properties of the mix, the basic physical parameters are shown in Table 1. In order to facilitate the control of the conventional mechanical test conditions and analysis of the results, the particles larger than 2 mm in the coral sand were removed, and particle sieving tests were carried out on sand specimens below 2 mm, as shown in Figure 2. The coral sand inhomogeneity coefficient Cu was only 3.75, which is typical of poorly graded sand.
2.2. Test Methods
2.2.1. Mineral Composition and Microstructure Tests
The mineral composition of the coral sand was analyzed by X-ray diffraction using a Bruker AXS D8 Advance powder crystal X-ray diffractometer with a scanning incidence angle of 5° to 95°. The samples were in powder form with a mass of at least 0.5 g. The samples were passed through a 325 mesh standard sieve to reduce errors in the preparation of the samples. A total of 20 g of pellets were randomly taken from a well-mixed coral sand blowing material and prepared for use. After natural drying, the specimens were placed in the pulverizer in order to be pulverized, and the pulverized particles were gently removed with a brush and placed in the grinder to be ground until all specimens passed through a 325 mesh sieve. Then, the clods with a volume of about 1 cm3 at the middle position were taken. Coral sand particles were taken and dried in a constant temperature drying box at 65 °C for 3 d. A small alloy knife was used to cut 5 corals with a diameter of 3–5 mm and a flat surface along the main growth axis of the corals for electron microscopy scanning. Before scanning, vacuum and gold treatment were performed, and finally scanning electron microscopy was used.
2.2.2. One-Dimensional Compression Test
General mechanical tests refer to the “Geotechnical test specification for highway” [20]. The specimen size was Φ61.8 mm × 20 mm. The one-dimensional compression test was carried out using a WG single lever consolidator (used for compression tests of soil, detecting the relationship between pressure and the deformation of soil, compression index, resilience index, and coefficient of consolidation) with four initial states of compressed specimens prepared from the initial particle size curve of the coral sand, with the initial pore ratio e distributed between 1.00 and 1.25. The test was carried out with a pre-pressure of 1.0 kPa to bring the parts of the consolidator into close contact, and then pressurized step by step with normal pressure load levels of 50, 100, 200, 300, 400, and 800 kPa, and high pressure load levels of 1600, 3200 kPa, and 4000 kPa.
2.2.3. Direct Shear Test
The direct shear test was carried out by a strain-type electric direct shear apparatus. The consolidated fast shear test was performed on coral sand with the same initial porosity ratio e0 of 1.052 under different normal stresses, and the vertical deformation was measured and recorded every 1 h. The diameter of the specimen was 61.8 mm and the height was 20 mm. The vertical deformation of the specimen at consolidation stability was not more than 0.005 mm per 1 h. The cutting speed was 0.8 mm/min and the shear loss was within 3–5 min. When the force meter percentage reading was unchanged or back, shearing was continued to a shear displacement of 4 mm and then stopped; when the shear process force meter percentage showed no peak, shearing continued to a shear displacement of 6 mm and then stopped.
2.2.4. Triaxial Shear Test
A TSZ-1 triaxial instrument was used to carry out a coral sand consolidation and drainage shear (CD) test, using a specimen size of Φ39.1 mm × 80 mm. Saturation technology is a more critical step in the sample-making process, as with the current conventional test method it is difficult to achieve 95% saturation. After repeated tests, the saturation process was completed by evacuating, passing carbon dioxide, filling with airless water, and graded backpressure saturation [21]. The saturated specimen was filled with pure water to 1/3 of the height of the membrane and the boiled sand was filled in three layers to a predetermined height. A negative pressure of 5 kPa was applied to the interior of the specimen to keep it upright. After the specimen has been set up, the pressure chamber was filled with water and a 20 kPa perimeter pressure was applied. CO2 was used to replace the air in the specimen. CO2 with a purity of 99% or more is depressurized to 2–10 kPa. The saturation is then counterpressure saturated. To prevent the specimen from swelling, the counterpressure was kept at less than the surrounding pressure by more than 20 kPa, and 50 kPa were taken for each level of counterpressure; when applying the counterpressure, the difference between the surrounding pressure and counterpressure was kept as a constant value, the volume of the specimen was kept unchanged, and then the next level of surrounding pressure and counterpressure was applied after the hole pressure had stabilized. When the pore pressure dissipates to zero, the water no longer flows into the specimen and this can be considered stable pore pressure. The counterpressure was applied for a duration of approximately 10 min. After each level of counterpressure was applied, the B value was determined; when B > 0.95, the specimen saturation has reached 98% above the end of saturation. Studies have shown that generally only two or three levels of counterpressure, and not more than four levels, need to be applied to meet the requirements [19]. The shear rate was 0.166 mm/min for the shear test, and the effective cell pressures were 100, 200, 400, and 800 kPa, respectively.
2.2.5. Penetration Test
The test was carried out on coral sand with a grain size of 2 mm or less, using a TST-70 permeameter with a 40 cm high barrel and 10 cm diameter. In order to facilitate the integrity of the sample, all specimens were prepared with the same moisture content. In order to make the specimens fill the cylinder, they were loaded three times into the test cylinder and pressed tight with the mold on the jack. Before the test, the permeation meter with the specimen was connected to each device and left to stand under a certain water head. In order to avoid deformation and damage to the specimen due to excessive water head, a lower water head (15 cm) was used at the beginning. The feasible water head for the permeation test was determined through several groups of test trials, and the water head for the formal test was 25 cm. For every 300 s of weighing the amount of water in the measuring cup, the water temperature was measured with a thermometer at the beginning and end of the test. Finally, the permeability coefficient was calculated according to the following formula.
where kt is the permeability coefficient of the specimen at water temperature t °C, cm/s; Q is the amount of water permeated in time t seconds, cm3; L is the permeation path, equal to the height of the specimen, cm; A is the specimen cross-sectional area, cm2; H is the permeation head, cm; t is time, s; and ηT is the dynamic viscosity coefficient of water at T °C, 10−6 kPa·s. η20 is the dynamic viscosity coefficient, 10−6 kPa·s.
3. Results and Discussion
3.1. Mineral Composition and Microstructure
The diffraction peak areas of the different minerals were used to semi-quantitatively calculate the proportion of each phase in the coral sand, and the analysis of the diffraction pattern (Figure 3) shows that the mineral composition of the coral sand is mainly biotite (mass fraction 35–45%) and high Mg calcite (mass fraction 55–65%) (see Figure 4), and interspersed with quartz minerals, as shown in Table 2. Biogenic aragonite is commonly found in animal shells or bone skeletons, in massive form, and is a mixture of a variety of irregular shapes. Biogenic aragonite is a product of biochemical action and is unstable in nature, often transforming into high magnesium calcite. The biogenic aragonite in coral sands is mainly derived from the remains of marine organisms, with the high-Mg calcite being partly naturally occurring and partly transformed from biogenic aragonite [21]. Quartz minerals are formed by the co-deposition of quartz-bearing minerals, such as quartz sand, carried by marine organisms, such as mussels themselves, and quartz particles of terrestrial origin by seawater transport with marine biogenic detrital material.
The coral sand is highly compressible, and the larger the initial pore ratio of the specimen, the greater the compressibility under lateral limit compression (Figure 5). The effect of the initial pore ratio of the coral sand on compressibility decreases with increasing pressure. When the stress level is large enough, the consolidation of the coral sand tends to be close to the normal consolidation line NCL [22,23].
3.2. One-Dimensional Compression Test Results
Coral sands display distinctive compression and deformation behaviors compared to terrestrial quartz sands when subjected to external forces. Figure 6 illustrates that the compression curves of coral sand, with uniform grading but varying initial pore ratios, can be divided into three stages. The initial stage, at a low stress level of 400 kPa, exhibits approximately parallel slopes among the four pore ratios, with consistent compression indices Cc0 ranging from 0.064 to 0.046 and an average value of Cc0 = 0.056. During the compression process, the coral sand particles remained intact, exhibiting frictional interlock among them. The particles underwent a directional rearrangement until it was complete. Importantly, the initial state of the specimen was largely unaffected by particle movement, indicating that it does not significantly influence the compression characteristics of coral sand. The study shows that the compression of cohesionless soils depends mainly on the rearrangement and fragmentation of the soil particles. Under the action of low pressure, the soil particles slide and roll, moving to a dense and stable equilibrium position. The amount of displacement or compression is determined by the ability of the intergranular frictional resistance between the soil particles to resist displacement. The better graded and denser the soil, the smaller the compressive deformation [24].
The second stage is the medium stress level stage, with stress values in the range of 400–800 kPa, where the grains begin to break up, triggering the destruction of the coral sand formation. The compressibility of coral sand undergoes a notable increase during this stage, leading to a significant variation in the slope of the compression curve. In Figure 6, the inflection point on the e-logp curve is identified as the yield point, typically characterized by the highest curvature on the compression curve. The stress value corresponding to this point is defined as the yield stress [24], which is related to particle fragmentation. As the initial pore ratio decreases, the yield stress gradually increases, and when the pressure exceeds the yield stress, a large number of particles begin to break. The compressive properties at this stage are closely related to the initial state of the specimen, and the compressibility decreases significantly with the increase in the dense state of the specimen, and the compression index Ccb decreases significantly in the range of 0.244–0.087. The study shows that with the increase in the pressure, the directional rearrangement between the particles is gradually completed, and the specimen reaches the dense state, and the compressive properties are mainly controlled by the particle crushing after the pressure continues to increase [3,12,22]. The volume reduction resulting from the breakdown of the coral sand structure becomes more pronounced in looser initial states. Simultaneously, there is a notable increase in pore reduction due to particle fragmentation, leading to significant alterations in the skeletal structure of the coral sand. This fragmentation manifests in various particle forms, such as rhombic and flattened shapes.
The third stage is the high stress level stage, with stress values reaching 1600–4000 kPa. The compression curves with different initial pore ratios in this stage tend to intersect in a straight line: y = 2.302 − 0.383x, similar to the normal consolidation line NCL in the clay compression curve, which corresponds to the ultimate compression line LCC in the Pestana & Whittle model [25]. The coral sand is highly compressible, and the larger the initial pore ratio of the specimen, the greater the compressibility under lateral limit compression. The coral sand is highly compressible, and the larger the initial pore ratio of the specimen, the greater the compressibility under lateral limit compression. The effect of the initial pore ratio of the coral sand on compressibility decreases with increasing pressure. When the stress level is large enough, the consolidation of the coral sand tends to be close to the normal consolidation line NCL.
The initial porosity ratio has a small effect on the yield stress of the coral sand configuration at the time of destruction, and the yield stress is not significantly related to the initial porosity ratio (e). The yield stress of the coral sand specimen at the time of destruction is about 400 kPa. However, the critical stress (py) of the normal consolidation line NCL is closely related to the initial state. A relatively loose specimen can reach the normal consolidation line at a pressure of 1600 kPa. Coop [26] concluded that the normal consolidation line is caused by particle fragmentation, with dense sands breaking before the normal consolidation line, and loose sands reaching the normal consolidation line at low stress levels. The normal consolidation line is attained at low stress levels. At the beginning of loading, the rearrangement of particle positions occurs, and the yield stress is not obvious; as loading increases, particle fragmentation begins, and there is a significant yield stress. As pressure continues to increase, the compression characteristics are mainly controlled by particle fragmentation. As seen in Figure 6, under an axial pressure of 4000 kPa, the coral sand specimen is compressed from an initial pore ratio of e = 1.176 to a pore ratio of e = 0.92. This phenomenon indicates that the coral sand still has a large pore ratio in the dense state, and the pores still have a high release space as the stress level increases. Under high stress, this can cause a considerable compression of coral sand, and will also have a serious deteriorating effect on the local shear zone. Therefore, attention should be paid to the design and construction of high-weight foundation elements in natural sedimentary reef sand sediments.
Figure 7 illustrates the one-dimensional compression unloading–reloading curve of the coral sand specimen with an initial porosity ratio of e = 1.176. As observed in Figure 7, the unloading rebound of the coral sand is minimal, and the deformation during compression is primarily plastic deformation. The unloading curve and recompression curve of the coral sand specimen basically overlap, and the slope is about 0.014. Throughout the unloading process, the contact points between the particles remain basically unchanged, and the broken particles cannot revert to their original state. During the reloading process, the deformation essentially mirrors that of unloading, and as the pressure approaches or exceeds the pre-consolidation pressure, the compression index continues to increase. Compression deformation follows the initial compression curve before unloading, indicating that the fine structure formed during the initial compression process can resist recompression at pressures lower than the current pressure. Particle fragmentation during recompression is minimal, and the deformation is mainly the recompression of the elastic rebound deformation of the soil skeleton.
Once the stress level at the time of the first unloading is surpassed, new particle fragmentation begins. The normal consolidation curve value λ is 0.383 for the coral sand, while the slope of the unloading curve κ and λ/κ are 0.014 and 27.36, respectively. This study suggests that the λ and κ values are essentially similar for soils with the same carbonate content and genesis. Soils with similar genesis and carbonate content (mainly composed of calcium carbonate) exhibit similar compression theories and characteristics, expressible in terms of their compression properties through λ and κ lines, which approximate clay [22]. From a geo-engineering perspective, aside from employing layered rolling measures to densify the reef sand blowing site, subjecting the actual foundation to a pre-pressure action greater than the expected subgrade pressure proves to be a more effective measure for reducing foundation settlement [3].
3.3. Straight Shear Test Results
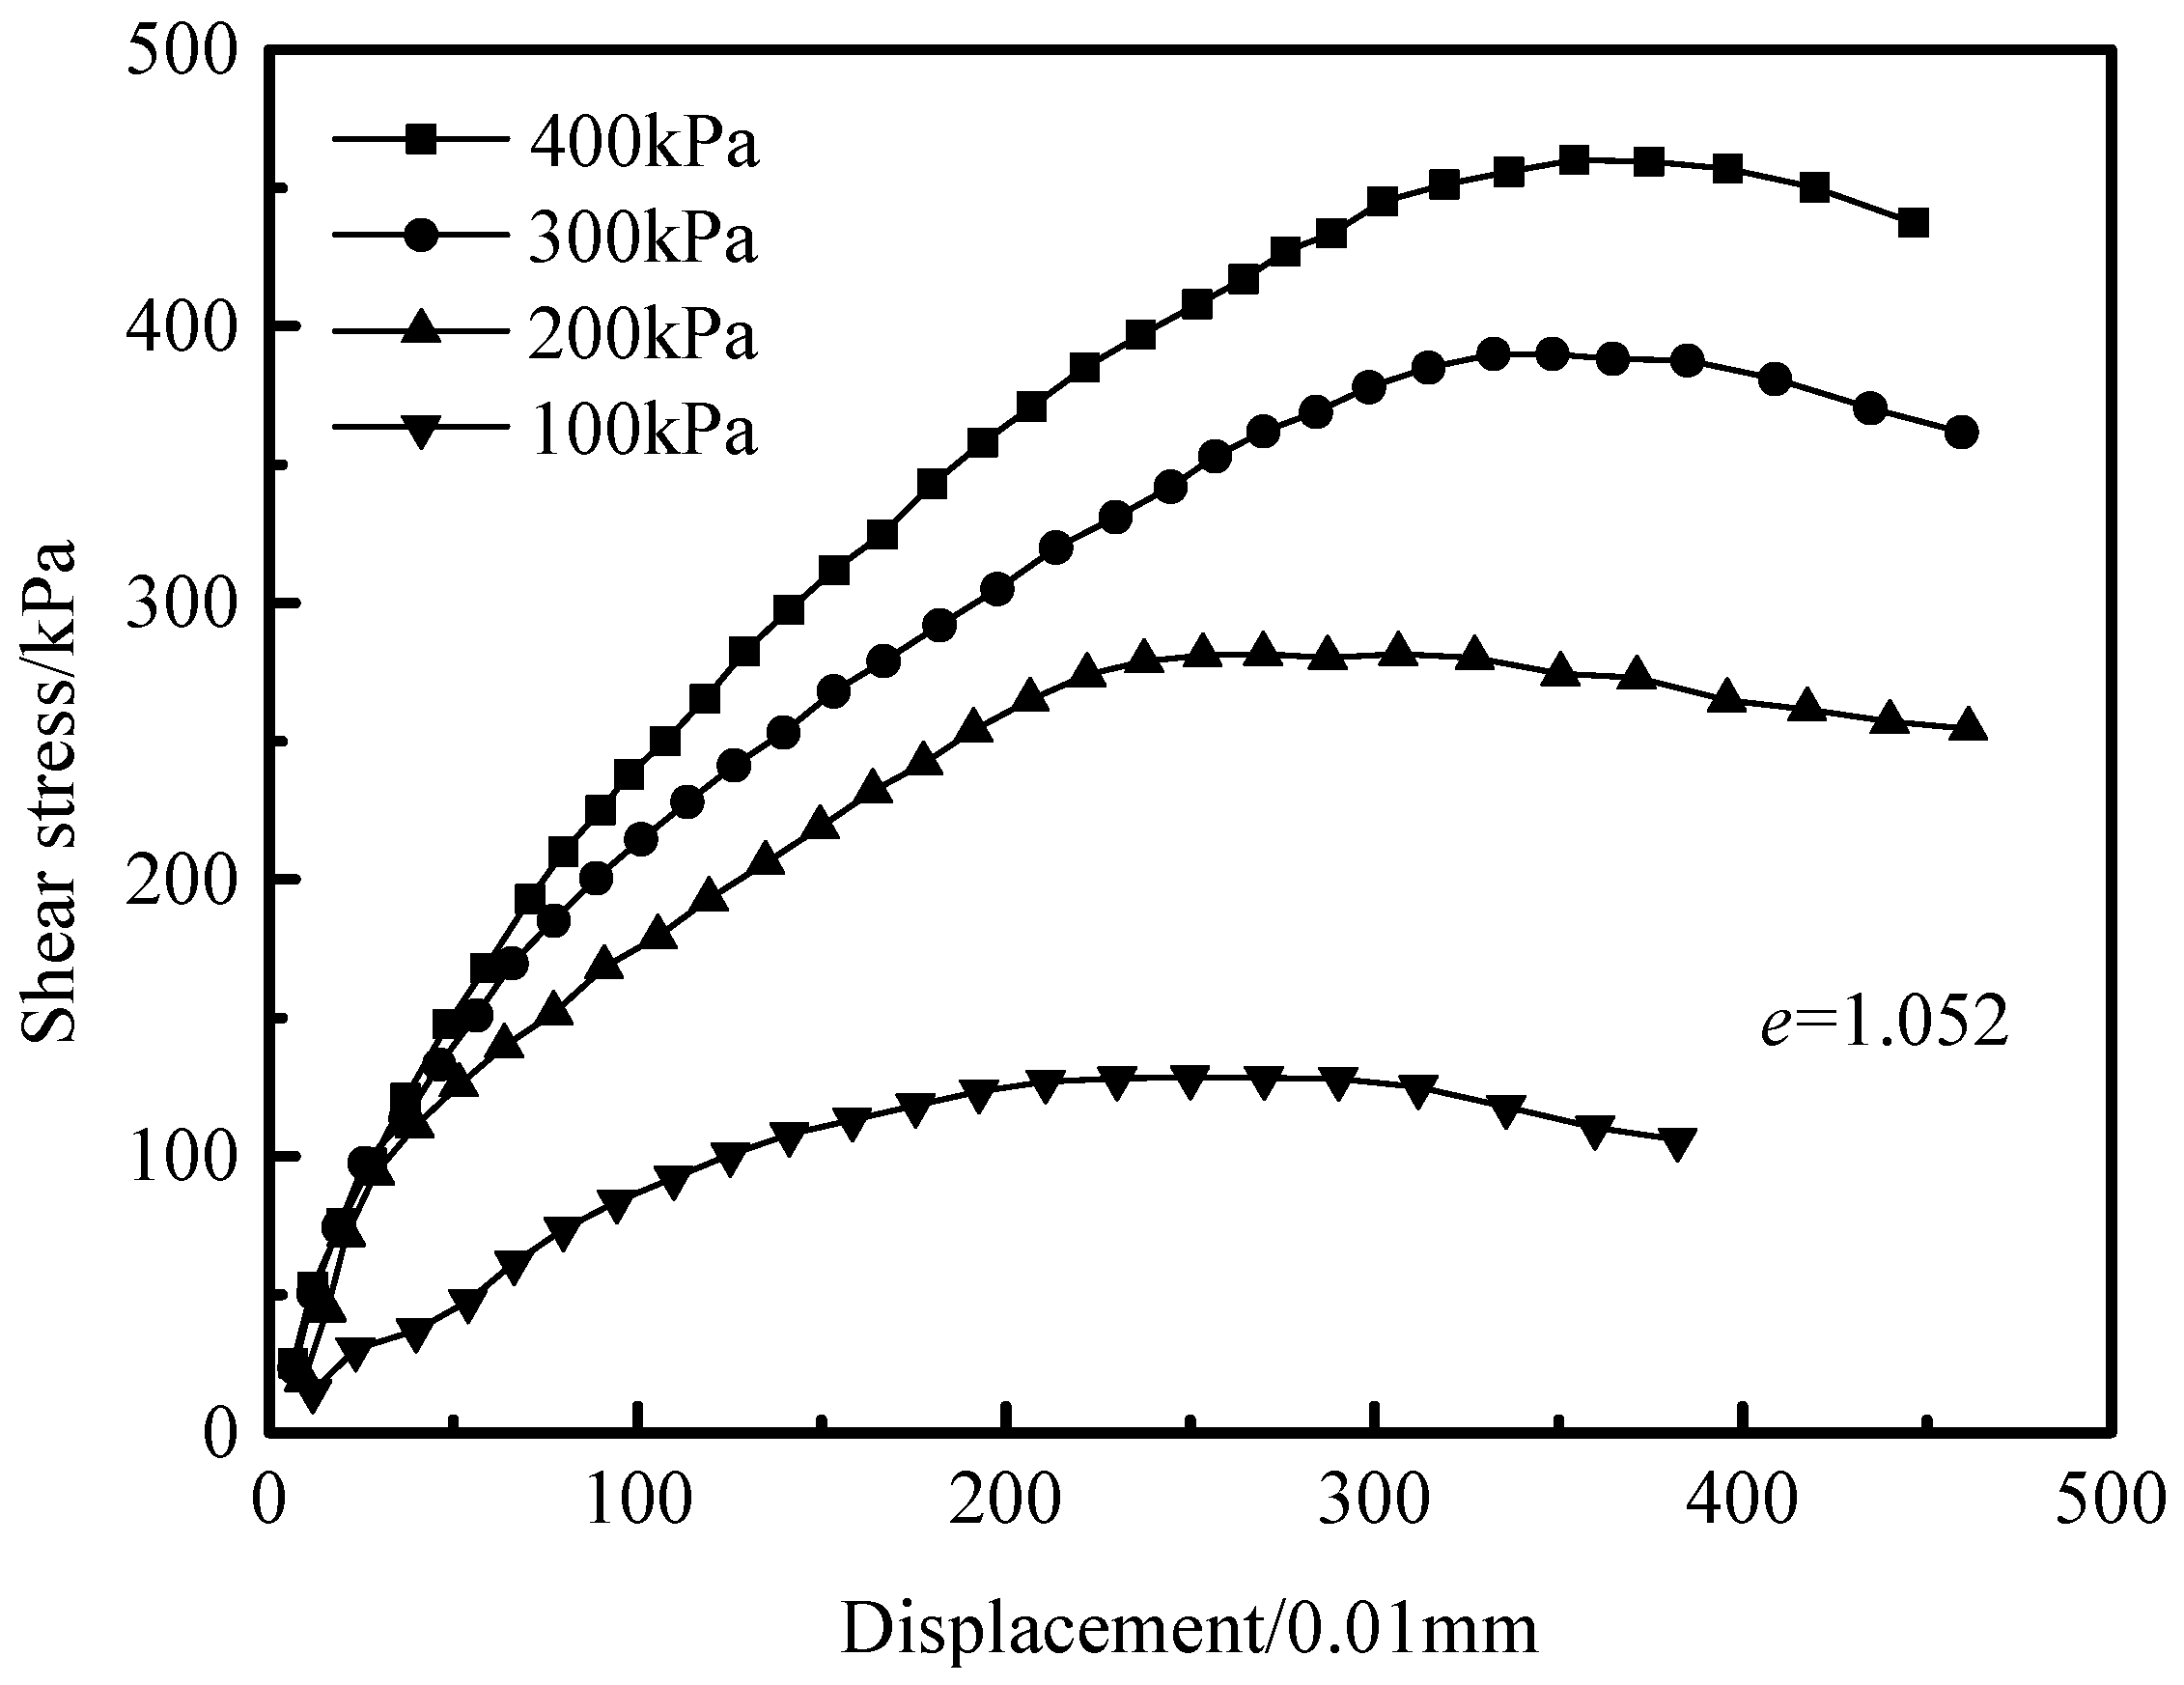
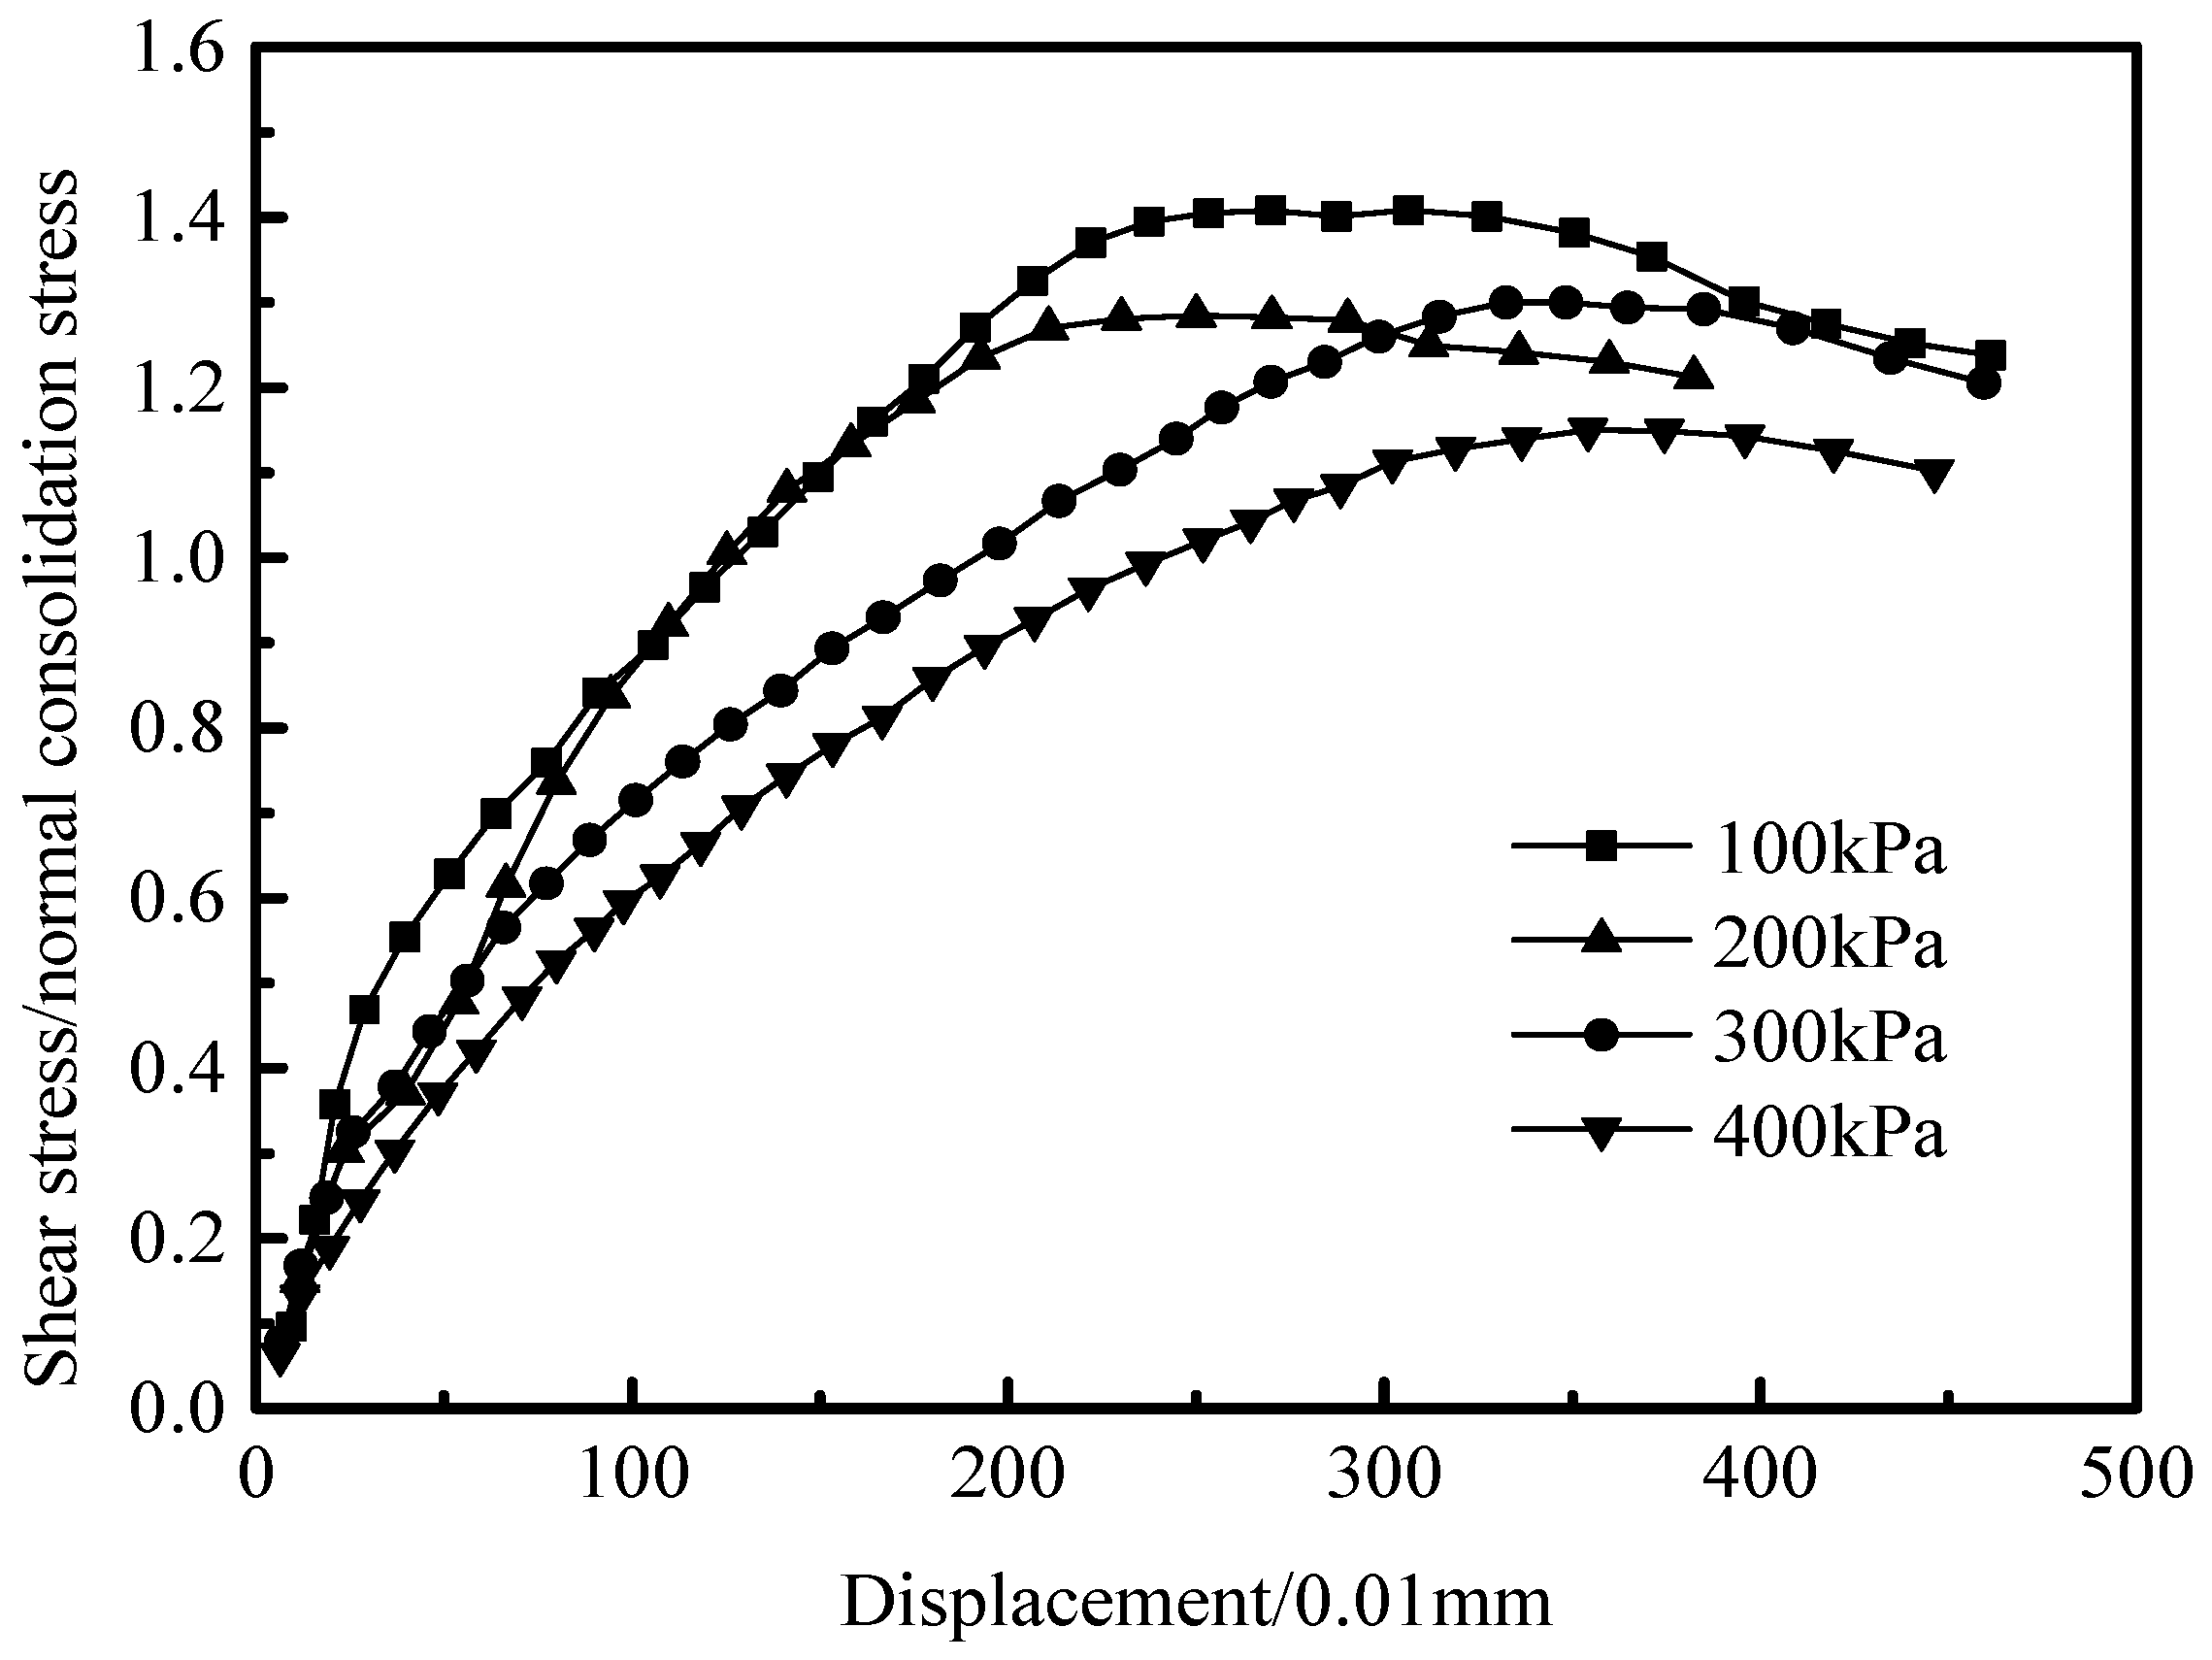
The specimens were prepared according to the initial gradation of the coral sand specimens, controlling the porosity ratio at e = 1.052. As depicted in Figure 8, the stress–strain relationship of the specimens with the same porosity ratio was nearly hyperbolic, and there was no obvious strain softening. As vertical pressure and destructive strain escalate, the shear stress–displacement relationship demonstrates a subtle strain softening effect. This phenomenon is attributed to the limited contact points among particles within the specimen and the minimal restraining influence exerted by surrounding particles. Under conditions of low vertical stress, the scarcity of contact points and constraints facilitates particle tumbling within the specimen, manifesting as a minor softening in the curve. Conversely, at elevated vertical stress levels, the increased pressure intensifies inter-particle constraints. Given its friability, coral sand readily fractures under substantial vertical stress, with these fractured particles primarily contributing to strain softening observed in the curve’s latter half, overshadowing particle tumbling as a stress reduction factor. Consequently, stress reduction is no longer principally attributed to the initial factors.
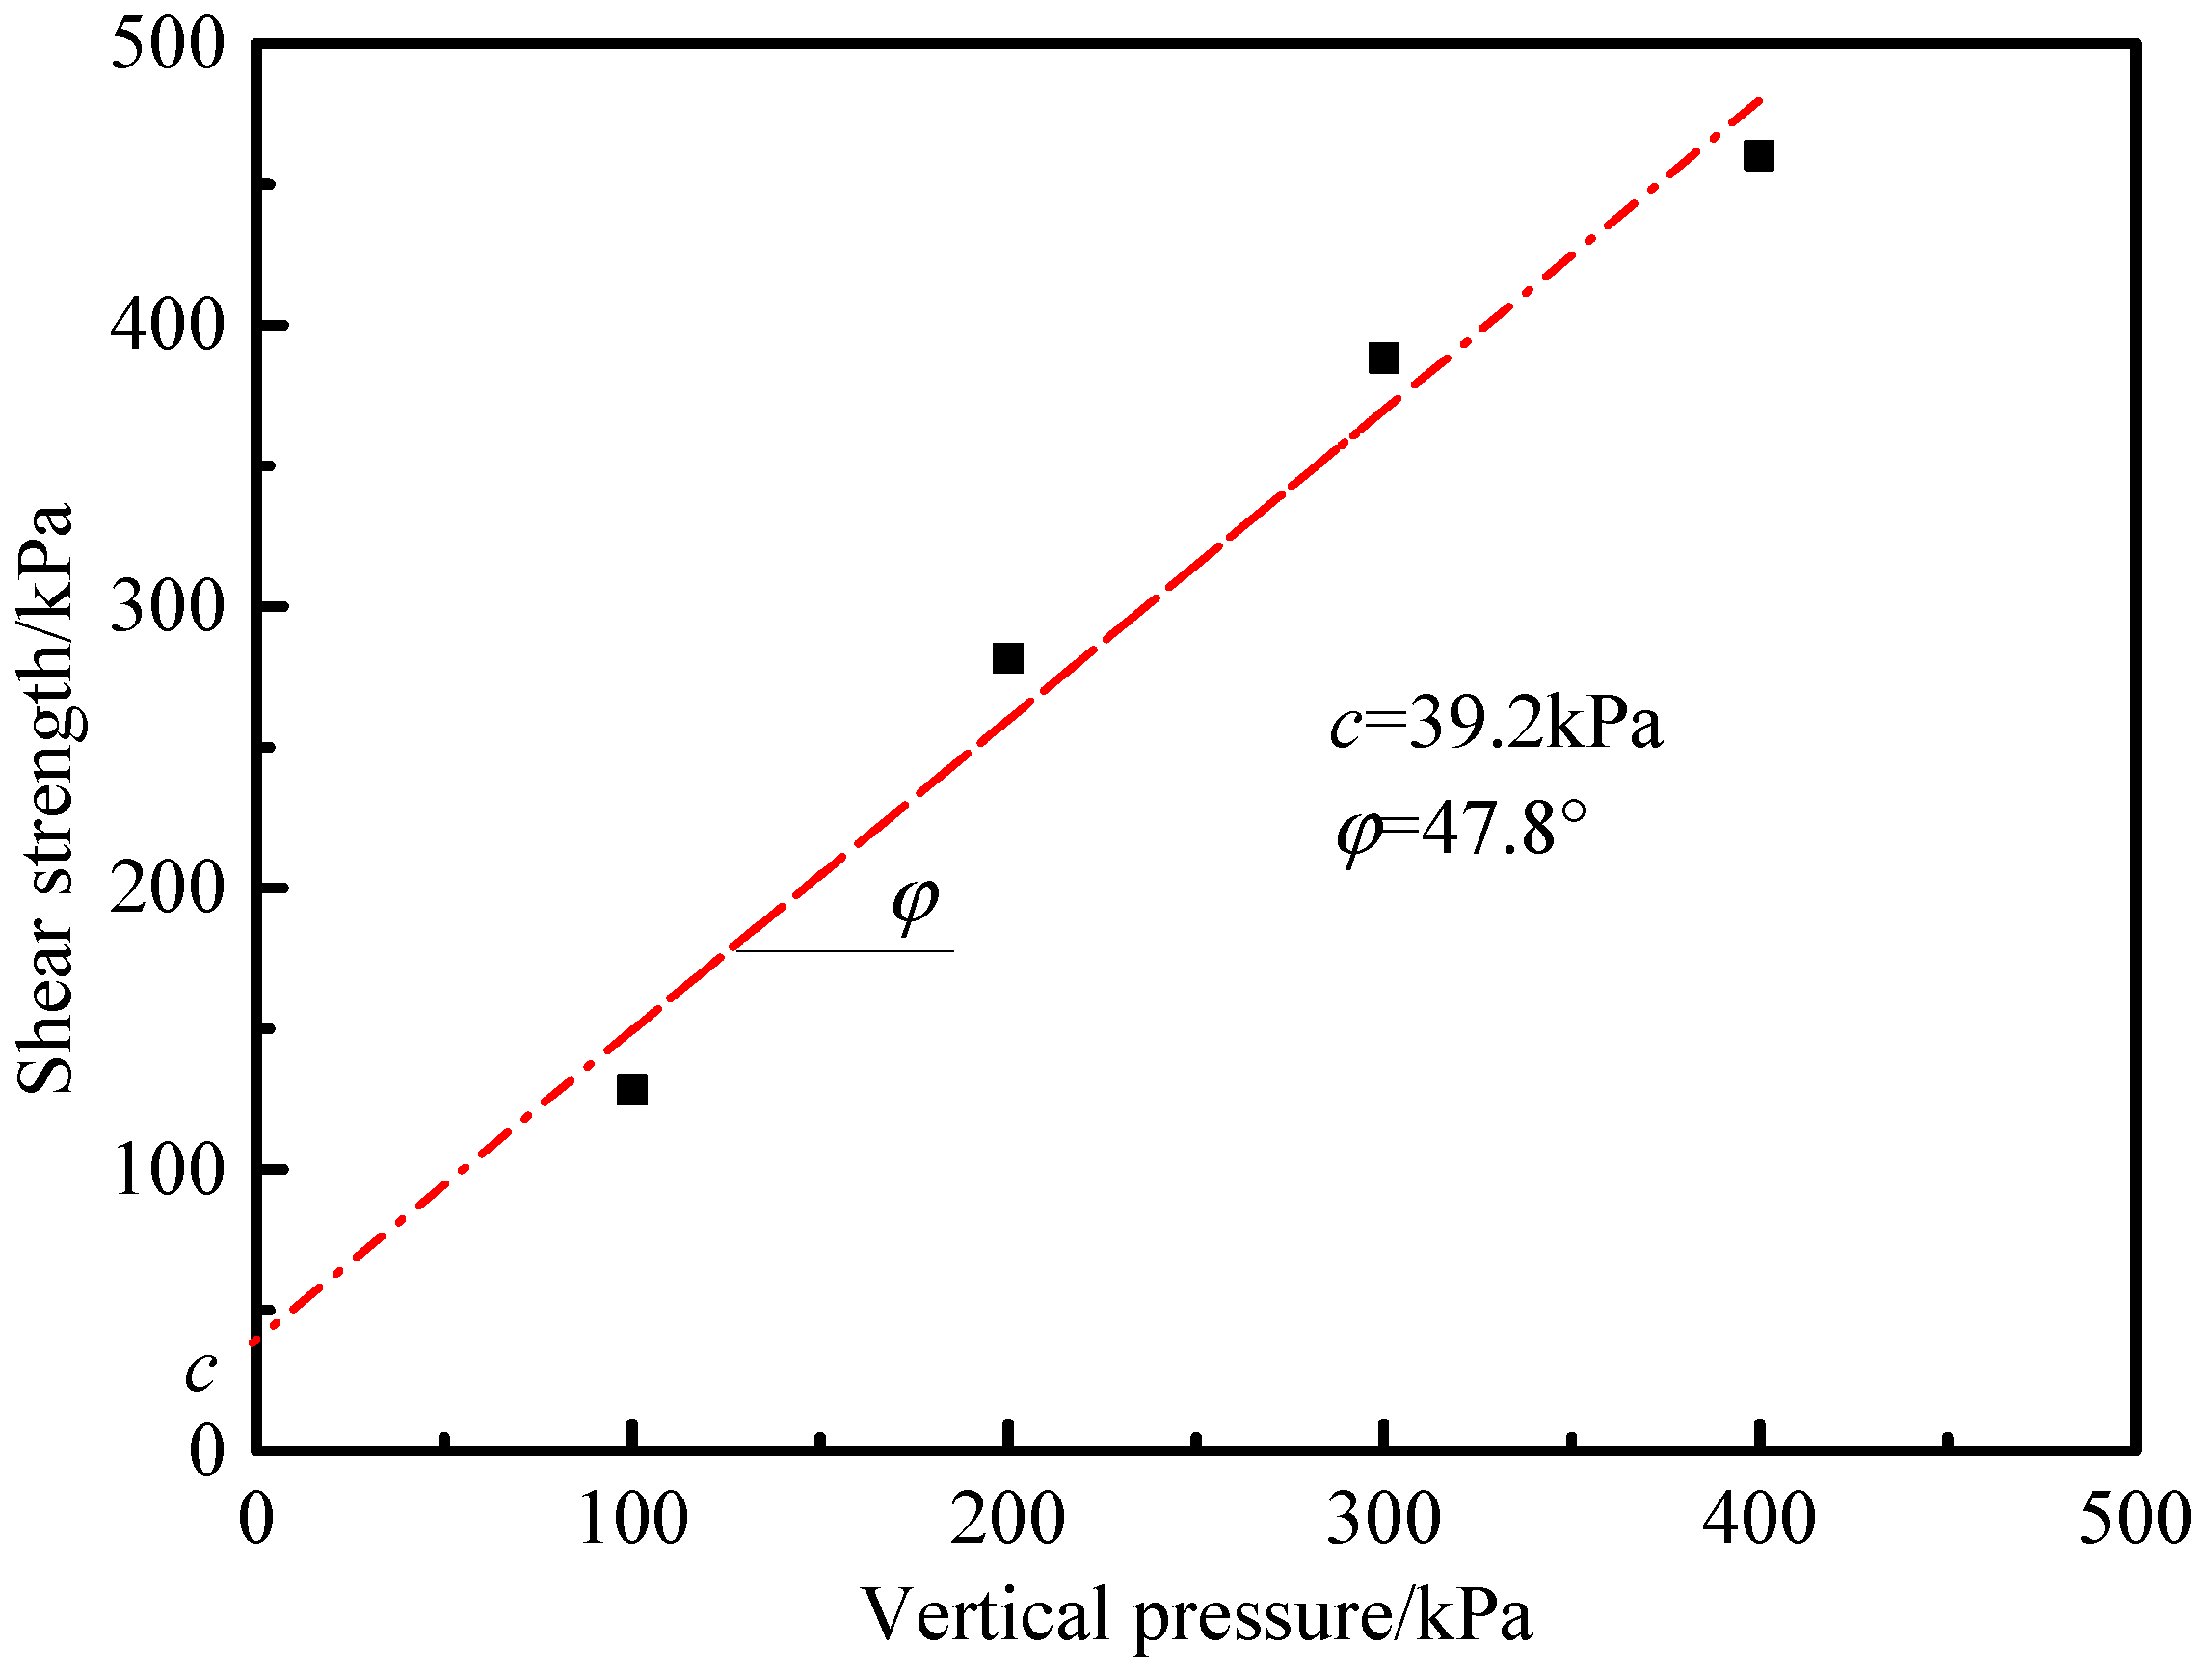
As shown in Figure 9, the direct shear test strength envelope of the coral sand is essentially linear at an initial pore ratio of e = 1.052, with an internal friction angle of φ = 47.8° and a cohesive force of c = 39.2 kPa. The internal friction angle depends on the frictional resistance between the particles, the irregular shape of the particles and the energy consumption of shear crushing. More energy is consumed when the specimen is sheared, so the internal friction angle is larger. However, the vertical pressure in the straight shear test is small and the particle fragmentation is extremely limited, coupled with the fact that the specimen is only sheared at a fixed shear surface, causing little change in the angle of internal friction. The stress state within the specimen in the direct shear test is complex and unevenly distributed, with the direction of the principal stress changing with the loading of the shear stress. The greater the shear stress, the greater the deflection angle. Experimental results indicate that the internal friction angle of coral sand is φ = 47.8°. The irregular shape and porosity of coral sand exacerbate the friction force, and more energy is required for shearing, resulting in a higher angle of internal friction. Chai Wei [27] obtained an internal friction angle φ = 35°–42° for the direct shear test of calcareous dry sand under different shear rate conditions, and Wang Qing [28] obtained an internal friction angle φ = 34.4° for the direct test of calcareous sand specimens under four moisture content conditions, namely 0, 8%, 16%, and 24% at 34.4°–37.6°. In real practice, the coral sand is generally deformed and displaced as a whole after being stressed, while the shear stress distribution of the specimens is assumed to be uniform in the direct shear test, which obviously cannot simulate the real situation, so the high internal friction angle obtained from the test cannot be directly applied.
The aim of normalizing the relationship between stress and displacement in coral sands is to remove the effect of normal consolidation stresses on shear stresses. As can be seen from Figure 10, when the shear stress is normalized by the normal consolidation stress, the test curves for the same initial pore ratio all tend to the same value, with τ/σ values tending to be between 1.1 and 1.3. Specimens with high vertical stresses exhibit hardening characteristics, while specimens with low vertical stresses exhibit strain softening characteristics. As can be seen by sieving the specimens before and after the test, the gradation of the specimens before and after the test changed little. At this stress level, particle fragmentation can almost be disregarded. This is mainly due to the low stress level of the direct shear test and the fixed shear surface of the test, so that the parameters obtained during the test are essentially very different from those of normal land-sourced sand, and the high internal friction angle exhibited is only due to the angularity and roughness of the particles themselves. This also suggests that it is difficult to characterize the particle fragmentation of coral sands under direct shear test conditions.
3.4. Triaxial Test Results
Triaxial consolidation and drainage shear (CD) tests were carried out on coral sands with an initial pore ratio of e = 1.160 in the low pressure range of 100–800 kPa. As depicted in Figure 11 and Figure 12, the stress–strain relationship curves for the tests applied at pressures below 400 kPa were generally consistent, showing a rapid increase in initial deviatoric stress and a slow decrease after reaching a significant peak stress. As the envelope pressure continues to rise, the greater the axial strain required for the specimen to reach peak strength, a shift from strain softening to strain hardening occurs. When the surrounding pressure is relatively low at σ3 < 200 kPa, the triaxial shear of coral sand exhibits shear swelling characteristics; when the surrounding pressure increases, the shear swelling characteristics rapidly decrease and develop towards shear compression characteristics. When the surrounding pressure is at σ3 > 400 kPa, coral sand in triaxial shear demonstrates shear compression characteristics. Coral sand exhibits volume contraction before significant volume expansion occurs when the enclosing pressure is low; for example, the maximum shear expansion volumetric strain (approximately −3%) is three times the maximum shear contraction volumetric strain (1%) at an enclosing pressure of 100 kPa. At high envelope pressures, the entire shearing process involves volume reduction, with soil shear shrinkage strain peaking and then stabilizing. For instance, at an envelope pressure of 800 kPa, the shear shrinkage body change reaches approximately 7% and then remains stable. The combined effects of the geometric characteristics of coral sand particles and the angular fragility during shear are potential reasons for shear shrinkage at low stress states.
The test reveals that under low cell pressure, coral sand experiences volume compression in the early stages of shear, regardless of the specimen’s initial density. The particles tightly compact, leading to increased specimen density and a relatively stable equilibrium state. During this stage, the specimen’s strength shows nearly linear growth with minimal particle fragmentation. As axial displacement continues, the equilibrium state breaks, and the body rate of change gradually increases. Interparticle misalignment mitigates unbalanced stress growth, while internal shear expansion contributes to elevated deviatoric stress. The mutual occlusion of coral sand particles during relative movement causes significant particle crushing, reducing shear expansion effects, and resulting in decreased deviatoric stress. In this stage, the impact of shear expansion on strength outweighs particle fragmentation, and the deviatoric stress peaks near the position of maximum body transformation rate. When the strength reaches its peak, the specimen is destroyed under the action of the bias stress, after which the volume of the specimen increases slightly. When under high envelope pressure, the specimen continues to undergo shear shrinkage, such as the coral sand under an envelope pressure of 800 kPa, which is likely to be related to the high envelope pressure inhabiting the shear expansion of the specimen and the high envelope pressure induced by particle fragmentation enhancing the shear shrinkage of the soil body [12,29].
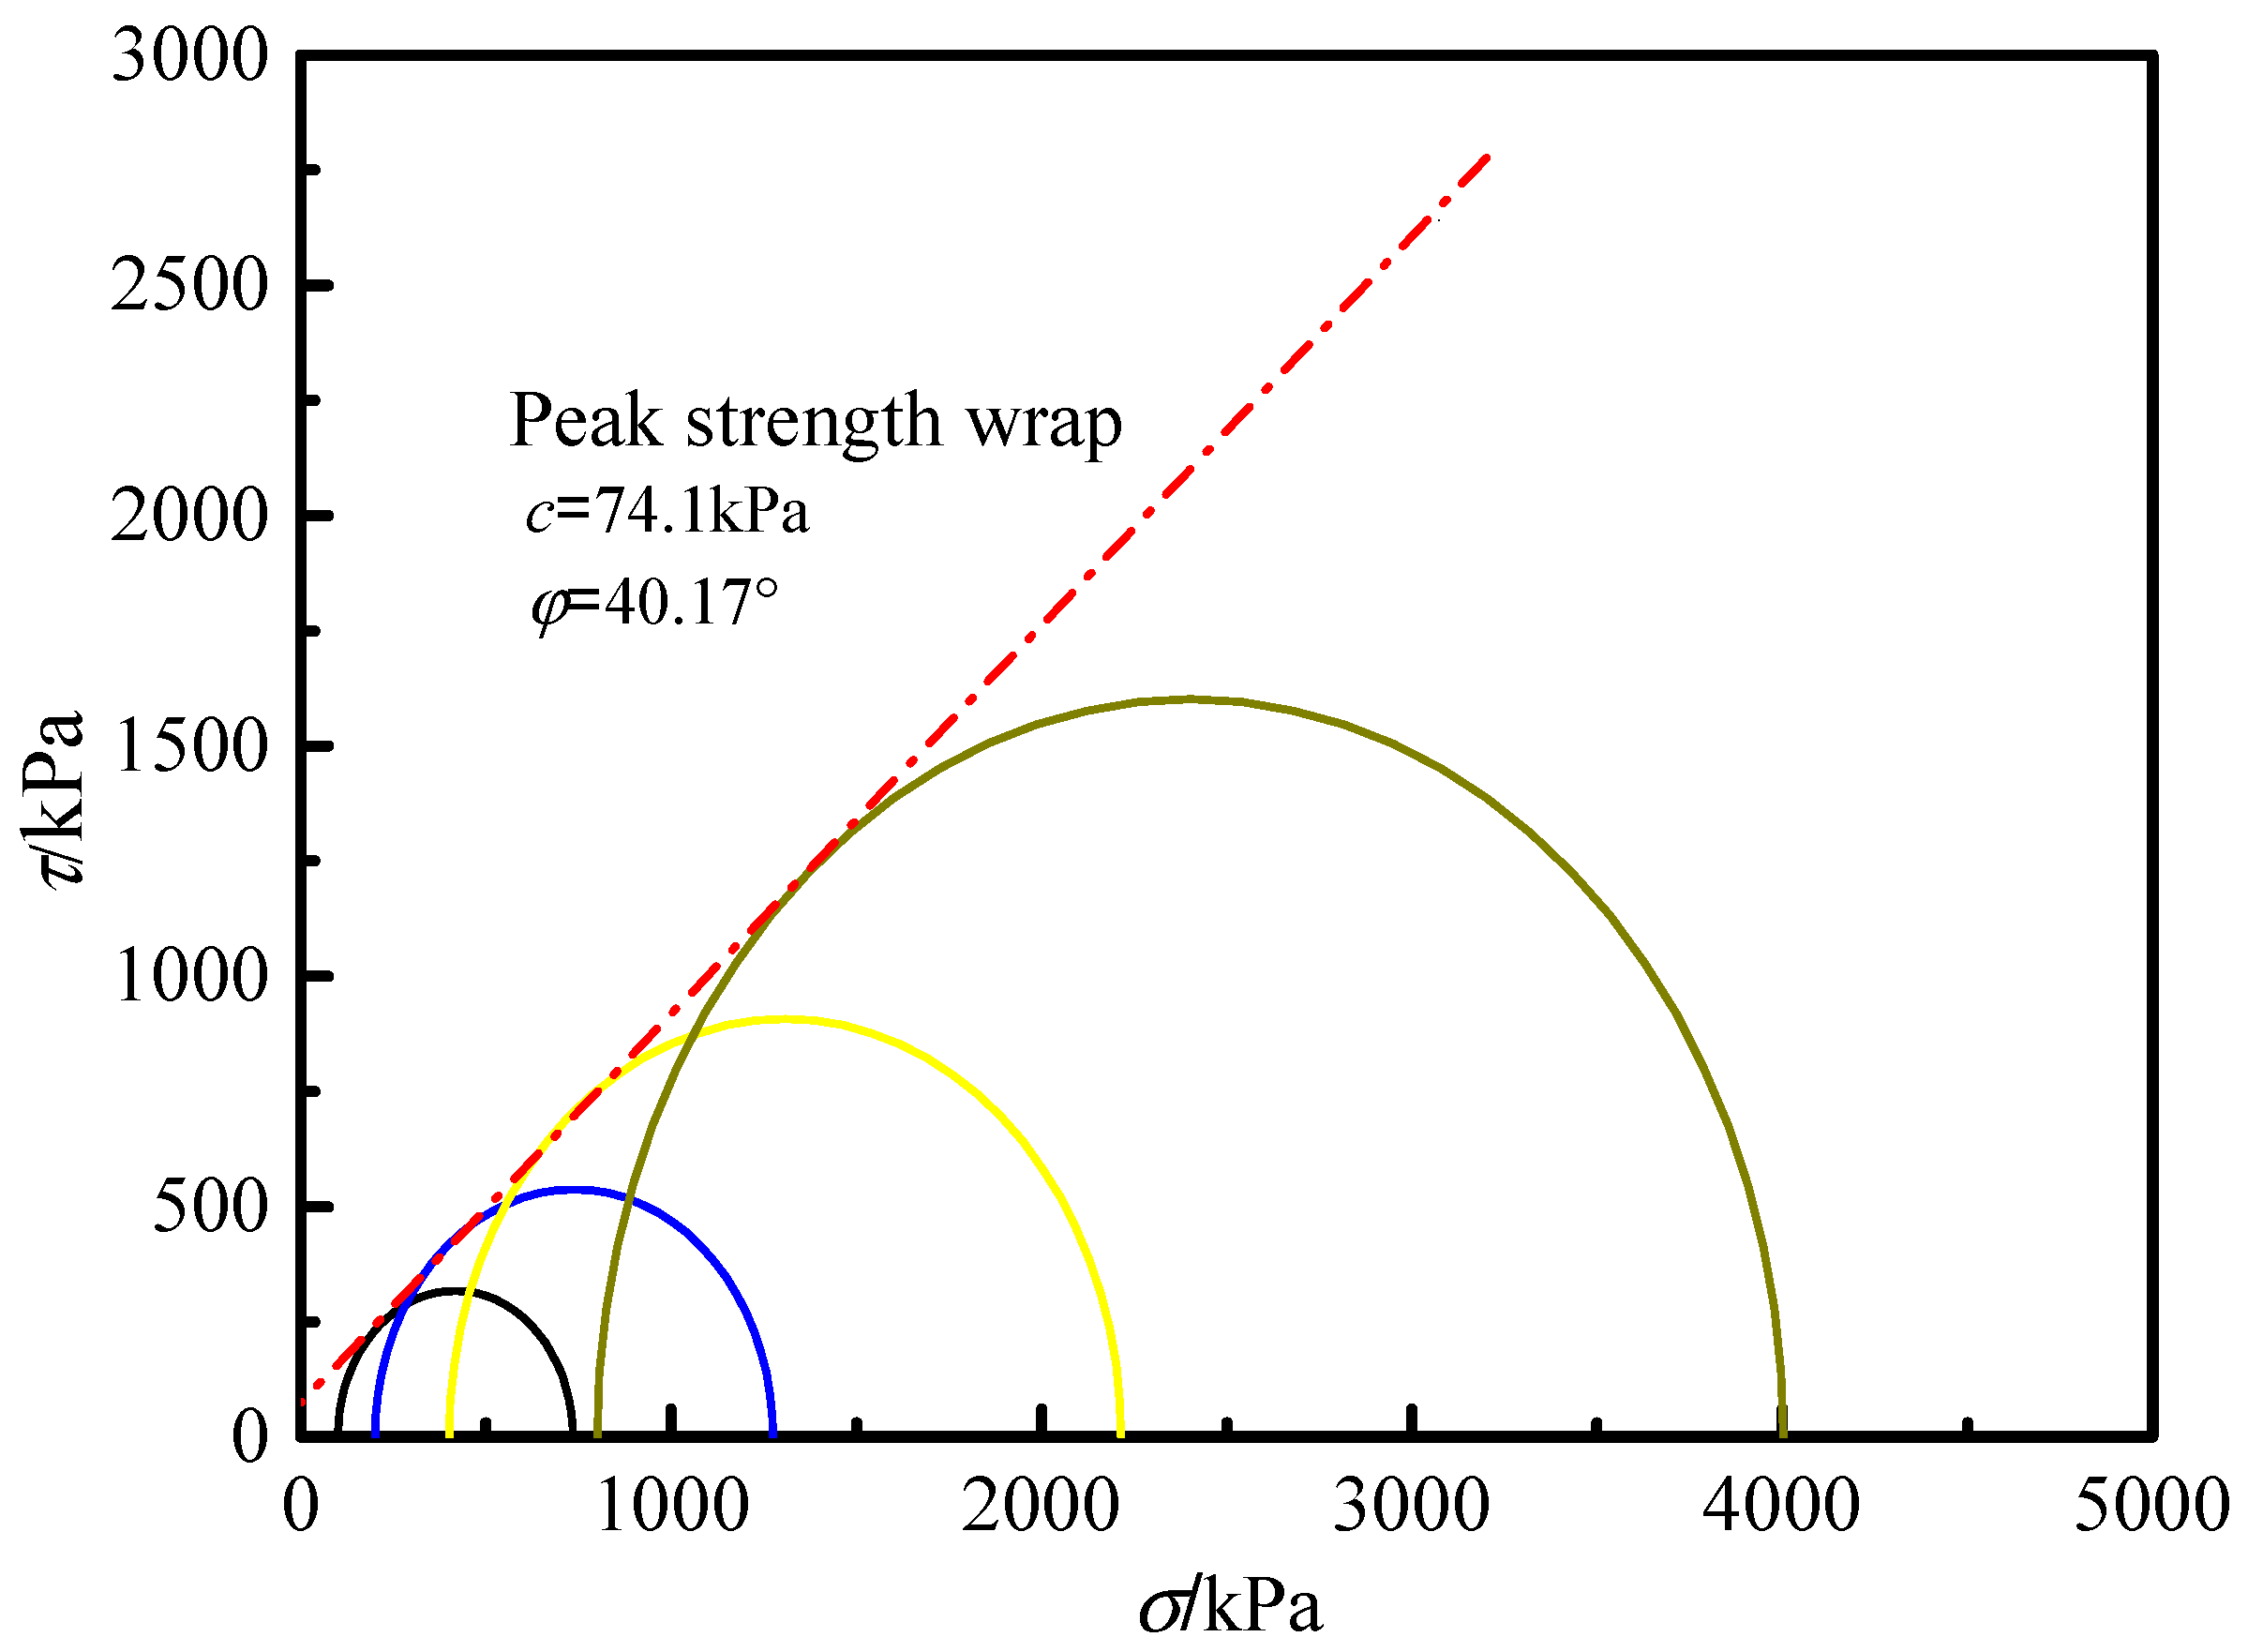
The coral sand is highly permeable and the pore water pressure of the specimen dissipates rapidly in the triaxial consolidation and drainage shear (CD) test. As can be seen from Figure 13, the critical strain corresponding to the peak strength increases significantly with the surrounding pressure. As the surrounding pressure increases, the principal stress ratio (σ1/σ3) decreases, and the curve transitions from a strain-softening to a strain-hardening type. When the specimen reaches a similar principal stress ratio value at around ε1 = 20%, the critical stress ratio for the test is between 4 and 5. The subsequent stress ratio and strain curves develop in parallel to the strain axis ε1, indicating plastic flow in the coral sand. Using the Mohr-Coulomb damage criterion, the Mohr stress circle was plotted with (σ1 + σ3)/2 as the center of the circle and (σ1 − σ3)/2 as the radius, and the peak strength envelope equation was τ = 0.844σ + 74.1, with an internal friction angle φ = 40.17° and cohesion c = 74.1 kPa, see Figure 14. The internal friction angle obtained from the triaxial shear test was less than that from the straight shear test (φ = 47.8°). However, it is closer to the value of the internal friction angle of calcareous sand proposed by Chai Wei and Wang Qing [27,28], suggesting that the triaxial shear test of coral sand aligns better with engineering reality.
3.5. Permeability Test Results
The tests were conducted using the same grade of blown reef sand mix at various pore ratios (e0 = 1.054, e0 = 1.089, e0 = 1.176, e0 = 1.261) to determine the permeability coefficient. Additionally, the same dimensional one-dimensional compression test was employed for the pore ratio to prevent the impact of changes in specimen grade on both permeability coefficient and permeability deformation. As illustrated in Figure 15, the permeability coefficient increases with an increasing pore ratio for specimens of the same grade. At the same head, the resistance encountered by the fluid decreases, and the percolation volume per unit time becomes larger with increasing pore ratios. The permeability coefficients of coral sands are concentrated around 10−4 cm/s, which is small compared to the permeability coefficients of terrestrial sands of the same grain size range. The linear correlation between the permeability coefficient k20 and 10e is high, and the fitted equation is k20 = 1.6025 × 10e − 8.7565. The permeability characteristics of the pore medium are closely related to its pore ratio. When the density is large, the contact force between particles is relatively small, and the pores within the mixture are not fully filled, forming a relatively loose skeleton. Consequently, the pore ratio is large, leading to a larger seepage channel and lower seepage resistance. Therefore, the permeability coefficient is large. On the other hand, when the density is large, the particles in the mixture are in close contact, resulting in a reduced pore ratio. This leads to a decrease in the effective over-water area of the seepage channel, causing an increase in seepage resistance and path. Consequently, the permeability coefficient decreases [30,31].
3.6. Correlation Analysis of Strength, Deformation, and Permeability Coefficient
The initial pore ratio e0 affects the strength, deformation, and permeability characteristics of coral sands. As can be seen from Figure 16 and Figure 17, the permeability coefficient of the same gradation and different initial pore ratios e0 decreases with increasing values of one-dimensional compressive stress, and tends to a constant value when the pore ratio reaches a certain value. The permeability coefficient of coral sand with a large initial pore ratio is larger when the stress value is small, mostly concentrated in about 10−3 cm/s, and the permeability coefficient is influenced by the porosity of the specimen. When the stress value continues to increase, frictional occlusion occurs between the coral sand particles, leading to a re-orientation arrangement and an increase in specimen compactness. Consequently, the permeability coefficient gradually decreases. As the stress value continues to increase further, the permeability coefficient of coral sand experiences a rapid decrease, and the permeability characteristics are influenced by the arrangement of specimen particles. When the stress value reaches 4000 kPa, the pore ratio is around 0.9 and the permeability coefficient is concentrated around 4 × 10⁻⁴ cm/s. The pore ratio and permeability coefficient gradually converge to a constant value. The one-dimensional compression strength and permeability coefficient both approximately obey the third function relationship; the correlation coefficient is 0.991.
The strength, deformation, and permeability characteristics of coral sand blown mixes are also influenced by factors such as the shape of specimen particles, mix grading, maximum particle size, coarse and fine particle content, clay admixture, particle fragmentation, and test methods. The relationship between strength, deformation, and permeability characteristics is depicted in Figure 18. From the figure, it can be observed that the strength, deformation, and infiltration characteristics of coral sand blown mixes exhibit complex mutual coupling, with intertwined factors and common interactions. However, in general, the porosity of the sample has the greatest influence on the mix’s strength, deformation, and infiltration characteristics. Simultaneously, particle breakage significantly affects the specimen’s porosity, and further research is needed to explore the impact of particle breakage on the strength, deformation, and permeability characteristics of the material. It is essential to consider the influence of porosity on the design and construction of high-weight foundation elements in coral sand blow-fill projects. Nevertheless, the investigation of macro-mechanical properties versus microstructure versus mineral composition will be addressed in future studies.
4. Conclusions
- (1)
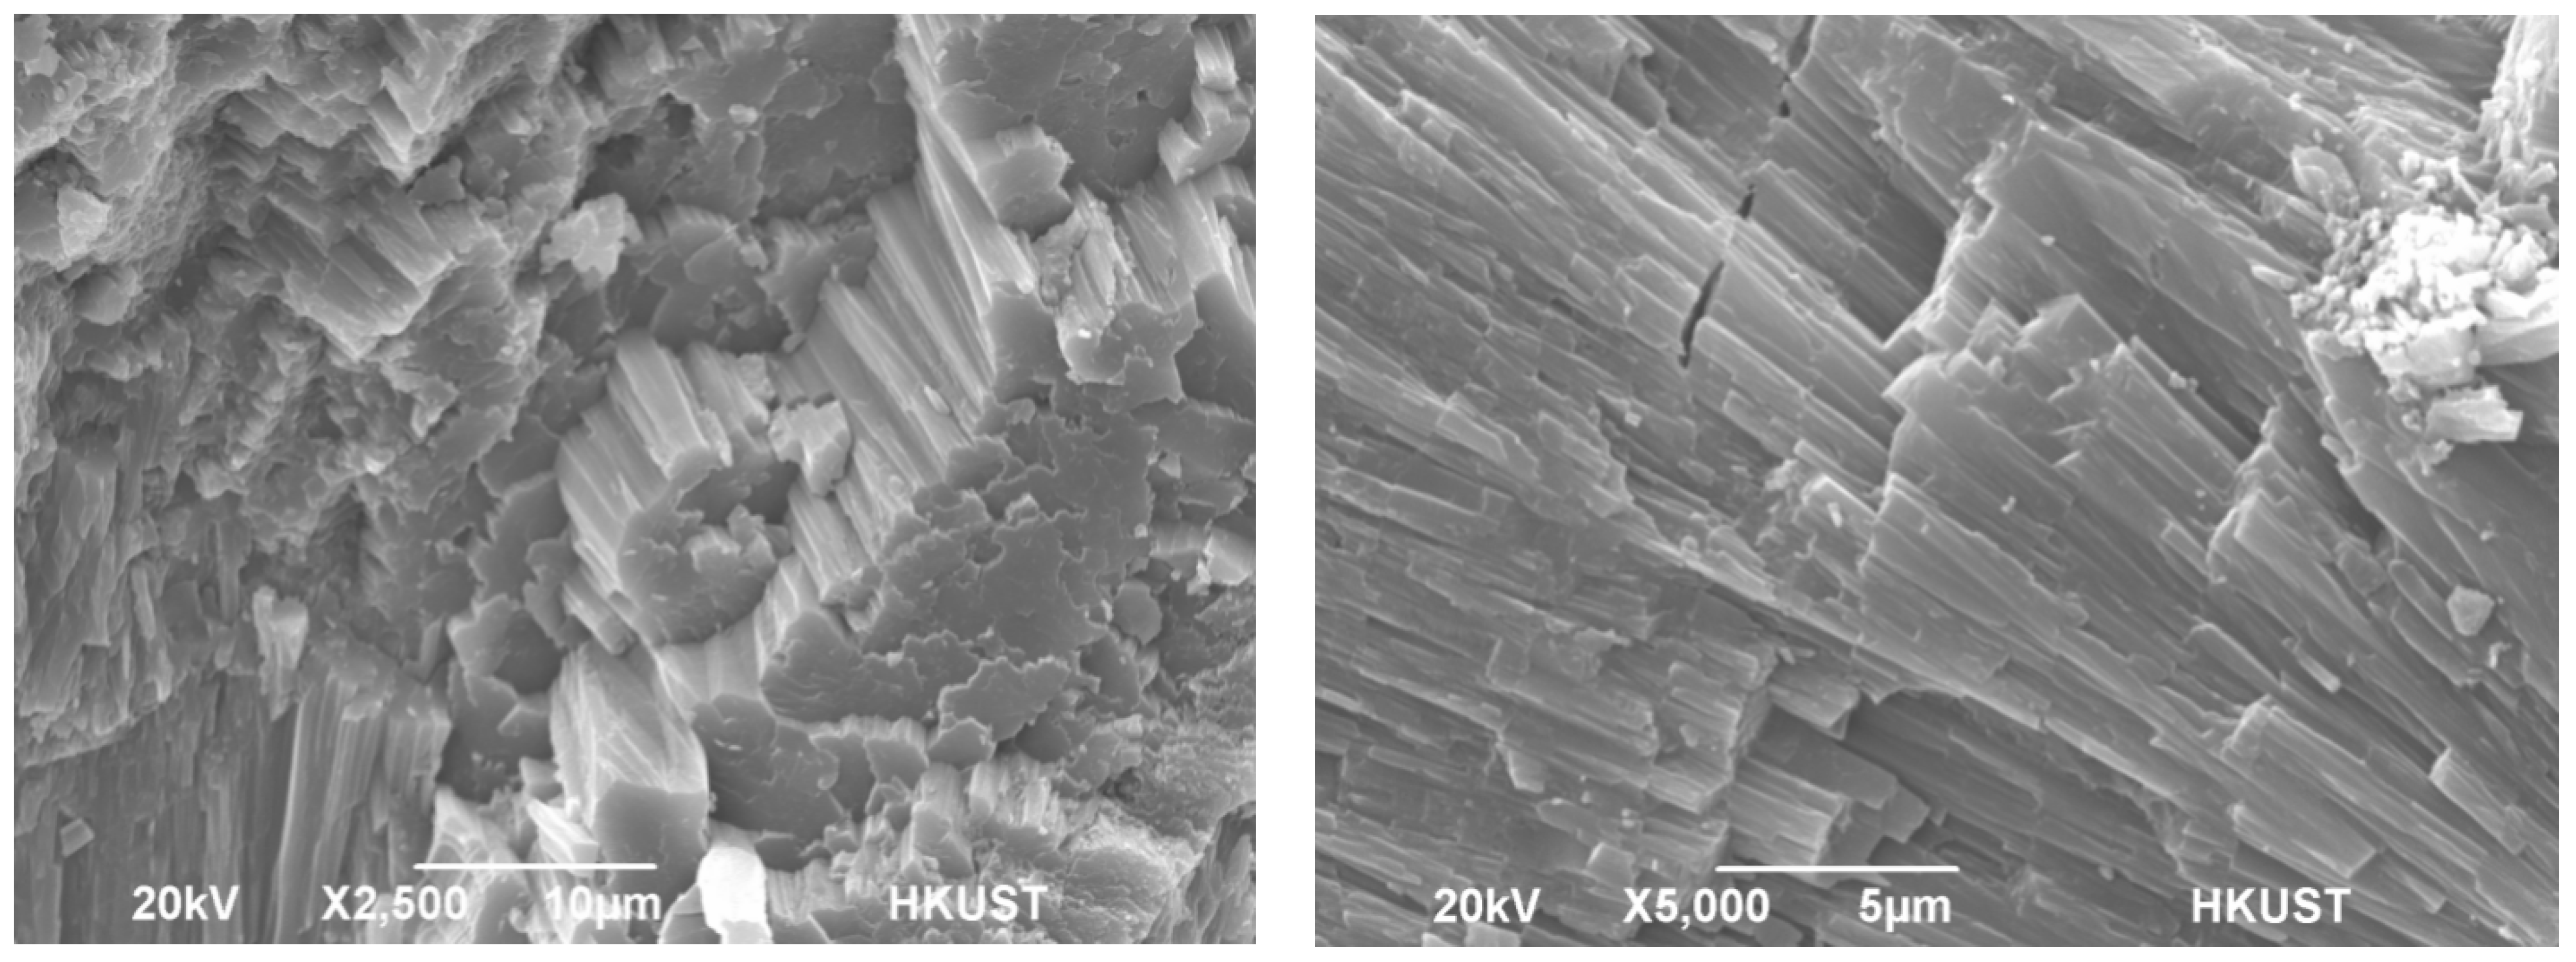
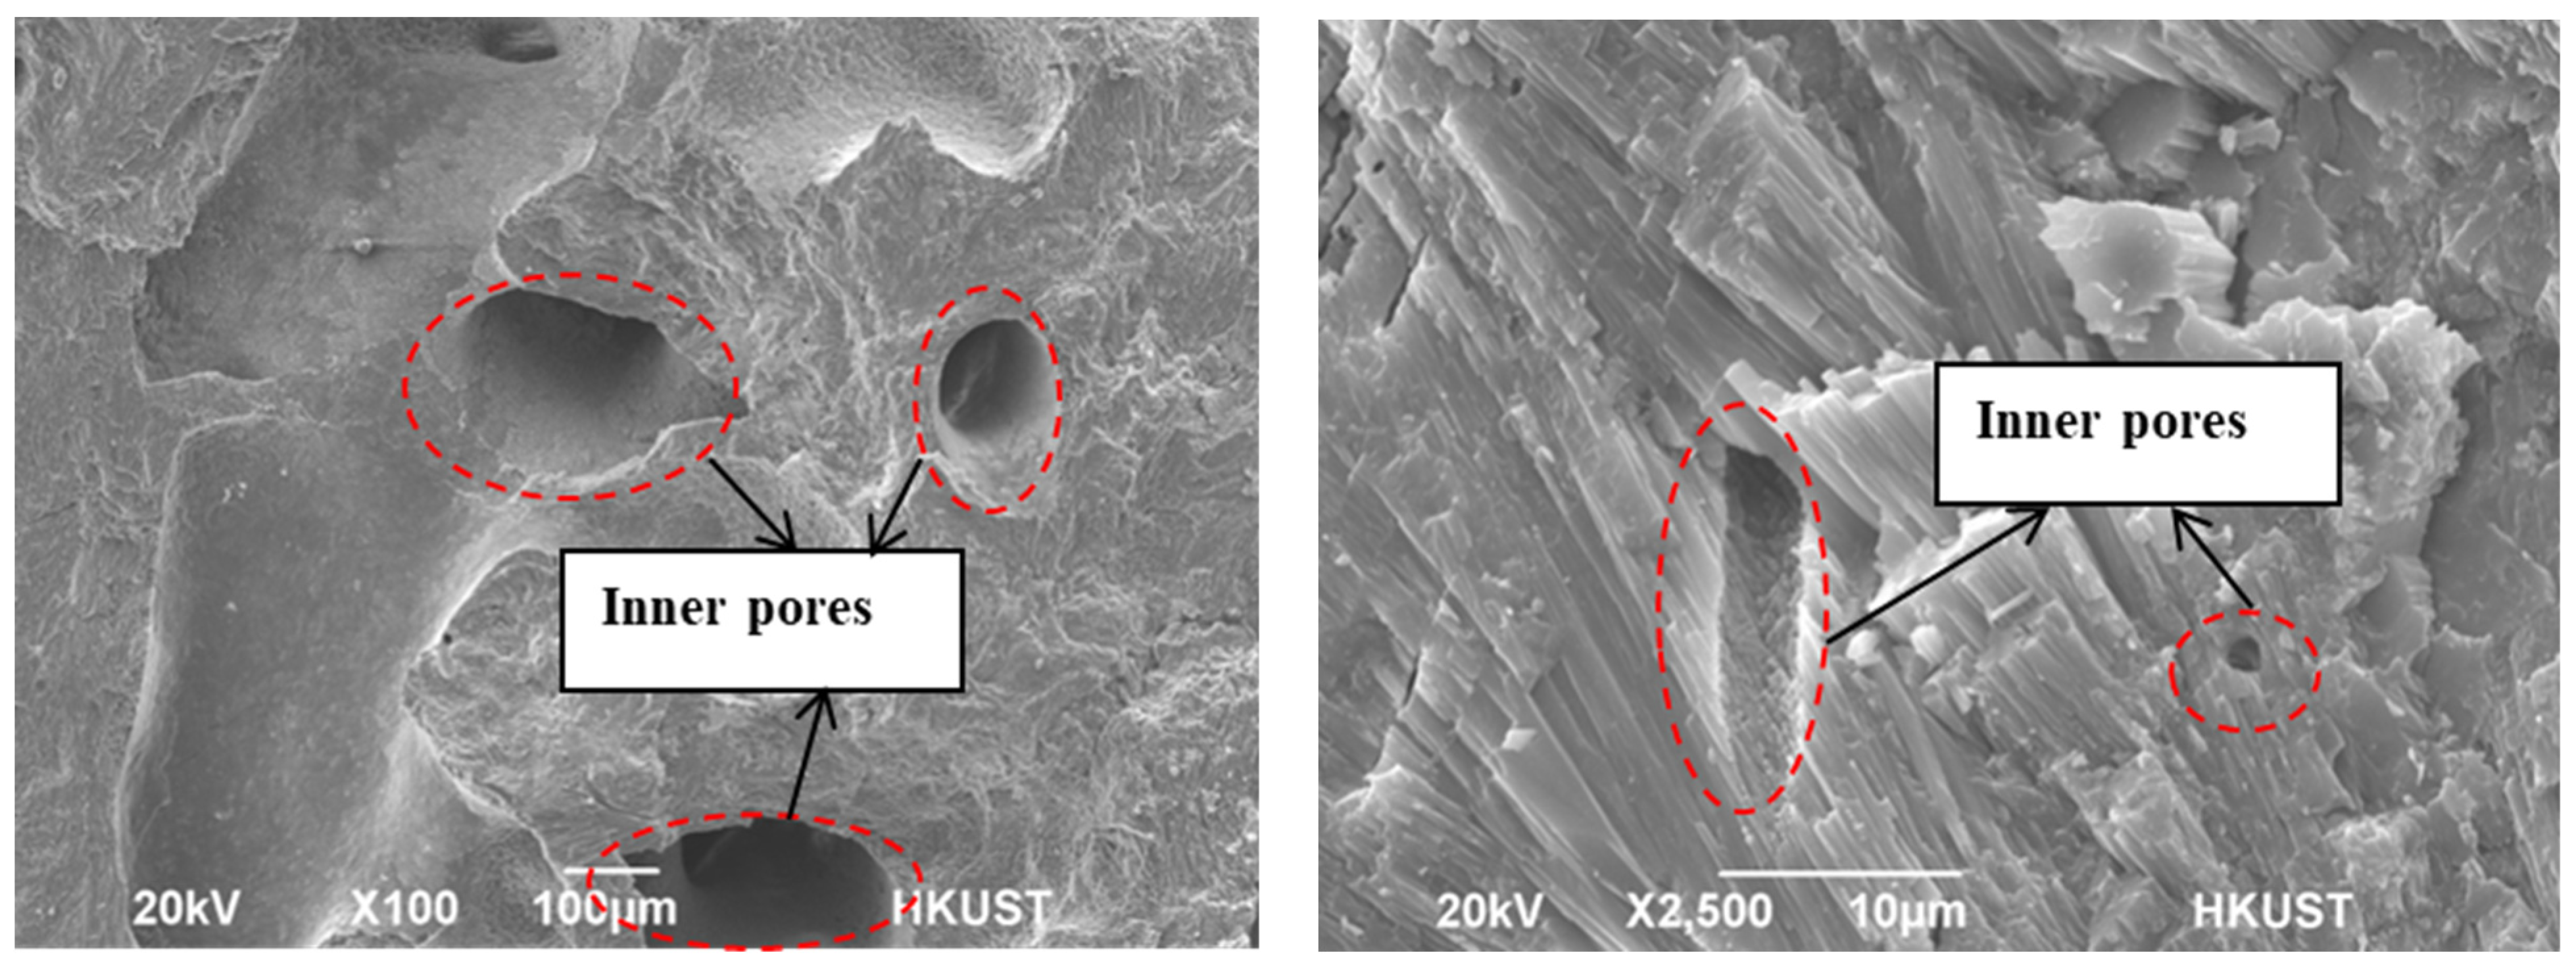
- The mineral composition of coral sand primarily consists of biogenic aragonite and high Mg calcite, with other components present in relatively small mass fractions. Coral sand is abundant in internal pores, which are typically rounded. The face pore structure of the grains is predominantly determined by the biogenic structure itself and is minimally influenced by the shape of the grains.
- (2)
- When the relative stress level is low (<400 kPa), the compression characteristics of coral sand with different initial pore ratios (e) are similar and basically independent of the initial pore ratio. However, at relatively high stress levels (>1600 kPa), specimens with different initial pore ratios yield first before entering the normal consolidation line NCL. Coral sand particles have less strength than terrestrial sand particles, and rhombic fragmentation of particles can occur at low stress levels. Despite this, coral sand still has high compressibility under high stress, emphasizing the need for attention to the design and construction of high-weight foundation elements in natural sedimentary reef sand sediments.
- (3)
- The coral sand direct shear stress–strain relationship is nearly hyperbolic and does not show obvious strain softening. The general trend of the stress–strain relationship curve remains consistent when the applied surrounding pressure in the triaxial test is below 400 kPa. Initially, the deviatoric stress increases rapidly and then decreases slowly after reaching the peak stress. As the surrounding pressure continues to rise, the axial strain required to reach the peak strength of the specimen increases, leading to a transition from strain softening to strain hardening.
- (4)
- The permeability coefficient of coral sand is smaller than that of conventional terrestrial sands of the same grain size range, mostly concentrated at 10−4 cm/s. The permeability coefficient of coral sand with the same grain gradation increases with the increase in the pore ratio and has a good linear correlation.
- (5)
- The strength, deformation, and permeability characteristics of coral sand blow-fill mixes result from a complex interaction of multiple factors, with the porosity of the specimen exerting the greatest influence on the strength, deformation, and permeability. However, further research is required to establish the impact of particle breakage in coral sand on the strength, deformation, and permeability characteristics of the material.
Author Contributions
Conceptualization, C.L. and D.Z.; Methodology, C.L.; Validation, C.L. and H.W.; Formal analysis, C.L.; Investigation, C.L.; Resources, H.W. and D.Z.; Data curation, C.L.; Supervision, M.S. and D.Z. All authors have read and agreed to the published version of the manuscript.
Funding
This work is supported by Guangdong Provincial Department of Science and Technology ((No. 2021ZT09G087) and the Guangdong Basic and Applied Basic Research Foundation of China (No. 2022A1515110443).
Institutional Review Board Statement
Not applicable.
Informed Consent Statement
Not applicable.
Data Availability Statement
The data presented in this study are available on request from the corresponding author.
Conflicts of Interest
The authors declare no conflict of interest.
References
- Li, L. Research on Basic Caracteristics of Coral Concrete. Ph.D. Thesis, Guangxi University, Nanning, China, 2012. [Google Scholar]
- Guo, C. Study on Engineering Properties of Coral Aggregate Concrete in South China Sea. Master’s Thesis, Southeast University, Nanjing, China, 2017. [Google Scholar]
- Wang, G.; Ye, Q.G.; Zha, J.J. Experimental study on mechanical behavior and particle crushing of coral sand-gravel fill. Chin. J. Geotech. Eng. 2018, 40, 802–810. [Google Scholar]
- Chen, Z.L.; Chen, T.Y.; Qu, J.M. A feasibility study of application of coral sand concrete. Ocean. Eng. 1991, 9, 67–80. [Google Scholar]
- Howdyshell, P.A. The Use of Coral as an Aggregate for Portland Cement Concrete Structures; Army Construction Engineering Research Laboratory: Champaign, IL, USA, 1974. [Google Scholar]
- Yodsudjai, W.; Otsuki, N.; Nishida, T.; Yamane, H. Study on strength and durability of concrete using low quality coarse aggregate from Circum-Pacific region. In Proceedings of the Fourth Regional Symposium on Infrastructure Development in Civil Engineering (RSID4), Bangkok, Thailand, 3–5 April 2003; pp. 1–10. [Google Scholar]
- Lade, P.V.; Liggio, C.D., Jr.; Nam, J. Strain rate, creep, and stress drop-creep experiments on crushed coral sand. J. Geotech. Geoenviron. Eng. 2009, 135, 941–953. [Google Scholar] [CrossRef]
- Lade, P.V.; Nam, J.; Liggio, C.D., Jr. Effects of particle crushing in stress drop-relaxation experiments on crushed coral sand. J. Geotech. Geoenviron. Eng. 2010, 136, 500–509. [Google Scholar] [CrossRef]
- Yamamuro, J.A.; Abrantes, A.E.; Lade, P.V. Effect of strain rate on the stress-strain behavior of sand. J. Geotech. Geoenviron. Eng. 2011, 137, 1169–1178. [Google Scholar] [CrossRef]
- Ehlert, R.A. Coral concrete at bikini atoll. Concr. Int. 1991, 13, 19–24. [Google Scholar]
- He, Y.X.; Dong, Z.L.; Yang, H.P.; Zhang, G.X.; Qiu, Q.C. Study of packing compaction performance of reclamation of coral sand (gravel) used in coastal engineering. Chin. Foreign Road 2010, 30, 34–37. (In Chinese) [Google Scholar]
- Wang, Y.Q.; Hong, Y.; Guo, Z.; Wang, L. Micro-and macro-mechanical behavior of crushable calcareous sand in South China Sea. Rock Soil Mech. 2018, 39, 199–215. [Google Scholar]
- Lü, C.W.; Wu, H.L.; Shi, M.L. Laboratory tests of cement stabilized & solidified coral reef and sand for use of highway pavement. J. Eng. Geol. 2019, 27, 1440–1447. [Google Scholar]
- Lü, C.W. The Studyon Pavement Performance of Cement-Emulsified Asphalt and Reef Sand Solidification. Master’s Thesis, Southeast University, Nanjing, China, 2016. [Google Scholar]
- Qian, C.J.; Li, Z.P.; Tan, F.L.; Shi, M. Experimental study on the strength characteristics of coral sand fillers. Highw. Transp. Technol. (Appl. Technol.) 2018, 14, 133–136. [Google Scholar]
- Mo, H.Y. Research on the Mechanics Characteristics of Calcareous Sand-Limestone Mixture. Master’s Thesis, Southeast University, Nanjing, China, 2015. [Google Scholar]
- Liu, H.W. Study and application of coral sand used ground backfill materials. West-China Explor. Eng. 1996, 8, 1–3. [Google Scholar]
- Wang, X.Z.; Wang, R.; Meng, Q.S.; Chen, J. Research on characteristics of coral reef calcareous rock in Nansha Islands. Chin. J. Rock Mech. Eng. 2008, 27, 2221–2226. [Google Scholar]
- Huang, W.J. Experimental Study of the Mechanism of Quartz Sand Particle Crushing under High Pressure Stress. Master’s Thesis, Wuhan University of Technology, Wuhan, China, 2007. [Google Scholar]
- JTG 3430-2020; Geotechnical Test Specification for Highway. Institute of Highway Research, Ministry of Transport: Beijing, China, 2020. (In Chinese)
- An, X.Y.; Wang, F.; Zuo, D.J.; Zhu, Q.L. Microstructural analysis of coral reef calcareous sand. J. Henan Univ. Sci. Technol. (Nat. Sci.) 2021, 6, 6–11. [Google Scholar]
- Zhang, J.M. Study on the Fundamental Mechanical Characteristics of Calcareous Sand and the Influence of Particle Breakage. Ph.D. Thesis, Institute of Rock & Soil Mechanics, Chinese Academy of Sciences, Beijing, China, 2004. [Google Scholar]
- Jiang, C.Y.; Ding, X.M.; Chen, X.S.; Fang, H.Q.; Zhang, Y. Laboratory study on geotechnical characteristics of marine coral clay. J. Cent. South Univ. 2022, 29, 572–581. [Google Scholar] [CrossRef]
- Yin, Z.Z.; Wang, B.T.; Yu, X.J.; Wang, Y.; Zhu, J.G.; Liu, H.L.; Shi, J.Y.; Qian, X.D.; Zhang, F.M. Principles of Geotechnical Engineering, 3rd ed.; China Water Conservancy and Hydropower Press: Beijing, China, 2007; pp. 45–80. [Google Scholar]
- Pestana, J.M.; Whittle, A.J. Compression model for cohesionless soils. Geotechnique 1995, 45, 611–631. [Google Scholar] [CrossRef]
- Coop, M.R. The mechanics of incremented carbonate sands. Geotechnique 1990, 40, 607–626. [Google Scholar] [CrossRef]
- Chai, W.; Long, C.L.; Kuang, D.M.; Chen, J.M.; Yan, C.P. Effect of direct shear shear rate on the strength and deformation characteristics of calcareous sand. Geotechnics 2019, 40, 359–366. [Google Scholar]
- Wang, Q.; Hou, H.Y.; Kang, X.R.; Li, T.X.; Jiang, M.M.; Zhou, A.Z. Strength and particle breakage of calcareous sand under direct shear test. Sci. Technol. Eng. 2022, 22, 6240–6247. [Google Scholar]
- Wang, X.; Zhu, C.Q.; Wang, X.Z.; Qin, Y. Study of dilatancy behaviors of calcareous soils in atriaxial test. Mar. Georesour. Geotechnol. 2019, 37, 1057–1070. [Google Scholar] [CrossRef]
- Qian, K.; Wang, Z.X.; Chen, J.W.; Liu, J.P. Experimental study on permeability of calcareous sand for islands in the South China Sea. Rock Soil Mech. 2017, 38, 1557–1572. [Google Scholar]
- Huo, Y.L. Experimental Study on the Permeability of Calcareous Sand and Its Influencing Factors. Master’s Thesis, Guilin University of Technology, Guiyang, China, 2021. [Google Scholar]
Figure 1.
Coral sand specimen with particle shape.

Figure 2.
Coral sand specimen grading curve.

Figure 3.
XRD results of coral sand samples.

Figure 4.
Calcite crystal types of coral sand particles under high magnification.

Figure 5.
Particle and surface structure characteristics of coral sand particles under high magnification.
Figure 5.
Particle and surface structure characteristics of coral sand particles under high magnification.

Figure 6.
One-dimensional compression curve of coral sand.

Figure 7.
One-dimensional compression unloading–reloading curve for coral sand.

Figure 8.
Stress–strain relationship for shear test.

Figure 9.
Shear strength versus vertical coral sand direct pressure curve.

Figure 10.
Normalized stress displacement curve for straight shear test.

Figure 11.
Stress–strain curves at different envelope pressures.

Figure 12.
Volumetric strain versus axial strain curve.

Figure 13.
Stress ratio versus strain curve under various pressures.

Figure 14.
Triaxial test coral sand strength envelope.

Figure 15.
Relationship between permeability coefficient and pore ratio.

Figure 16.
Permeability coefficient versus 1D compression.

Figure 17.
Three-dimensional plot of porosity, permeability coefficient, and one-dimensional compression.
Figure 17.
Three-dimensional plot of porosity, permeability coefficient, and one-dimensional compression.

Figure 18.
Relationship between strength, deformation, and permeability properties.


Table 1.
Basic physical parameters of coral sand.
| Sand Sample Name | Coral Sand | Quartz Sand [19] |
|---|---|---|
| emin | 0.96 | 0.7 |
| emax | 1.47 | 0.85 |
| D10/mm | 0.16 | 0.25 |
| D30/mm | 0.28 | 0.52 |
| D60/mm | 0.60 | 0.75 |
| Cu | 3.75 | 2.4 |
| Cc | 0.82 | 0.79 |
| Gs | 2.74 | 2.7 |
Table 2.
Coral sand chemical composition mass fraction (%).
| Oxide Chemistry | Mass Fraction (%) |
|---|---|
| Calcium oxide (CaO) | 47.10 |
| Magnesium oxide (MgO) | 2.48 |
| Strontium oxide (SrO) | 0.63 |
| Sulfur trioxide (SO3) | 0.47 |
| Silicon oxide (SiO2) | 0.13 |
| Aluminum oxide (Al2O3) | 0.06 |
| Phosphorus pentoxide (P2O5) | 0.06 |
| Potassium oxide (K2O) | 0.0082 |
| Cl | 0.026 |
| Burning loss | 48.7 |
Disclaimer/Publisher’s Note: The statements, opinions and data contained in all publications are solely those of the individual author(s) and contributor(s) and not of MDPI and/or the editor(s). MDPI and/or the editor(s) disclaim responsibility for any injury to people or property resulting from any ideas, methods, instructions or products referred to in the content. |
© 2024 by the authors. Licensee MDPI, Basel, Switzerland. This article is an open access article distributed under the terms and conditions of the Creative Commons Attribution (CC BY) license (https://creativecommons.org/licenses/by/4.0/).
Share and Cite
MDPI and ACS Style
Lv, C.; Wu, H.; Shi, M.; Zhang, D. Experimental Study on the Mechanical Strength, Deformation Behavior and Infiltration Characteristics of Coral Sand. Sustainability 2024, 16, 3479. https://doi.org/10.3390/su16083479
AMA Style
Lv C, Wu H, Shi M, Zhang D. Experimental Study on the Mechanical Strength, Deformation Behavior and Infiltration Characteristics of Coral Sand. Sustainability. 2024; 16(8):3479. https://doi.org/10.3390/su16083479
Chicago/Turabian StyleLv, Chenwei, Haoliang Wu, Minglei Shi, and Dingwen Zhang. 2024. "Experimental Study on the Mechanical Strength, Deformation Behavior and Infiltration Characteristics of Coral Sand" Sustainability 16, no. 8: 3479. https://doi.org/10.3390/su16083479
Note that from the first issue of 2016, this journal uses article numbers instead of page numbers. See further details here.