
Research on the Spatiotemporal Characteristics of the Coupling Coordination Relationship of the Energy–Food–Water System in the Xinjiang Subregion
School of Economics and Management, University of Chinese Academy of Sciences, Beijing 100190, China
*
Author to whom correspondence should be addressed.
Sustainability 2024, 16(8), 3491; https://doi.org/10.3390/su16083491
Submission received: 20 March 2024
/
Revised: 18 April 2024
/
Accepted: 19 April 2024
/
Published: 22 April 2024
(This article belongs to the Section Energy Sustainability)
Abstract
:In the Xinjiang region, the sustainable management of water resources, energy, and food is crucial for regional development. This study establishes a coupling evaluation index for energy–food–water (EFW) systems from the perspectives of supply, consumption, and efficiency. Using an integrated EFM-CDD-RDD-CCDM approach, an assessment of the coupling and coordination levels of the EFW systems in 14 cities within Xinjiang was conducted for the period of 2004 to 2020. Additionally, the method of obstacle degree identification was utilized to determine the main barriers affecting the EFW systems. Key findings included the following. (1) In terms of individual system coordination indices, the water resource systems exhibited overall higher coordination (ranging from 0.30 to 0.72) with comparatively minor spatial variability, while the energy (from 0.18 to 0.81) and food (from 0.12 to 0.83) systems showed greater temporal and spatial fluctuations. From 2004 to 2020, improvements were observed in the coordination of food and water resource systems, whereas a decline was noted in the coordination of the energy subsystem. (2) Prior to 2011, the coupling of food–water and energy–food systems showed an upward trend, whereas the energy–water coupling decreased annually by 2.62%, further highlighting the tensions between energy development and water resource constraints in Xinjiang. (3) The comprehensive coupling coordination index of the Xinjiang EFW systems ranged between 0.59 and 0.80; between 2004 and 2020, there was an oscillatory increase. From 2004 to 2016, the coupling and coordination degree across the municipalities generally improved, with the regions on the western side and southern slope of the Tianshan Mountains, the Altai Mountains, and the northwestern edge of the Junggar Basin exhibiting the highest levels, followed by the three prefectures in southern Xinjiang. (4) The EFW obstacle degree posed by the food systems in Xinjiang and its divisions showed a decreasing trend from 2004 to 2020, with the energy system identified as the main factor affecting the coupling and coordination degrees of the EFW systems (increasing by 44% to 52%). Therefore, it is imperative to accelerate the energy transition and optimization in the lead energy development and production areas of Xinjiang. This research provides a scientific basis for Xinjiang’s sustainable development strategies and highlights potential directions for the future optimization of resource management.
1. Introduction
Sustainable development has become a common goal for countries around the world. According to Manolis and Meramveliotakis [1,2], from the perspective of classical political economy, the key to sustainable development research lies in the impact of early development changes on current development characteristics and future development trends, the interrelatedness of natural and socio-economic-political factors, and the hierarchical division of sustainable levels. Energy, water resources, and food constitute the tripartite material foundation and necessary conditions for human society’s subsistence and sustained development. There are evident transmissive and restrictive relations among regional energy security, water, and food security. On the one hand, the regional environment is inevitably influenced by the level of regional economic and social development; the present capability for resource material transformation and the environmental state are often outcomes of prior regional socioeconomic progress. On the other hand, adjustments and integrations in the structure and modes of regional socioeconomic development can precipitate changes in resource exploitation and utilization, as well as environmental quality, thereby fostering developments conducive to ecological enhancement. The coupling and coordination relationship of energy–food–water (EFW) has become the most prominent issue in non-traditional security and the most important factor affecting regional sustainable development [3]. Examining the spatial and temporal variations, developmental levels, and main restricting factors of EFW coupling and coordination over a period of time from the perspective of regional sustainable development is not only a major scientific issue that needs to be addressed but also can provide an important scientific basis and reference value for policy making and adjustment of regional sustainable development [4].
China is currently undergoing a critical period of sustainable economic and social transformation. The demands and conflicts regarding energy, food, and water resources in various regions are constantly increasing. Hence, there is an urgent need to assess changes in coupling coordination and identify key influencing factors of EFW. This would provide path optimization and scientific control countermeasures for future sustainable development. Xinjiang, located in the northwest region of China, is the country’s largest province. It accounts for 20% to 40% of China’s natural gas, oil, and coal reserves. However, the amount of water resources in Xinjiang is less than 3% of the country’s total water resources and the distribution of water and available land resources is extremely uneven in space and time. In 2021, Xinjiang’s GDP ranked only 24th among the 31 provinces in China and the overall development level was very low. The spatial inequalities in energy–food–water resources have resulted in extremely unbalanced regional socio-economic development levels and modes. For example, the regions rich in energy reserves, such as Karamay City, Turpan Basin, Bazhou, Aksu, and Changji Prefecture, have a severe shortage of water resources. In contrast, the regions with relatively abundant water resources, such as Yili Prefecture, Bazhou, and Hotan, have limited land resources. The water–energy–food constraints and contradictions of high-quality development among regions are more prominent. Xinjiang is the most frontier area for China’s “Belt and Road” initiative to connect with Central Asia and Eurasia. It is also China’s most important energy storage base and food production base. Thus, the coordinated development of Xinjiang’s energy–food–water system has crucial implications for China’s future sustainable development [5]. Therefore, research on economic coordinated development should not only focus on the evolutionary laws within each subsystem and the interaction mechanisms. It should also conduct a comprehensive study of the three major elements of energy, food, and water in the whole system.
The study of the coupling coordination relationship of EFW has attracted many scholars’ attention [6,7,8]. Researchers have constructed an assessment model of the EFW system coupling coordination from different levels such as national, regional, and urban areas, based on the theory of coupling coordination [9,10,11,12]. They analyzed the spatiotemporal characteristics of EFW system coupling coordination in different regions [13,14] and carried out an analysis of the interrelationships between water, energy, and food production, as well as external environmental impacts [15,16], proposing policy recommendations for coordinated development among regions and sectors and cross-sectoral cooperation [17,18,19,20]. The comprehensive evaluation model, mainly based on the coupling coordination degree model (CCDM), has been one of the major methods for evaluating the EFW nexus system in recent years. This method selects corresponding characteristic indicators in different systems and assigns corresponding weights to the indicators based on various scientific methods. In this way, it evaluates the coordination and safety of the EFW nexus. This method can evaluate multiple indicators and units in a standardized and systematic manner. Therefore, it has been widely used in complex system studies [21,22,23]. In empirical research, Li et al. (2018) analyzed the security status of energy–food–water resources in six African countries along the Belt and Road initiative [24]. Mohammadpour et al. (2019) constructed EFW system security evaluation indicators based on the RAND Pardee method and quantitatively evaluated the EFW system security status in Ecuador, Peru, and Bolivia [25]. Xu et al. (2020) evaluated the coordinated development and sustainability of China’s EFW system by constructing a comprehensive index for such systems [26]. The above studies provide references for improving the coordination, security, and sustainability of EFW at the national and provincial scales.
Although previous studies have provided various analytical approaches and schemes for macroscopic perspectives on different regions, the internal and external relationships in the complex EFW resource systems in various regions still require further investigation. Furthermore, much research has focused on the coordination and coupling between EFW systems at the national or provincial levels [27,28]. There have been relatively few studies on the spatial heterogeneity and changes in coupling coordination of the sub-regional EFW resource systems with resource constraints and significantly varied resource endowments. Moreover, most of these studies lack balance in assessing the coordinated development levels of the dual systems of water, energy, and food. A sustainable development theory was the basis for constructing an EFW coupling coordination degree model from three levels in the past. These included subsystems within energy, food, and water resources; bilateral systems; and the entire system. The model considered the natural endowment of each system internally and external factors such as regional policies, environmental issues, and technologies. To comprehensively evaluate the coordinated development of the EFW system in Xinjiang, the entropy method (EM), coordination development degree model (CDDM), relative development degree model (RDDM), coupling coordination degree model (CCDM), and obstacle factor diagnostic model were adopted from a temporal perspective during the past 17 years (2005 to 2020). Moreover, from a spatial perspective, the development patterns and performance of EFW systems in various regions of Xinjiang were comparatively evaluated and analyzed. This provided an effective early warning to identify important factors that could disrupt the coordinated development of the system.
The present study makes two major innovations and contributions: (1) evaluation system innovation, in contrast to most existing studies that focus on either single systems or coupled systems, as this study constructs a relatively complete evaluation model on three levels, namely the single system, dual system, and entire system of energy, food, and water resources coupling relationships by integrating the coordination degree model (CDDM), relative development degree model (RDDM), and coupling coordination degree model (CCDM). This further enriches the theoretical framework of EFW coupling coordination evaluation. Furthermore, the main indicators affecting the EFW coupling coordination level in different cities of Xinjiang are determined by the obstacle factor diagnostic model. (2) Content innovation: the comprehensive evaluation model construction on EFW coupling coordination at the sub-regional level, analysis of spatiotemporal changes, and the major influencing factors of EFW coupling coordination level will help to broaden the determination and recognition of EFW coupling coordination relationships on a smaller scale, thus providing more accurate sustainable development strategies.
2. Research Area, Methods, and Data Sources
2.1. Overview of the Study Area
Xinjiang, located between 73°40′ E~96°18′ E and 34°25′ N~48°10′ N, comprises 14 prefecture-level administrative regions (Figure 1). Its vast territory is characterized by complex and diverse topography, with significant spatial and temporal variations in temperature and precipitation. The distribution of resources and conditions for energy, water, and food production are highly uneven. Xinjiang is a leader in the reserves of fossil fuels such as coal, oil, and natural gas, as well as clean and renewable energy sources like wind, solar, and biomass energy. Coal reserves in Xinjiang are estimated to be the largest in China and oil and gas reserves are projected to account for 40% of the national total, primarily distributed in the Turpan-Hami Basin, Karamay City, the southeastern part of the Junggar Basin and the Kubai area of Bazhou and Aksu. Predominantly, these resources are located in the plains and desert areas.
Xinjiang’s average annual water resources amount to 83.4 billion cubic meters, representing only 2.37% of the national total. The spatial distribution of water resources is extremely uneven: north Xinjiang is higher than south Xinjiang, west is higher than east, and mountains have more water than plains and deserts. In particular, areas with abundant coal and oil and gas resources are extremely water-deficient. Cultivated land in Xinjiang is mainly distributed on the alluvial plains along rivers. Owing to limited resources of water and soil and constrained by climatic conditions, the production cycle of crops is short. Over 95% of the food sowing area is planted with wheat and corn. Despite the rich resources of energy and land, Xinjiang’s socioeconomic development has been slow and highly uneven at the sub-provincial level. The conflict between resources, environment, and high-quality development has become a major practical issue that needs to be resolved to achieve high-quality development. As a core area of the “Belt and Road” initiative and a national energy base, the coordinated development of energy–food–water resources has great significance to Xinjiang, other cities in Northwest China, and the sustainable development of countries along the “Belt and Road”.
2.2. Evaluation Model of the EFW System Coupling Coordination Relationship
2.2.1. Evaluation Indicator System for the Coupling and Coordination Relationship of the EFW System
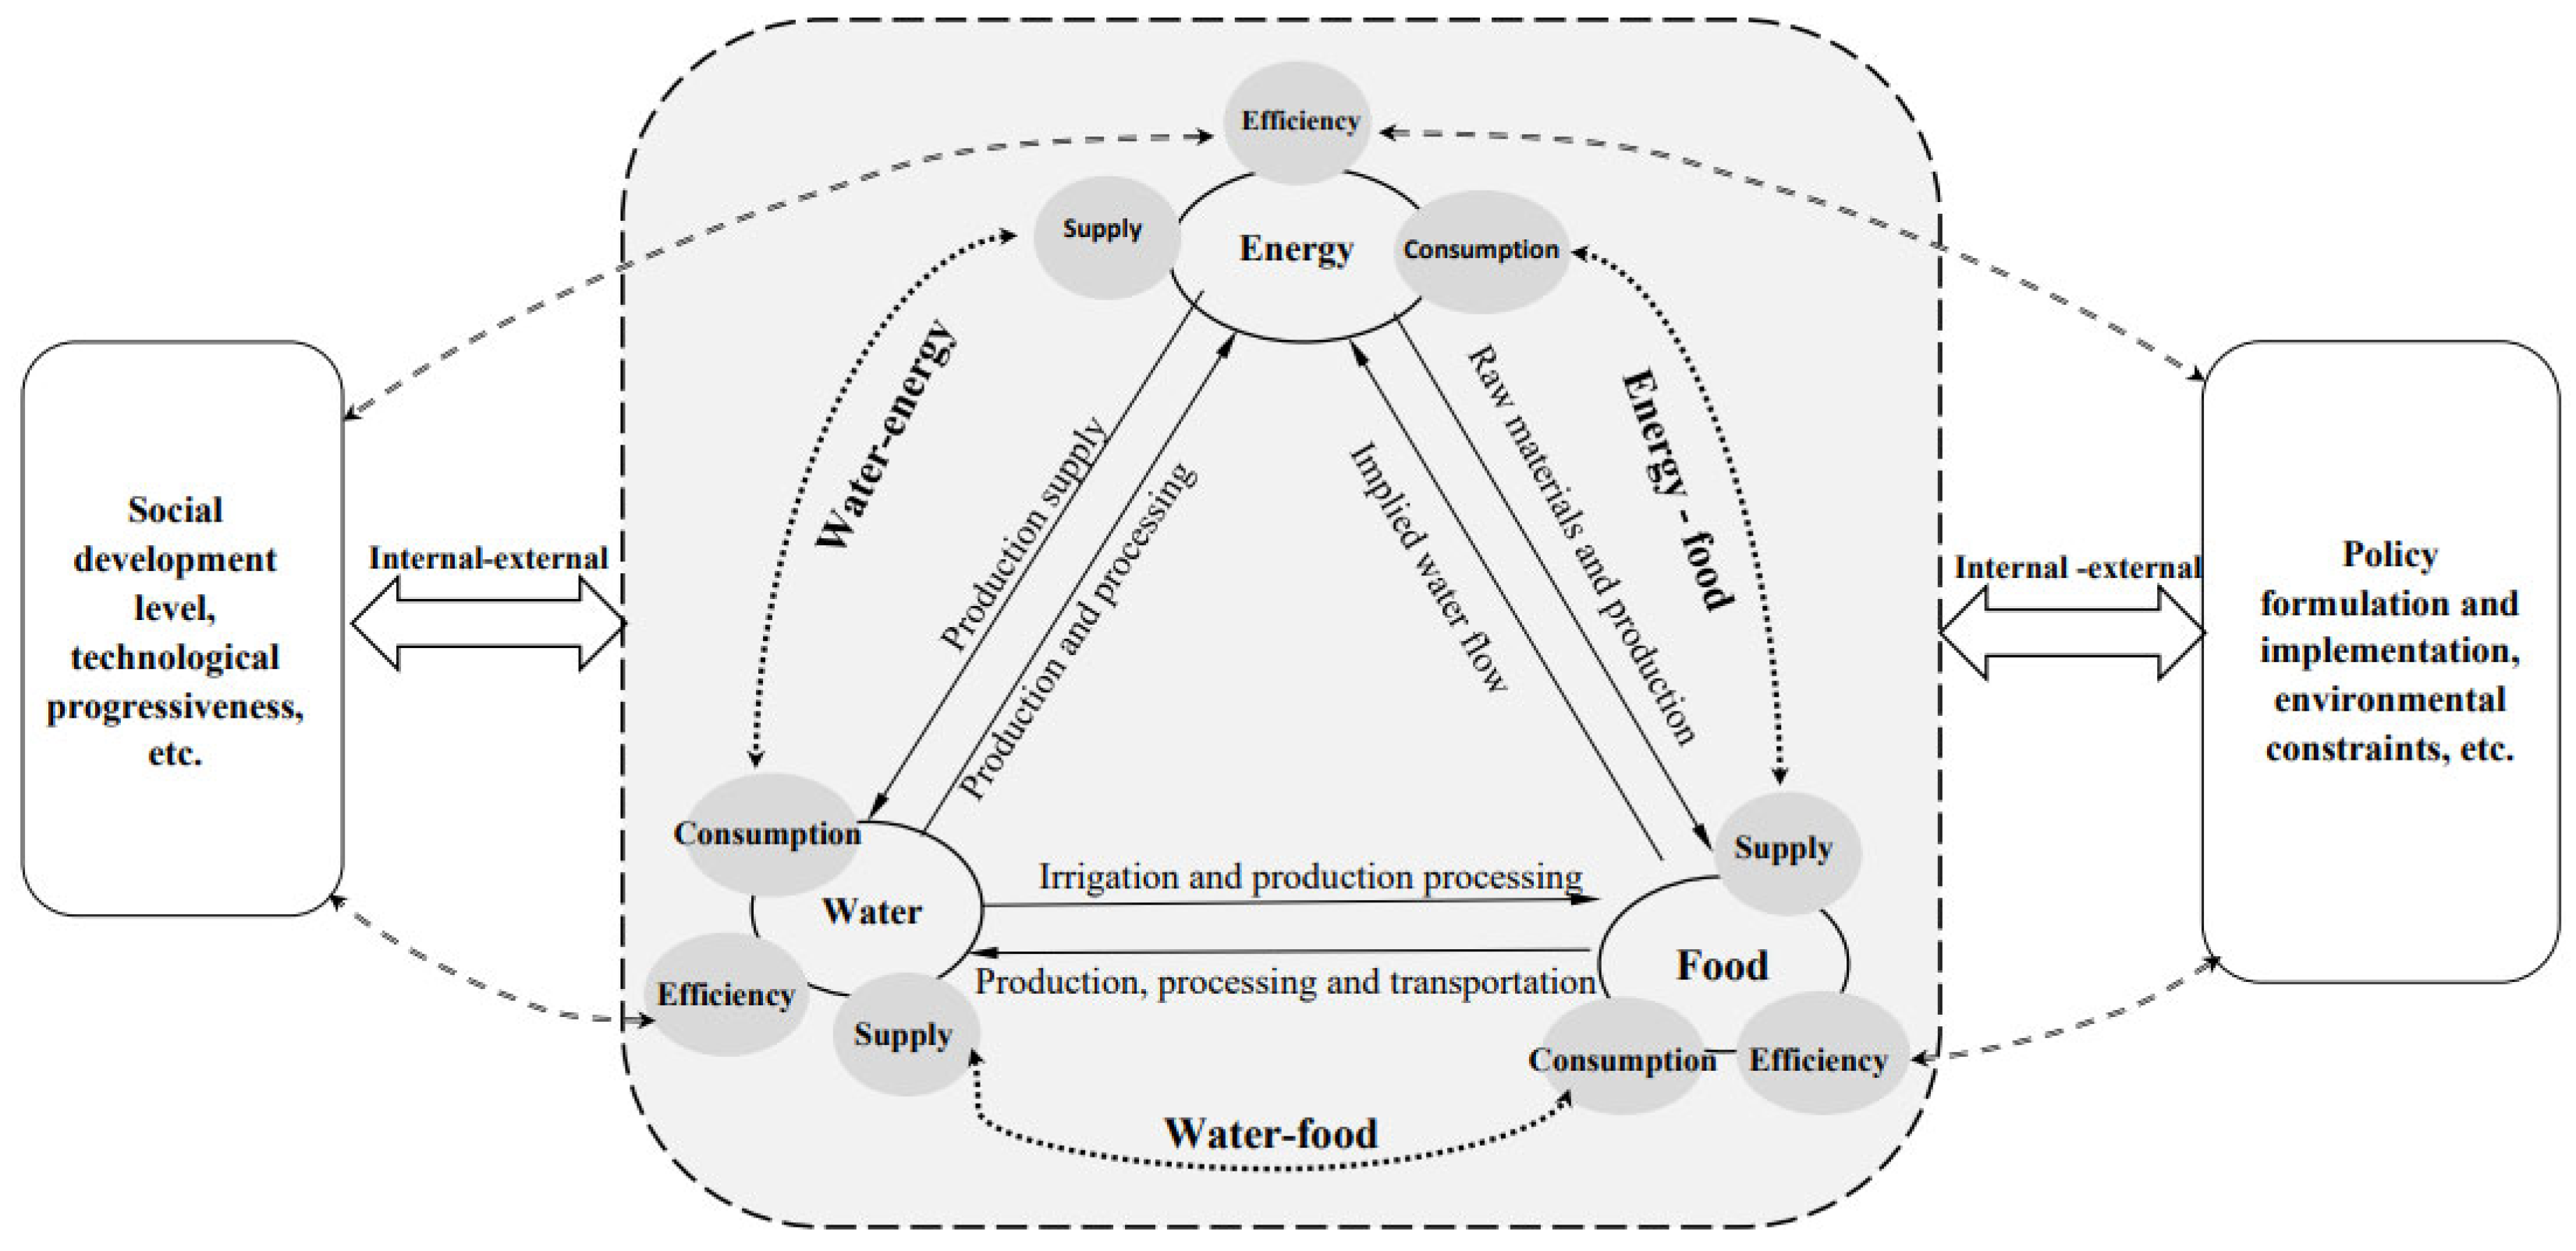
The essence of the coordinated development of the EFW coupling system lies in the degree of coordination among the internal and external interactions and feedback processes. This coordination occurs within and between the systems, under specific resource and environmental constraints during a certain period (Figure 2). Firstly, the supply capacity of resources such as energy, food, and water within a single system serves as the primary indicator of resource abundance. This often determines the system’s inherent characteristics and reflects the coordination of resource development. Secondly, inter-system interactions and influences, produced through raw material supply, production processing, transportation, and consumption, form interrelated connections that are indicative of the system’s relative developmental level. Implementation inefficiency in each system arises from a combination of internal and external factors, which are significantly influenced by regional policy formulation and implementation, constraints from environmental factors and social development levels, as well as the degree of technological advancement. It determines the overall level of the coupling coordination in the energy–food–water resources system, while openness to external environments and systems remains a prerequisite for coordinated and sustainable development throughout the system.
Consequently, evaluation indices for water resources, energy, and food subsystems can be constructed from the perspectives of supply, consumption, and efficiency. The supply indices reflect the scarcity and intrinsic characteristics of the resources within the subsystems, while the consumption indices denote the characteristics of resource flow and usage both within and among the subsystems. Efficiency indices, on the other hand, reveal the level of resource utilization’s efficiency and benefits, both inter-systemically and in the face of external factors. This set of indices facilitates a more intuitive and convenient measurement of the coupling degree between the energy, food, and water resource systems and provides references for the optimization and regulation of the entire system. In the selection of specific indices, each index should initially possess universality and accessibility, allowing for quantification through statistical or industry data, followed by a certain degree of discretion based on the region under study. Drawing on the relevant literature [29,30,31], this study selected 31 specific evaluation indices across three aspects: supply levels, consumption types, and usage efficiency of energy, water, and food (Table 1), demonstrating considerable universality and portability for each index.
The primary data utilized in this study were derived from the “Xinjiang Statistical Yearbook”, the “Xinjiang Water Resources Bulletin”, the “China Energy Statistical Yearbook”, and the statistical bulletins of national economic and social development from 14 prefecture-level cities, spanning the years 2004 to 2020. Instances of missing data were addressed by employing extrapolation techniques to obtain the necessary figures.
2.2.2. Calculation of Hierarchical Indicator Weights Based on Information Entropy
The entropy weight method evaluates the level of dispersion among index values to calculate the weights of indices, representing a more objective and precise approach to comprehensive weight assessment [32]. This technique was employed to carry out both vertical and horizontal weight analysis on the evaluation indices, aiming to minimize the impact of subjective factors. The principal steps involved are as follows:
Step 1: In order to address inconsistencies in data units and to ensure uniformity and comparability of data, it is imperative to first standardize the evaluation index data for each year and region. The method is as follows:
where j represent the year, region, and index number, respectively. is the value of the -th indicator for the -th area in the -th year, is the maximum value of the indicator , and is the minimum value of the indicator .
Step 2: Calculate the respective weights of various indicators across different years and regions.
where is the weight of indicator j in year of region is the total number of years (from 2004 to 2020, a total of 19 years), is the total number of regions (14 cities in total), and n is the total number of indicators ( = 31).
Step 3: Calculate the information entropy of each indicator.
where is the information entropy of indicator j, with ej > 0. If = 0, then define = 0.
Step 4: Calculate the weights of each indicator.
where is the entropy method weight of indicator j. After the above steps, the entropy method weights of 31 indicators were calculated, as shown in Table 1.
2.2.3. EFW System Coupling Coordination Evaluation Model
In accordance with the internal elements and their interfeedback relationships within the EFW coupling system, employing theories of systems science and methodologies of correlation, and referencing pertinent studies [29,30,31], consideration is given across three stratums: the single system, the dual system, and the systemic synthesis. Consequently, evaluative models are constructed for the co-development dispatch (CDD) of the EFW single system, the relative development degree (RDD) for the dual system, and the comprehensive coupling coordination degree (CDD) for the systemic synthesis.
- (1)
- The coordinated development degree model for a single system (CDDM)
Utilize a composite index of energy, water resources, and food systems to measure the coordinated development of each individual system, with the calculation method as follows:
where is the coordinated development index of the -th region and the -th subsystem in the -th year; is the weight of the -th indicator; and is the standard value of the j-th indicator in the i-th region in the first year, with a value ranging from 0 to 1. Referring to the relevant literature [29,30,31], the EFW single system coordinated development index is divided into six types (Table 2).
- (2)
- Relative Development Degree Model (RDDM)
The coordination of development between two systems has been illuminated by researchers through the proposition of the relative development degree model, which serves to reflect the relative levels of development between the two systems [33,34]. The methodology involves
where is the comparative coefficient of the coupling development level between the k-th single system in the i-th region of the t-th year and the h-th single system; is the coordinated development index of the i-th region and k-th subsystem in year t; and is the relative development index of the i-th region and the h-th subsystem in year t. In this study, the relative development indices of water–energy, water-food, and energy–food were used to analyze the relative development relationships among the three dual systems. The relative development level of the dual systems was classified into six levels (Table 3) [29].
- (3)
- Coupling Coordination Degree Model (CCDM)
The CCDM model has been widely used for analyzing the coupling coordination relationships of multiple systems, particularly for exploring and evaluating the coupling coordination relationships between resource systems and socio-economic or ecological systems. The method and steps for analyzing the overall coupling coordination degree of the system are based on the calculation of the coupling degree and coordination degree of each subsystem. These include
Step 1: Calculate the coupling degree of the system.
where is the coupling degree of the EFW system in the i-th region of the year, with a value of [0,1]. The larger the C, the better the coupling state of the three systems. The smaller the C, the worse the coupling state of the three systems, and these systems will tend toward disorderly development. k is 3, representing water resources, energy, and food systems, respectively.
Step 2: Calculate the comprehensive co scheduling of the system.
where is the comprehensive coordination index of the EFW system in the nth region of the n-th year and is the coordinated development index of the i-th region and k-th system in year is the weight of the k-th system.
In order to objectively determine the influence of each system, the entropy additivity principle is applied to determine the weights of water resources, energy, and food systems. The weight values of each system are determined by comparing the variation coefficient of each index to the total sum value using the coefficient of variation A of the next level index. The weight value of each system is obtained by dividing the variation coefficient of a single system by the total sum value. The weight values of each single system are
where is the sum of the coefficient of variation of the k-th system, calculate , , .
2.2.4. Obstacle Factor Diagnostic Model
Barrier factors refer to primary factors reflecting the restrictions on the coupling coordination degree of the EFW system, which are mainly determined by calculating the negative impact intensity of each specific index on the entire system. Therefore, this study uses the barrier factor model to analyze and evaluate the barrier factors that affect the coupling coordination degree of the EFW system in Xinjiang. The specific methods are as follows [35]:
where is the obstacle level of the second evaluation indicator, is the deviation of indicator j is the normalized standard value of indicator j, is the weight of indicator j, and is the age.
The formula for calculating the barrier degree of a single system factor is as follows:
where is the obstacle level of the second subsystem, B is the indicator data of the second subsystem, is the obstacle level of subsystem , and is the indicator data of subsystem .
3. Results and Analysis
3.1. Spatiotemporal Characteristics of the Single-System Resource Coordination Degree in Xinjiang Subregions
3.1.1. Water Resource Subsystem
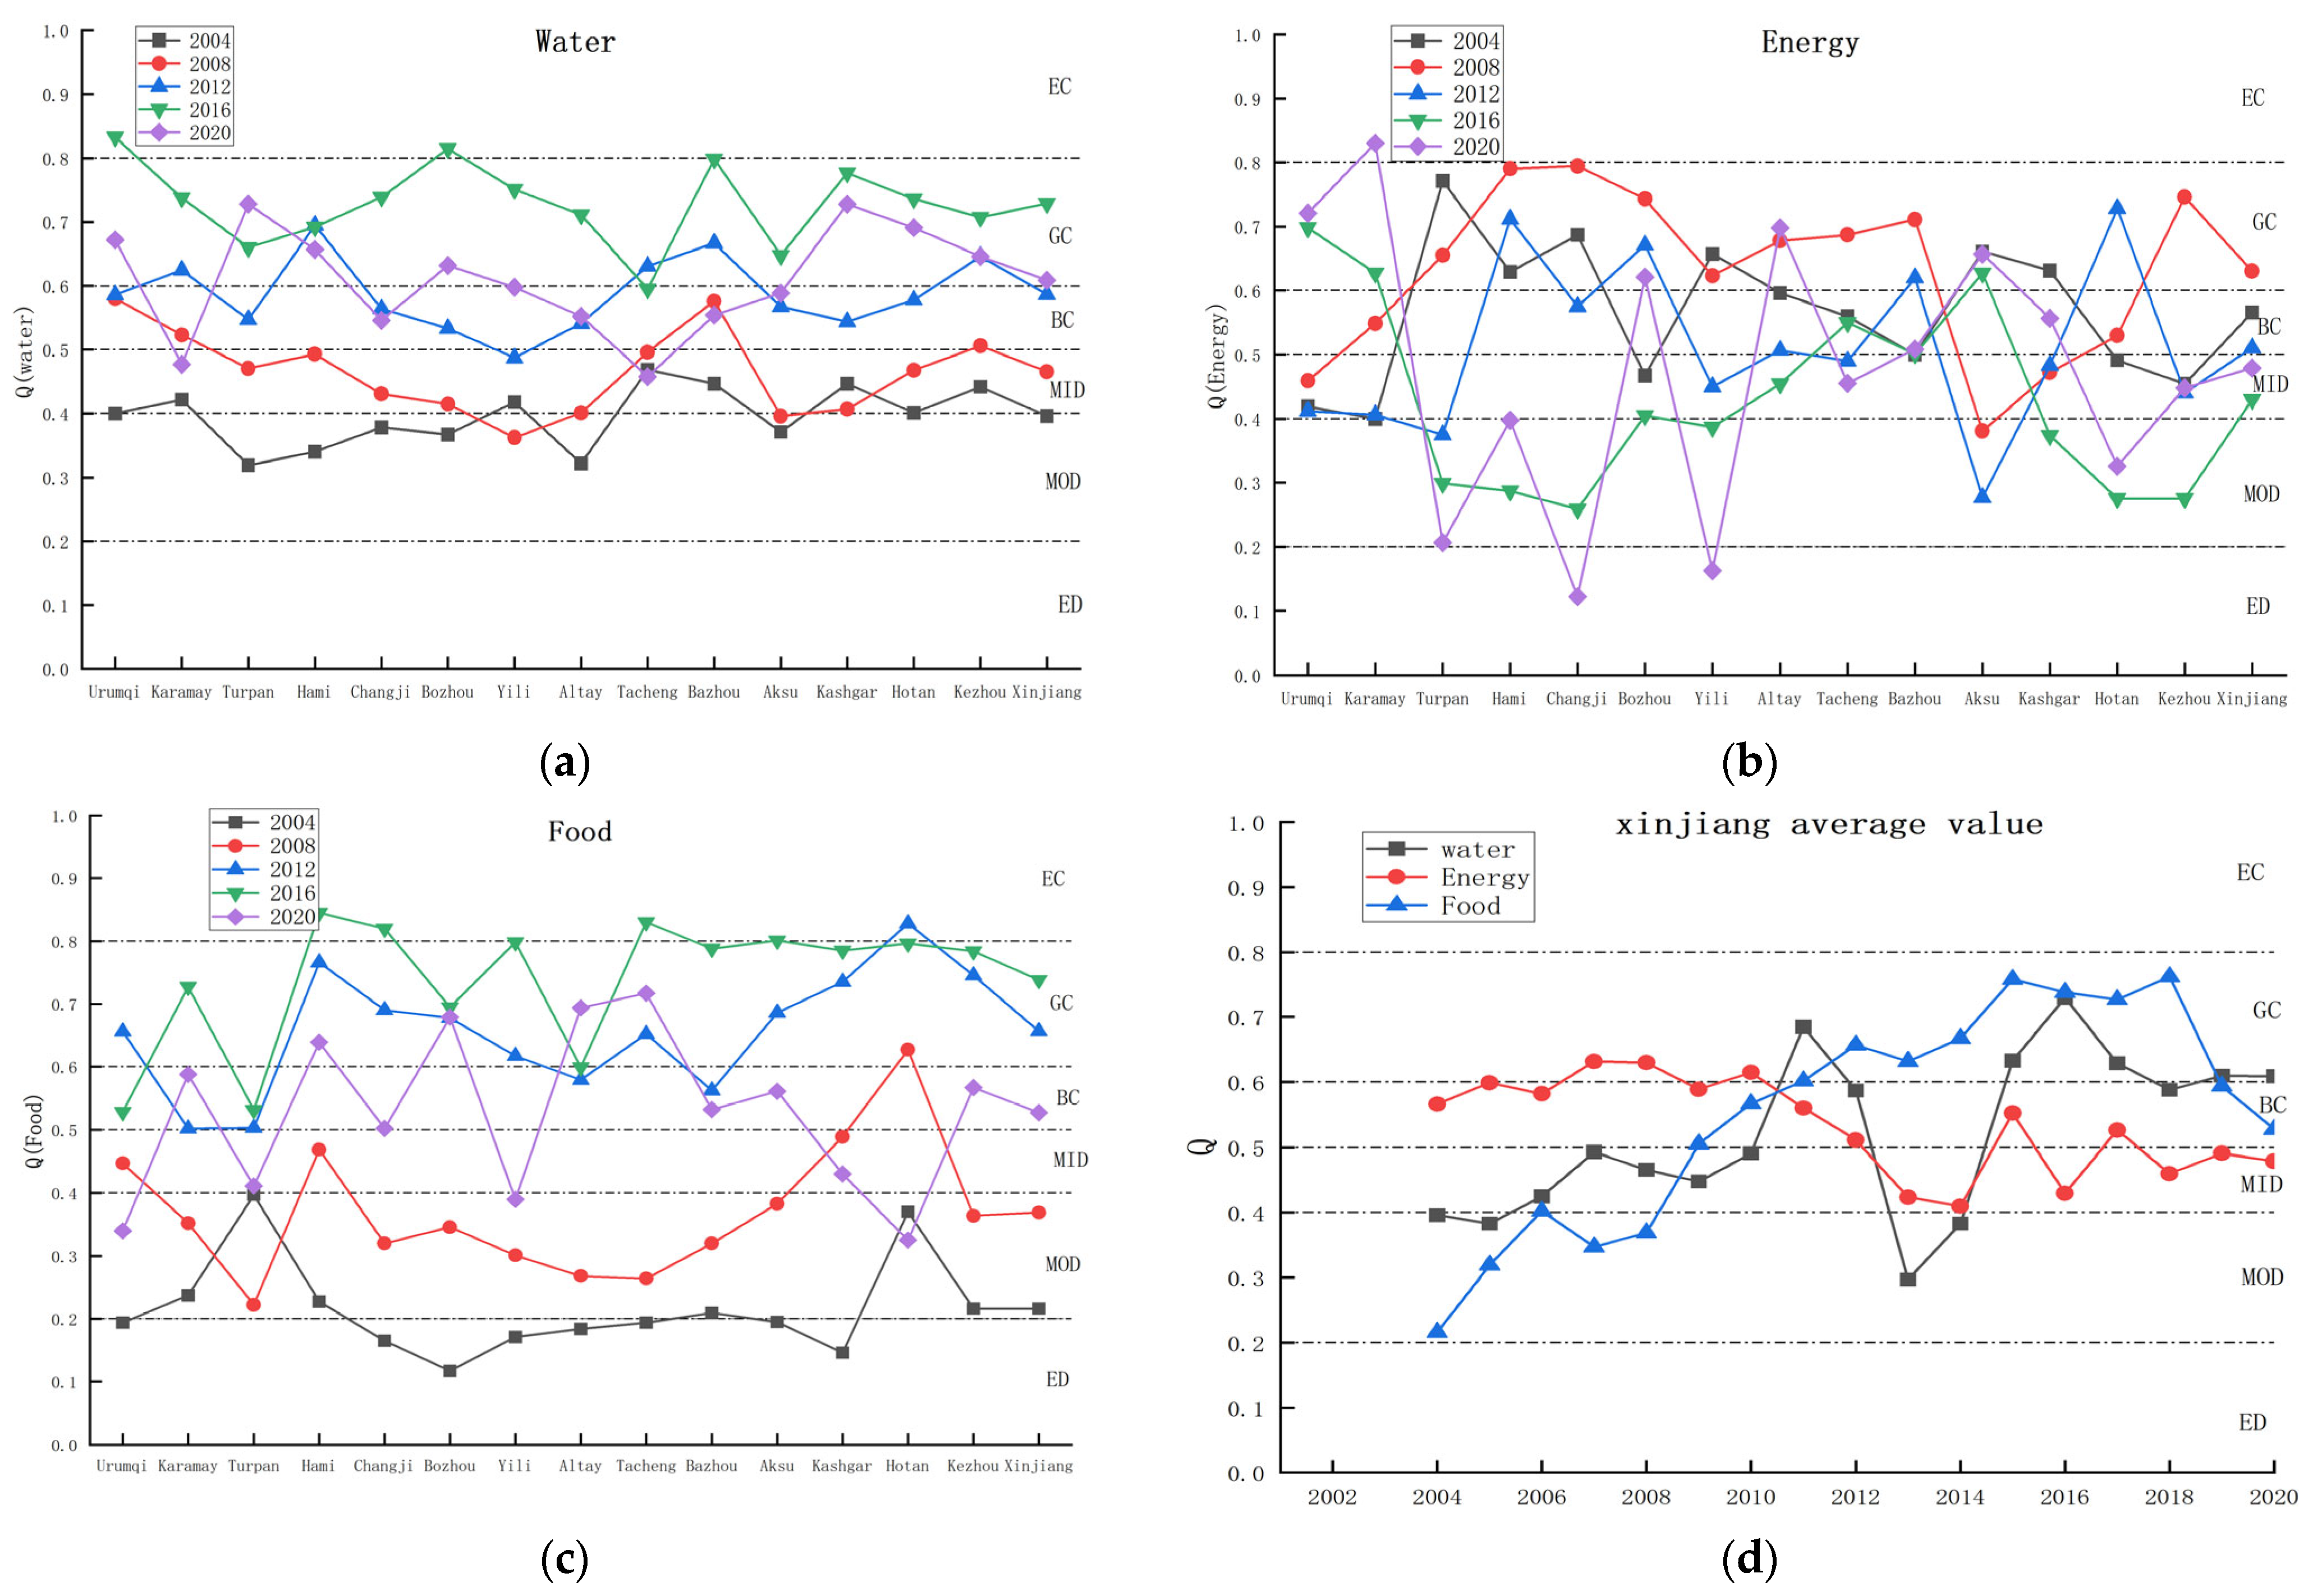
Between 2004 and 2020, the coordinated index of the water resources system in Xinjiang’s subregions ranged from 0.30 to 0.85 (Figure 3a). Except for Urumqi, Karamay, and Bazhou, the water subsystems of other cities were in a state of moderate or mild imbalance (ranging from 0.30 to 0.50) from 2004 to 2008. In 2012, with the exception of the Yili region, all other cities achieved a state of basic or good coordination. In 2016, except for Urumqi and Bozhou reaching a state of superior coordination (>0.8), Tacheng was outside the state of basic coordination but other cities were in a state of good coordination (from 0.6 to 0.80). Compared with 2016, in 2020, except for the increase in the coordination of Turpan, the decreases in the coordination of water resource systems were not significant in Hami in eastern Xinjiang, Aksu, Hotan, and Kashgar in southern Xinjiang, and other cities and water resource systems in northern Xinjiang such as Bazhou and Karamay. In terms of annual change, the coordinated index of the water resources system in Xinjiang showed an increasing trend from 2004 to 2016 but a decreasing trend from 2016 to 2020. From a spatial perspective, the coordination of the water resource systems in Urumqi, Bozhou, Bazhou, and Kashgar was relatively high each year, while the coordination of Karamay, Altay, and Changji was relatively low. Overall, the level of coordinated development of the water resource systems in each city improved after 2012. Generally, the coordination of the water resource subsystems has been relatively high since 2010 and the spatial differentiation is relatively low. The availability of water resources has a great influence on the coordination degree of water resources in various cities.
3.1.2. Energy Subsystem
The range of variation in the coordination index of the energy system is between 0.18 and 0.81, with more significant temporal and spatial differences (Figure 3b). Relatively speaking, there was little spatial difference in the energy systems of each city in 2004 and 2012 and they were in a state of mild discordance, basic coordination, and good coordination (from 0.4 to 0.7). The situation in 2008 was basically between 0.4 and 0.7 but the spatial changes were more significant, with Hami City, Changji, Bozhou, Yili, Tacheng, Altay, Bazhou, and Karamay at the top. The spatial differences in the energy system further increased from 2016 to 2020. In 2020, Changji Prefecture, Yili Prefecture, and Turpan were in a state of extreme lack of coordination (<0.2) but Urumqi reached a state of superior coordination. The development index of the energy subsystems in Urumqi, Karamay, and Aksu regions had undergone significant changes before and after 2016. Before 2016, they were basically in a state of mild imbalance, gradually reaching a state of good coordination after 2016, while the Aksu region had improved from basic coordination to good coordination. Contrarily, the situation in Hami and Changji Prefectures was the opposite. The latter gradually decreased from good coordination before 2016 to moderate imbalance and reached a state of severe imbalance in 2020, while Hami mainly dropped from good coordination to basic coordination.
3.1.3. Food Subsystem
The coordination index of the food system across various cities in Xinjiang ranged from 0.12 to 0.83 (Figure 3c). Similar to the water resource system, there was an overall improvement from 2004 to 2016, followed by a decrease in 2020, yet the performance was still better than that observed before 2008, with relatively minor spatial disparities. Prior to 2010, the comprehensive development index of the food system in all Xinjiang cities was generally low, primarily situated at a moderate level of imbalance. Specifically, in 2004, with the exception of Turpan and Hotan, the food systems were in a state of extreme to moderate discordance (from 0.1 to 0.4); except for the Hotan region surpassing 0.60 and achieving basic coordination in 2008, other areas were between moderate and mild discordance. From 2012 to 2016, all cities were at or above basic coordination levels; notably, in 2016, aside from Urumqi and Turpan, the rest of the cities reached levels of good to superior coordination. In 2020, the spatial variation in the coordination degree of the food system among different cities was more significant than in other years, ranging from 0.3 to 0.7, including distributions from moderate and mild discordance to basic and good coordination; overall, between 2004 and 2016, the coordination level of the food system in cities across Xinjiang exhibited a significant upward trend.
Among the three systems depicted in Figure 3d, prior to 2011, the energy system demonstrated greater coordination compared to the water and food systems, which experienced moderate to mild discoordination. In contrast, the energy system was observed to be in a state ranging from basic to good coordination. However, post-2011, there was a general decline in the coordination of the energy system to levels of mild discoordination and basic coordination. The food system achieved good coordination between 2012 and 2018 but regressed to basic coordination by 2020. The water resource system saw a rapid decline between 2011 and 2013, particularly in 2013 and 2014, where it reached moderate discoordination but it swiftly improved to good coordination after 2015, maintaining around 0.6 from 2018 to 2020. Overall, from 2004 to 2020, there was a trend of improvement in the coordination levels of both the food and water systems, which by 2020 had increased to 1.54 and 2.44 times their 2004 levels, respectively, with average annual growth rates of 3.16% and 8.47%. Contrastingly, the coordination level of the energy subsystem experienced a decline, with an average annual reduction of 0.9%.
3.2. Spatiotemporal Characteristics of the Dual System Resource Coupling Degree in the Xinjiang Subregion
Given the indispensable role of water and energy resources in food production and considering that water is a fundamental prerequisite for energy generation, the computational framework for dual system coupling in this subregion employs the ratio of the coordinated development index (CDI) between the energy–water, food–water, and food–energy subsystems as indicators of the coupling coordination degree for the water–energy, water-food, and food–energy dual systems, respectively. A higher value suggests that the water resources or energy can sustain a greater capacity for food and energy production, indicating a higher degree of coupling between the subsystems. The spatiotemporal distribution of the dual system resource coupling degree in the Xinjiang subregion is illustrated in Figure 4.
3.2.1. Energy–Water Dual System
From the perspective of the impact of water resources on the coupled carrying capacity of energy systems (Figure 4a), from 2004 to 2020, the water resource carrying capacity of energy systems in most areas of Xinjiang showed a downward trend. Turpan achieved a high level of coupling (greater than 2.0) in 2004. In the same year, Changji, Altay, Aksu, and other regions were in a moderately coupled state (from 1.6 to 2.0), followed closely by Changji, Bozhou, Yili, and other regions in 2006. Between 2012 and 2016, the characteristics of most regions were moderate to mild decoupling, with reduced spatial differences. By 2020, in addition to the moderate coupling in Karamay, the dual systems of Turpan, Changji, and Yili also reached the extreme coupling level, further intensifying the spatial differentiation. This indicates significant spatial changes in the energy–water dual system in the Xinjiang sub-region. In Urumqi, Karamay, Turpan, Hami, Changji, and other cities with high energy endowments and concentrated human socio-economic activities, under the condition of increasing water resource constraints and energy development intensity, the degree of energy–water coupling decreases slightly, highlighting the increasingly strengthened role of water resources in restricting energy development. Simultaneously, the degree of energy–water coupling in southern Xinjiang and regions such as Bozhou, Tacheng, and Altay has relatively stable changes and these areas exhibit a relatively high carrying capacity of water resources for energy development.
3.2.2. Food–Water Dual System
The coupling degree between the food–water dual systems in the subregions of Xinjiang ranged between 0.37 and 1.60 (Figure 4b), with all areas in each year falling below the moderate coupling level. Moreover, few regions reached basic coupling (from 1.2 to 1.6) in any given year. Notably, Tacheng and Karamay; Tacheng, Aksu, and Hami; and Changji, and Bozhou, Yili, Kashgar, and Hotan all managed to achieve basic coordination in 2020, 2016, and 2012, respectively. Apart from these instances, the remaining years and areas were characterized by mild uncoupling or lower states. Except for Turpan, which achieved basic coordination (1.21) in 2004, the food–water coupling degree in other areas was below that of other years. From 2004 to 2016, there was a gradual improvement in the food–water coupling degree across Xinjiang, with 2020 being essentially similar to 2016 but with more pronounced spatial variations. Overall, the Tacheng area exhibited the highest food–water dual system coupling degree in Xinjiang’s subregions, followed by the Altay area, the city of Karamay, and the Aksu area, all of which demonstrated a trend of improvement, albeit with a slight decline in 2016. Rich in water and land resources, northern Xinjiang’s Yili and Bazhou’s food–water system coupling degrees were not high, possibly owing to elevated agricultural water usage and low efficiency.
3.2.3. Food–Energy Dual System
As observed in Figure 4c, the food–energy dual system coupling degree across various cities in Xinjiang has shown gradual improvement over the years. Between 2016 and 2020, Changji Prefecture and Yili, along with Hami, Hotan, Kizilsu, and Kashgar in 2016, and the Aksu District in 2012, all exceeded a coupling degree of 2.0, achieving a state of high coupling. From 2004 to 2008, the majority of regions were characterized by either extreme uncoupling or moderate uncoupling levels. By 2012, regions primarily fell within the range of mild uncoupling to basic coupling, with minimal spatial variation observed from 2004 to 2012. The food–energy coupling degree in 2016 generally surpassed that of previous years, experiencing a slight decline in 2020; however, the overall change remained minimal. Notably, the spatial disparities significantly increased between 2016 and 2020. Spatially, in recent years, the food–energy coupling degree in northern Xinjiang (excluding Urumqi and Karamay) and southern Xinjiang has been higher compared to the eastern Xinjiang region, with four prefecture-level cities, highly constrained by land resources, recording the lowest food–energy coupling degrees.
By examining the interannual variation in the regional average values (Figure 4d), it is apparent that changes in the dual system characteristics occurred from around 2004 to 2011. Prior to 2011, the coupling degree of Xinjiang’s energy–water dual system (from 1.2 to 1.6) was distinctly higher than that of the food–water (from 0.5 to 1.2) and energy–food systems (from 0.4 to 1.15), with the food–energy coupling degree being the lowest. The food–water and energy–food dual systems demonstrated an annual increasing trend, whereas the energy–water system’s coupling degree declined annually. The year 2014 witnessed considerable improvement in all dual systems’ coupling degrees, with peak values typically reached during the 2014 to 2015 period, along with a leap in coupling grade levels. Subsequently, the coupling degrees of each dual system began to decline annually. From 2011 to 2020, the food–energy coupling degree fluctuated between basic and moderate coupling, with the energy–food system predominantly ranging between mild uncoupling and basic coupling. The energy–water system experienced a further decline to a moderate-to-mild uncoupling level. Compared to pre-2011 and post-2011, the food–energy and food–water systems showed a general trend of improvement. By 2020, their coupling degrees had increased by 3.6-fold and 1.6-fold, respectively, from those in 2004, with annual enhancement rates of 15.32% and 3.57%. However, by 2020, the coupling degree of the energy–water system had decreased, being only 0.55 times that of 2004, with an average annual reduction of 2.62%, further highlighting the pronounced conflict between water resource constraints and energy development in Xinjiang.
3.3. Analysis of Spatiotemporal Characteristics and Main Obstacle Factors of the Coupling Coordination Degree of the EFW System in the Xinjiang Subregion
3.3.1. Spatiotemporal Characteristics
The average comprehensive coupling coordination index of the EFW systems in Xinjiang fluctuated between 0.59 and 0.80 annually (Table 5), generally residing at levels ranging from basic coupling coordination to moderate coupling coordination. The system’s coupling coordination degree surpassed 0.7 between the years 2011 to 2013 and 2015 to 2020, attaining a state of moderate coupling coordination. This indicates a higher level of both coupling degree and coordination level, suggesting that the coupling coordination of the Xinjiang EFW system has experienced an oscillatory rise.
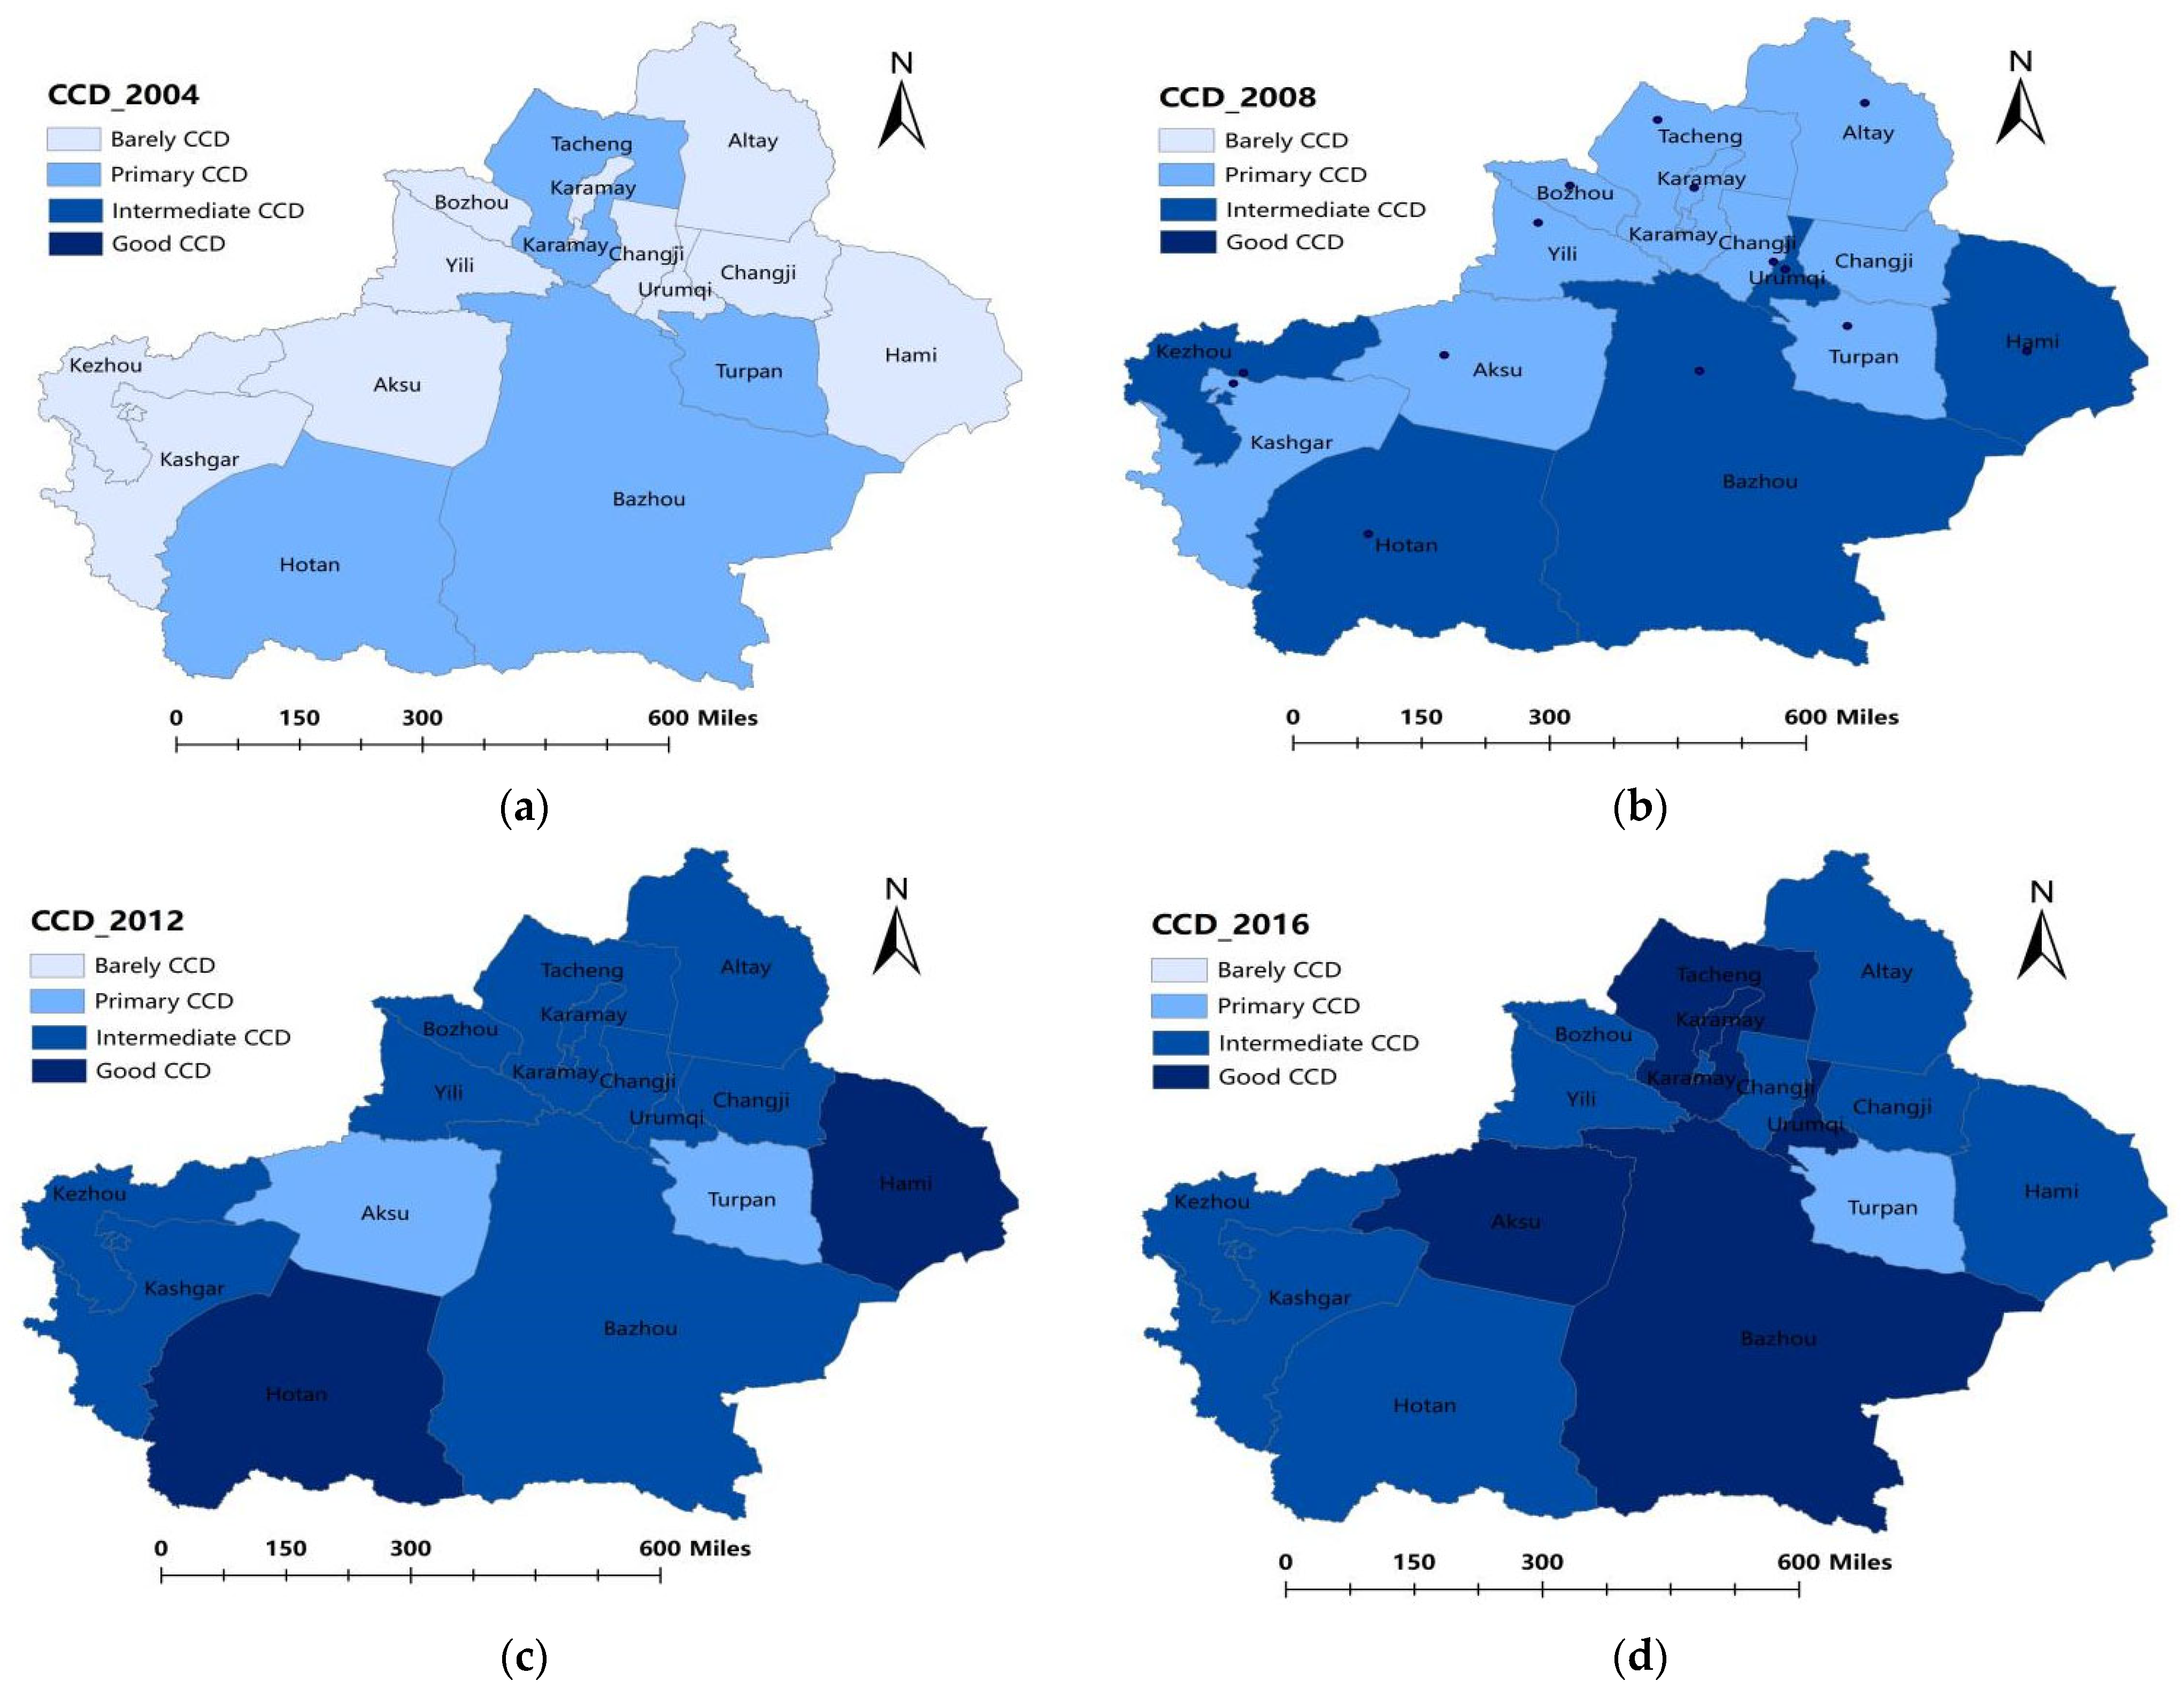
Upon examining the spatial distribution of the coupling coordination degree of the EFW systems across various years (Figure 5), we observe a general augmentation and enhancement from 2004 to 2016 among various municipalities. In 2004, 2008, 2012, 2016, and 2020, the annual percentages of regions with basic coupling coordination in the 14 cities were 71.4%, 0%, 0%, 0%, and 21.4%, respectively. Preliminary coupling coordination accounted for 28.6%, 64.3%, 14.3%, 7.1%, and 14.4%, respectively, while the regions with moderate coupling coordination constituted 0%, 35.7%, 78.6%, 57.2%, and 50.0%, respectively. Regions with good coordination were 0%, 0%, 14.3%, 35.7%, and 7.1%, respectively. It is evident that in 2016, the moderation–good coordination rate reached its peak at 92.9%, followed by 2012. Spatially, the southern regions of Xinjiang, particularly Bazhou, Hotan, and Turpan in eastern Xinjiang, and Tacheng in northern Xinjiang had higher rates in 2004. By 2016, while the level in Turpan remained unchanged, Bazhou, Aksu, Tacheng, and Urumqi experienced significant enhancements, indicating that the EFW system coupling coordination in regions such as Bazhou and Tacheng improved most significantly. By 2020, Yili Prefecture and Changji degraded to basic coupling coordination, while Bozhou was elevated to good coupling coordination. Overall, these figures were higher than those of 2008 but fell slightly short of the 2012 status.
3.3.2. Analysis of Main Obstacle Factors in EFW
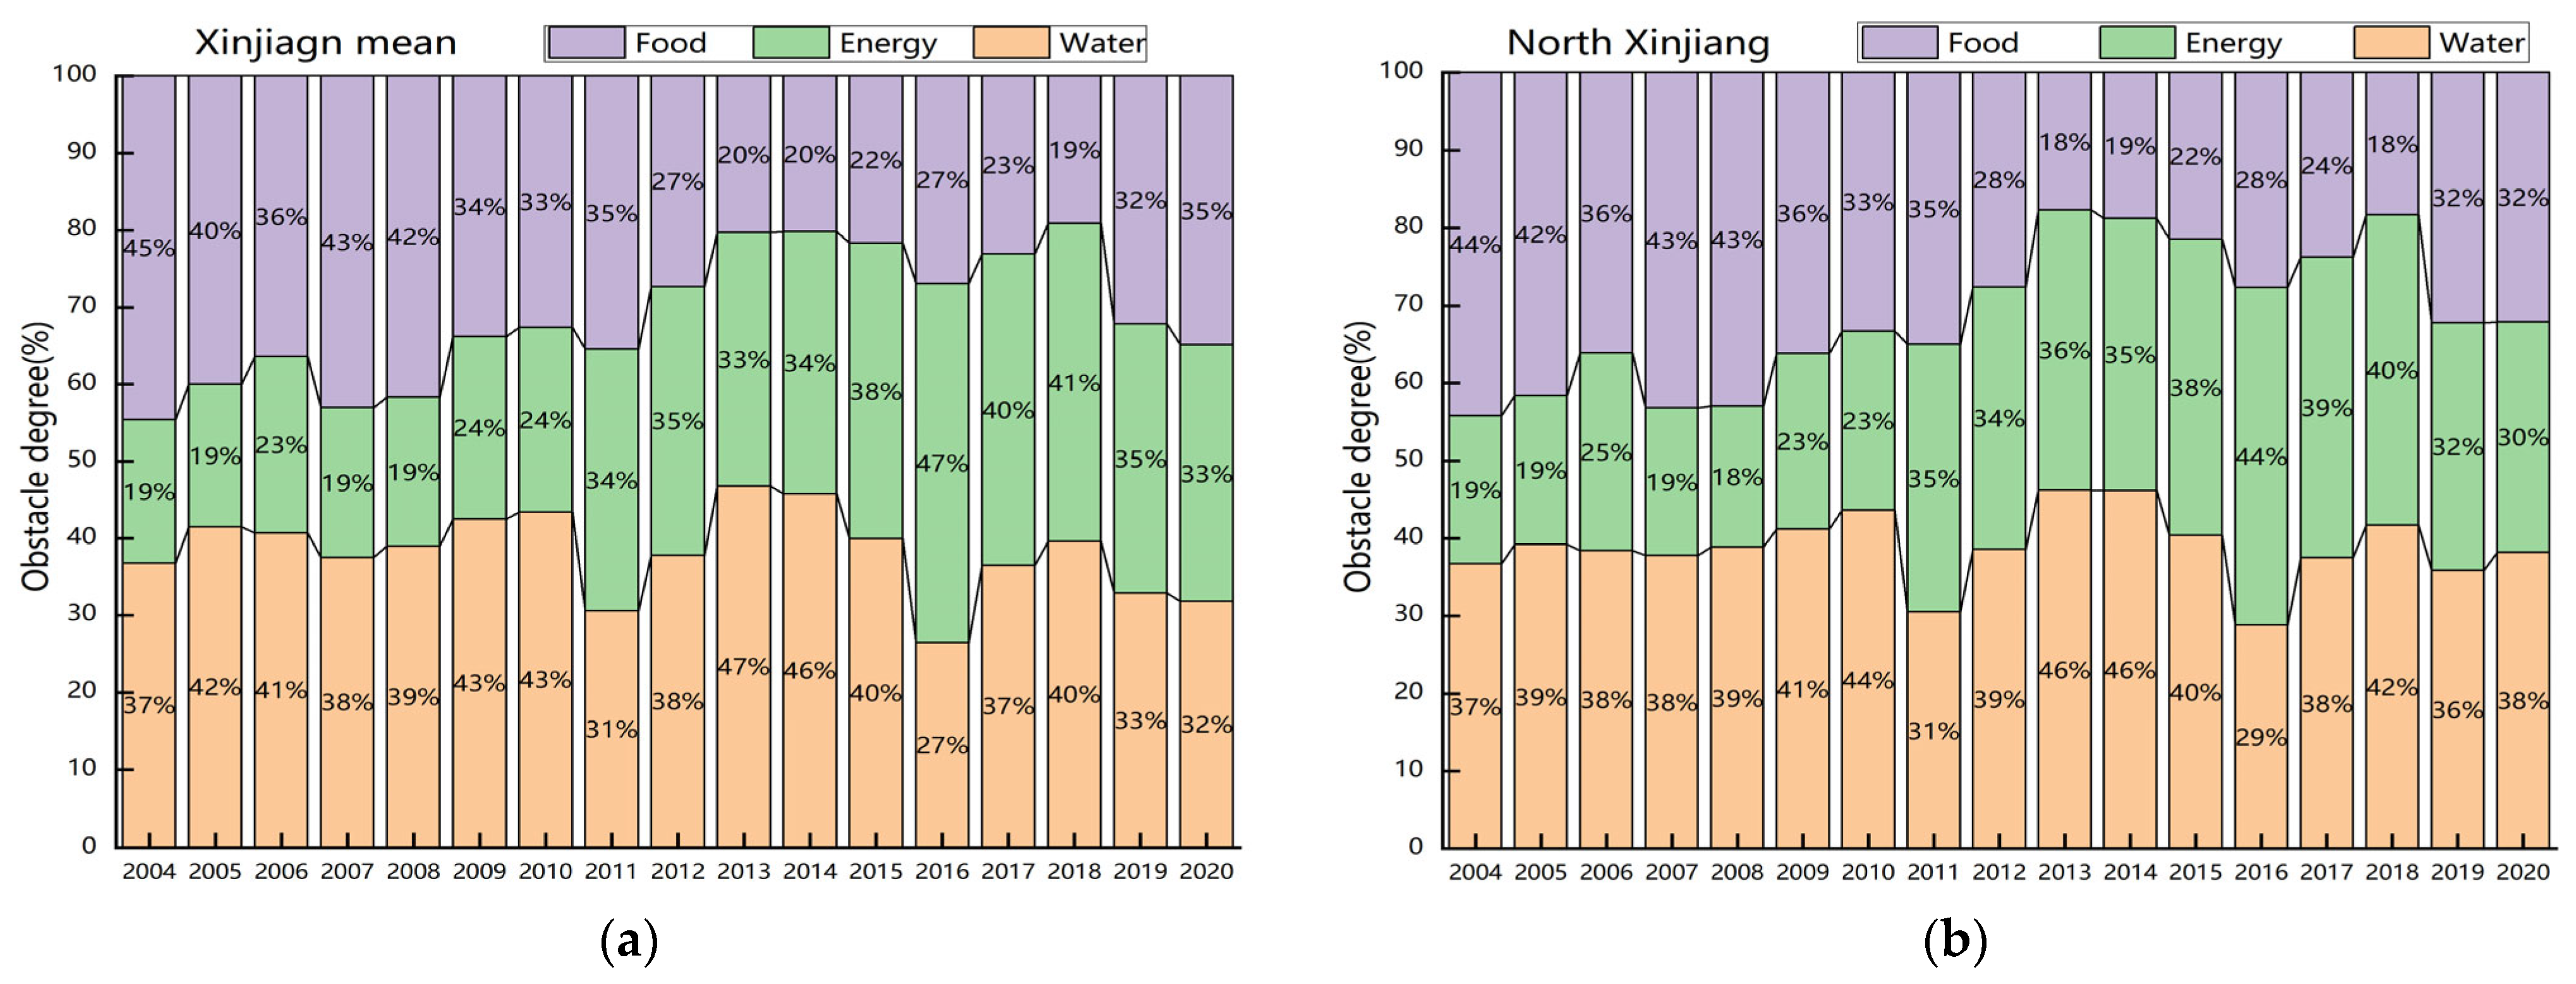
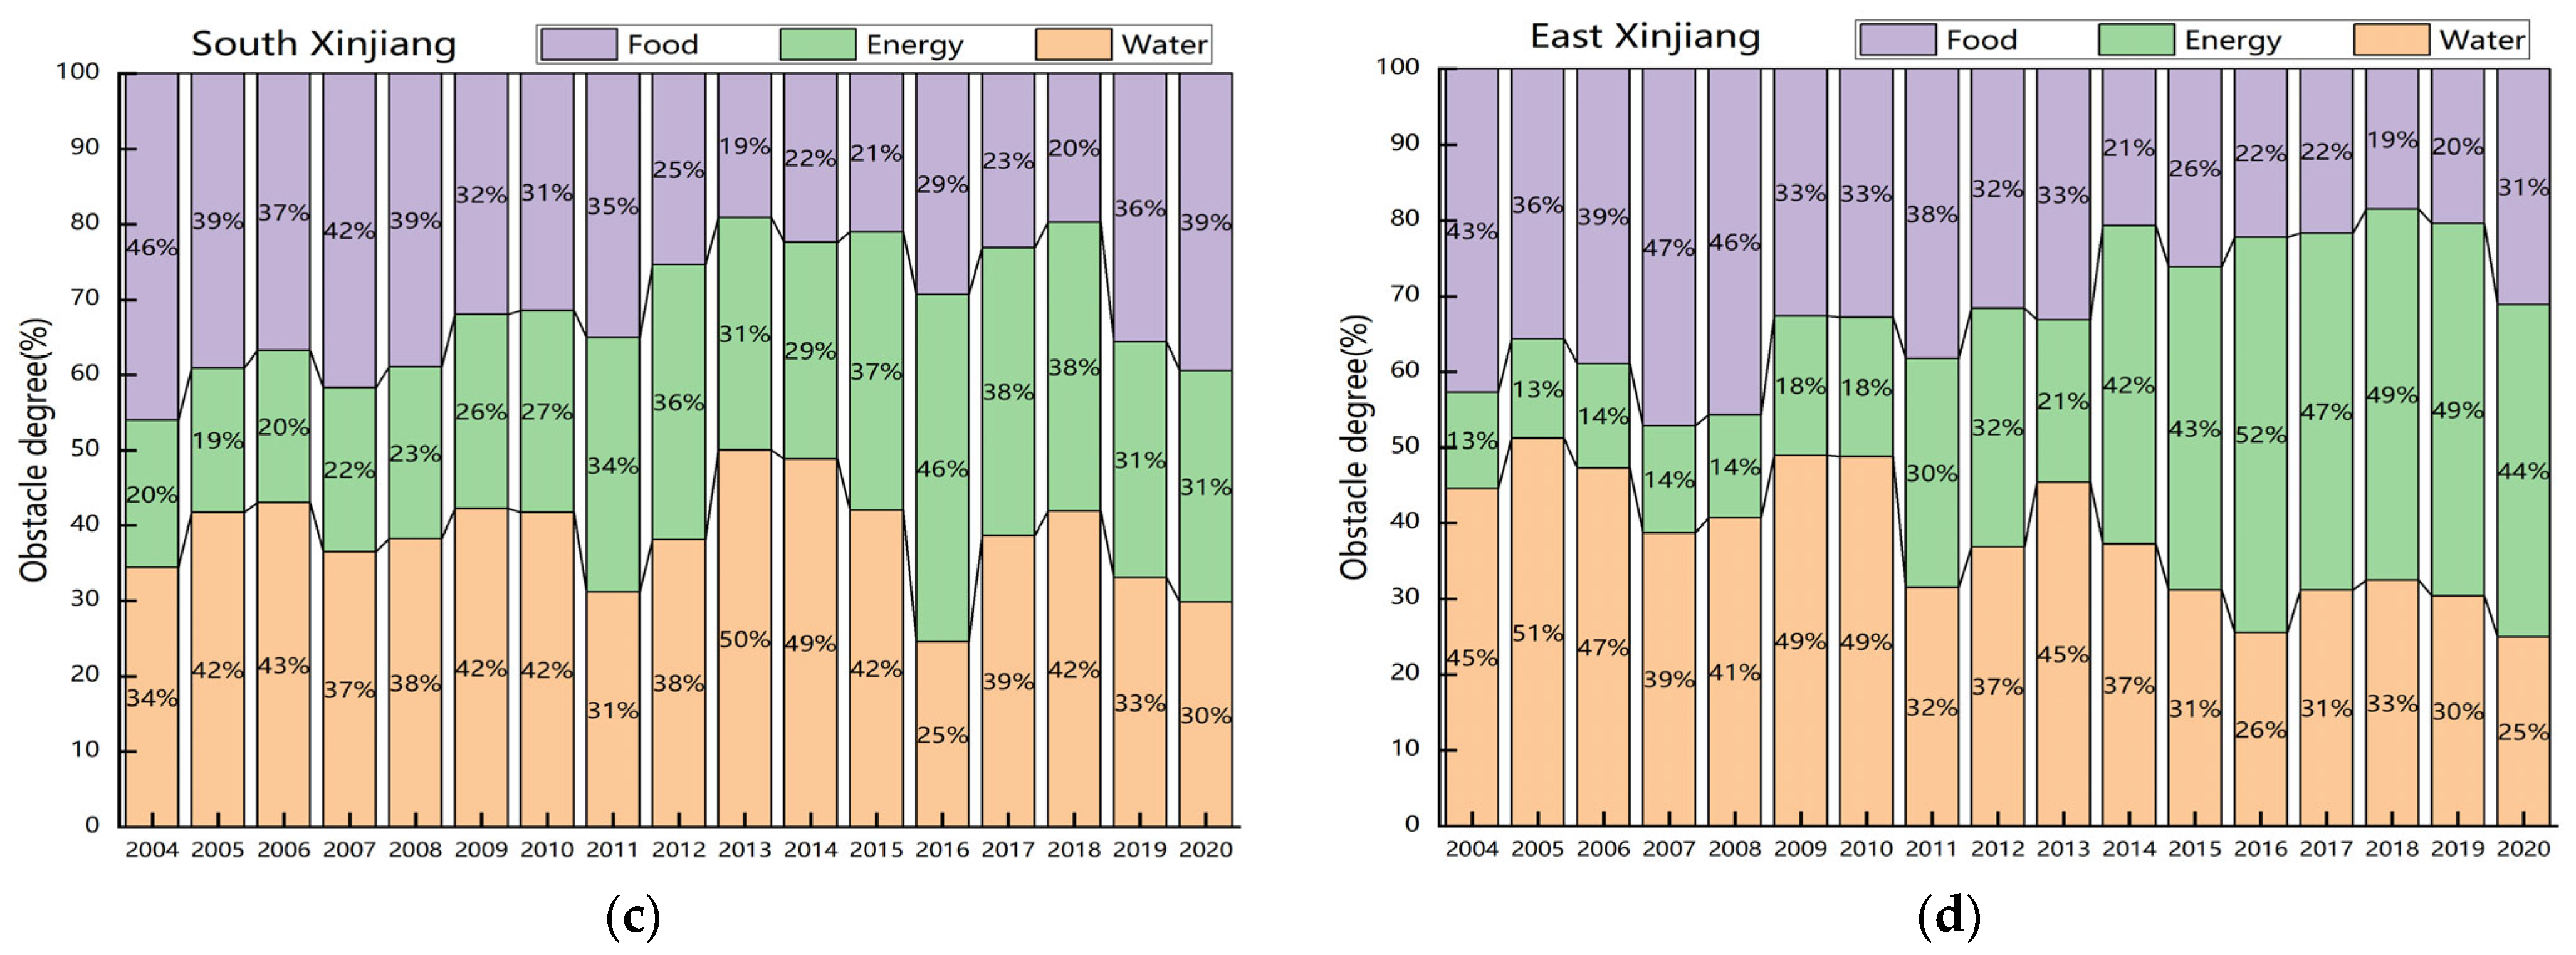
Applying the barrier factor model, an obstacle analysis was undertaken on the EFW systems in Xinjiang, including its northern, southern, and eastern regions (Figure 6). It is discernible that from 2004 to 2018, the level of obstruction faced by EFW in Xinjiang and its divisions indicated a decreasing tendency, declining by 24% to 26% overall. However, there was a slight augmentation in the years 2019 and 2020, with the barrier levels hovering between 32% and 39%. The changes in the water resource system’s obstruction level were comparatively stable, sporadically bouncing between 27% and 51%. In the eastern region of Xinjiang, a conspicuous decline in water resource-related hurdles was observed around the year 2014. Contrastingly, the level of impedance from the energy systems progressively ascended from 2004 to 2020, from an initial 13% to 19% to a final 44% to 52%, with a maximum surge of 28% to 39%. The zenith of impediment rates was noticed between the years 2016 to 2018, which primarily influences the coupling and coordination of the EFW system, with the eastern region documenting the greatest degree of escalation (an increase rate of 39%).
Between 2004 and 2020, an examination of the top five barriers impacting the average EFW system in Xinjiang reveals distinct differences in the principal obstructive factors around 2010 and 2014 (Table 6). From 2004 to 2009, the indicators with the highest frequency of being among the top five in terms of obstruction levels were per capita food consumption (C27), the Engel coefficient (C28), water usage per unit of GDP (C10), and area under water-saving irrigation (C12). This indicates that during this period, water use efficiency, food consumption, and efficiency metrics were the primary factors hindering improvements in the EFW system. Between 2010 and 2013, the factors with higher levels of obstruction were more dispersed. In 2010 and 2013, the main barriers were related to the water resource system, specifically the total water resources (C1), per capita water availability (C2), and per area water resource quantity (C3). In contrast, in 2011 and 2012, the frequency of indicators such as the rate of water resource development and utilization (C9), the production volumes of raw coal and crude oil (C14), renewable energy production (C15), and secondary industry energy consumption (C17) was higher, highlighting the supply and consumption of water resources and energy as the main obstacles during this period. From 2014 to 2020, the indicators with high obstruction levels were centered around energy consumption volume (C16), per capita energy consumption (C18), energy self-sufficiency rate (C21), and agricultural diesel use (C31), signifying that energy consumption and efficiency metrics were the leading barriers to the coupling and coordination of Xinjiang’s EFW system.
4. Discussion and Suggestions
The relationships among energy, food, and water systems are complex and mutually constraining. Changes in any one of these elements prompt effects and transformations across the subsystems and the overall system [36]. Studies on the coupling degrees of the EFW system have transitioned from a focus on isolated systems to a comprehensive model that incorporates both internal and external factors and their interlinked feedback relationships, primarily using the CCDM [37]. This progression has moved from evaluating coordination within individual systems to assessing the systemic coupling and coordination. The present study further considers coordination within individual systems, the relative developmental relationships between dual systems, and the comprehensive coupling and coordination across systems. A hierarchical evaluation model, CDD-RDD-CDD, has been established, substantially enhancing the theoretical framework for the integrated assessment of coupling and coordination within the EFW system.
Through analysis and evaluation, the coupling coordination degree of the Xinjiang EFW system demonstrated fluctuating improvement between 2004 and 2020, particularly from 2011 to 2013 and from 2015 to 2020, where it reached a moderate coupling coordination state, ranging from 0.7 to 0.8. This finding differs from Zhang et al.’s study on the coupling coordination coefficient in Xinjiang within China’s western regions, which improved from 0.48 in 2005 to 0.557 in 2018, generally hovering at the brink of imbalance and forced coordination [31]. The discrepancy arises from the different evaluation indicators selected. However, comparing the change in coupling coordination degree from 2018 relative to 2015, this study shows an improvement of 19.8%, while Zhang et al. reported a 16.0% improvement, indicating a similar trend and magnitude of improvement. Feng et al. [38], utilizing the CCDM model, observed that the EFW system’s coupling coordination degree in Xinjiang (excluding sub-regional considerations) gradually increased from 0.59 to 0.77 between 2000 and 2019, with scores also between 0.7 and 0.8 from 2010 and from 2015 to 2019, never exceeding 0.6 before 2005 and aligning closely with the trends and intervals found in this study. Regarding the coordination degree changes in the water, energy, and food systems individually, the trends in water and food system coordination align with existing research by Feng et al. [38], showing significant growth. However, the interannual variation in the energy system was not consistent, with a decline and gradual stabilization observed post-2013. Analysis indicates that from 2014 to 2020, energy consumption and efficiency metrics were the primary impediments to the coupling coordination degree of Xinjiang’s EFW system. The decline in local energy supply starting in 2013 also contributed to this trend, simultaneously leading to a reduction in energy–water system coupling and exacerbating the contradiction between energy development and water resource constraints.
Examining temporal variations, the EFW system and its subsystems were in a relatively optimal state of coupling and coordination between 2012 and 2016. This period coincides with the final years of the 12th Five-Year Plan and the beginning of the 13th Five-Year Plan in Xinjiang, where significant efforts were made in energy conservation, pollution reduction, and carbon emission reduction. During this time, the energy and water consumption per unit of GDP in Xinjiang decreased further and the efficiency indicators of the water, food, and energy systems saw significant improvements. However, the years 2019 and 2020 did not witness further notable increases and even experienced declines. This may be attributed to the continuous expansion of total energy and food production, which intensified the constraints of water resources for energy and food production, especially the contradictions in water supply for energy production. Consequently, this has increased the difficulty of further coupling and coordination within the EFW system, particularly making the coordination and coupled development of the energy system and the energy–water dual system the primary obstacles to the EFW system’s integrated progression.
Given the current characteristics of resources and environmental status in Xinjiang, along with the challenges and pressures faced by the EFW system, it is imperative to intensify the optimization of energy transition in key energy development and production regions within the province. Firstly, it is essential to expedite the adjustment and enhancement of the industrial structure in Xinjiang, adhering to the conjunction of high-quality development with rigorous environmental standards. Regions such as Changji, Turpan-Hami, Urumqi, Yili, Bazhou, and Aksu have experienced a rapid increase in industrial energy consumption and maintain elevated levels of unit energy consumption, significantly diminishing the coordination within energy subsystems. These areas are thus identified as focal points for future endeavors in energy saving and emission reduction. Secondly, a robust development of clean and renewable energy is paramount. There needs to be a deepened push for an energy transition and adoption of cleaner alternatives, with an accelerated establishment of integrated multi-energy complementarity systems across the province, encompassing wind, solar, hydro, and biomass energy. A proactive advancement of the comprehensive utilization of nascent energy sources such as solar, wind, biomass, and hydropower is crucial for diminishing reliance on conventional primary energy. Lastly, it is vital to reinforce water conservation within the energy industry, agriculture, and other sectors, particularly focusing on the efficient recycling and judicious allocation of water resources in regions of energy production and supply.
5. Conclusions
Drawing upon the internal components and interdependencies of the EFW coupling system, we formulated an evaluative framework for assessing the coordination levels of water resources, energy, and food systems, evaluating them from the perspectives of supply, consumption, and efficiency. This framework encompasses metrics for the CDD, the RDD, and the CCD. Furthermore, employing an obstacle factor discrimination method, we evaluated the coupling coordination of the EFW systems across 14 prefectures in Xinjiang from 2004 to 2020, yielding the following conclusions:
(1) Between 2004 and 2020, the developmental coordination index of the water resource subsystem within the subregions of Xinjiang ranged between 0.30 and 0.85, exhibiting relatively low spatial variability. The energy subsystem varied between 0.18 and 0.81, while the food subsystem ranged from 0.12 to 0.83, signifying notable spatial differences. Initially, prior to 2011, the coordination of the energy system surpassed that of the water and food systems; however, a decline was observed post-2011. During the period from 2004 to 2020, the coordination indices of both food and water resource systems demonstrated a trend of improvement. By 2020, these indices were 1.54 and 2.44 times higher than those of 2004, with an annual average increase rate of 3.16% and 8.47%, respectively. Conversely, the coordination index of the energy subsystem decreased, with an average annual reduction of 0.9%;
(2) In the subregions of Xinjiang, the energy–water (E–W) dual system revealed significant spatial disparities. Prior to 2011, the coupling degree of the E–W system (ranging from 1.2 to 1.6) notably exceeded that of the food–water (F–W) system (ranging from 0.5 to 1.2) and the energy–food (E–F) system (ranging from 0.4 to 1.15), with the E–F coupling degree being the lowest. Both the F–W and E–F systems exhibited an upward trend annually, whereas the E–W system’s coupling degree showed a yearly decline. Post-2011, the coupling degrees of the F-E and F–W systems generally improved; by 2020, they had increased by 3.6 times and 1.6 times, respectively, from their values in 2004. Conversely, the E–W system’s coupling degree decreased, with an average annual reduction of 2.62% between 2004 and 2020. This underscores the intensifying conflict between energy development and water resource constraints in Xinjiang;
(3) The annual mean composite coupling coordination index for Xinjiang’s EFW systems ranged from 0.59 to 0.80 over the years, indicating an overall status varying from basic to moderate coupling coordination. From 2004 to 2020, the EFW systems experienced fluctuating increases in coupling coordination degree. Regions prominently characterized by ecologically sound backgrounds and rich endowments of water and land resources—specifically, the western Tianshan mountainous area, southern slopes, Altai Mountains, and the northwestern edge of the Junggar Basin—demonstrated elevated levels of coupling coordination between 2004 and 2016. Following these were the zones in southern Xinjiang, which, despite their comparatively inferior natural conditions, possessed relative abundance in water and energy resources;
(4) Between 2004 and 2020, the Xinjiang region, alongside its subdivisions, observed a decreasing tendency in the impedance level of the food system within the EFW framework. The water resource system’s impedance level remained relatively stable, oscillating between 27% and 51%, while that of the energy system escalated from 44% to 52% over the same period, signifying its role as a principal influence on the EFW system’s coupling coordination degree. From 2004 to 2009, primary obstructive factors were identified as water use efficiency, food consumption, and efficiency indicators. In contrast, from 2010 to 2013, the major impediments shifted to water resource endowment and efficiency indicators, and from 2014 to 2020, energy consumption and efficiency indicators took precedence, underscoring the necessity of intensifying energy transition and optimization in Xinjiang’s energy development and production-dominated areas.
Author Contributions
Conceptualization, J.G.; Data curation, J.X.; Formal analysis, J.G. and J.X.; Investigation, J.G.; Software, J.X.; Writing—original draft, J.G.; Writing—review and editing, J.G. and J.X. All authors have read and agreed to the published version of the manuscript.
Funding
This research was financially supported by the National Natural Science Foundation of China (Grant No. 51861125101).
Informed Consent Statement
Not applicable.
Data Availability Statement
Data are contained within the article.
Acknowledgments
We would like to thank Adam Roddy for English language editing.
Conflicts of Interest
The authors declare no conflicts of interest.
References
- Manioudis, M.; Meramveliotakis, G. Broad strokes towards a grand theory in the analysis of sustainable development: A return to the classical political economy. New Political Econ. 2022, 27, 866–878. [Google Scholar] [CrossRef]
- Meramveliotakis, G.; Manioudis, M. History, Knowledge, and Sustainable Economic Development: The Contribution of John Stuart Mill’s Grand Stage Theory. Sustainability 2021, 13, 1468. [Google Scholar] [CrossRef]
- Zhu, J.; Kang, S.; Zhao, W.; Li, Q.; Xie, X.; Hu, X. A Bibliometric Analysis of Food–Energy–Water Nexus: Progress and Prospects. Land 2020, 9, 504. [Google Scholar] [CrossRef]
- Hellegers, P.; Zilberman, D.; Steduto, P.; McCornick, P. Interactions between water, energy, food and environment: Evolving perspectives and policy issues. Water Policy 2008, 10, 1–10. [Google Scholar] [CrossRef]
- Qin, J.; Gao, L.; Tu, W.; He, J.; Tang, J.; Ma, S.; Zhao, X.; Zhu, X.; Brindha, K.; Tao, H. Decomposition and Decoupling Analysis of Carbon Emissions in Xinjiang Energy Base, China. Energies 2022, 15, 5526. [Google Scholar] [CrossRef]
- Huang, D.; Li, G.; Sun, C.; Liu, Q. Exploring interactions in the local water-energy-food nexus (WEF-Nexus) using a simultaneous equations model. Sci. Total Environ. 2020, 703, 135031–135034. [Google Scholar] [CrossRef] [PubMed]
- Ju, Y.Y. Revealing the bilateral dependencies and policy implication of food production of Japan and China: From the perspective of Food-Energy-Water nexus. Ecol. Model. 2019, 391, 29–39. [Google Scholar] [CrossRef]
- Zhang, P.; Zhang, L.; Chang, Y.; Xu, M.; Hao, Y.; Liang, S.; Liu, G.; Yang, Z.; Wang, C. Food-energy-water (FEW) nexus for urban sustainability: A comprehensive review. Resour. Conserv. Recycl. 2019, 142, 215–224. [Google Scholar] [CrossRef]
- Saidmamatov, O.; Rudenko, I.; Pfister, S.; Koziel, J. Water–Energy–Food Nexus Framework for Promoting Regional Integration in Central Asia. Water 2020, 12, 1896. [Google Scholar] [CrossRef]
- Wang, X.; Li, X.; Xiao, X.; Fan, L.; Zuo, L. Changes in the Water-Energy Coupling Relationship in Grain Production: A Case Study of the North China Plain. Int. J. Environ. Res. Public Health 2022, 19, 9527. [Google Scholar] [CrossRef]
- Lotte, V.; Blicharska, M.; Masia, S.; Sušnik, J.; Teutschbein, C. Ecosystem services in the Swedish water-energy-food-land-climate nexus: Anthropogenic pressures and physical interactions. Ecosyst. Serv. 2020, 44, 101141. [Google Scholar]
- Mahlknecht, J.; González-Bravo, R.; Loge, F.J. Water-energy-food security: A Nexus perspective of the current situation in Latin America and the Caribbean. Energy 2020, 194, 116824. [Google Scholar] [CrossRef]
- Zou, C.; Zhu, J.; Lou, K.; Yang, L. Coupling coordination and spatiotemporal heterogeneity between urbanization and ecological environment in Shaanxi Province, China. Ecol. Indic. 2022, 141, 109152. [Google Scholar] [CrossRef]
- Wang, J.; Wang, S.; Li, S.; Feng, K. Coupling analysis of urbanization and energy environment efficiency: Evidence from Guangdong province. Appl. Energy 2019, 254, 113650. [Google Scholar] [CrossRef]
- Zhang, X.; Vesselinov, V.V. Integrated Modeling Approach for Optimal Management of Water, Energy and Food Security Nexus. Adv. Water Resour. 2017, 101, 1–10. [Google Scholar] [CrossRef]
- Yuling, L.P.H.M.; Martinez-Hernandez, E.; Leach, M.; Yang, A.D. Designing integrated local production systems: A study on the food-energy-water nexus. J. Clean. Prod. 2016, 135, 1065–1084. [Google Scholar]
- Chen, X.; Zhou, J.; Xing, L.; Wang, H.; Lu, J. Spatiotemporal evolution and driving factors of the coupling coordination between county land urbanization and grain production: The case of Jiangsu province, China. Front. Ecol. Evol. 2023, 11, 1179551. [Google Scholar] [CrossRef]
- Feng, M.; Chen, Y.; Duan, W.; Zhu, Z.; Wang, C.; Hu, Y. Water-energy-carbon emissions nexus analysis of crop production in the Tarim river basin, Northwest China. J. Clean. Prod. 2023, 396, 136566. [Google Scholar] [CrossRef]
- Liu, X.; Xu, Y.; Sun, S.; Zhao, X.; Wang, Y. Analysis of the Coupling Characteristics of Water Resources and Food Security: The Case of Northwest China. Agriculture 2022, 12, 1114. [Google Scholar] [CrossRef]
- Mondal, K.; Chatterjee, C.; Singh, R. Examining the coupling and coordination of water-energy-food nexus at a sub-national scale in India—Insights from the perspective of Sustainable Development Goals. Sustain. Prod. Consum. 2023, 43, 140–154. [Google Scholar] [CrossRef]
- De Strasser, L.; Lipponen, A.; Howells, M.; Stec, S.; Bréthaut, C. A methodology to assess the water energy food ecosystems nexus in transboundary river basins. Water 2016, 8, 59. [Google Scholar] [CrossRef]
- Guan, J.; Han, X.; Engel, B.A.; Hua, E.; Sun, S.; Wu, P.; Wang, Y. Developing a framework taking into account negative environmental impacts to evaluate water-energy-food coupling efficiency. J. Clean. Prod. 2024, 448, 141553. [Google Scholar] [CrossRef]
- Lv, Y.; Li, Y.; Zhang, Z.; Luo, S.; Feng, X.; Chen, X. Spatio-temporal evolution pattern and obstacle factors of water-energy-food nexus coupling coordination in the Yangtze river economic belt. J. Clean. Prod. 2024, 444, 141229. [Google Scholar] [CrossRef]
- Li, D.L.; Liu, J.H.; Hao, L.G.; Ma, J.X.; Zuo, Q.T. Analysis of water-food-energy safety in Africa area of “Belt and Road”. Water Resour. Prot. 2018, 34, 22–28. (In Chinese) [Google Scholar]
- Mohammadpour, P.; Mahjabin, T.; Fernandez, J.; Grady, C. From national indices to regional action—An Analysis of food, energy, water security in Ecuador, Bolivia, and Peru. Environ. Sci. Policy 2019, 101, 291–301. [Google Scholar] [CrossRef]
- Xu, Z.C.; Chau, S.N.; Chen, X.Z.; Zhang, J.; Li, Y.J.; Dietz, T.; Wang, J.Y.; Winkler, J.; Fan, F.; Huang, B.R.; et al. Assessing progress towards sustainable development over space and time. Nature 2020, 577, 74–78. [Google Scholar] [CrossRef]
- Ji, J.; Chen, J.; Ding, T. Security Assessment Using SPA-VFS and Obstacle Factors Diagnosis of Water-Energy-Food Nexus Based on A PSR Framework. Water 2021, 25, 19–28. [Google Scholar]
- Wang, C.Y.; Tian, L.; Yu, M.; Liu, Y. Review of the studies on the water- energy nexus of the electricity sector. China Environ. Sci. 2018, 38, 4742–4748. (In Chinese) [Google Scholar]
- Pan, H.R.; Jiang, X.; Zhang, B.X.; Li, P.R.; Wang, H.G.; Song, M.H. Study on the Coupling Coordination Relationship of the Water-Energy-Food System in Shandong Province. Yellow River 2023, 45, 64–68+72. (In Chinese) [Google Scholar]
- Wang, S.J.; Kong, W.R.L.; Zhi, D.D.; Dai, B.B. Research on misuses and modification of coupling coordination degree model in China. J. Nat. Resour. 2021, 6, 793–810. (In Chinese) [Google Scholar] [CrossRef]
- Zhang, N.; Yang, X.; Chen, T.; Chen, T. Research on the coupling coordination of water-energy-food system and its temporal and spatial characteristics. Chin. Environ. Sci. 2022, 42, 4444–4456. (In Chinese) [Google Scholar]
- Wang, S.; Yang, R.; Shi, S.; Wang, A.; Liu, T.; Yang, J. Characteristics and Influencing Factors of the Spatial and Temporal Variability of the Coupled Water–Energy–Food Nexus in the Yellow River Basin in Henan Province. Sustainability 2023, 15, 13977. [Google Scholar] [CrossRef]
- Ariken, M.; Zhang, F.; Chan, N.W.; Kung, H.-T. Coupling coordination analysis andspatio-temporal heterogeneity between urbanization and eco-environment along the Silk Road Economic Belt in China. Ecol. Ind. 2021, 121, 107014. [Google Scholar] [CrossRef]
- Cai, J.; Li, X.; Liu, L.; Chen, Y.; Wang, X.; Lu, S. Coupling and coordinated development of new urbanization and agro-ecological environment in China. Sci. Total Environ. 2021, 776, 145837. [Google Scholar] [CrossRef] [PubMed]
- Wei, X.; Zhao, R.; Xu, J. Spatiotemporal Evolution, Coupling Coordination Degree and Obstacle Factors of Urban High-Quality Development: A Case Study of Anhui Province. Sustainability 2023, 15, 10852. [Google Scholar] [CrossRef]
- Al-Saidi, M.; Elagib, N.A. Towards understanding the integrative approach of the water, energy and food nexus. Sci. Total Environ. 2017, 574, 1131–1139. [Google Scholar] [CrossRef] [PubMed]
- Wang, C.; Tang, N. Spatio-temporal characteristics and evolution of rural production-living-ecological space function coupling coordination Chongqing Municipality. Geogr. Res. 2018, 37, 1100–1114. [Google Scholar]
- Feng, M.Q.; Chen, Y.N.; Jiao, L.; Duan, W.L.; Chen, S.F. Research on the coupling and coordinated development of water-energy-food system in Xinjiang during 2000–2019. J. Water Resour. Water Eng. 2022, 33, 77–84. (In Chinese) [Google Scholar]
Figure 1.
Cities in the Xinjiang Prefecture and above.

Figure 2.
Internal and external coupling relationship of energy food water system.

Figure 3.
Changes in the coordinated index of water, energy, and food single systems in the Xinjiang subregion (from 2004 to 2020). (a) The water resource system; (b) The energy system, (c) The food system, (d) The mean variation in the coordinated development of water resources, energy, and food.
Figure 3.
Changes in the coordinated index of water, energy, and food single systems in the Xinjiang subregion (from 2004 to 2020). (a) The water resource system; (b) The energy system, (c) The food system, (d) The mean variation in the coordinated development of water resources, energy, and food.

Figure 4.
Changes in coupled co-scheduling of water–energy–food dual systems in the Xinjiang subregion (from 2004 to 2020). (a) The water–energy system; (b) Tshe water–food system; (c) The energy–food system; (d) The annual inter-variation of the average values of dual systems across various regions.

Figure 5.
Spatial variation of comprehensive coupling coordination degree of the water–energy–food system in the Xinjiang subregion. (a–e) they respectively denote the spatial variations in the comprehensive coupling coordination degrees for the years 2004, 2008, 2012, 2016, and 2020.
Figure 5.
Spatial variation of comprehensive coupling coordination degree of the water–energy–food system in the Xinjiang subregion. (a–e) they respectively denote the spatial variations in the comprehensive coupling coordination degrees for the years 2004, 2008, 2012, 2016, and 2020.


Figure 6.
Obstacle analysis of EFW systems in various regions of Xinjiang.(a) Xinjiang mean; (b) North Xinjiang; (c) South Xinjiang; (d) East Xinjiang.
Figure 6.
Obstacle analysis of EFW systems in various regions of Xinjiang.(a) Xinjiang mean; (b) North Xinjiang; (c) South Xinjiang; (d) East Xinjiang.


Table 1.
Evaluation indicator system of EFW system coupling coordination relationship.
| Subsystem | Indicator Type | Indicator | Weight | Indicator Attribute |
|---|---|---|---|---|
| Water | Supply | Total water resources (100 million m3) | 0.081 | Positive |
| Per capita water resources (100 million m3) | 0.076 | Positive | ||
| Land average water resources (100 million m3/km2) | 0.082 | Positive | ||
| Rainfall/mm | 0.080 | Positive | ||
| Consumption | Agricultural water consumption (100 million m3) | 0.091 | Negative | |
| Industrial water consumption (100 million m3) | 0.090 | Negative | ||
| Ecological water consumption (100 million m3) | 0.070 | Positive | ||
| Per capita water consumption (m3 per person) | 0.088 | Negative | ||
| Efficiency | Water development and utilization rate (%) | 0.093 | Negative | |
| Water consumption per 10,000 GDP (m3/10,000 yuan) | 0.072 | Negative | ||
| Water consumption per unit industrial added value (m3/10,000 yuan) | 0.094 | Negative | ||
| Water-saving irrigation area (1000 hectares) | 0.082 | Positive | ||
| Energy | Supply | Energy production (10,000 tons of standard coal) | 0.099 | Positive |
| Raw coal and crude oil production (10,000 tons of standard coal) | 0.086 | Negative | ||
| Renewable energy production (10,000 tons of standard coal) | 0.122 | Positive | ||
| Consumption | Energy consumption (10,000 tons of standard coal) | 0.121 | Negative | |
| Energy consumption in the secondary industry (10,000 tons of standard coal) | 0.121 | Negative | ||
| Per capita energy consumption (tons of standard coal per person) | 0.121 | Negative | ||
| Efficiency | Energy consumption per 10,000 GDP (tons of standard coal/10,000 yuan) | 0.119 | Negative | |
| Energy consumption per unit industrial added value (tons of standard coal/10,000 yuan) | 0.119 | Negative | ||
| Self-sufficiency rate of energy (%) | 0.092 | Positive | ||
| Food | Supply | Total food output (10,000 tons) | 0.090 | Positive |
| Output per unit planting area (kg/hectare) | 0.105 | Positive | ||
| Per capita food output (kg per person) | 0.090 | Positive | ||
| Proportion of food planting area (%) | 0.090 | Positive | ||
| Consumption | Food consumption (10,000 tons) | 0.112 | Negative | |
| Per capita food consumption (kg per person) | 0.108 | Negative | ||
| Engel coefficient | 0.115 | Negative | ||
| Efficiency | Self-sufficiency rate of food (%) | 0.066 | Positive | |
| Fertilizer use (kg/hm2) | 0.113 | Negative | ||
| Use of agricultural diesel oil (t/hm2) | 0.111 | Negative |
Table 2.
Classification of coordination levels for single system development.
| Range of Q Values | Single System Coordination Level | Single System Development Coordination Status |
|---|---|---|
| 0 ≤ Q ≤ 0.2 | 1 | Severe imbalance |
| 0.2 < Q ≤ 0.4 | 2 | Moderate imbalance |
| 0.4 < Q ≤ 0.5 | 3 | Mild imbalance |
| 0.5 < Q ≤ 0.6 | 4 | Basic coordination |
| 0.6 < Q ≤ 0.8 | 5 | Good coordination |
| 0.8 < Q ≤ 1.0 | 6 | High quality coordination |
Table 3.
Classification of relative development levels of EFW dual systems.
| Range of R Values | Dual System Relative Development Level | Relative Development Status of Dual Systems |
|---|---|---|
| 0 ≤ R ≤ 0.4 | 1 | Extreme decoupling |
| 0.4 < R ≤ 0.8 | 2 | Moderate decoupling |
| 0.8 < R ≤ 1.2 | 3 | Slightly uncoupled |
| 1.2 < R ≤ 1.6 | 4 | Basic coupling |
| 1.6 < R ≤ 2.0 | 5 | Good coupling |
| 2.0 < R | 6 | High quality coupling |
Table 4.
Classification of coupling coordination levels in EFW systems.
| U Values | System Comprehensive Coupling Coordination Level | System Comprehensive Coupling Coordination Status |
|---|---|---|
| 0 ≤ U ≤ 0.1 | 1 | Extremely imbalanced and uncoupled |
| 0.1 < U ≤ 0.2 | 2 | Severe misalignment and uncoupling |
| 0.2 < U ≤ 0.3 | 3 | Moderate imbalance uncoupling |
| 0.3 < U ≤ 0.4 | 4 | Mild imbalance uncoupling |
| 0.4 < U ≤ 0.5 | 5 | Near Misalignment Uncoupling |
| 0.5 < U ≤ 0.6 | 6 | Basic coupling coordination |
| 0.6 < U ≤ 0.7 | 7 | Primary coupling coordination |
| 0.7 < U ≤ 0.8 | 8 | Intermediate coupling coordination |
| 0.8 < U ≤ 0.9 | 9 | Good coupling and coordination |
| 0.9 < U ≤ 1.0 | 10 | High quality coupling coordination |
Table 5.
Interannual variation in the coupling coordination degree of the Xinjiang EFW system.
| Year | C | T | U | CCD Degree | CCD State |
|---|---|---|---|---|---|
| 2004 | 0.911 | 0.391 | 0.596 | 5 | Barely coupled and coordinated |
| 2005 | 0.947 | 0.428 | 0.636 | 6 | Primary coupled and coordinated |
| 2006 | 0.974 | 0.465 | 0.671 | 6 | Primary coupled and coordinated |
| 2007 | 0.958 | 0.489 | 0.684 | 6 | Primary coupled and coordinated |
| 2008 | 0.960 | 0.485 | 0.681 | 6 | Primary coupled and coordinated |
| 2009 | 0.983 | 0.508 | 0.705 | 7 | Intermediate coupled and coordinated |
| 2010 | 0.987 | 0.552 | 0.737 | 7 | Intermediate coupled and coordinated |
| 2011 | 0.991 | 0.622 | 0.784 | 7 | Intermediate coupled and coordinated |
| 2012 | 0.986 | 0.586 | 0.759 | 7 | Intermediate coupled and coordinated |
| 2013 | 0.935 | 0.439 | 0.637 | 6 | Primary coupled and coordinated |
| 2014 | 0.939 | 0.479 | 0.670 | 6 | Primary coupled and coordinated |
| 2015 | 0.982 | 0.648 | 0.797 | 7 | Intermediate coupled and coordinated |
| 2016 | 0.952 | 0.642 | 0.782 | 7 | Intermediate coupled and coordinated |
| 2017 | 0.980 | 0.628 | 0.784 | 7 | Intermediate coupled and coordinated |
| 2018 | 0.962 | 0.603 | 0.761 | 7 | Intermediate coupled and coordinated |
| 2019 | 0.971 | 0.569 | 0.743 | 7 | Intermediate coupled and coordinated |
| 2020 | 0.954 | 0.545 | 0.720 | 7 | Intermediate coupled and coordinated |
Table 6.
Analysis of the main obstacle factors of the EFW system in Xinjiang (form 2004 to 2020).
| Year | Xinjiang Average Specific Obstacle Factors | ||||
|---|---|---|---|---|---|
| 2004 | C23 | C11 | C10 | C28 | C30 |
| 21.55 | 20.26 | 18.83 | 18.27 | 15.05 | |
| 2005 | C11 | C28 | C10 | C27 | C12 |
| 17.95 | 15.66 | 14.82 | 12.32 | 11.19 | |
| 2006 | C10 | C27 | C12 | C30 | C13 |
| 12.17 | 11.67 | 10.62 | 10.16 | 10.09 | |
| 2007 | C28 | C16 | C27 | C18 | C10 |
| 11.89 | 11.04 | 10.60 | 10.13 | 10.02 | |
| 2008 | C27 | C28 | C26 | C29 | C12 |
| 10.41 | 10.25 | 9.69 | 9.05 | 8.90 | |
| 2009 | C20 | C27 | C28 | C3 | C1 |
| 8.75 | 8.50 | 8.12 | 8.04 | 8.04 | |
| 2010 | C3 | C1 | C9 | C2 | C13 |
| 8.04 | 8.04 | 7.62 | 7.57 | 6.99 | |
| 2011 | C15 | C17 | C14 | C4 | C13 |
| 6.94 | 6.81 | 6.60 | 6.57 | 6.36 | |
| 2012 | C17 | C6 | C14 | C15 | C7 |
| 8.77 | 6.94 | 6.94 | 6.85 | 6.26 | |
| 2013 | C9 | C14 | C2 | C1 | C3 |
| 17.09 | 12.73 | 11.69 | 11.64 | 11.64 | |
| 2014 | C31 | C30 | C29 | C28 | C27 |
| 13.99 | 11.43 | 9.34 | 9.19 | 9.12 | |
| 2015 | C16 | C18 | C21 | C31 | C7 |
| 9.20 | 9.14 | 8.68 | 7.81 | 7.36 | |
| 2016 | C18 | C23 | C16 | C21 | C19 |
| 10.13 | 10.02 | 9.95 | 8.59 | 8.58 | |
| 2017 | C18 | C16 | C31 | C21 | C6 |
| 11.33 | 10.92 | 9.02 | 8.31 | 8.08 | |
| 2018 | C18 | C16 | C21 | C14 | C6 |
| 11.32 | 10.81 | 7.83 | 7.38 | 7.18 | |
| 2019 | C16 | C18 | C17 | C24 | C2 |
| 11.31 | 10.54 | 8.41 | 7.85 | 7.41 | |
| 2020 | C16 | C18 | C17 | C31 | C2 |
| 11.04 | 10.13 | 9.11 | 8.97 | 8.66 | |
Disclaimer/Publisher’s Note: The statements, opinions and data contained in all publications are solely those of the individual author(s) and contributor(s) and not of MDPI and/or the editor(s). MDPI and/or the editor(s) disclaim responsibility for any injury to people or property resulting from any ideas, methods, instructions or products referred to in the content. |
© 2024 by the authors. Licensee MDPI, Basel, Switzerland. This article is an open access article distributed under the terms and conditions of the Creative Commons Attribution (CC BY) license (https://creativecommons.org/licenses/by/4.0/).
Share and Cite
MDPI and ACS Style
Gao, J.; Xu, J. Research on the Spatiotemporal Characteristics of the Coupling Coordination Relationship of the Energy–Food–Water System in the Xinjiang Subregion. Sustainability 2024, 16, 3491. https://doi.org/10.3390/su16083491
AMA Style
Gao J, Xu J. Research on the Spatiotemporal Characteristics of the Coupling Coordination Relationship of the Energy–Food–Water System in the Xinjiang Subregion. Sustainability. 2024; 16(8):3491. https://doi.org/10.3390/su16083491
Chicago/Turabian StyleGao, Jing, and Jian Xu. 2024. "Research on the Spatiotemporal Characteristics of the Coupling Coordination Relationship of the Energy–Food–Water System in the Xinjiang Subregion" Sustainability 16, no. 8: 3491. https://doi.org/10.3390/su16083491
Note that from the first issue of 2016, this journal uses article numbers instead of page numbers. See further details here.