1. Introduction
The concept of sustainability is generally understood as a way to generate welfare for current generations, without putting at risk the possibilities of future generations, to achieve at least the same welfare levels [
1].
Subsidies tend to reduce fares and increase the frequency of service [
2,
3]. Increased patronage also allows systems to use larger vehicles and increase the frequency of service, which affects the density of the route structure [
4]. Lower fares make public transport affordable and usable for more people who chose public transportation, like those with low-income, or older people [
5,
6,
7]. There are more and more people choosing public transportation to go outside, and less and less cars in the street, Concurrently, the risk of congestion on roads is reduced by having fewer private cars [
8].
In general, researchers have argued that the government should sign a performance-based principal–agent contract with bus operators, and that incentive mechanisms should be developed to improve the effectiveness of government subsidies in order to maximize social benefits [
9,
10]. However, different bus subsidy policies could change the number of subsidies received by the companies, which could likely affect the level of service offered by them.
In the case of buses in Taichung City, the SPK subsidy policy might seem better than the SPP subsidy policy at first glance. However, upon close examination of the differences between both subsidy policies, changes in bus subsidy policies can indeed affect the level of service offered. This study utilized public sentiment data of bus passengers, collected within six months before and after the changes in bus subsidy policy, to analyze the various sentiments conveyed in customer complaints. Furthermore, complaint hot spots were identified to verify the analysis results of Taylor, which determined whether the rewards and penalties in a performance-based program are large enough to motivate improved transit system performance [
11]. The results confirmed that using various performance-based bus subsidy schemes can reflect the perceptions of passengers.
Therefore, after consolidating the results, this study proposed that when the public sector adopts an SPP, bus companies that operate routes within the city will benefit more, so those who operate in the outskirts should receive corresponding measures or incentives. Similarly, when the public sector adopts an SPK, bus companies that operate routes in the outskirts benefit more, and those who operate within the city should receive corresponding measures or incentives.
2. Materials and Methods
Under the influence of urban regional characteristics and commercial development, as well as the popularization of the Internet and its applications, sustainable development has become an objective pursued by many cities. The promotion of bus services not only facilitates passenger movement, but also reduces traffic congestion caused by small cars and carbon dioxide emissions from vehicles. In this regard, cities and counties in Taiwan are actively promoting mass transit policies (such as bus services), that could meet the travel requirements of passengers in urban areas, as well as enabling sustainable development [
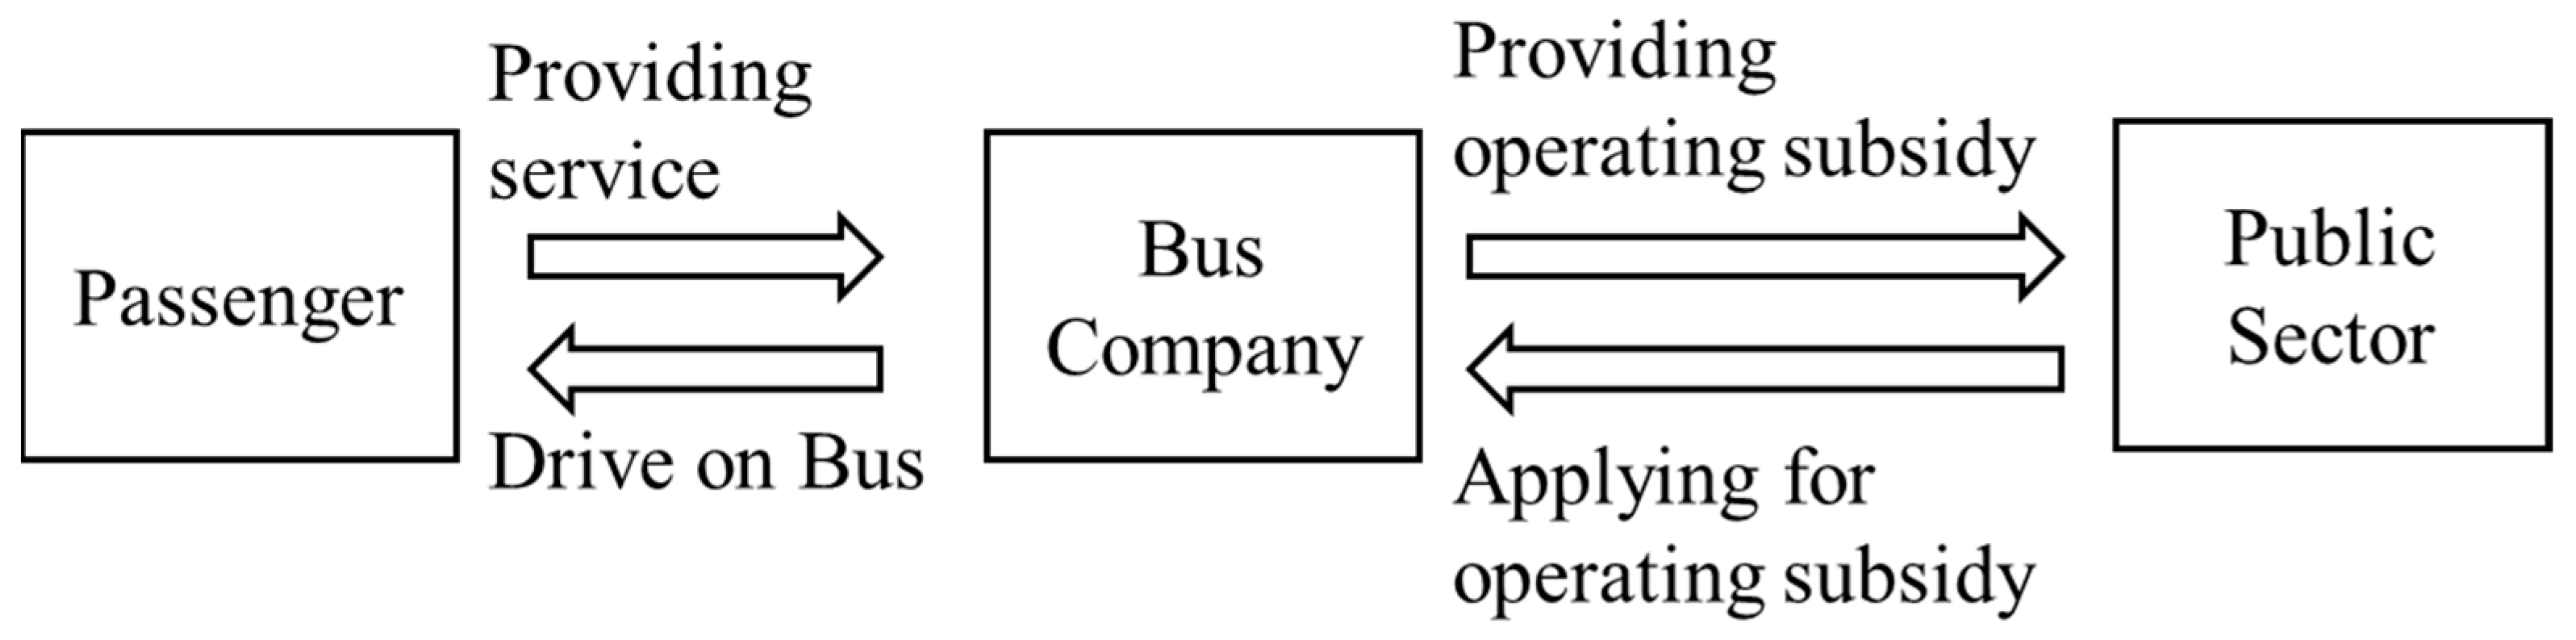
12]. Bus operations involve the three major players shown in
Figure 1, which are the public sector (supplier), bus companies (producers), and passengers (consumers).
In a bus operation, a bus company operates a specific bus route for the public (passengers) to take. Passengers can pay their fares in cash, or through electronic ticketing systems developed by the bus companies and the government, in which passengers swipe smartcards (such as the iPASS or EasyCard) when they board. Such card payments are a part of a collaboration with the county and city governments [
13]. The bus companies’ main source of income is the bus fares paid by passengers in cash or through cards. However, since operating costs are often higher than their income, bus companies may seek operating subsidies from the public sector for them to continue their services. When the public sector receives a bus company’s request for subsidies, they seek an appropriate legal basis for budget planning and publicly announce the justification for the subsidy application, along with the subsidy measures. Afterward, when the public sector receives a company’s application for subsidies, they perform evaluations according to a loss subsidy, cost subsidy, and performance subsidy [
14]. After reviewing the application, the operating subsidy will be given to the bus company for them to continue their services. With assistance from the public sector, bus companies can then provide services in a sustainable manner, realizing the public’s need to continuously use public transportation, as well as enhancing the protection and sustainability of the environment.
2.1. Government Subsidies for Public Transportation
Owing to the lack of investments and utilization of public transportation, the growth of private transportation has accelerated in recent years, and exacerbated traffic congestion in cities. Currently, public transportation operated by the government or private companies typically generates operating losses, which reduces their ability to provide quality, effective services for passengers. Under such circumstances, governments of various countries have used tax revenues to promote the development of public transportation and subsidize public transportation companies.
Worldwide public transport is highly subsidized by public authorities to cover the difference between passenger fare revenues and operating costs [
14]. In the US, subsidies range from 57 to 89 percent of the operating costs for buses, and from 29 to 89 percent for rail transport [
15]. In the European Union, transport subsidies amounted to about €270 billion in 2005 [
16]. In Germany, from 2001 to 2012, the passenger share increased by approximately six percent and amounted to 48 percent by 2012, and the public transit sector covered 28 percent of operating costs by public subsidies [
17]. The Bandung government subsidy gives two models to a public transport operator, to show the effects of different subsidies on the profits for the operator and manufacturer in Indonesia, those two models are (i) the subsidy for buying a bus from an appointed public transport manufacturer, and (ii) the subsidy for reimbursing reduced ticket prices for passengers [
18].
To reduce losses and facilitate sustainable development, subsidies are allocated proportionally, according to regulations and review systems. The adoption of subsidies also enables companies to expand their range of services, through which they can increase social welfare while simultaneously overcoming traffic congestion in cities [
19].
2.1.1. Reasons for Subsidizing Public Transportation
Generally, there are five main reasons for subsidizing public transportation:
Public transportation provides many policy-based runs or routes serving rural areas, which could generate losses;
Transportation demand is characterized by peak hours, thus the design capacity must be able to handle peak hours. Therefore, overly high investment costs could easily result in idle resources during peak hours, generating losses [
20];
It is often difficult to fully cover the social costs produced by private transportation (such as air pollution, noise, and traffic congestion) through private transportation-related taxes. That is, the use of private transportation cannot reflect the cost that should be paid by the users. Moreover, there are also various government subsidies for private transportation, such as constructing roads, parking lots, and vehicle tax reductions, whereas there is a relative lack of subsidies for existing public transportation systems;
The negative impacts of public transportation on society are lower than those of small cars. Since this external benefit has yet to be reflected in user costs through the market mechanism, it could be compensated through subsidies [
21].
2.1.2. Methods of Subsidizing Public Transportation
As shown in
Figure 2, public transportation can be subsidized through non-monetary subsidies and monetary subsidies.
Non-monetary subsidies refer to subsidies given by the government to bus companies through administrative control measures in lieu of monetary methods or tax payments. This includes providing technical assistance for advanced public transportation systems, such as tangible smartcards and intangible dynamic information systems; installing bus lanes or implementing traffic signal prioritization, to improve the public transportation ecosystem; controlling competing transport, such as imposing higher license taxes or restricting the access of small vehicles into the city, and implementing tax relief measures on public transportation and infrastructure imports, vehicle fuel costs, and public transportation license taxes [
22].
- 2.
Monetary subsidies:
Monetary subsidies refer to subsidies given directly or indirectly by the government to bus companies to enhance their operating conditions. Monetary subsidies consist of user subsidies and operator subsidies.
Most users of public transportation are captive riders, such as those who live on the outskirts of a city, middle- to low-income groups, or elderly and disabled persons. To maintain social equity, income redistribution, and limit private vehicle use, public transportation should be subsidized, thus achieving social welfare-based objectives of transportation policies.
- (1).
User subsidy, also termed “rate subsidy”. Rates are controlled by the government through certain fare restrictions, and public transportation companies provide services based on such fares. The difference between the fare and the operating cost is subsidized by the government;
- (2).
Operator subsidy, this consists of capital subsidies and operating subsidies, both of which have different uses.
- A.
Capital subsidies:
As the costs of investing in public transportation systems are substantial, many companies are unable to recover their operating costs within a brief period. Therefore, the government would not only provide low-interest loans to public transportation companies, but also subsidize tangible equipment such as vehicle purchases or replacements, station renewals, or land purchases. In addition, the upgrading of computerized equipment for new smartcards is also subsidized.
- B.
Operating subsidies:
Operating subsidies can further be divided into three types according to the objective of subsidization:
As the term implies, when income does not compensate for operating costs and creates a deficit, the government will provide full or partial subsidies. Loss subsidies are the most conventional type of subsidy.
- (ii).
Cost subsidy:
The government subsidizes a certain amount or percentage of a company’s total operating cost or specific cost items. Subsidized items can be the total cost, fuel costs, or the operating costs of specific routes.
- (iii).
Performance subsidy:
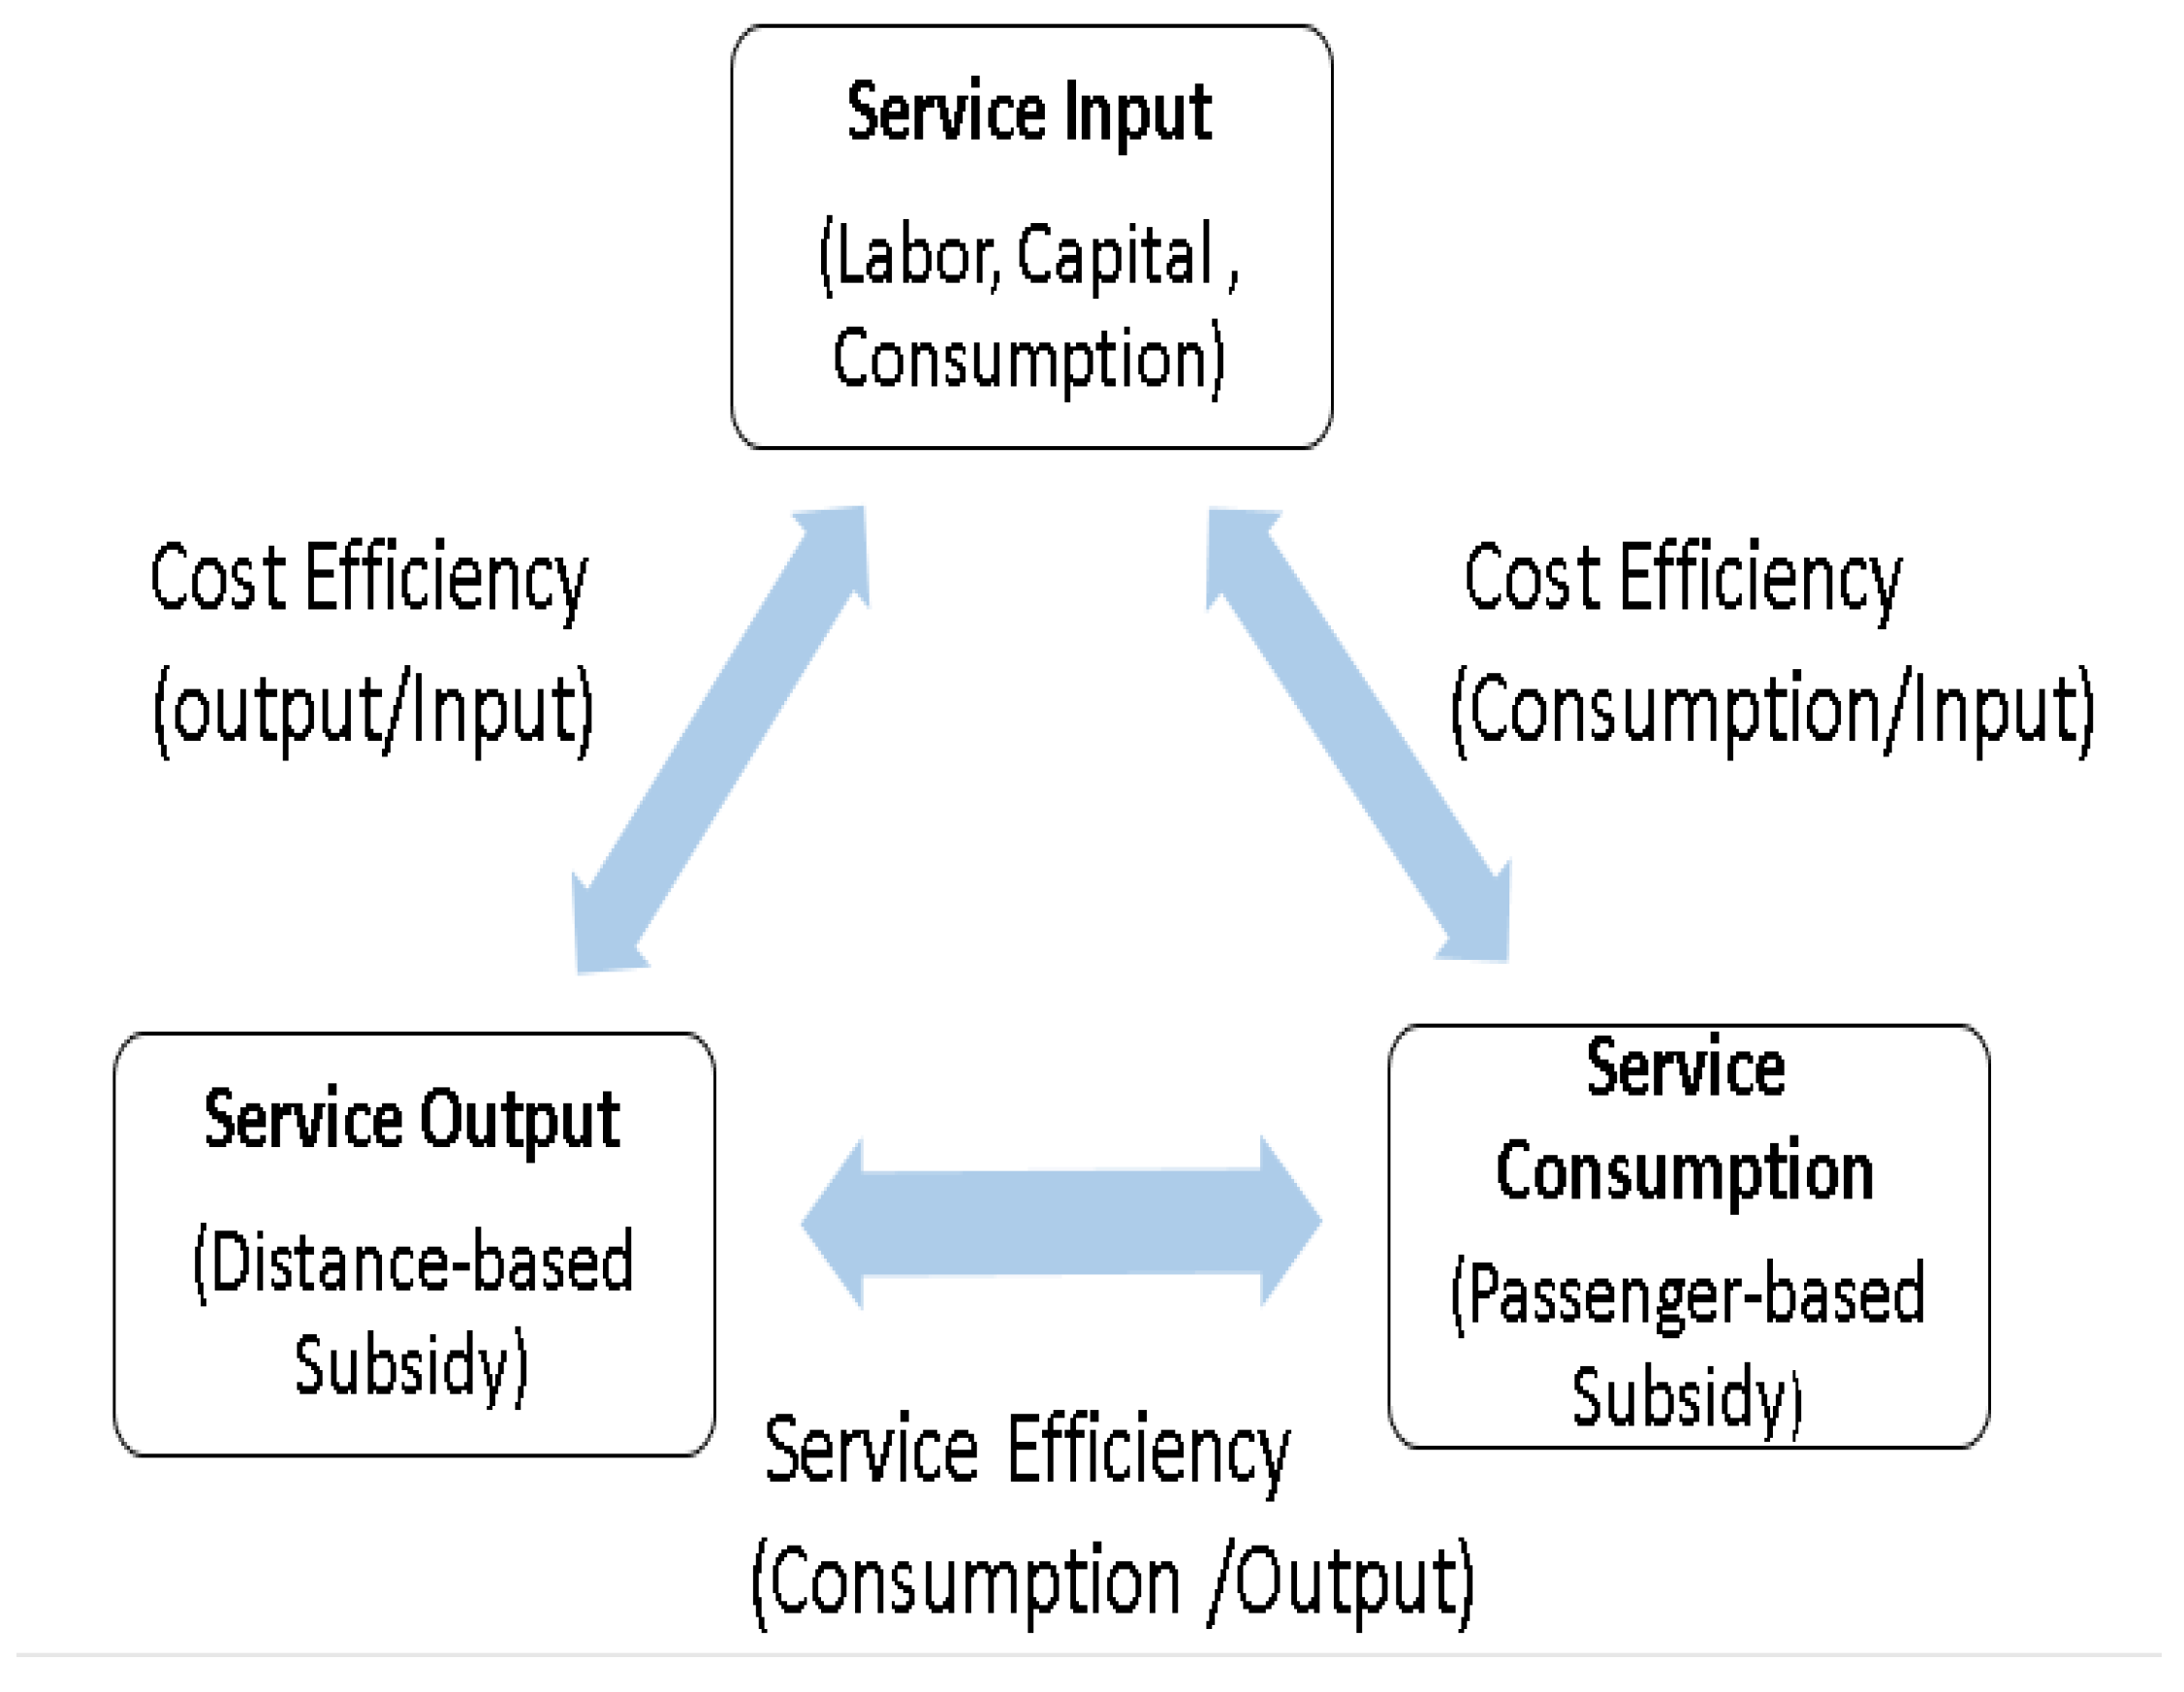
Also termed an “output subsidy”, a performance subsidy is evaluated based on the performance of public transportation in the overall environment, in which companies are evaluated and subsidies are allocated according to the evaluation items. There are many forms of performance subsidy, usually as the outputs (such as SPP or SPK, number of scheduled services, and vehicle duration), or the cost performance (such as cost-efficiency, cost-effectiveness, and service-effectiveness) of public transportation systems. (Additional evaluation items are specified as performance indicators in the “Provisions of the Taichung City Government on the Subsidization of Losses Incurred by City Bus Operators from Operating Routes with Special Services”).
A company’s operational performance indicators consist of three basic aspects: losses incurred by city bus operators (consumption, etc.); service outputs (such as time and distance-based subsidy policies (SPK)), and service consumption (such as passenger-based subsidy policies (SPP) and revenue, etc.), as shown in
Figure 3.
These three performance indicators should be applied as part of assessment of the advantages or disadvantages of, as well as the notes on, a subsidy policy. Fielding [
23] suggested that, while the use of cost-efficiency indicators incentivizes systems to focus on cost control and promote low-cost operations and services, it also can penalize systems with high-cost operations. On the contrary, the use of service-effectiveness indicators incentivizes systems to focus on full bus capacity but indirectly causes operators to reduce services with lower ridership, such as nighttime or weekend services. Using service-effectiveness indicators also has more benefits for operators in areas of high-density developments. The use of cost-effectiveness indicators incentivizes systems that attract passengers to make payments, as well as systems that attract other revenue sources, while also taking both systems into account. In sum, to assist the robust development of small-scale public transportation systems, cost-efficiency indicators should be the primary factor taken during subsidization; whereas, in large-scale public transportation systems, service-effectiveness indicators should be stressed during subsidization, as such systems already exhibit a certain degree of cost-efficiency [
24,
25,
26].
2.2. The Current State of Taichung City’s Public Transportation
Located in the central region of Taiwan, Taichung connects the flow of northbound and southbound people and goods from Taipei and Kaohsiung, which makes it an important transportation hub in Taiwan. The rapid growth of Taiwan’s economy over the past three decades has increased the country’s national income and socioeconomic activities. However, the lack of investment in the public transportation industry has accelerated private transportation ownership, which exacerbates transportation issues in urban areas. In addition to Taiwan’s high-density population, which is spread out in small areas, enhancing public transportation is the key to solving transportation issues.
At present, there are a total of 222 bus routes in Taichung City (excluding seven sub-routes and 16 shuttle buses) and nine jointly operated routes; 18 bus companies operate all these routes.
Taichung City has been proactive in developing its bus services, which has instilled in the public the habit of taking buses and reduced their likelihood of using private transportation. The competent authority responsible for the Taichung City Bus network is the Public Transportation Office of the Transportation Bureau of the Taichung City Government. To provide its citizens with convenient and comprehensive public transportation services, the Taichung City Government has continuously launched new routes and modified existing routes, thereby expanding the range of the bus network and increasing the mean monthly ridership from 4.6 million to over 10 million. Meanwhile, in accordance with the central government’s public transportation development-related plans, the citizens of Taichung have developed their habit of taking public transportation. Moreover, bus companies have substantially elevated the quality of their operations and services, as well as making significant investments in human resources and budgeting [
27].
We describe the Taichung City bus subsidy policy in New Taiwan Dollar amounts. We use the symbol “NT$” to represent the New Taiwan Dollar, as shown in the text.
The Taichung City Government has implemented a subsidy policy, based on price reductions, to encourage citizens to use public transportation and bus companies to enhance their transportation services and promote the use of smartcards. Passengers who swipe smartcards when they take a bus can enjoy a free ride for the first eight kilometers. As a result, buses have become one of the most popular modes of transportation among citizens in Taichung City. Since October 2005, the ridership of the Taichung City Bus has officially surpassed the 1.6 million mark, reaching 1,644,541. The main factor in achieving new ridership records is that passengers have become accustomed to swiping their smartcards to enjoy an NT
$20 fare subsidy for the first eight kilometers. This indicates that citizens have developed a habit of taking the Taichung City Bus as a means of travel [
28].
- 2.
The SPK subsidy policy of the Taichung City Bus
Taichung City experienced a change in the governing political party. The new mayor signed a fresh contract with bus companies, in which the range of a free ride was extended to ten kilometers. The goal of the SPK subsidy policy was to enhance the range of services provided by the Taichung City Bus as well as ensure the rights of citizens in the coastal and rural areas of the city. Although the range of free ridership was increased under the SPK subsidy policy, the pre-existing NT$20 subsidy per ride was decreased to NT$3. Furthermore, the respective 25(NT$/km), 39(NT$/km), and 45(NT$/km) subsidies for “Golden Routes”, “Conventional Routes”, and “Policy-based Routes” were comprehensively changed so that important routes in the city, mountainous, and coastal areas, as well as the Tun District, were included in the range of free rides. In so doing, the city government aimed to encourage citizens to use public transportation and achieve the sustainable development of public transportation.
The objective of this study is to provide an explanation and analysis of the performance subsidy dimension of an operating subsidy. As the former and new subsidy policies employ the same loss subsidy method, comparing the two would be rather insignificant. Concerning the performance subsidy dimension of the operating subsidy, the SPP approach was employed under the SPP subsidy policy, while the SPK approach was employed under the new policy. Hence, the performance subsidy dimension of operating subsidy is the focus of this study, in which the impacts of the implementation of the two policies on the bus companies and the passengers were discussed. Such impacts also generated various responses. The following is a comparison of the former and new Taichung City Bus subsidy policies given to bus companies as shown in
Table 1 and
Table 2.
The former and new policies for the three dissimilar subsidies given to bus companies are described as follows and organized as
Table 2:
- (1).
Operating subsidy policies for “Golden Routes”:
- A.
SPK subsidy policy:
Assume that a “Golden Route” has 50 runs a day, covers a distance of X km, has a ridership of Y passengers per run, and all passengers alighted within the range of free rides (no additional fare paid). Therefore, according to the ten-kilometer subsidy policy for “Golden Routes” (NT
$25 given per bus kilometer) a bus company receives:
- B.
Comparison with the SPP subsidy policy:
Assume that each run has a ridership of Y passengers.
Therefore, according to Formulas (1) and (2), when (1250/850 = 1.47) < Y/X, then when a bus company exceeds one passenger per kilometer, it will receive a lower subsidy through the SPK subsidy policy compared to the former (SPP subsidy) policy.
- (2).
Operating subsidy policies for “Conventional Routes”:
Assume that a “Conventional Route” has eight runs a day, covers a distance of X km, has a ridership of Y passengers per run, and all passengers alighted within the range of free rides (no additional fare paid). Therefore, according to the ten-kilometer subsidy policy for “Conventional Routes” (NT
$39 given per bus kilometer) a bus company receives:
Assume that each run has a ridership of Y passengers.
Therefore, according to Formulas (3) and (4), when (312/136 = 2.29) < Y/X, then when a bus company exceeds two passengers per kilometer, it will receive a lower subsidy through the SPK subsidy policy compared to the former (SPP subsidy) policy.
- (3).
Operating subsidy policies for “Policy-based Routes”:
Assume that a “Policy-based Route” has seven runs a day, covers a distance of X km, has a ridership of Y passengers per run, and all passengers alighted within the range of free rides (no additional fare paid). Therefore, according to the ten-kilometer subsidy policy for “Policy-based Routes” (NT
$45 given per bus kilometer),
Assume that each run has a ridership of Y passengers.
Therefore, according to Formulas (5) and (6), when (315/119 = 2.65) < Y/X, then when a bus company exceeds two passengers per kilometer, it will receive a lower subsidy through the SPK subsidy policy, compared to the former (SPP subsidy) policy.
Table 2.
Comparison of the former and new operating subsidy policies.
Table 2.
Comparison of the former and new operating subsidy policies.
| | Subsidy Policy | Assumptions | Break-Even Point of Favored Policy |
|---|
| Golden Routes | SPK subsidy policy | 1. 50 runs per day
2. Covers a distance of X km
3. Y passengers per run | Less than one passenger per kilometer |
| SPP subsidy policy | 1. 50 runs per day
2. Y passengers per run | More than one passenger per kilometer |
| Conventional Routes | SPK subsidy policy | 1. 8 runs per day
2. Covers a distance of X km
3. Y passengers per run | Fewer than two passengers per kilometer |
| SPP subsidy policy | 1. 8 runs per day
2. Y passengers per run | More than two passengers per kilometer |
| Policy-based Routes | SPK subsidy policy | 1. 7 runs per day
2. Covers a distance of X km
3. Y passengers per run | Fewer than two passengers per kilometer |
| SPP subsidy policy | 1. 7 runs per day
2. Y passengers per run | More than two passengers per kilometer |
2.3. Customer Complaints Regarding Public Transportation
Bus transportation services are an integral part of public services, which emphasize the understanding of feedback from passengers and meeting their needs. That is, the current government needs to listen to and prioritize the opinions of passengers. In today’s public sector, customer opinions are an inevitable part of the job. Even though public participation is neither a panacea nor a method for meeting the ideal circumstances desired by passengers, it remains the foundation of a democratic system, as customer feedback can promote reforms in the public sector. The challenges and impacts of changes brought about from the interaction between the public and private sectors create new cooperative relationships between the government and the public. Consequently, public participation in public decision-making has resulted in the concept of public governance. Under this concept, governing is no longer exclusive to the government but involves interaction between the government, companies, and non-profit (or non-governmental) organizations [
29,
30].
Without a doubt, understanding and analyzing each passenger’s opinion and complaint allows public managers to comprehend the possible preferences of the public on certain public issues. Moreover, such feedback supplements public opinion collected through traditional channels of public participation, such as opinion polls, forums, public hearings, seminars, and news media. Understanding beforehand the social context behind such issues and public preferences allows governments to take precautionary measures and preparations. Therefore, the extensive online involvement of passengers in public affairs cannot be overlooked and is of utmost importance, as it provides insights into passengers’ public participation and political behavior [
31]. A bus company typically must undergo the following processes to provide bus services to the public (see
Figure 4):
The bus company applies to operate a bus service, or the public sector designates a route and calls for a tender among bus companies;
The public sector will form a right-of-way review committee that examines the application submitted by the bus company. Once it is approved, the public sector will issue the right-of-way license to the company and notify passengers of the approved route;
Based on the right-of-way licenses and opinions of the public sector’s right-of-way review committee, bus companies provide service content (such as accessible buses, step-entrance buses, energy-saving and noiseless electric buses, new bus stop signs, and comfortable bus shelters) that is in line with relevant bus-related regulations to provide comfortable rides to passengers;
Passengers can choose the routes they wish to take according to their own needs;
When passengers feel dissatisfied after they have taken a ride, or when they have suggestions, they will give user feedback to the public sector;
When the public sector receives passenger complaints, they would require the bus company involved to make improvements and formulate plans and strategies according to the passengers’ suggestions to enhance the city’s public transportation services.
Figure 4.
Customer service relations in public transportation services [
32].
Figure 4.
Customer service relations in public transportation services [
32].
When passengers are more familiar with taking the bus, their demand for better services is increased. If they are unsatisfied with a company’s quality of service, they will use various methods (such as the mayor’s mailbox, director-general’s mailbox, 1999 hotline, and social media) to express their opinions. After the public sector has received a passenger complaint, they will classify the case and assign it to an employee who will assess the shortcomings of the bus company in question. The company will be fined according to the right-of-way agreement, or relevant traffic regulations, for its poor services.
Providing diverse channels for making complaints will lead to an increase in the number and complexity of cases. For the public sector, handling such cases through traditional complaint procedures illuminates the need to improve the efficiency of complaint handling, or else employees spend too much time and effort on these tasks. For a bus company, more fines imposed on them will increase their operating costs, which impacts their revenue and the salaries of their employees (drivers), ultimately reducing the company’s quality of service.
Information and communications technology and the Internet have a distinct significance for participatory governance. Technology has expanded the public’s scope of expressing their opinions and elevated the public sector’s innovative ways to meet the needs of the public. Despite the growth of technology, it has become more difficult to collect the opinions of the public that are expressed online. In light of the reinforcement of Taiwan’s democratic growth and the rapid growth of information technology, all levels of the government collect data not only through traditional methods of public participation (such as opinion polls, forums, public hearings, seminars, and news media), but also through information technology-based channels (such as online forums, the chief’s mailbox, social media, and call centers). These technological means are convenient ways to collect data and provide responses, thus facilitating the public sector’s unified collection of public opinion and complaints.
Typically, customer opinions and feedback can be conscious or unconscious and depend on whether customers are aware that they are providing a third party with information on their experience. Generally, companies can directly collect and obtain customers’ opinions and explicit feedback through platforms such as phone calls, email, or online forums. Companies may also obtain the customers’ implicit opinions and feedback by collecting data on their consumption behavior, such as riding and consumption habits [
33,
34,
35,
36].
Keywords may be used to identify customer needs through customer complaints. For example, Zhang et al. [
35] utilized the frequency of terms to determine issues of concern among customers. The activities, resources, and context (ARC) framework integrates customers’ experiences and opinions obtained through companies’ interactions with clients. The ARC framework, which assisted with the development of the text-mining model in this study, allows companies to evaluate the effects of interactive service processes with customers.
Private companies highly value the feelings of their customers. To provide services to the public and understand their needs, government organizations in Taiwan implemented the “1999 Public Service Hotline” in 2005, with Taipei City being the first to do so. This first-generation call center had 31 employees, providing 50,000 call services per month. A plethora of services are offered by the public service hotline, including complaints and reports, administrative consultation services of counties and cities, road problems, social welfare consultations, traffic network consultations, and travel guide introductions.
As a special municipality, Taichung City launched its 1999 hotline with the primary function of solving the public’s questions regarding various policies. The single and easy-to-remember 1999 phone number simplified the previous toll-free 0800 number and integrated the phone lines of all units of the city government. At present, users in Taichung City do not have to pay for the first five minutes of a 1999 call. In addition, 1999 SMS services are offered for the hearing impaired. The hotline provides Taichung citizens with solutions for various non-emergency affairs, such as complaints, consultations, bus-related queries, bus service status feedback, and others.
According to the Provisions of the Taichung City Government on the Subsidization of Losses Incurred by City Bus Operators from Operating Routes with Special Services [
37], bus-related traffic offenses include “delays”, “skipping stops”, “running a red light”, and “others”. In this study, “others” are further divided into “issues with the bus dynamic information system”, “dangerous driving”, “vehicle problems”, “poor service attitude”, “braking sharply or starting abruptly”, “speeding”, “unclear information”, and “unauthorized detours.” The definitions of the terms are as follows:
Issues with the bus dynamic information system: incorrect information is provided by the bus announcement system and dynamic information system;
Dangerous driving: passengers are exposed to danger due to the driver’s failure to follow traffic rules;
Vehicle problems: poor sanitation of the bus or dirty emissions caused by engine problems;
Delays: bus service started over ten minutes later than scheduled;
Poor service attitude: poor attitude of driver or the company’s customer service attendant;
Braking sharply or starting off abruptly: driver started the bus too abruptly and failed to notice if passengers are seated or standing properly;
Speeding: driver failed to drive according to traffic rules and went beyond the speed limit;
Skipping stops: driver failed to stop and pick up passengers at a bus stop;
Unclear information: unclear information and signs on the bus service;
Unauthorized detours: driver failed to follow the timetable or serve the designated route;
Running a red light: driver failed to stop at a red light as per traffic rules.
2.4. T-Test
From 1 January 2016, the Taichung City Government signed a new contract with bus companies and officially replaced the SPP subsidy policy with a new one. In this context, this study explored the impacts of Taichung City’s former and new subsidy policies on customer complaints. This work collected complaints made within a six-month range before and after the policy change. Logically, the method of statistical analysis employed should be the matched sample t-Test approach. However, upon examination of the actual bus operations, the former policy (SPP subsidy, which subsidized the first eight kilometers) covered the articulated buses of the bus rapid transit (BRT) Blue Line. In comparison, the SPK subsidy policy (which subsidizes the first ten kilometers) replaced the BRT Blue Line with optimized dedicated bus lanes for the original BRT buses (which were changed to Route 300), as well as conventional buses operating Routes 301 to 308. Consequently, these differences meant that the dependence between the two groups of samples was significantly diminished.
The differences between the two groups indicated that matched sample t-Tests were unsuitable for the data in this study. Therefore, independent sample t-Tests were used instead to validate whether the means of the types of customer complaints between the two policies were consistent.
To conduct a t-Test, it is necessary to check whether the population has a normal distribution, and if the variances of the two groups of data are consistent. Typically, when a sample size is large enough (n > 30), the central limit theorem states that it can be regarded as a normally distributed population. As the effective sample size of both groups in this study was 184 days, the central limit theorem can be employed; hence, this study only needed to check whether the variances were consistent to determine which test statistic should be used.
2.5. Geographic Information System (GIS)
In addition to the aforementioned traffic offenses, each complaint case often includes the geographic features and information of the place where the offense was made. This study first performed t-Tests to determine the types of offense with significant features. Then, density estimation methods were used to present the results in a GIS before and after the implementation of the SPK subsidy policy.
A GIS integrates the fields of geography, cartography, surveying, and computer science, and is used in the integration of geographic and spatial techniques in different fields. It can be used in urban and regional planning, transportation management, as well as the formulation, prediction, analysis, and evaluation of transportation policies [
38]. That is, GIS is a supplementary tool for the analysis of problems with geographic factors or spatial data.
GIS offers a wide range of applications, and can be used for public transportation planning, analysis of designated bus stops, vehicle route planning, vehicle positioning and navigation, and other intelligent transportation systems. In general, the various spatial data and attributes of a road’s geographic location (such as its position or length), as well as the correlation of an administrative district’s geographic location and transportation conditions (transportation volume), can be used together with computers to perform analyses on various economic and social benefits.
A GIS has multiple features, such as spatial positioning, multiple dimensions, a dynamic state (changes over time), big data capability, and an information database. In addition, it can be used to:
Analyze transportation routes and network hubs formed by intertwined networks of traffic and transportation information;
Perform regional analysis after collecting sectional features (such as the ridership of and stops covered by vehicles) and connectivity (intersections) of traffic information;
Reinforce the changes in time as the collected data rely on changes in the position of vehicles on transportation routes. Since vehicles are always on the move, changes occur at a faster pace as a result. In particular, a multitude of information can be collected from a stop.
Data pertaining to the application of GIS in buses can be divided into data with non-spatial attributes (such as the timetable of a route, the basic information of a bus company, bus schedules, vehicles, and vehicle registration information) and data with spatial attributes (such as the route covered by a bus service, location of bus stops, distance covered by a route, and the place where a customer complaint was made about a bus).
In this study, kernel density estimation was performed in a GIS on the spatial data pertaining to the place where a customer complaint was made about a bus. The regions where the complaints were made were analyzed to determine the impacts of the change in bus subsidy policy on passengers, which served as a basis for determining the impacts of the change on the public.
Methodology of Kernel Estimation
In general terms, researchers must assume a range to serve as a basis for statistical analysis.
However, in practice, the random sampling of data samples follows a particular distribution in all possible categories. According to experience and theory, in a parametric model, a wide gap often exists between this basic assumption and the actual physical model, and such methods may not necessarily generate satisfactory results. Therefore, Rosenblatt [
39] and Parzen [
40] proposed kernel density estimation, a nonparametric estimation approach. Kernel density estimation is a method that does not exploit the a priori knowledge of the hypothesized data distribution of each item, that is, no assumptions are made on data distribution, and the distribution features are directly extracted from the data samples.
In brief, kernel density estimation is a nonparametric validation method that is used to estimate an unknown density function based on probability theory [
41].
x1….xn is an independent and random sample with a consistent probability density function
,
x∈(−∞,∞). In Equation (7), when
is unknown,
n is the sample size;
is a sequence of positive numbers infinitely close to zero;
is the smoothing parameter;
K is the kernel density function;
K(
u) is defined as a kernel function on (−∞, +∞);
is a bandwidth in which
> 0 is a constant, and
is the kernel density estimation function. The pseudocode related to kernel estimation shows in the
Appendix A.
3. Data Procedure
The research procedure of this study consists of data collection, data filtering, data analysis, data visualization, and results summarization, as shown in
Figure 5.
3.1. Data Collection
Data were collected through 1999 calls made by the public, email, and bus-related feedback records. That is, the passenger complaint data of this study were sourced from the public sector’s raw data pertaining to passengers’ complaints [
42].
3.2. Data Filtering
After receiving the public sector’s raw data pertaining to passengers’ complaints, a systematized and automatic approach was used to collect and omit the passengers’ personal information. As a result, data such as the case number, time of the complaint, objective of the complaint, content of the complaint, type of offense, and place of offense were retained.
3.3. Data Analysis
According to the filtered passengers’ complaint data, there were 184 cases during the half-year period when the SPP subsidy policy was in effect, while there were 184 cases during the half-year period when the SPK subsidy policy took over.
Table 3 shows a comparison of the frequency of each type of customer complaint in the former and new subsidy policies. The three major types of complaints under the SPP subsidy policy were delays (1537 times), skipping stops (1033 times), and issues with the bus dynamic information system (981 times). There were 5429 complaints in total. The three major types of complaints under the SPK subsidy policy were delays (1917 times), issues with bus dynamic information system (1408 times), and skipping stops (1213 times). There were 6935 complaints in total.
- (1).
Total analysis
For the statistical analysis, matched sample
t-Tests were first performed on the complaint factors to analyze the differences. In
Table 4, the t-statistic of the
t-Test of the former and new subsidy policies (with an equal number of cases) was −8.574, and the
p-value was 0.000 (<0.05), which indicated a significant difference. The mean number of cases (29.51) in the SPP subsidy policy was lower than that (37.69) of the SPK subsidy policy.
The total analysis of complaints showed that there were significant differences between the complaints in the former and new subsidy policies. Each type of complaint was individually analyzed to examine which type had significant differences. However, the sample size for “braking sharply or starting off abruptly”, “unclear information”, “unauthorized detours”, “running a red light”, and “vehicle problems” was too small, as the mean sample size for each type of complaint in the former and new subsidy policies was less than one case. Therefore, these types were not included in subsequent matching, that is, the analysis of difference was performed on only six types of complaints.
- (2).
Separate t-Tests
As shown in
Table 5, the t-statistic (
p-value) of “issues with bus dynamic information system”, “dangerous driving”, “delays”, “poor service attitude”, “speeding” and “skipping stops” was −6.781 (0.000), −1.983 (0.049), −5.389 (0.000), −2.059 (0.041), −6.418 (0.000), and −3.353 (0.001), respectively. The differences between all six types of complaints were significant since the
p-values were smaller than 0.05.
- (3).
Kernel density estimation
In this study, the place where each type of complaint had occurred in the former and new subsidy policies was specified as X1….Xn. Each place was an independent geographic information feature that had the same probability density function f(x). ArcGIS Spatial Analyst Tool was used to generate the density (severity) of each type of complaint in the former and new subsidy policies and present the final results in the GIS.
The relevant programming language is as follows:
importarcpy
fromarcpy import env
from arcpy.sa import *
# Bus complaint data (environment settings)
env.workspace = “C:/buscomplaint/data”
# When 8KM style then searchRadius is 8; When 10KM style then searchRadius is 10
searchRadius = 8
# Execute KernelDensity
outKernelDensity= KernelDensity(“8km.shp”, “NONE”, 60, search Radius, “SQUARE_KILOMETERS”)
# Save the output
outKernelDensity.save(“C:/buscomplaint/output”)
3.4. Data Visualization
Kernel density estimation was used to generate the density of each of the six types of complaints with significant differences in the former and new subsidy policies. The results were presented in the GIS with a brief description of the reasons provided.
Bus routes were altered following the change in subsidy policy. Regarding routes that were frequently altered, drivers would purposely delay their services or skip stops to arrive at every stop on time. Consequently, the bus dynamic information system is unable to display real-time information, which causes passengers to miss their bus.
According to Wilkinson and Friendly [
43], heat maps can be used to display the distribution and density of complaints regarding the bus dynamic information system under the former and new subsidy policies.
Figure 6a shows that under the SPP subsidy policy, most of the complaints had occurred on the outskirts (Zone A) and center (Zone B) of the city. In
Figure 6b, there is an overt decrease in the number of complaints in Zone A. However, the total analysis of both policies showed that in terms of density, most complaints had occurred in specific areas when the SPP subsidy policy was in effect, while the complaints were distributed outwards when the SPK subsidy policy was implemented.
- 2.
Dangerous driving
The new SPK policy drastically changed the attitudes of bus companies toward receiving subsidies.
Figure 7a shows a heat map of complaints under the former SPP policy, where bus companies had to adjust their level of service by emphasizing ridership. To achieve ridership goals, bus drivers would have to strictly abide by traffic rules as they drive. In
Figure 7b, however, after the SPK subsidy policy was implemented, bus companies tended to focus only on the accumulated mileage and neglected the feelings of passengers from the outskirts (Zone A), which increased their propensity for dangerous driving.
- 3.
Delays
Bus companies perceived that the SPK subsidy policy was more beneficial for routes that served ten kilometers or less as the performance subsidy was increased. As a result, they would perceive that it is more profitable to accumulate more mileage. To reach the subsidized mileage, drivers would start their services and arrive on time. However, assuming that no drastic changes occur to bus density and ridership, in the city area, the mileage of a route will fall short of the subsidy threshold, in addition to the high frequency of services. As a result, drivers would perceive that each run would be loss-making, which increases the severity of delays in the city area (Zone B). In Zone B, where more people use the bus compared to Zone A, given that the number of bus routes remains the same, bus companies would perceive that the SPK subsidy policy offers fewer subsidies than the SPP subsidy policy. According to
Figure 8a,b, even though the SPK subsidy policy is remarkably beneficial for specific outskirt areas (Zone A), it is unable to resolve the problems faced by many passengers.
- 4.
Poor service attitude
As shown in
Figure 9a,b, complaints regarding poor service attitudes had increased in Zones A and B. Without a doubt, the main reason for this is because the companies had changed their service orientation to comply with the SPK subsidy policy, thereby attracting complaints from passengers. Since the SPK subsidy policy is based on mileage, bus companies would overlook the rights and feelings of passengers to obtain subsidies.
Under the new SPK subsidy policy, companies were no longer passenger-centric and became mileage-centric. Regardless of whether passengers were from Zones A or B, their ride experience was adversely affected, thus increasing the proportion of complaints about the poor attitudes of drivers.
In addition to the proportion of complaints about poor driver attitudes, the heat maps indicated that the complaints were relatively more spread out following the implementation of the SPK subsidy policy.
- 5.
Speeding
The service orientation of bus companies had changed following the changes in the performance subsidy. As the former ridership-based subsidy policy was replaced by the new mileage-based subsidy policy, drivers would tend to go beyond the speed limit to effectively obtain more subsidies. As shown in
Figure 10a,b, the number and density of complaints had increased in Zones A and B.
- 6.
Skipping stops
Similar to delays and speeding, the new criteria for subsidies had caused drivers to pay more attention to the accuracy of stopping at a bus stop in the long-distance sections of a route. In the SPP subsidy policy, longer routes covered areas with fewer riders than the city area. Hence, drivers were unable to effectively obtain subsidies and tended to skip stops. After the implementation of the SPK subsidy policy, drivers had to focus on their stop accuracy in outskirt areas to attain the mileage threshold for subsidies.
According to
Figure 11a,b, given that there are still more passengers in Zone B than Zone A, drivers who operate routes in the city area would develop the mentality that since they are unable to receive subsidies, they might as well save fuel costs by skipping stops. Even though companies who operate routes that are within ten kilometers should be relatively more able to receive subsidies, once they go beyond ten kilometers, their income would be based on the fares paid by the passengers. Since there are fewer passengers from Zone A, drivers would tend to skip stops as an attempt to save on fuel costs.
3.5. Managerial Implications and Summary of Findings
This study examined the impacts and managerial implications of the former and new subsidy policies on customer complaints regarding public transportation. The following is a summary of the findings:
The public would initially regard the SPK subsidy policy as superior to the SPP subsidy policy, but after experiencing it for half a year, differences in the number of complaints started to surface among passengers from the outskirts and city area.
With regard to passengers from the city area, the number of complaints increased significantly during the implementation of the SPK subsidy policy, which indicated that they were dissatisfied with the level of service provided by bus companies under the SPK subsidy policy.
Regarding passengers from the outskirts, the number of complaints decreased during the implementation of the SPK subsidy policy, which indicated that they were satisfied with the level of service provided under the SPK subsidy policy.
The main difference is that under the SPK subsidy policy, bus companies would overlook ridership to accumulate mileage in a quicker fashion. Consequently, they tended to neglect the quality of service in the city area as there are more passengers there. On the contrary, as there are fewer passengers in the outskirts, they can maintain the quality of their service in those areas. Bus companies also have a better reception toward the SPK subsidy policy; hence, there is a significant difference between the perceptions of passengers in the outskirts and city area.
The aforementioned explanations also validated the results of Taylor; they will likely result in an uneven geographical distribution of funds, which is usually politically unpopular and creates pressure to weaken or abandon the performance-based allocation program [
11]. The different methods of subsidizing bus companies for their performance indeed reflect the perceptions of different zone’s passengers. The findings of this study are summarized in
Table 7.


