Article

Study on River Protection and Improvement Based on a Comprehensive Statistical Model in a Coastal Plain River Network

Zhejiang Institute of Hydraulics and Estuary (Zhejiang Institute of Marine Planning and Design), Hangzhou 310020, China
*
Authors to whom correspondence should be addressed.
Sustainability 2024, 16(9), 3518; https://doi.org/10.3390/su16093518
Submission received: 15 March 2024 / Revised: 15 April 2024 / Accepted: 21 April 2024 / Published: 23 April 2024
(This article belongs to the Special Issue Advances in Sustainable Hydraulic and Water Resource Engineering)

Abstract

:
When considering the contradictions between river management and protection in a typical plain river network, it is always confirmed that the river area has usually been encroached upon due to the development of human society. Based on the analysis of multiple attributes of the river network, a statistical model has been proposed in this study in order to determine the river network protection indices such as river area ratio, storage capacity and flux. In this study, a numerical method is proposed to improve the structure and connectivity of the river network by calculating the occupation and supplement balance. According to the principle of water area dynamic balance, the river network structure and its connectivity are improved through water area adjustment in a typical coastal city. As the simulation results show, the water surface ratio equals 8.17%, the storage capacity equals 112.6 million m3 and the water flux equals to 656.06 m3/s in the selected study area. The flood drainage capacity is introduced as the priority function, other functions are also improved due to river management and protection. The harmonious and sustainable coexistence between human society and the river network is then promoted. This comprehensive statistical model proved to be a good tool for the coastal area to enhance the comprehensive attributes of the coastal plain river network and the sustainable development of the local area in the future.

1. Introduction

The coastal plain river network is always recognized as the key area of regional society and economy due to the high concentration of local people and enterprises [1,2,3,4]. Indeed, in coastal provinces such as the Zhejiang and Jiangsu provinces in China, the plain river networks are important to the sustainability of the local society, hence, the local government and people usually focus on the water environment and the dynamic balance of the coastal plain river network. As a result, the conflicts between domestic water resource supply and demand are always significant. Generally, due to the importance of the water resource and water ecological environment, the coastal plain river networks play a critical role in maintaining the stability and sustainability of the regional environment, economy and society [3,4,5,6,7]. Since the area of the plain river network is usually located downstream of the river basin, with the rapid development of the local society and the continuous improvement of urbanization, the contradiction between river network protection and local development becomes the most prominent factor that impacts both the regional society and the environment [7,8]. In this study, Pinghu City was selected as a typical coastal city, whose river network is located downstream of southeast China, as shown in Figure 1, and has suffered from water environmental problems for years. Therefore, it is important for Pinghu City to protect the water environment of its river network along with the development of the local economy and society [8,9,10,11,12].
As a natural resource composed of river water area, water quantity, water quality and river function, all of these factors are important for the local society. For example, irrigators will be concerned about water quantity and quality, while geographers and town planners will be concerned about river area in terms of development opportunity and sustainability. Generally, the coastal plain river network has its own unique factors, which can be divided into economic factors, social factors and ecological factors [12,13].
As one of the important supporting elements of human society and economy, the river network is important for both social and economic functions, which not only create a variety of human products but also provide security and sustainability for human society and economics [10,11,12,13,14]. On the one hand, rivers in different locations occupy specific geographical spaces since the rivers’ locations are usually fixed. With the development of human society and economics, the water quality requirements are usually increasing, which reflects the contradiction between limited resources and increasing human demands. On the other hand, rivers have different values and service functions based on their size, spatial layout, water quality and so on [12,13,14,15,16].

2. Analysis of Multiple Attributes of the River Network

During the process of river network resource utilization, remarkable social attributes of the coastal plain river network are established. Firstly, the development and utilization of the river network have significant characteristics; its local development and utilization will affect the social and ecological factors of the river network, while the attributes of the river network will also affect the local development and utilization [17,18]. Secondly, the diversity of stakeholders in the coastal plain river network is also critical. The river network resources have multiple ownership, which is vested in the Chinese central government, the province government, the city government or the village government based on the river level. Therefore, various methods of river network utilization are developed. Stakeholders usually have different demands on river network functions based on their different characteristics. Thirdly, the harmony between human society and the river network is also important as a result, the influence of social and economic development on the river network is increasing in intensity. The contradiction between human society and the river network is becoming more and more prominent. Nowadays, the river network’s functions, such as flood control, irrigation and drinking water supply, have been enhanced by its manager. Moreover, its importance for the social and ecological characteristics of human society has also been intensively developed over the last few decades [18,19,20,21,22].
As an important part of the local ecosystem, the river network has specific ecological factors. The river network is recognized as one of the fundamental elements of a terrestrial ecosystem, as shown in Figure 2, which was photographed by the authors using drones. It provides local conditions for energy input and output as well as material exchange and transfer. Secondly, the river network also has biological factors that have the capacity to produce plant and animal products. Thirdly, the purification of pollution is also considered one of the functions of the river network, though it is more important to deal with the source control of the local pollutant. The concentration of local pollutants that have been discharged into the river network will be reduced and degraded through diffusion, decomposition and other effects [21,22,23,24,25].
Generally, based on the above attributes of the river network, it is necessary to effectively protect and scientifically utilize the river network resources.

3. Methodology

Based on the current regional economic and social development situation, a typical coastal plain river network located in eastern China is selected in this study. The protection and function of this coastal plain river network are proposed to be divided into two aspects, as shown in Figure 3. Firstly, a comprehensive model is established by considering the water surface ratio (which is defined as the ratio of the water surface area to the local area), the total water volume and the total net flux of the river network. According to the social and economic requirements of the coastal plain river network, all of the previous three factors are included in the numerical model, which is used to determine the protection indicators of the coastal river network. The numerical model also provides the basis for river network protection and management. Secondly, the adjustment based on the dynamic balance of the river network is also considered in the present model. The coastal plain river network will be divided into several zones during the simulation. Then, the structure and connectivity evaluation model of the coastal plain river network in each zone will be adopted in order to calculate the water area, which is used to maintain the dynamic balance of the water area of the local river network. As a result, the structure status, functional attributes and developments of the coastal river network will be simulated and analyzed [24,25,26,27,28].

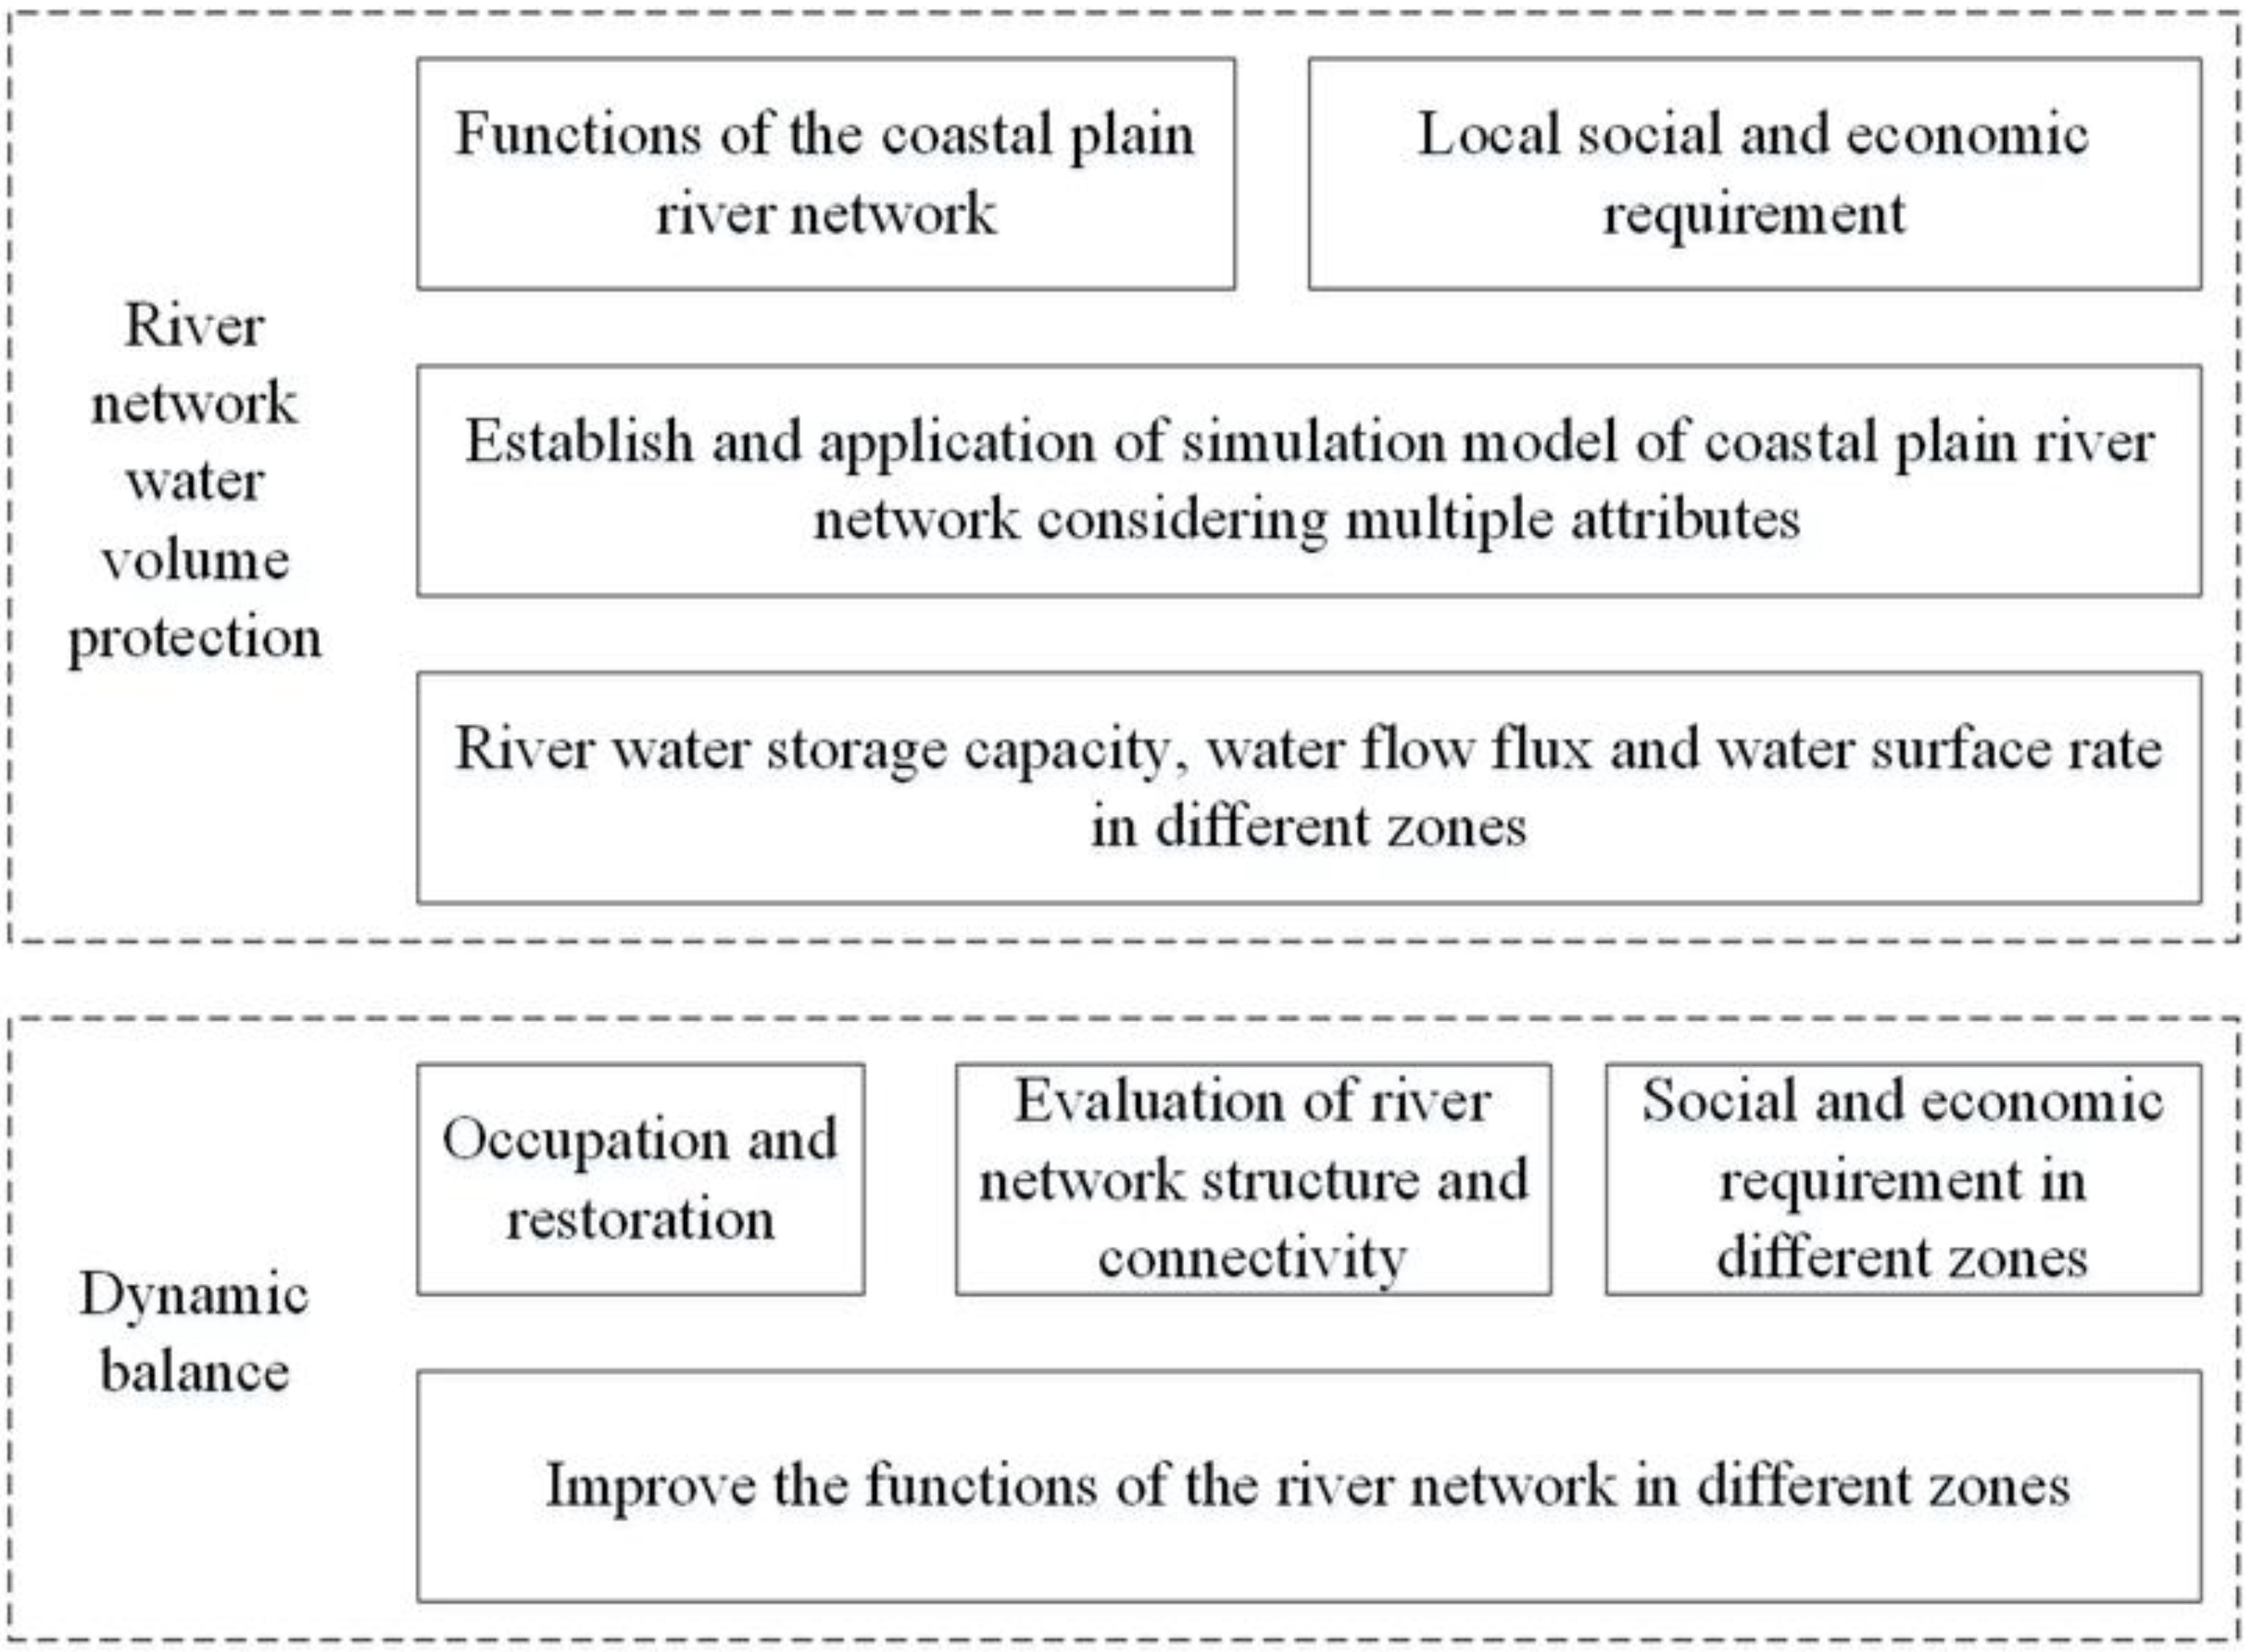
3.1. Comprehensive Model

As discussed by numerous previous studies, the coastal plain river network is usually multifunctional; its priority functions, such as environmental protection and economic development, mainly rely on three factors, which are recognized as the water storage capacity, water flow discharge and water surface ratio [26,27,28,29,30]. Hence, in this study, a systematic mathematical model combining the above three factors in the selected coastal plain river network basin is established. The comprehensive model is then given as follows:
The objective function is given as:
F 1 = V max = max ( V 1 V 2 V N )
F 2 = Q max = m = 1 M Q m
where Vmax is the maximum water volume (m3), Qmax is the maximum water flow discharge (m3/s).
The constraint condition is given as:
① Water volume constraint: The constraint on the total volume of the coastal plain river network consists of water quantity, water quality and ecology factors. Indeed, the variation in the water quantity and quality of the river network water will affect its functions tremendously. Both the water surface ratio and the dynamic balance are considered in the comprehensive model, and the typical model simulation time step is set to ten days. The water quality constraint is also recognized as the river network environmental carrying capacity, and the typical simulation time step of the environmental carrying capacity is set to one year.
In the present comprehensive model, the river network dynamic balance constraint is given as,
V ( t + 1 ) = V ( t ) + Q 1 ( t ) + Q 2 ( t ) Q 3 ( t ) W ( t ) Q R ( t )
Eventually, the constraints of the present model are given as:
V i = max V ( t ) , t T V i 0 ,   i = 1 , , N
where Vi is the storage required for the function of the river network (m3), Qm is the discharge of the local river network (m3/s), V(t), V(t + 1)are the storage capacity of river network during the simulation period (m3), Q1(t) is the water inflow into the study area during the simulation period (m3/s), Q2(t) is the runoff of the study area during the simulation period (m3/s), Q3(t) is the outflow water from the study area during the simulation period (m3/s), W(t) is the external water intake of the study area during the simulation period (m3/s), QR(t) is the water discharge generated by regression during the simulation period (m3/s), V0i is the minimum storage capacity of the river network (m3), T is the total length of the analysis and calculation period (s), N indicates the number of water functions, and M is the number of flood channels.
Based on the above constraint equations, all the constraints on the river network’s environmental carrying capacity are then given as:
( Q 1 + Q 2 + Q R ) C i n K V max C ( Q 3 + W ) C o u t W M
where K is the degradation coefficient, Cin is the average annual inflow concentration in the study area (mg/L), Cout is the average annual concentration of the outflow in the study area (mg/L), C is the average annual concentration of river water and WM is the sewage carrying capacity of river network (t).
② Water flux constraint: The river network is always important for alleviating the damage of flood disasters. The water flux of the coastal plain river network is not only affected by the instantaneous flood but also controlled by the boundary conditions during the flood disaster. In this study, a one-dimensional unsteady flow simulation model is established to represent the characteristics of the plain river network. Specifically, a popular hydraulic model is introduced, and the water flux of the river network during a flood disaster is simulated. The hydraulic model is given as follows:
The continuity equation is given as:
Z t + 1 B Q X = q
The momentum model is given as:
Q t + 2 μ Q X + A g Z X = U 2 A X g Q Q C 2 R
where Z(x,t) is the average water level of the section (m), Q(x,t) is the average flow rate of the section (m3/s), A(x,t) is the section area (m2), U(x,t) is the average velocity across the section (m/s), C is the Chezy coefficient, g is gravity acceleration (m/s2) and B is the mean river width of the section (m).
According to the control indices of the river network, such as storage capacity Vmax and flow discharge Qmax in the above equation, the regional water surface ratio R can be determined by the following model:
R = A 1 / A × 100 %
where A1 is the area of regional water and A is the area of the regional zone.

3.2. Evaluation Model of River Network Structure and Connectivity

Numbers of previous studies showed that the urbanization and industrialization of the local city will lead to the transformation of the coastal plain river network basin, while the spatial diversity of the plain river network will also become simplified, which is harmful to both the environment and ecology. However, when considering the basic function of the coastal plain river network, it is more effective to improve river connectivity rather than simply expand the water surface area. Therefore, in this study, the coastal plain river network structure is optimized by improving river connectivity, such as reducing the number of broken banks and enhancing the storage capacity and flux of the river network itself. Eventually, the evaluation model of river network structure and connectivity is given as follows:
(1)
The evaluation model of the river network structure is given based on previous research. The water surface ratio Rr, river length density Rd and river number density Rp are selected as the key indicators to evaluate the river network structure. Generally, the calculation model is given as:
R d = L r / A
R p = N r / A
where Rd is the river length density (km/km2), Rp is the river number density (rivers/km2), A is the local area (km2), Lr is the length of the river in the study area (km) and Nr is the number of rivers in the study area.
(2)
The river network connectivity evaluation model is given based on the connectivity degree of the landscape ecology; the junction points of rivers are defined as nodes, and the rivers between nodes are defined as river chains. Network closure (index α), line point rate (index β, defined as the ratio of local river nodes and chains) and river network connectivity (index γ) are calculated in the river network connectivity evaluation model, which is given as:
α = ( N 1 N 2 + 1 ) / ( 2 N 2 5 )
β = N 1 / N 2
γ = N 1 / 3 ( N 2 2 )
where N1 is the number of river chains and N2 is the number of nodes.

4. Case Study

4.1. Location and Characteristics

Pinghu City, located in southeastern China, is a typical coastal city. The river network in Pinghu City has played an important role in the local social and economic development in recent decades. The river network in Pinghu City has multiple functions, such as flood control, water supply, shipping and so on. Moreover, the population density of Pinhu city reached 1250 people/km2 in 2022, while the GDP reached 141 million Yuan/km2, both of which are relatively high in China, especially in southeastern coastal China. Therefore, with the high population and strong economy, the effective protection and scientific utilization of the river network in Pinghu City have become key considerations of the local government to maintain sustainable development.

4.2. Simulation Coefficients

(1)
The flux control index in the study area
The total area of the coastal plain river network basin in Pinghu City is 5900 km2. The flux control index, which is defined as the local river water storage capacity and the maximum flood control capacity considering the storage capacity of the nearby zones, is one of the key considerations of this study. Recently, the variation of the local underlying surface in Pinghu City has changed rapidly. As a result, the urbanization of Pinghu City has changed from 51.63% in 2012 to 66.98% in 2022. While the flood drainage capacity has also become lower than before and cannot meet the requirements of local social and economic development. Hence, the flood control indicators of Pinghu City have also become worse compared to nearby cities.
(2)
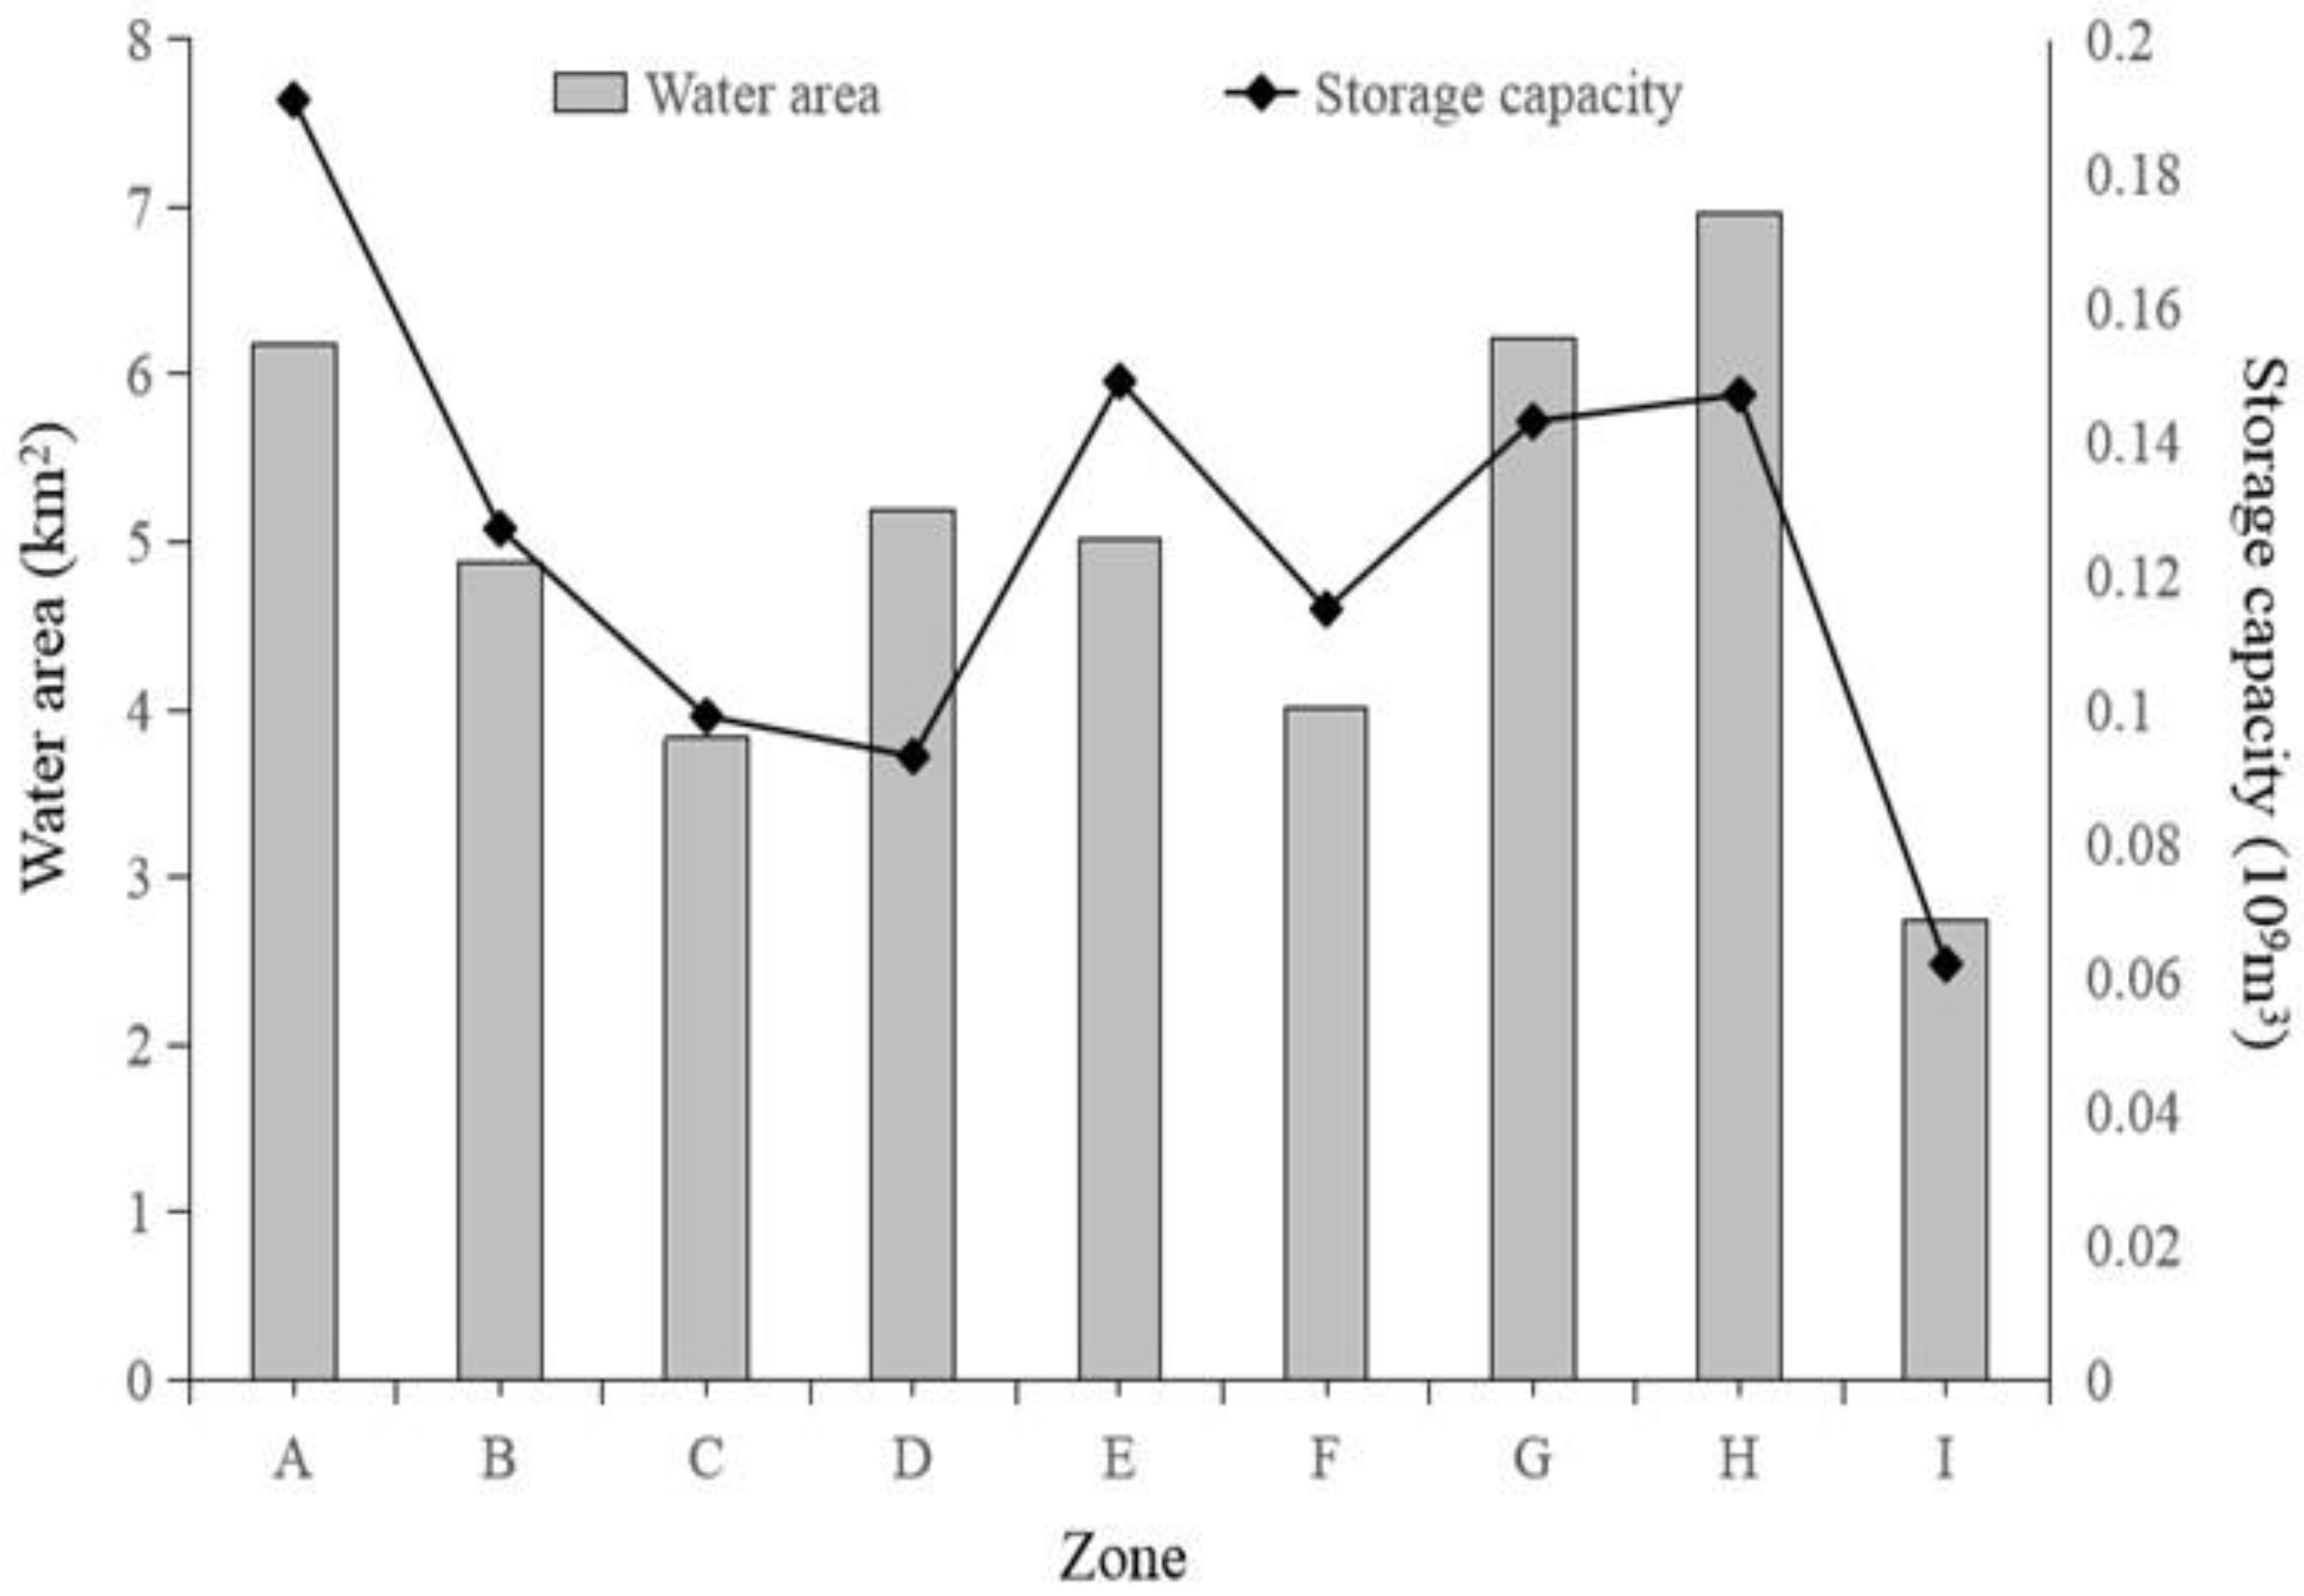
Storage capacity and water surface ratio control
In this study, in order to determine the simulation coefficients, nine different zones were divided in the study area based on the territory of local towns and streets, namely Zone A to Zone I, as shown in Figure 4. The current situation and the layout of the river network, the flux and the storage control indicators of the river network were all decomposed and placed in different zones. Table 1 and Figure 5 both show the basic information about the coastal plain river network in each zone based on the results of the most recent river network survey and analysis from 2018 to 2022. There are three different levels of rivers in Pinghu City, namely the county-level river, the town-level river and the village-level river. These three different levels of rivers are divided based on different managers. The village-level river is governed by the village, the town-level river is usually governed by the local town government and so on.

4.3. Evaluation of River Network Structure and Connectivity Based on Dynamic Balance Equilibrium

Numerous changes in different levels of rivers have been carried out according to the principle of water area dynamic balance since 2005 in Pinghu City. Based on the results of the local water area surveys from 2018 to 2022, the original river network structure and connectivity, the impacts of river water area adjustment and the changes in river network structure and connectivity were all evaluated. The relevant results are shown in Table 2, Table 3 and Table 4.
As shown in Table 2, Table 3 and Table 4, the structure and connectivity of the coastal plain river network in Pinghu City have been significantly changed compared with several years ago, before the water area adjustment.
At the same time, as shown in Figure 6 and Figure 7, all the rivers in the study area can be divided into three different levels, namely the county level, town level and village level. Furthermore, as shown in the above tables, the total number of county-level rivers remains the same after the river area adjustments compared with what it was previously in Pinghu City. Although the total number of county-level rivers did not change, the water area of county-level rivers increased by 1.86 km2. The total number of town-level rivers increased by four, and the water area of the town-level rivers increased by 0.72 km2. The total number of village-level rivers decreased by 218, and the water area of the village-level rivers decreased by 2.58 km2. Additionally, the total length of the village-level rivers decreased by 27.84 km. This shows that due to the government’s premise of maintaining the local water area, the water area of a village-level river can be upgraded to a county-level river or a town-level river through water area adjustment since the water area will be increased in some of the formally village-level rivers, which further improves the structure of the local river network and the main function of the local river network both in terms of flood control and the water environment.
(1) In terms of river network structure after water area adjustment, the water surface ratio index analysis confirms that the water surface area remained the same compared with the original river network before the water area adjustment. However, in order to improve the flood control and drainage capacity of the river network in Pinghu City, there are still some minor changes in the water surface ratio of the river network in different zones. The water surface ratio in Zone A increased the most in all nine zones, which is 1.49%, while the water surface ratio in Zone H decreased the most in all nine zones, which is 1.5%. From the analysis of the river network density index, the overall river network density decreased by 0.05 km/km2 and it varied in all nine zones. The river length density of Zone D increased by 0.56 km/km2, which is the largest increment in all nine zones. The river network density of Zone H decreased by 0.40 km/km2, which is confirmed to be the largest decrement in all nine zones. From the analysis of river number spatial density, the river number spatial density decreased by 0.52 rivers/km2 in Pinghu City, and it also varied in all nine zones. It increased by 0.75 rivers/km2 in Zone D, while it decreased by 1.18 rivers/km2 in Zone I, both of which were confirmed the most in all nine different zones, as also shown in Figure 6 and Figure 7.
(2) When considering the connectivity of the river network before and after water area adjustment, this study focused on the analysis of the number of nodes and chains. The total number of river nodes decreased by 120, and the number of river chains decreased by 244. The river nodes and chains in Zone H decreased dramatically by 39 river nodes and 78 river chains. From the analysis of the river network connectivity index, the overall river network structure index increased by 0.04. Actually, the river network structure index increased in all nine different zones. The largest increment appeared in Zone I, which increased by 0.11. While the overall river-node ratio index increased by 0.07, it also increased in all nine zones. Similarly, Zone I has the largest increment, which increased by 0.19. Finally, from the analysis of the river network connectivity index, the overall increments of the local river network in Pinghu City reached 0.03. The largest increment was 0.07, which was confirmed in Zone I.

4.4. Evaluation of River Function

(1) Flood control: The water area adjustment actually focused on the water surface area of county-level and town-level rivers. During the adjustment, the water surface ratio and the total water volume were strictly controlled and balanced; actually, they were both increased. Hence, it effectively improved the capacity of flood control in the local river network.
(2) Water resources: The water area adjustment was based on the government’s premise of maintaining the storage capacity of the river network, so that it plays a positive role in water resource security. The water consumption in Pinghu City during 2016–2020 is shown in Table 5. It shows that the total water consumption in the study area has declined, while the condition of the shipping lanes in the river network significantly improved compared with the local river network before the water area adjustment.
(3) Water environment: Indeed, the treatment of local point source and non-point source pollution has been executed in since 2003. Moreover, the river network structure and connectivity have both improved due to the water area adjustment. As a result, both the water quantity and water quality of the local river network have been improved. Generally, the water quality of the local river network in Pinghu City has met the standard in the last seven years, from 2015 to 2022, with a 100% compliance rate. It has been confirmed that the water quality of the regional upstream and downstream sections has significantly improved, while the stability and sustainability of the regional environment have also been validated. The variation in the most important water quality indicators is shown in Figure 8. The concentrations of CODMn, NH3-N and TP have been reduced by 28.9%, 63.6% and 27.5%, respectively.

5. Conclusions

In order to solve the problems in river management and protection in the coastal plain river network basin, a numerical model was established in this study in order to determine river network protection and control indices based on the water surface ratio, storage capacity and flux ability. In this study, the control indices of river protection in the coastal plain river network in Pinghu City were determined during the simulation. As the simulation results show, the water surface ratio equals 8.17%, the storage capacity equals 112.6 million m3 and the water flux ability equals 656.06 m3/s in the selected study area, namely in Pinghu City.
When considering the water security capability of the coastal plain river network, based on the control index of river network protection, it has been proven positive to improve the structure and connectivity of the river network through the dynamic balance of water area occupation and supplement. The comprehensive functions of the local river network were also enhanced, and it is also effective to consider the principles of sponge cities in these coastal cities in China, such as reducing impervious surfaces. The flux index, flood control and the drainage capacity of the coastal plain river network were also improved without affecting other functions; the ecological influence and sustainable development of the local area were also confirmed to be positive.

Author Contributions

Conceptualization, J.W. and S.W.; methodology, L.F. and J.W.; investigation, L.F. and C.L.; resources, C.L., Y.Z. and Z.X.; writing—original draft, L.F., S.W. and Z.G. All authors have read and agreed to the published version of the manuscript.

Funding

This research was jointly supported by the Key Research and Development Program of Zhejiang Province (No. 2023C03134), the Technology Demonstration Project of Chinese Ministry of Water Resources (No. SF202212), the Applied Basic Public Research Program and Natural Science Foundation of Zhejiang Province (No. LGF22E090007, LZJWZ23E090007, LZJWY23E090009), the Soft Science and Technology Plan Project of Zhejiang Province (No. 2022C35022), and the Research Program of the Department of Water Resources of Zhejiang Province (No. RB2107, RC2139, RA2102, RB2020, ZIHE21Q003, ZIHE21Z002).

Institutional Review Board Statement

Not applicable.

Informed Consent Statement

Not applicable.

Data Availability Statement

The data that support the findings of this study are openly available at www.pinghu.gov.cn.

Conflicts of Interest

The authors declare no conflict of interest.

References

  1. Abatzoglou, J.T.; Brown, T.J. A comparison of statistical down scaling methods suited for wildfire applications. Int. J. Climatol. 2012, 780, 772–780. [Google Scholar] [CrossRef]
  2. Anandhi, A.; Frei, A.; Pierson, D.C.; Schneiderman, E.M.; Zion, M.S.; Lounsbury, D.; Matonse, A.H. Examination of change factor methodologies for climate change impact assessment. Water Resour. Res. 2011, 47, W03501. [Google Scholar] [CrossRef]
  3. González-Zeas, D.; Rosero-López, D.; Walter, T.; Flecker, A.; Lloret, P.; De Bièvre, B. Designing eco-friendly water intake portfolios in a tropical Andean stream network. Water Resour. Res. 2019, 55, 6946–6967. [Google Scholar] [CrossRef]
  4. Burger, G.; Sobie, S.R.; Cannon, A.J.; Werner, A.T.; Murdock, T.Q. Downscaling Extremes: An Intercomparison of Multiple Methods for Future Climate (Text 1). J. Clim. 2013, 26, 3429–3449. [Google Scholar] [CrossRef]
  5. Carolina, N.; Hole, W.; Drive, B. Climate Change Scenarios for the U.S. National Assessment. Bull. Am. Meteorol. Soc. 2003, 84, 1711–1723. [Google Scholar]
  6. Yu, H.; Ai, T.; Yang, M.; Li, J.; Wang, L.; Gao, A.; Zhou, Z. Integrating domain knowledge and graph convolutional neural networks to support river network selection. Trans. GIS 2023, 27, 1898–1927. [Google Scholar] [CrossRef]
  7. Dong, H.; He, Z.; Jia, L. Study on the mechanism of the diversion of flow and sediment in the complex Estuarine River network. River Res. Appl. 2024, 1–14. [Google Scholar] [CrossRef]
  8. Zanetti, F.; Botter, G.; Camporese, M. Stream network dynamics of non-perennial rivers: Insights from integrated surface-subsurface hydrological modeling of two virtual catchments. Water Resour. Res. 2024, 60, 3331–3356. [Google Scholar] [CrossRef]
  9. Farzan, K.; Wang, G.; Silander, J.; Wilson, A.M.; Allen, J.M.; Horton, R.; Anyah, R. Statistical downscaling and bias correction of climate model outputs for climate change impact assessment in the U. S. northeast. Glob. Planet. Chang. 2013, 100, 320–332. [Google Scholar]
  10. Hamududu, B.H. Impacts of Climate Change on Water Resources and Hydropower Systems in Central and Southern Africa. Ph.D. Thesis, Norwegian University of Science and Technology, Trondheim, Norway, 2012. [Google Scholar]
  11. Jones, R.G.; Noguer, M.; Hassell, D.C.; Hudson, D.; Wilson, S.; Jenkins, G.; Mitchell, J.F.B. Generating High Resolution Climate Change Scenarios Using PRECIS; Met Office Hadley Centre: Exeter, UK, 2004.
  12. Li, Z.; Jin, J. Evaluating Climate Change Impacts on Streamflow Variability Based on a Multisite Multivariate GCM Downscaling Method in the Jing River of China. Hydrol. Earth Syst. Sci. 2017, 21, 5531–5546. [Google Scholar] [CrossRef]
  13. Rostamian, R.; Jaleh, A.; Afyuni, M.; Mousavi, S.F.; Heidarpour, M.; Jalalian, A.; Abbaspour, K. Application of a SWAT Model for Estimating Runoff and Sediment in Two Mountainous Basins in Central Iran. Hydrol. Sci. J. 2010, 53, 977–988. [Google Scholar] [CrossRef]
  14. Taylor, K.E.; STouffer, R.J.; Meehl, G. An Overview of CMIP5 and the experiment design. Bull. Am. Meteorol. Soc. 2012, 93, 485–498. [Google Scholar] [CrossRef]
  15. Wang, Z.; Ficklin, D.L.; Zhang, Y.; Zhang, M. Impact of Climate Change on Stream Flow in the Arid Shiyang River Basin of Northwest China. Environ. Sci. 2012, 26, 2733–2744. [Google Scholar]
  16. Feld, S.; Prajamwong, S.; Sherman, S. Proposed integrated land and water resources management system (ILWRMS) for the Bang Pakong River basin: Lessons from a user needs assessment. J. Water Supply Res. 2003, 52, 435–442. [Google Scholar] [CrossRef]
  17. Gudmundsson, L.; Bremnes, J.B.; Haugen, J.E.; Engen-Skaugen, T. Technical Note: Downscaling RCM precipitation to the station scale using statistical transformations—A comparison of methods. Hydrol. Earth Syst. Sci. 2012, 16, 3383–3390. [Google Scholar] [CrossRef]
  18. Gurung, P.; Bharati, L.; Karki, S. Application of SWAT Model to assess the climate change impact on water balance over the cereal crops in the West Seti River Basin. In Proceedings of the International SWAT Conference, Paul Sabatier University, Toulouse, France, 15–19 July 2013. [Google Scholar]
  19. Herazo, S.; Berrouet, L.; Hernández-Atilano, E.; Agudelo-Echavarría, D.M. Coevolution of flood dynamics and economical production in tropical wetlands: Insights from Bayesian Networks in Ayapel Wetland, Colombia. J. Geophys. Res.-Biogeosci. 2023, 128, e2023JG007416. [Google Scholar] [CrossRef]
  20. Hunukumbura, P.B.; Tachikawa, Y. River discharge projection under climate change in the Chao Phraya River basin, Thailand, using the MRI-GCM3.1S dataset. J. Meteorol. Soc. Jpn. 2012, 90, 137–150. [Google Scholar] [CrossRef]
  21. Ligaray, M.; Kim, H.; Sthiannopkao, S.; Lee, S.; Cho, K.H.; Kim, J.H. Assessment on hydrologic response by climate change in the Chao Phraya River basin, Thailand. Water 2015, 7, 6892–6909. [Google Scholar] [CrossRef]
  22. Limjirakan, S.; Limsakul, A.; Sriburi, T. Trends in temperature and rainfall extreme changes in Bangkok Metropolitan area. J. Environ. Res. 2009, 32, 31–48. [Google Scholar]
  23. DeLisle, C.; Yanites, B.J. Rethinking variability in bedrock rivers: Sensitivity of hillslope sediment supply to precipitation events modulates bedrock incision during floods. J. Geophys. Res.-Earth 2023, 29, 1094–1105. [Google Scholar] [CrossRef]
  24. Morán-Tejeda, E.; Zabalza, J.; Rahman, K.; Gago-Silva, A.; López-Moreno, J.I.; VicenteSerrano, S.; Lehmann, A.; Tague, C.L.; Beniston, M. Senstitivity of water balance components to environmental changes in a mountainous watershed: Uncertainty assessment based on models comparison. Hydrol. Earth Syst. Sci. 2013, 10, 11983–12026. [Google Scholar]
  25. Szuster, B.W.; Flaherty, M. Cumulative environmental effects of low salinity shrimp farming in Thailand. Impact Assess. Proj. Apprais. 2002, 20, 189–200. [Google Scholar] [CrossRef]
  26. Beilfuss, R. A Risky Climate for Southern African Hydro; International Rivers: Berkely, CA, USA, 2012; pp. 1–46. [Google Scholar]
  27. Tan, M.L.; Gassman, P.W.; Srinivasan, R.; Arnold, J.G.; Yang, X.Y. A review of SWAT studies in Southeast Asia: Applications, challenges and future directions. Water 2019, 11, 914. [Google Scholar] [CrossRef]
  28. Teutschbein, C.; Seibert, J. Regional climate models for hydrological impact studies at the catchment scale: A review of recent modeling strategies. Geogr. Compass 2010, 4, 834–860. [Google Scholar] [CrossRef]
  29. Uniyal, B.; Jha, M.K.; Verma, A.K. Assessing climate change impact on water balance components of a River Basin using SWAT model. Water Resour. Manag. 2015, 29, 4767–4785. [Google Scholar] [CrossRef]
  30. Chimalakonda, D.; Chisholm, R.A. Patterns of species diversity in a network of artificial islands. Divers. Distrib. 2023, 29, 1094–1105. [Google Scholar] [CrossRef]
Figure 1. Coastal plain river network in Pinghu City.
Sustainability 16 03518 g001
Figure 2. Typical rivers in Pinghu City.
Sustainability 16 03518 g002
Figure 3. Flowchart of river network protection and function improvement.
Sustainability 16 03518 g003
Figure 4. Different zones of the river network of Pinghu City.
Sustainability 16 03518 g004
Figure 5. Variation in the water area and the storage capacity in different zones.
Sustainability 16 03518 g005
Figure 6. Comparison of the water surface ratios in different zones.
Sustainability 16 03518 g006
Figure 7. Comparison of river length and number density in different zones.
Sustainability 16 03518 g007
Figure 8. Variation in water quality from 2015 to 2020 (averaged value).
Sustainability 16 03518 g008
Table 1. A statistical table of the basic situation of the river network in each region based on the flux and storage control indexes.
ZonesCounty-Level RiversTown-Level RiversVillage-Level RiversTotal Channel Length (km)Total
Water Area (km2)NumberWater Area (km2)NumberWater Area (km2)NumberWater Area (km2)Storage
Capacity
(109 m3)
A2.53110.61102.56330197.856.180.191
B0.8951.19162.79281232.754.880.127
C0.5840.7492.51290162.983.830.099
D0.5230.98143.69368288.275.190.093
E1.0331.47252.51460319.245.010.149
F1.0770.6762.28350233.944.010.115
G0.8871.08114.26451237.646.220.143
H1.42110.81154.73528411.616.970.147
I0.5450.88181.31250174.832.740.062
In total9.46568.4312426.6433082259.1145.031.126
Table 2. Statistical table of changes in the river level structure in each zone. (Year 2022).
ZonesCounty-Level RiversTown-Level RiversVillage-Level RiversTotal Length of Rivers (km2)
Water Area (km2)NumberWater Area (km2)NumberWater Area (km2)Number
A0.3800.10−0.27−23−1.73
B0.2310.191−0.31−26−23.63
C0.0910.151−0.12−100.77
D0.21−0.150−0.50−4231.85
E0.0800.080−0.21−18−5.63
F0.07−10.10−0.13−112.44
G0.3500.030−0.02−2−9.34
H0.29−10.081−0.46−30−40.65
I−0.09−10.141−0.56−56−16.34
In total1.8600.724−2.58−218−27.84
Table 3. Comparison table of changes in the river network structure indexes in each zone. (Year 2005–2022).
ZonesBeforeAfterDifferentials
Water Surface Ratio
(%)
River Length Density (km/km2)River Network Density
(R/km2)
Water Surface Ratio
(%)
River Length Density (km/km2)River Network Density
(R/km2)
Water Surface Ratio
(%)
River Length Density (km/km2)River Network Density
(R/km2)
A12.413.95713.93.916.541.49−0.04−0.46
B7.903.744.868.213.364.470.31−0.38−0.39
C9.654.087.599.194.17.64−0.460.020.05
D9.145.046.747.735.67.49−1.410.560.75
E6.624.196.417.084.126.170.46−0.07−0.24
F7.224.196.58.64.236.681.380.040.18
G13.535.1410.1412.034.9410.19−1.50−0.200.05
H6.844.025.416.443.625.11−0.40−0.40−0.30
I4.282.714.244.352.463.060.07−0.25−1.18
In
total
8.174.076.298.174.025.770.00−0.05−0.52
Table 4. Comparison of river network connectivity indicators in each zone.
ZoneBeforeAfterDifferentials
NodeChainRiver Network Structure River-Node RatioRiver Network ConnectivityNodesChainRiver Network Structure River-Node RatioRiver Network ConnectivityNodeChainRiver Network Structure River-Node RatioRiver Network Connectivity
A1243630.992.930.991153451.0331.02−9−18−0.04−0.07−0.03
B1364071.022.991.011303951.043.041.03−6−12−0.02−0.05−0.02
C1213591.012.971.011133441.053.041.03−8−15−0.04−0.07−0.02
D2838761.063.11.042718511.083.141.06−12−25−0.02−0.04−0.02
E2657931.012.991.012467541.053.071.03−19−39−0.04−0.08−0.02
F1895761.043.051.031805581.073.11.05−9−18−0.03−0.05−0.02
G17150812.97117150612.9610−200.010
H2898540.992.960.992507761.073.11.04−39−78−0.08−0.14−0.05
I1073181.012.971.01892811.123.161.08−18−37−0.11−0.19−0.07
In
total
16855054131156548101.043.071.03−120−244−0.04−0.07−0.03
Table 5. Comparison of annual water consumption in typical plain river network areas.
Year20162017201820192020
Total water consumption (109 m3)2.332.232.222.222.20
Disclaimer/Publisher’s Note: The statements, opinions and data contained in all publications are solely those of the individual author(s) and contributor(s) and not of MDPI and/or the editor(s). MDPI and/or the editor(s) disclaim responsibility for any injury to people or property resulting from any ideas, methods, instructions or products referred to in the content.

