
Analysis of Fishing Vessel Accidents and Suggestions for Safety Policy in South Korea from 2018 to 2022

1
Department of Mechanical and Industrial Engineering, Norwegian University of Science and Technology, 7034 Trondheim, Norway
2
Department of Microsystems, University of South-Eastern Norway, 3184 Borre, Norway
3
Department of Fishing Vessel Safety Research, Korea Maritime Transportation Safety Authority, Sejong City 30100, Republic of Korea
4
Division of Marine Production System Management, Pukyoung National University, Busan 48513, Republic of Korea
*
Author to whom correspondence should be addressed.
Sustainability 2024, 16(9), 3537; https://doi.org/10.3390/su16093537
Submission received: 15 March 2024
/
Revised: 19 April 2024
/
Accepted: 22 April 2024
/
Published: 24 April 2024
(This article belongs to the Special Issue Sustainable Maritime Transportation: Risk Management and Accident Analysis)
Abstract
:Commercial fishing, one of the most dangerous sectors globally and, particularly, in South Korea, faces fatal accident rates significantly exceeding other industries, and an urgent improvement in safety measures is necessary to reduce these numbers effectively. The main objective of this study is to analyse fishing vessel accidents in South Korea and present the direction of safety policy for fishing vessels based on the lessons learnt from previous accidents, and, ultimately, to contribute to reduce fishing vessel accidents. For this purpose, we have analysed the marine accident data from the last five years provided by the Korea Maritime Safety Tribunal (KMST), the statistical yearbook of oceans and fisheries provided by the Ministry of Oceans and Fisheries (MOF), and the statistical survey of marine fisheries provided by the Korean Statistical Information Service (KOSIS), using both quantitative and qualitative approaches. After thorough review and analysis of the accident data, we have proposed seven suggestions for the direction of future safety policy for fishing vessels in South Korea: adopt international safety benchmarks, focus on occupational and collision accidents, tailor safety measures to vessel size and age, enhance lookout practices to prevent collisions, implement comprehensive strategies to mitigate human errors, and address communication issues among Korean and international crews.
1. Introduction
The fishing industry is a cornerstone of the global economy, providing employment to millions and serving as a primary source of protein for billions of people worldwide. According to the Food and Agriculture Organization (FAO), the sector plays a critical role in food security and economic stability in many countries [1,2]. However, the industry is fraught with challenges, particularly in the risk of fatal accidents, and commercial fishing is recognised as one of the most perilous occupations [3,4].
The International Labour Organization (ILO) estimated that, on average, approximately 24,000 fishermen globally lose their lives each year [1], and the fatal accident rate in the fishing sector is significantly higher than others [5]. The average fatality rate per 100,000 workers in commercial fishing in the United States is 32 times higher than the average for all workers and 16 times higher than that for fire-fighting or police work [6,7]. In the United Kingdom, the fatal accident rate of fishing is 115 times higher than the average, and the overall accident rate in the fishing industry is 24 times higher than in the construction industry and 81 times higher than in the manufacturing industry [8].
While the fishing industry is a crucial provider of protein in South Korea, where fish consumption exceeds the global average by more than threefold [9,10], fishing is also one of the most dangerous sectors in South Korea. The fatality rate of fishing per 10,000 person years in 2021 is approximately five time higher than the average rate for overall workers, three times higher than construction, four times higher than agriculture, and five times higher than manufacturing [11]. Moreover, fishing vessels account for 89% of overall registered vessels in South Korea [12], and the number of fatalities from fishing vessels accounts for 81% of overall fatalities in the Korean sea [13]. It is, therefore, essential to improve the safety and prevent fatal accidents on fishing vessels in South Korea.
An insight into the status of fishing vessel accidents is needed to improve the safety of fishing vessels effectively and efficiently, and there have been various studies conducted for this purpose. Several previous studies have provided a detailed analysis of fishing accidents in the United States [14], the United Kingdom by [15], Portugal [16], Spain [17], Norway [18], Denmark [19], Iceland [20], Sweden [21], and overall accident rates and trends in Poland, the United Kingdom, Norway, Iceland, Denmark, the United States, Alaska, and Canada [22]. These studies provide various statistical analyses of fishing vessel accidents for each country and discuss the status, trends, main causes, and risk reduction strategies based on the analyses.
However, few studies have been carried out to analyse fishing vessel accidents in South Korea. Rhee, et al. [23] reviewed the overall occupational injuries in South Korea between 2001 and 2010, but they omitted the consideration of other types of fishing vessels beyond those related to occupational activities. Kim, et al. [24] analysed fatal accidents of trap fishing boats in South Korea, but this study focused on a specific type of fishing vessel and did not provide an overview of all fishing vessel accidents in South Korea. Sur and Kim [25] proposed a comprehensive risk estimation of fishing accidents in Korean waters, and Oh, et al. [26] conducted a risk analysis based on the trajectory of fishing vessels, but their focus was not the analysis of accident data but the modelling of the risk of fishing vessels. To the best of the authors’ knowledge, there is currently no public availability of diverse statistical analyses concerning fishing vessel accidents, nor discussions on trends, primary causes, and strategies for risk reduction specifically tailored to Korean fishing vessels.
The main objective of this study is to analyse previous accidents of fishing vessels and present the direction of safety policy in South Korea based on the findings from the analysis. For this purpose, this study has two sub-objectives: (1) to provide a statistical overview of fishing vessel accidents in South Korea and (2) to provide insight into the major causes of fishing vessel accidents. The former can contribute to understanding the current status and trends in fishing vessel safety in Korean waters, and it can also be utilised as inputs for quantitative risk analyses of fishing vessels. The latter can contribute to developing effective and efficient risk reduction strategies for fishing vessels in South Korea.
The rest of this article is structured as follows. Section 2 describes the methodologies and theories for statistical overview and major causes of fishing vessel accidents in South Korea, and the results are provided in Section 3. The discussion of the results and conclusion are provided in Section 4 and Section 5, respectively.
2. Methods
The accident analysis of this study consisted of two parts: statistical review and major causes of the accidents.
2.1. Statistical Review
For the statistical review of fishing vessel accidents in South Korea, we analysed three different statistical data: the marine accident data for the last five years provided by the Korea Maritime Safety Tribunal [13], the statistical yearbook of oceans and fisheries provided by the Ministry of Oceans and Fisheries [12], and the statistical survey of marine fisheries provided by the Korean Statistical Information Service [27]. The various numbers of fishing vessel accidents (by year, accident type, vessel size, age, consequence, casualty, and so on) were obtained from the first [13], and the numbers of registered fishing vessels and fishermen were extracted from the second [12] and third [27], respectively.
To provide the statistical overview of the fishing vessel accidents in South Korea, we calculated the accident frequency, individual risk, and social risk that are suggested by the International Maritime Organization [28,29,30,31]. Accident frequency (AF) is the number of occurrences per unit time that can be obtained by dividing the number of accidents recorded in a given period by the number of accumulated ship years [30]. Individual risk (IR) is a risk of death or injury as experienced by an individual at a given location, and it can be obtained by dividing the number of fatalities recorded in a given period by the number of accumulated person years [28]. The social risk can be expressed by Potential Loss of Life (PLL), which can be obtained by dividing the number of fatalities recorded in a given period by the number of accumulated ship years [28,31]. The formulas for the accident frequency, IR, and PLL are as follows:
2.2. Insight into Accident Causes
For insight into accident causes of fishing vessel accidents in South Korea, we analysed the written verdicts of marine safety provided by the Korea Maritime Safety Tribunal [32]. The written verdicts are public decisions of maritime accidents that have been investigated and adjudicated by the Central Maritime Safety Tribunal and each local maritime safety tribunal, and they are open to the public for the purpose of preventing the recurrence of similar accidents. A total of 453 fishing vessel accident cases were analysed with detailed information, like type, cause, date and time, location, weather condition, cause of the accident, vessel size and age, whether an international crew was onboard, and so on. Each accident case was carefully reviewed, and required information was extracted and analysed from the written verdicts.
To provide insight into the major causes of fishing vessel accidents in South Korea, we applied two different approaches: Fault Tree Analysis (FTA) and human error classifications by Rasmussen [33] and Reason [34].
A Fault Tree (FT) is a hierarchical logic diagram that illustrates the connections between a potential hazardous event and the factors contributing to the event. FTA was developed by Bell Telephone Laboratories in 1962 when assessing the safety of the Minuteman intercontinental ballistic missile launch control system, and FTA has become widely utilised in risk and reliability studies. FTA can be either quantitative, qualitative, or a combination of both, depending on the purpose of the analysis. Through the qualitative analysis of FT, we can identify potential combinations of basic events that may lead to a hazardous event of the system and aspects of the system that require improvement to prevent the hazardous event [35]. In this study, FTA was used to analyse the collision accidents of fishing vessels.
Approximately 80–85% of all marine accidents are caused by human errors [36] that consist of various factors, like fatigue, alcohol, communication error, distraction, ignorance of regulations, overconfidence, poor training, and so on [37]. Considering that various fishing activities are carried out onboard fishing vessels, it is expected that human error accounts for a much higher proportion of accidents involving fishing vessels. It is, therefore, essential to conduct a careful analysis of human errors in fishing vessel accidents, and, for this purpose, we applied the two theories for human error: the skill-based, rule-based, and knowledge-based behaviour model by Rasmussen [33] and the slip, lapse, mistake, and violation classification by Reason [34].
Rasmussen [33]’s Skill–Rule–Knowledge (SRK) model categorises human behaviour into three levels. Skill-based behaviour represents automatic and routine actions performed with little or no cognitive effort, rule-based behaviour involves following pre-defined procedures and rules, and knowledge-based behaviour requires the highest cognitive level to cope with unfamiliar situations without a procedure based on an individual’s own experience and knowledge. Depending on the type of behaviour, different strategies to reduce human errors can be applied. Human errors involved in skill-based behaviour can be reduced by refining and reinforcing automated and routine actions, while human errors in rule-based behaviour can be reduced by enhancing established procedures and guidelines. The human errors of knowledge-based behaviour can be reduced by improving operators’ problem-solving and decision-making abilities [35]. In this study, the SRK model was used to analyse the human errors of collision accidents and occupational accidents of fishing vessels that were identified as the most critical accident types in this study.
Reason [34]’s Slip–Lapse–Mistake–Violation (SLMV) model classifies human errors into four groups. Slip is an error with correct intention but a faulty execution, lapse is a failure of execution due to distraction or lapse of memory, mistake is an error with incorrect intention, and violation is an intentionally executed improper action. Similar to the SRK model, different strategies can be applied to reduce different types of human errors. While slip and lapse can happen to the most experienced experts and usually cannot be prevented by training, mistake normally happens to less experienced individuals and training is important to reduce mistake. Violation is different from the others because it is an intended error, and it is normally hidden by the operators [35]. In this study, the SLMV model was used to analyse the human errors of collision accidents and occupational accidents.
3. Results
3.1. Statistical Analysis of Fishing Accidents
The accident data from the last five years (from 2018 to 2022) were reviewed to provide a statistical overview of fishing vessel accidents in South Korea. First, we analysed the overall fishing vessel accidents and obtained accident frequency, individual risk, and Potential Loss of Life, which was followed by a more detailed review of the distribution of various accident types, casualty by each accident type, and accident distribution by vessel size and age.
3.1.1. Statistical Analysis of Overall Accidents
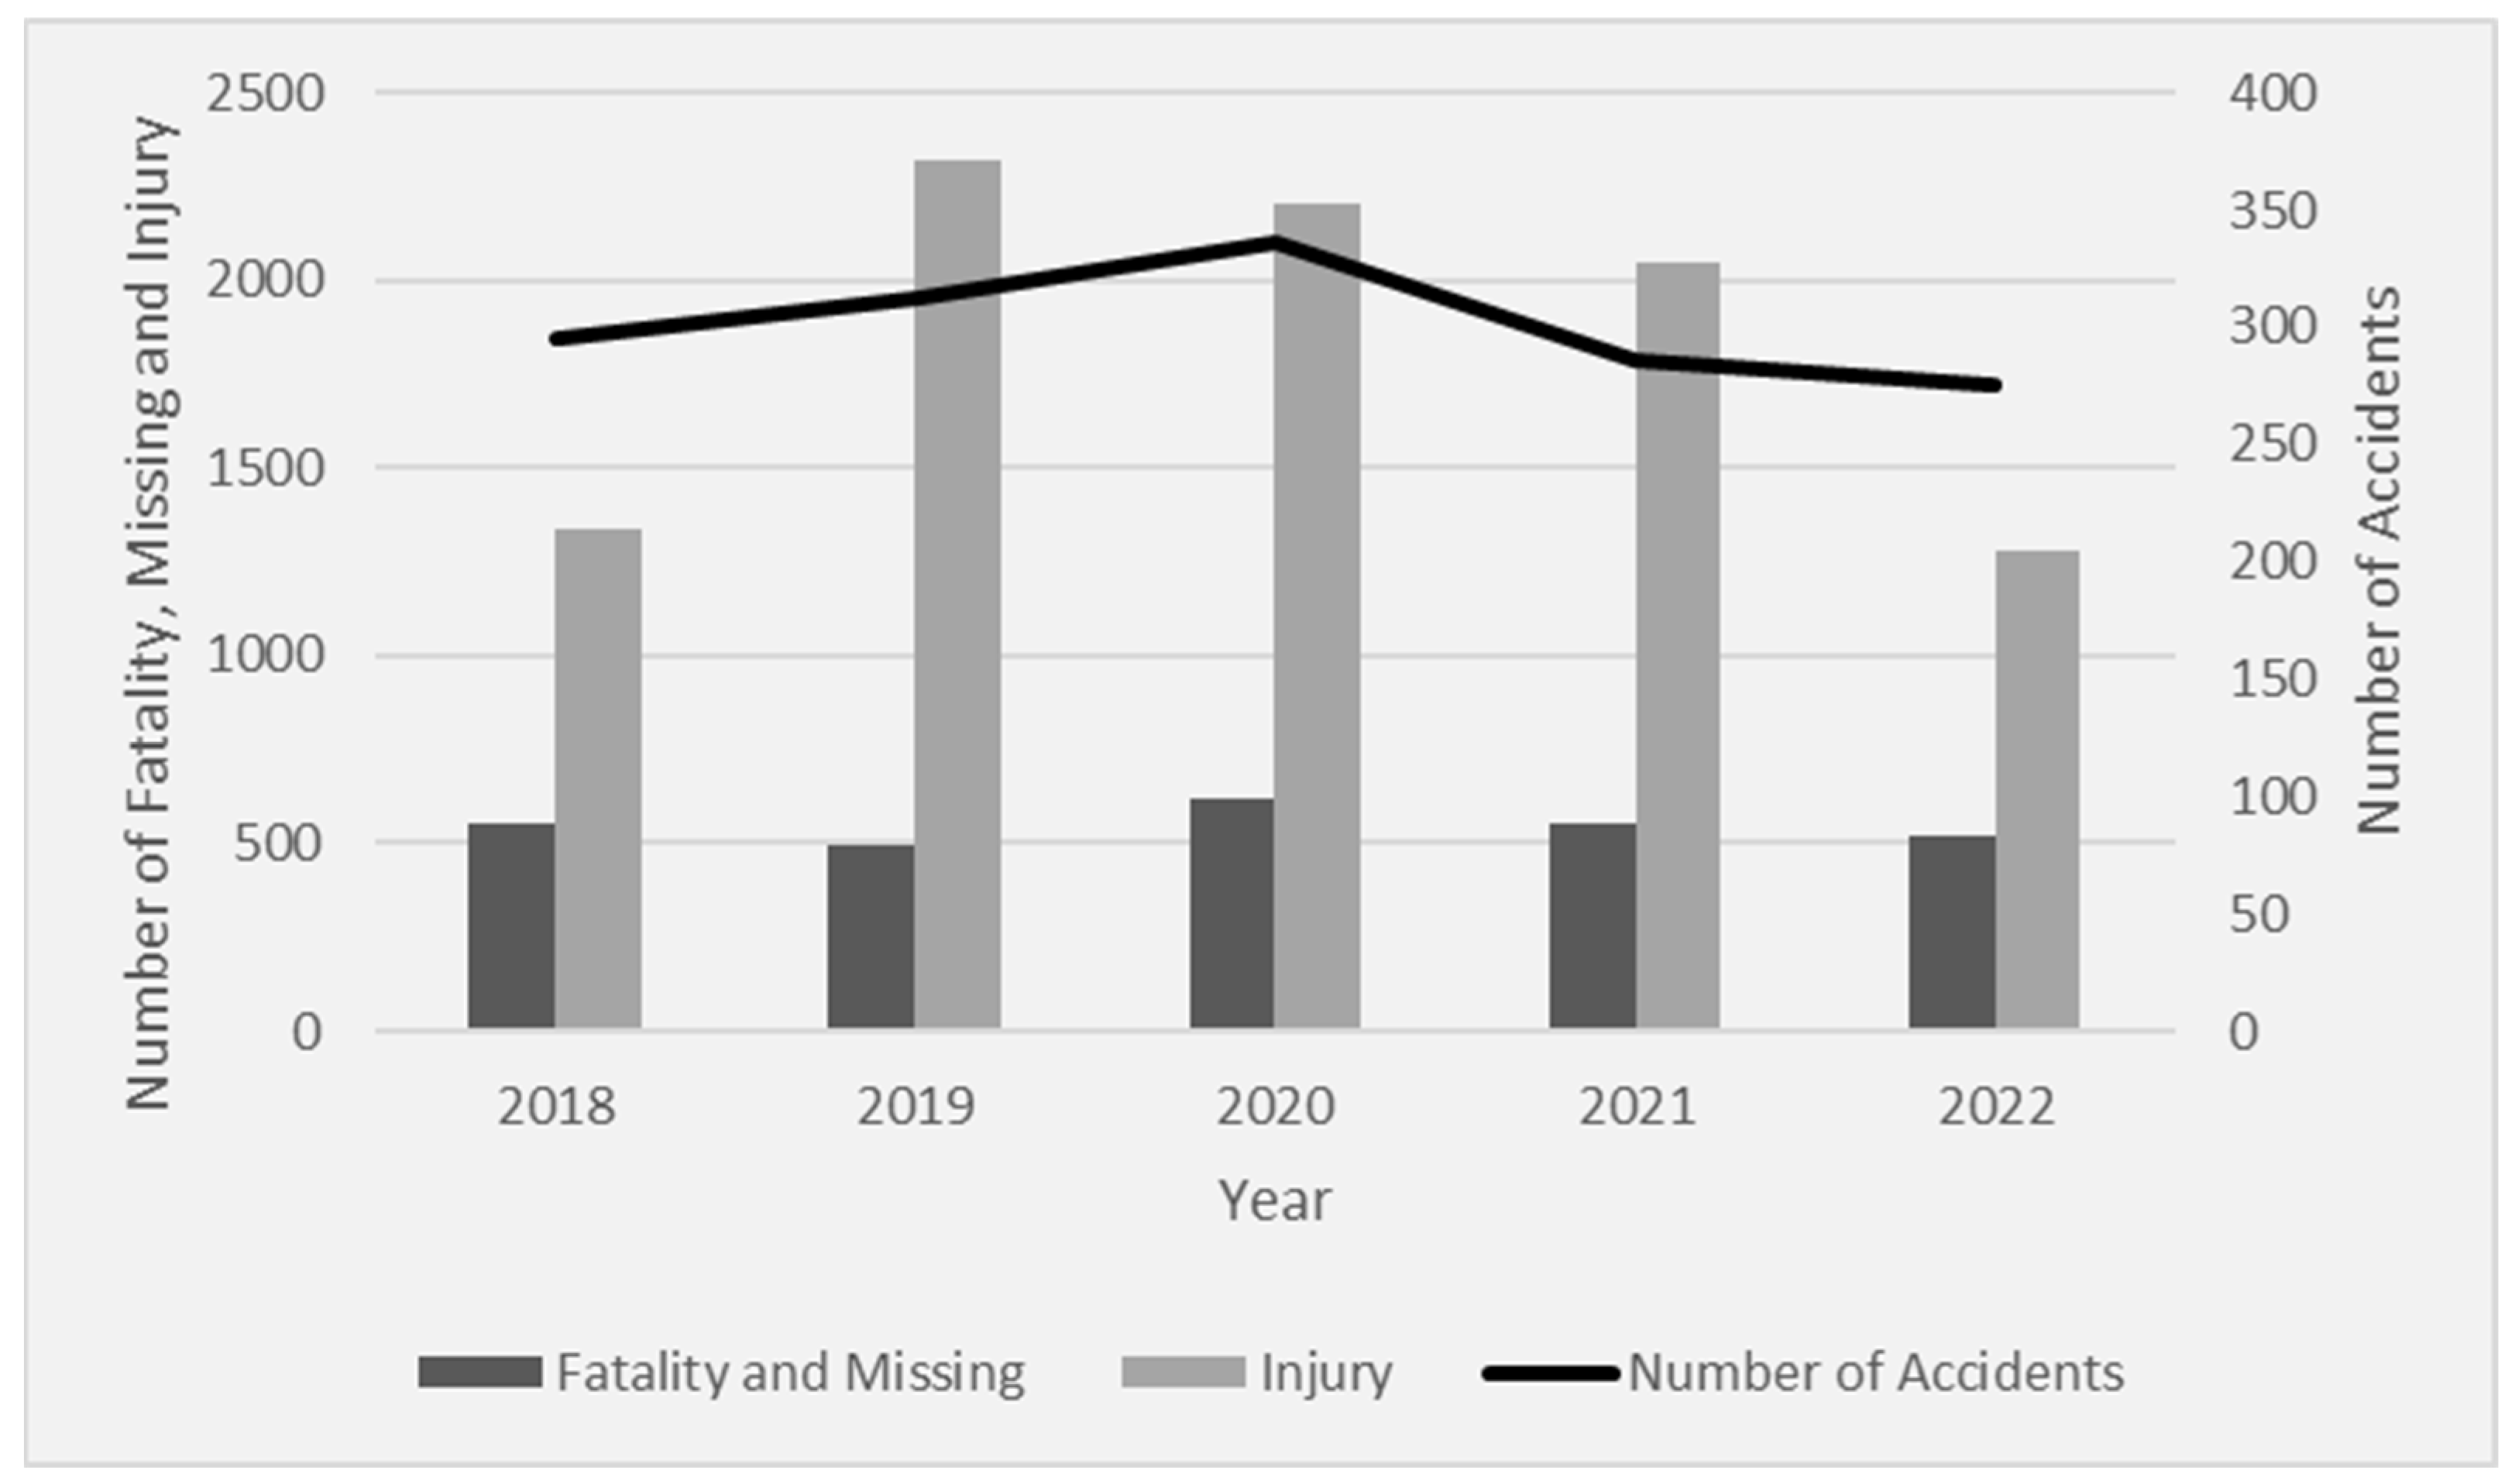
The numbers of accidents, accident vessels, fatalities and missing, injury, registered fishing vessels, and registered fishermen in South Korea from 2018 to 2022 are listed in Table 1. The number of accident vessels represents the number of fishing vessels involved in an accident, which is greater than the number of accidents because multiple vessels can be involved in a single accident for some accident types, like collision, contact, and so on. The number of registered fishermen for 2022 was not available in the database, so the average number was calculated from 2018 to 2021 only. Accident frequency (AF), individual risk (IR), and Potential Loss of Life (PLL) were calculated using Equation (1), Equation (2), and Equation (3), respectively. The unit of AF and PLL is per ship year, and the unit of IR is per person year.
In the past five years, there have been an average of 1880 accidents, and 2071 fishing vessels were involved in the accidents out of 65,318 registered fishing vessels. As a consequence of the accidents, 88 persons lost their lives, and 294 persons were injured out of 84,053 registered fishermen on average. The number of accidents, fatality and missing, and injury are illustrated in Figure 1.
3.1.2. Statistical Analysis of Accident Type and Casualty
After thorough review of 15 different accident types, fishing vessel accidents were categorised into six types: mechanical damage, navigational accident, occupational accident, fire/explosion, marine pollution, and others. Mechanical damages were further divided into four groups: machinery damage, propeller entangled, shaft damage, and rudder damage. Navigational accidents were further divided into seven groups: collision, flooding, grounding, sailing hindered, capsizing, sinking, and contact. The accident frequency of each accident type was calculated using Equation (1).
On average, there were 1021 accidents related to mechanical damage, 745 navigational accidents, 146 occupational accidents, 107 fire and explosion accidents, 23 pollution accidents, and 28 other types of accidents like damage to facilities, ship’s fitting, and so on. The number of accidents for each accident type from 2018 to 2022 is provided in Table 2, and its trend is illustrated in Figure 2.
Overall, 49% of fishing vessel accidents were machinery damage, and 36% accounted for navigational accidents, 7% were occupational accidents, and the remaining accidents were related to fire/explosion, marine pollution, and so on. The majority of accidents involving fishing vessels are attributed to mechanical damage, primarily because these vessels typically operate under harsher conditions compared to other vessels [38] and are subject to continuous and intensive operation [39]. Furthermore, maintenance tends to be less rigorous for smaller fishing vessels [40], and many fishing fleets operate older vessels equipped with outdated machinery [1]. Nevertheless, the impact of mechanical damage is generally less severe compared to other types of maritime accidents, as the majority of these incidents involve simple mechanical malfunctions that do not result in any casualties. The ratio of accident types is illustrated in Figure 3.
The accident types were further analysed by casualty, which consists of fatality/missing and injury. Fatality/missing means loss of human lives as a consequence of the accident, injury is a non-life-threatening consequence, and casualty is the sum of the two. The frequencies of casualties, fatalities/missing, and injuries were calculated using Equation (3), and the calculation included accidents from 2018 to 2021 only, due to the limited fishermen statistics in 2022. The average numbers and frequencies of casualties, fatalities/missing, and injuries of each accident type are provided in Table 3.
On average, there were 158.3 casualties (49.8 fatalities/missing and 108.5 injuries) by occupational accidents, and 139.3 casualties (10.0 fatalities/Missing and 129.3 injuries) by collision accidents. The number of casualties from these two accident types account for about 73% of the total casualties. The distribution of casualties, fatalities/Missing, and injuries of each accident type is illustrated in Figure 4.
3.1.3. Statistical Analysis of Vessel Size
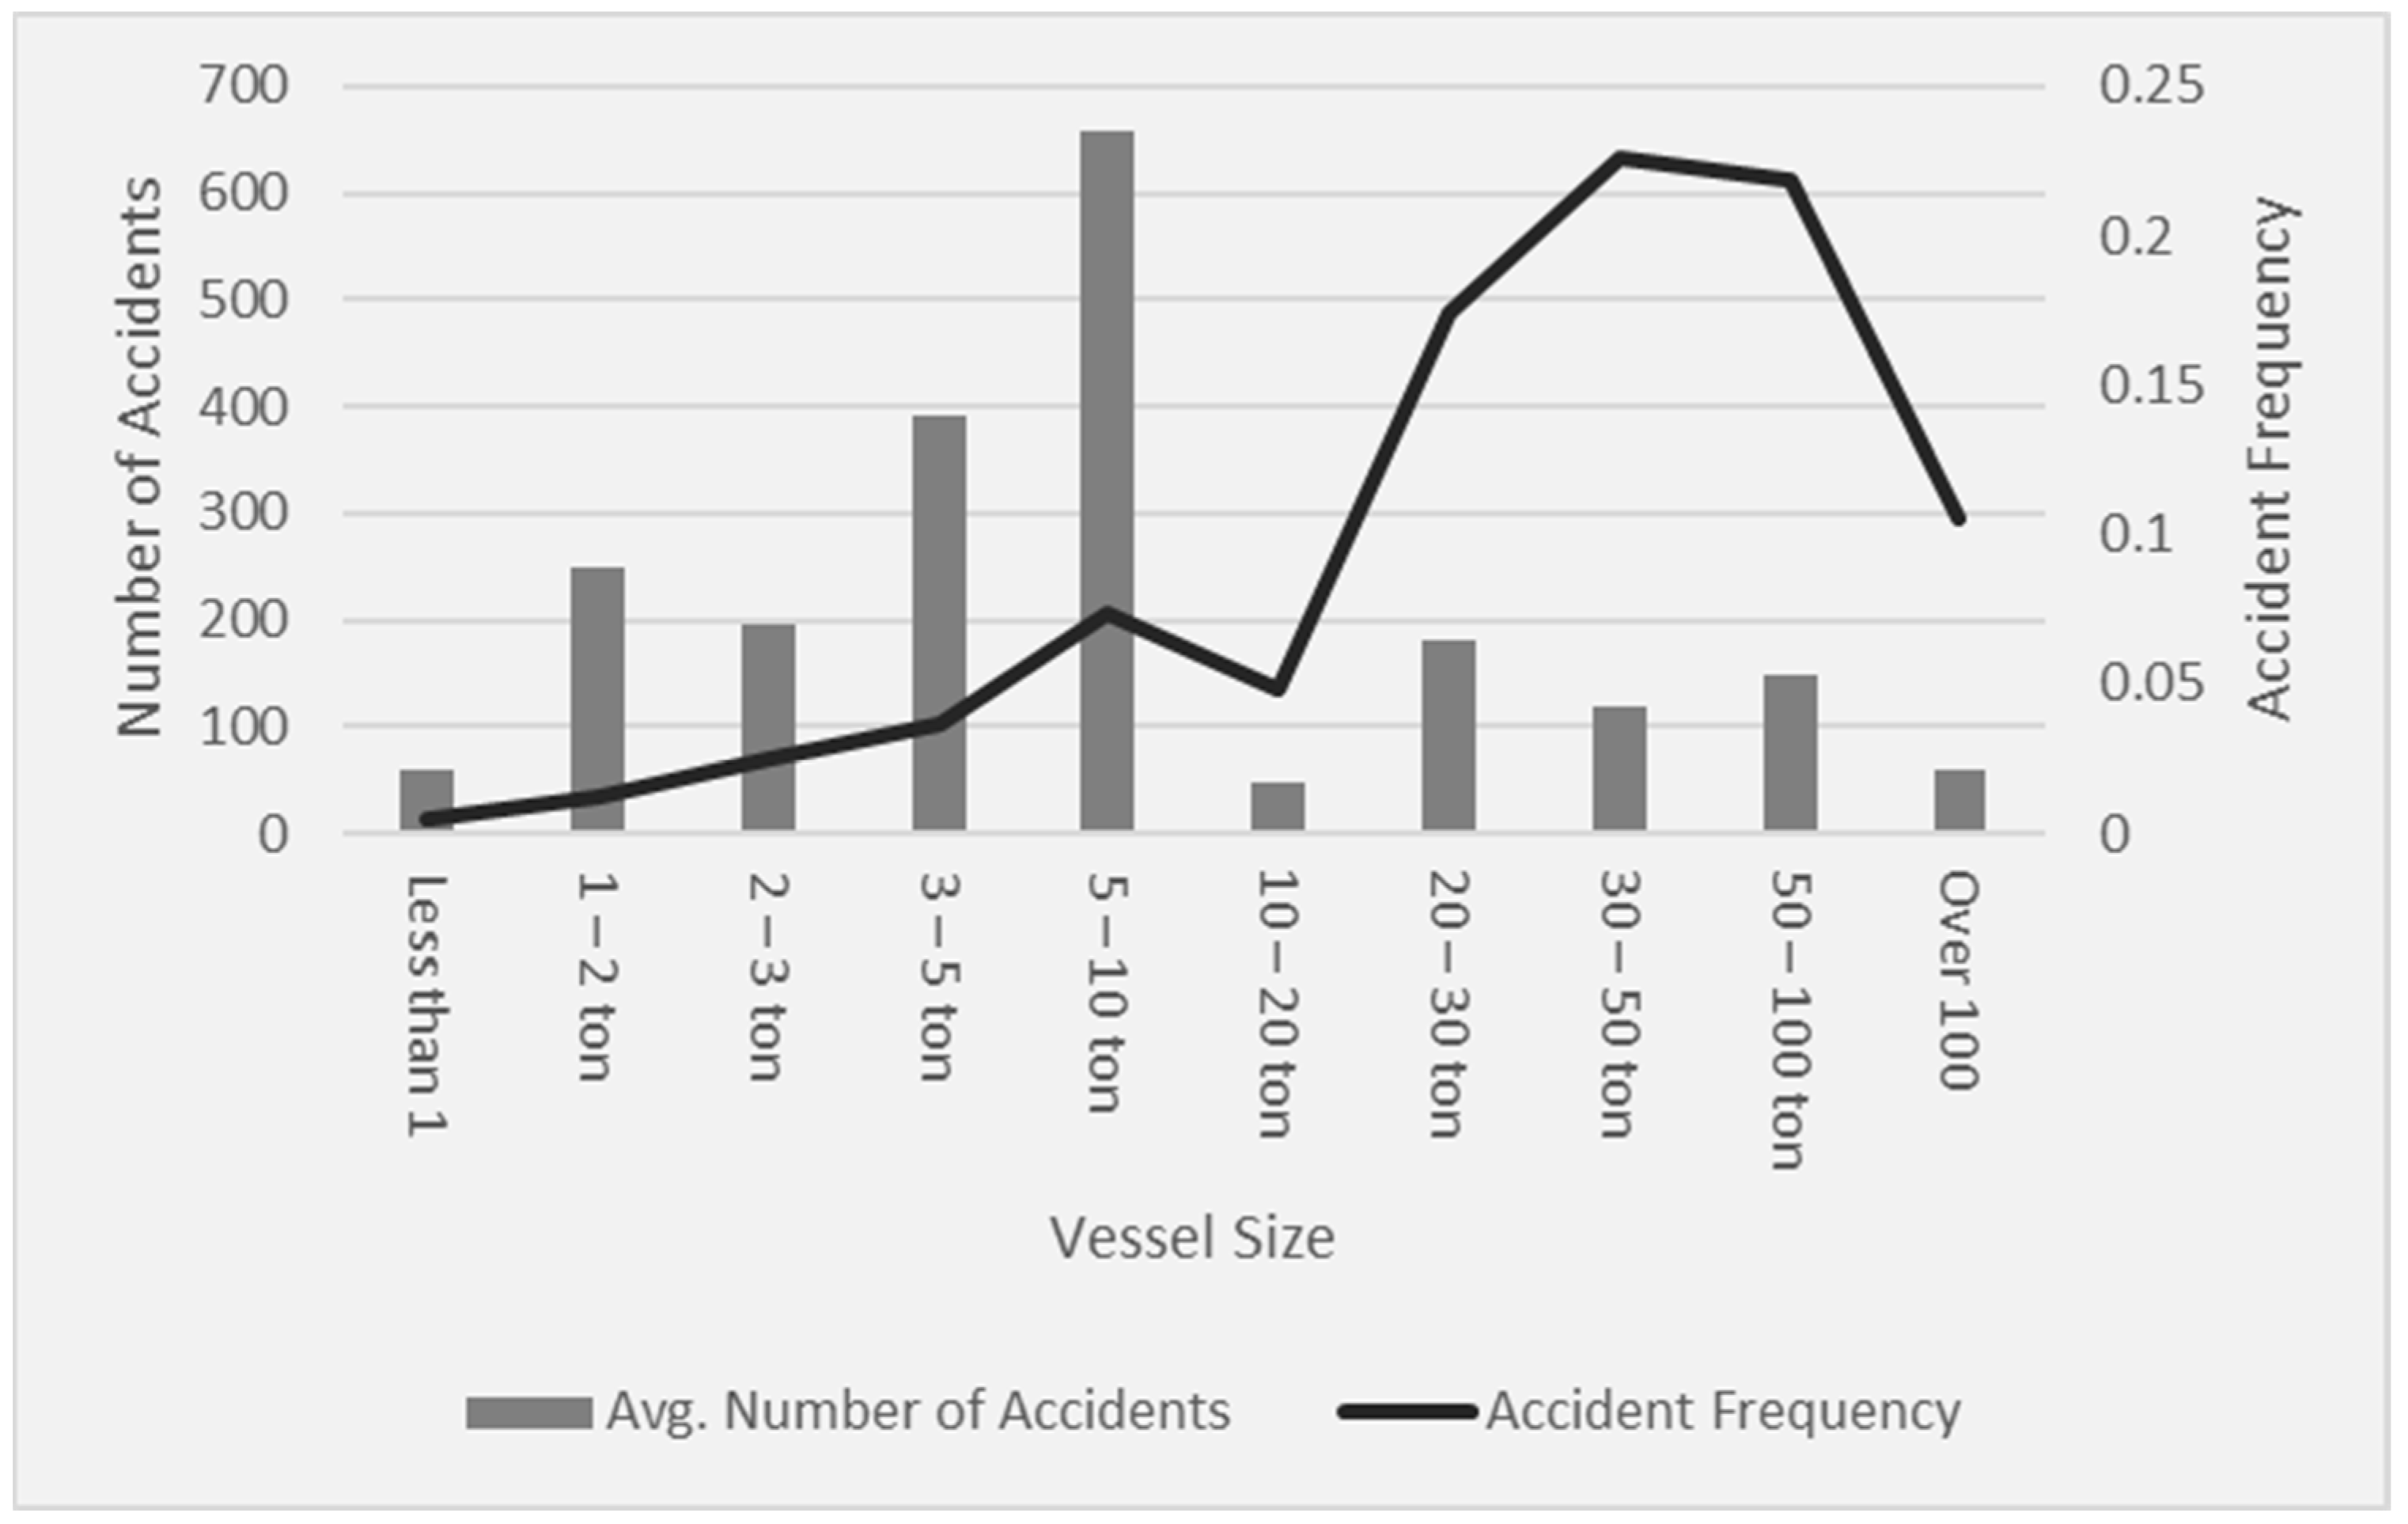
The average number of accidents, registered vessels, and frequency of accidents by vessel size is provided in Table 4. The size of the vessels was categorised into 10 groups from less than 1 ton to over 100 tons. The average number of registered vessels and accidents were counted for each size group from 2018 to 2021 due to the limited statistical data for the number of registered vessels in 2022. The accident frequency of each vessel size group was calculated using Equation (1).
On average, 65,754 fishing vessels were registered from 2018 to 2021 where about 94% of them were less than 10 tons, and, among the 2111 average number of accidents, about 74% were caused by the fishing vessels less than 10 tons. The largest number of accidents (658 accidents) occurred with fishing vessels between 5 and 10 tons, and the highest accident frequency (0.226 accident per ship year) was with fishing vessels between 30 and 50 tons. The distributions of the average number of accidents and accident frequency by vessel size are illustrated in Figure 5.
3.1.4. Statistical Analysis of Vessel Age
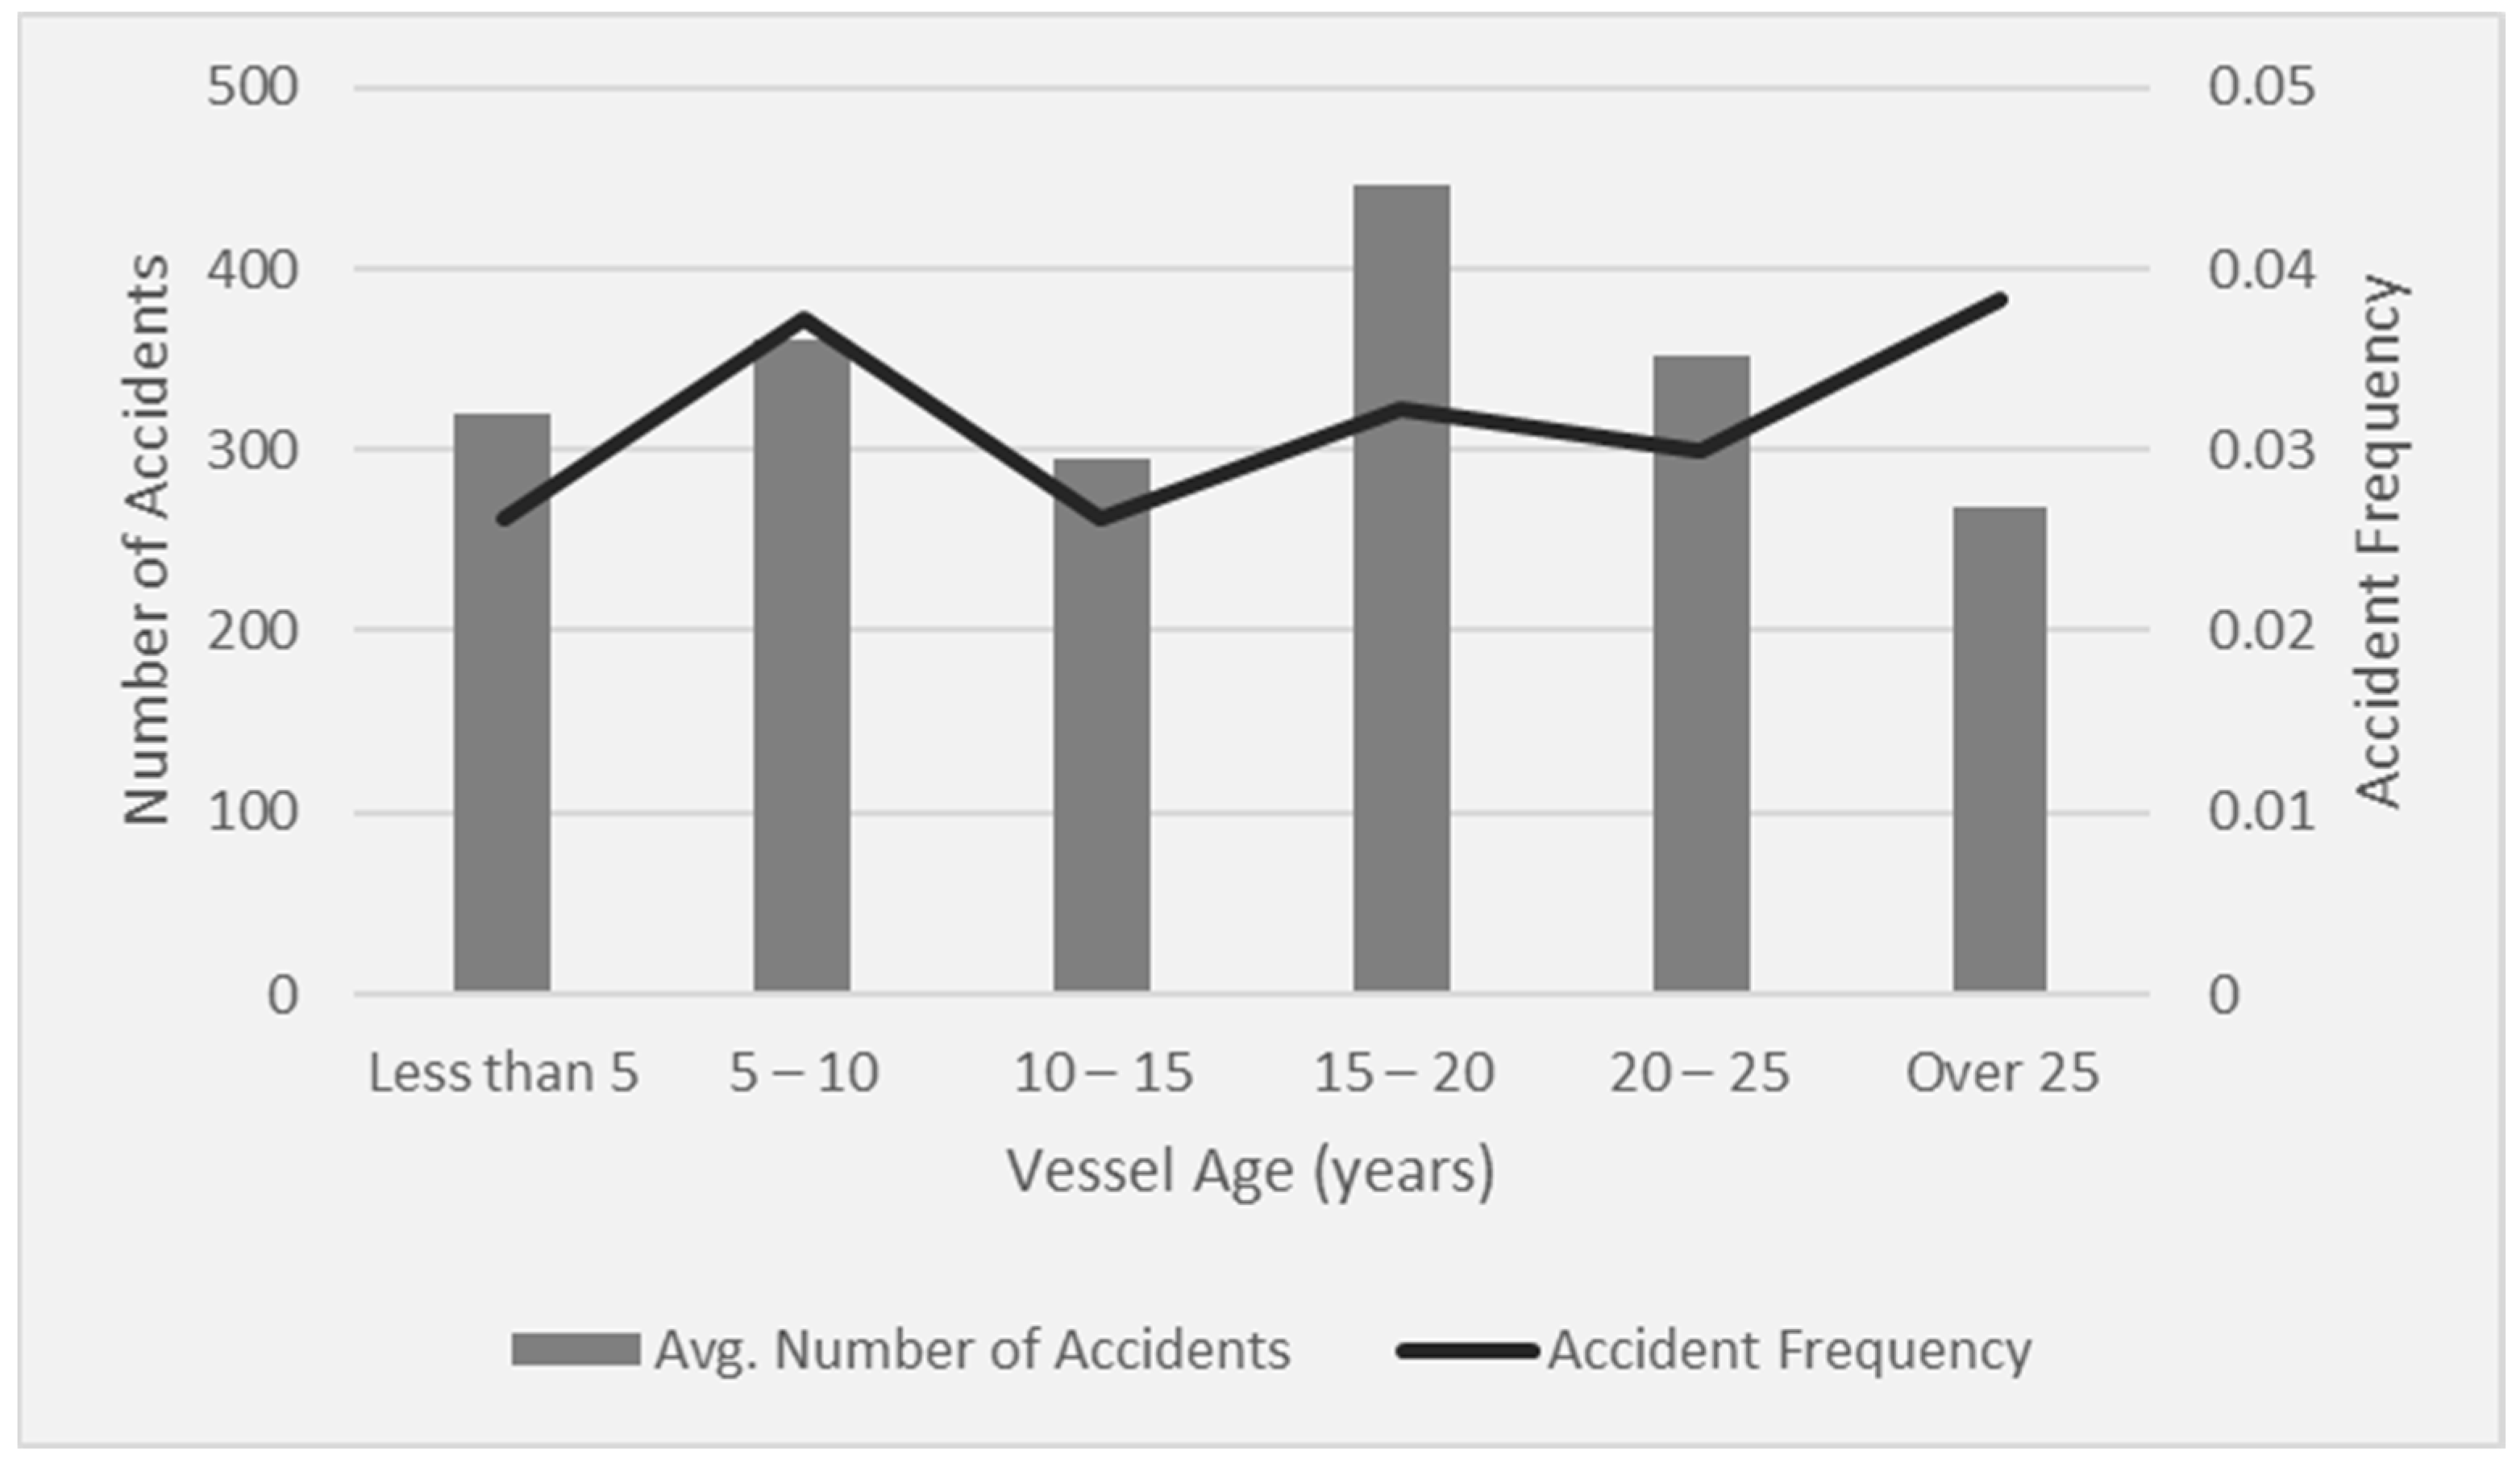
The average number of accidents, registered vessels, and frequency of accidents by vessel age is provided in Table 5. The age of the vessels was categorised into six groups from less than 5 years to more than 25 years, and, as in the previous section, the calculations of vessel age included data from 2018 to 2021. The accident frequency of each vessel age group was calculated using Equation (1).
On average, 65,754 fishing vessels were registered from 2018 to 2021, and the average number of registered vessels and accidents were distributed relatively evenly throughout the six vessel age groups. The largest number of accidents (447 accidents) occurred from fishing vessels aged between 15 and 20 years, and the highest accident frequency (0.0384 accident per ship year) was from fishing vessels aged more than 25 years, but the results did not show much difference between them. The distributions of the average number of accidents and accident frequency by vessel age are illustrated in Figure 6.
3.2. Causes of Accidents
As reviewed in Section 3.1.3, occupational and collision accident accounted for 73% of all casualties caused by fishing vessel accidents. Therefore, these two accident types are analysed in detail in this section. For this purpose, we analysed detailed accident data of 453 fishing vessel accidents, as explained in Section 2.2. First, the causes of collision accidents were analysed and modelled using Fault Tree Analysis. Another detailed analysis focused on human errors for occupational accidents and collision accidents. The human errors for the two accident types were carefully reviewed and classified using both the SRK model and SLMV model. The other analysis was conducted to investigate the poor communication among the fishermen through analysing the correlation between occurrence of accident types and international crew members.
3.2.1. Causes of Collision Accidents
Among the total of 453 fishing vessel accident cases analysed in detail with their causes, 288 cases were collision accidents. The collision accidents normally involved two vessels, and, therefore, each collision accident had two main causes: one from the give-way vessel and the other from the stand-on vessel. Therefore, a total of 576 causes were analysed in this session.
For the give-way vessels, the causes were classified into six groups: poor lookout, overspeed, sailing while dozing, improper route, improper steering. Poor lookout represents distraction or other errors in detecting the stand-on vessel, overspeed means that the captain violated the safe speed on purpose, and sailing while dozing is an error caused by a tired or exhausted captain. Improper route means that the captain made a wrong decision on the route of the vessel, and improper steering includes both intentional and unintentional poor steering operation. Others consist of violation of sailing regulation, drunk sailing, limited vision, machinery failure, and so on.
For the stand-on vessels, the causes were also classified into six groups: poor lookout, negligence in collision avoidance, stand-on vessel not in sail, not enough time to evade, overspeed, drunk sailing. Poor lookout, overspeed, and drunk sailing are the same as the causes of the give-way vessels, while negligence in collision avoidance, stand-on vessel not in sail, and not enough time to evade are unique causes for the stand-on vessels. Negligence in collision avoidance means that the stand-on vessel detected the give-way vessel, but took no action or took the action too late to avoid collisions, which is normally caused by the misunderstanding that the give-way vessel would change the route soon. Stand-on vessel not in sail means that the stand-on vessel stayed at sea or at port without sailing operation (for instance, for fishing operations or mooring at port), so it was not possible to avoid the collision, even if the give-way vessel was detected by the stand-on vessel, and not enough time to evade represents the case where the stand-on vessel detected give-way vessel, but it was too late to take any action to avoid collision. In both cases, the stand-on vessel is not at fault. These collision causes of give-way vessels and stand-on vessels were modelled using a Fault Tree and provided in Figure 7, and the number of each collision cause of give-way and stand-on vessels are provided in Table 6.
The most frequent cause of both give-way and stand-on vessels were poor lookout, which accounted for 68% and 52% of total collision accidents, respectively. They were followed by overspeed by the give-way vessel and negligence in collision avoidance in the stand-on vessel, which accounted for 16% and 33% of total collision accidents for each vessel. The ratio of collision accident causes of give-way vessels and stand-on vessels is illustrated in Figure 8.
The analyses confirmed that 99% of collision causes from give-way vessels and 90% from stand-on vessels were human errors. Therefore, the causes of collision accidents were further analysed using the SRK human error model and SLMV classification theory.
First, the SRK model was applied to the collision causes of fishing vessels. For the give-way vessels, 196 causes were related to skill-based behaviour, 53 causes to rule-based, and 36 causes to knowledge-based behaviour. The remaining three causes were not human errors, like machinery failure, health problem, and so on. For the stand-on vessels, 137 causes were related to skill-based behaviour, 106 to rule-based, and 17 to knowledge-based behaviour. The remaining 28 causes were not human errors, and the stand-on vessel was not at fault. The number of each cause in the SRK model and its ratio to the total number of accidents are provided in Table 7 and Figure 9.
In addition to the SRK model, the SLMV classification of human error was applied to the collision causes of fishing vessels. For the give-way vessels, five causes were classified as slips, one hundred and eighty-one causes as lapses, forty-nine causes as mistakes, and fifty causes as violations. The remaining three causes were not human errors as in the SRK model. For the stand-on vessels, no causes were related to slips, 137 to lapses, 108 to mistakes, and 15 to violations. The remaining 28 causes were not human errors and the stand-on vessel was not at fault. The number of each cause in the SLMV classification and its ratio to the total number of accidents are provided in Table 8 and Figure 10.
3.2.2. Causes of Occupational Accidents
Among the total of 453 fishing vessel accident cases analysed in detail with their causes, 67 cases were occupational accidents. The occupational accidents onboard fishing vessels were caused by a variety of causes, so it was impossible to either categorise the causes or model them using a Fault Tree. We therefore classified them using the SRK model and SLMV classification after careful review of the accident causes. Among the 67 occupational accidents, 14 cases were confirmed as not being directly related to human errors, like broken rope, equipment failure, and so on, and the remaining 53 cases were analysed in detail.
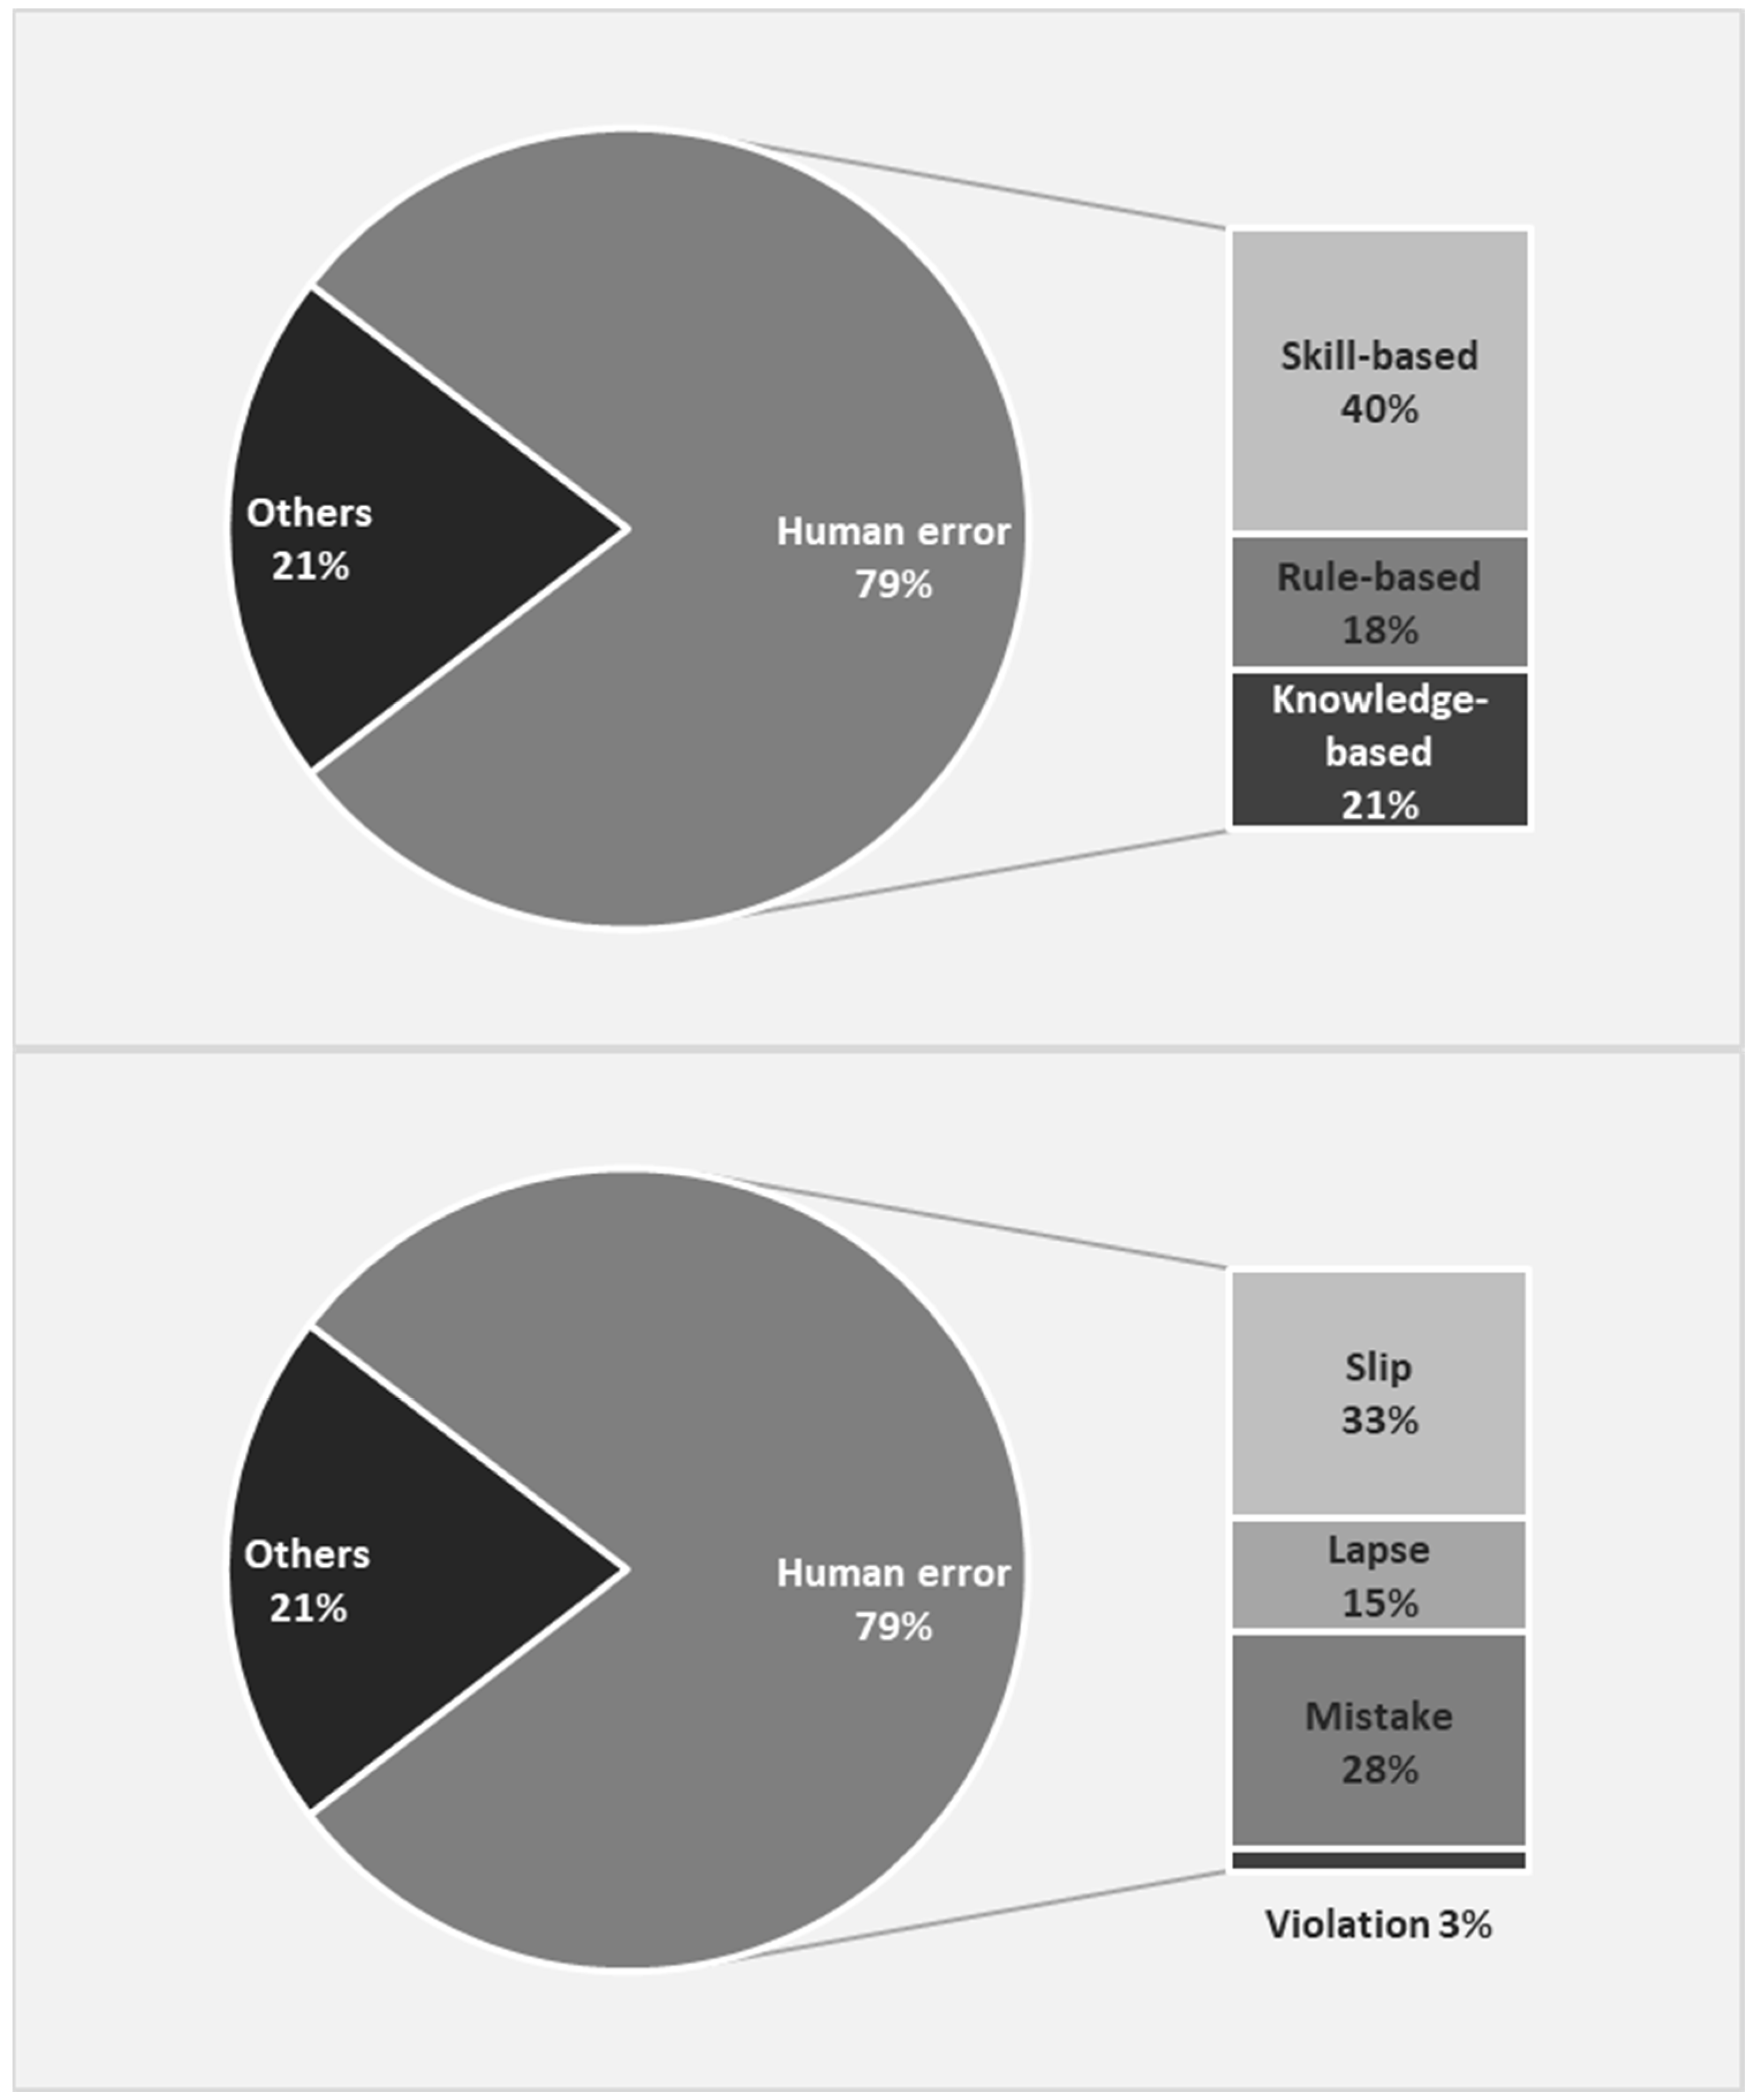
For the SRK model, 27 causes of occupational accidents were related to skill-based behaviour, 12 to rule-based, and 14 to knowledge-based behaviour. When SLMV classification was applied to the occupational accidents, twenty-two cases were classified as slips, ten as lapses, nineteen as mistakes, and two causes were classified as violations. The number and ratio of each cause of occupational accident in the SRK model and SLMV classification are provided in Table 9 and Figure 11.
3.2.3. Causes of Poor Communication with International Crew
Lastly, the two most critical accident types (collision and occupational accidents) were further analysed to investigate the impact of poor communication caused by an international crew. Each accident type was counted depending on whether an international crew member was onboard or not. The number of accidents with and without international crew onboard are provided in Table 10.
Among the 453 accidents, 49 accidents involved fishing vessels with international crew members onboard. Occupational accidents were related to both the largest number (19 accidents) and highest ratio (28.4%) of accidents with international crew. The number of accidents with and without international crew for the two accident types and their ratio are illustrated in Figure 12.
4. Discussion
4.1. Statistical Review of Fishing Vessel Accidents in South Korea
4.1.1. Statistical Review of Overall Accidents
From Table 1 in Section 3.1.1, the accident frequency (AF) of fishing vessels in South Korea in the last five years was per ship year, Individual risk (IR) was per person year, and Potential Loss of Life (PLL) was per ship year. To provide an overview on the status of fishing vessel safety in South Korea, these values can first be compared with other types of vessels, like cargo vessels and passenger vessels. The AF, IR, and PLL of container ships [29], tanker ships [41], cruise ships [30], and Ro–Ro passenger ferries [31] are provided in Table 11.
The accident frequency of fishing vessels in Korea and other commercial vessels shows relatively little difference, which means that the occurrence of fishing vessel accidents in Korea is similar to that of other commercial vessels in the world. However, the individual risk (IR) and Potential Loss of Life show significant difference from other commercial vessels. The IR of Korean fishing vessels is approximately three to seven times higher than commercial vessels, which means that the risk of death of individual fishermen onboard is much higher than that of other vessels. On the other hand, the PLL of Korean fishing vessels is approximately seven to three hundred and twelve times lower than commercial vessels, which means that the social impact of fishing vessel accidents is significantly lower than that of commercial vessels. For instance, the PLL of cruise vessels is 312 times greater than that of fishing vessels, and this means that 312 times more persons can lose their lives by a single accident in cruise vessel accidents than in fishing vessel accidents. Therefore, the social impact of cruise vessel accidents can be significantly higher than that of fishing vessels. To summarise, the occurrence of fishing vessel accidents in South Korea is similar to that of other commercial vessels in the world, but the individual risk to fishermen is significantly higher, and the social impact is lower than that of other commercial vessels. The high IR and low PLL mean that many fishermen lose their lives onboard, but they may not receive much public attention. Therefore, it is necessary to pay more attention to fishing vessel accidents in South Korea.
The accident frequency of fishing vessels in Korea can also be compared with that of fishing vessels in other countries [22]. The individual risks (IRs) of fishing vessels in South Korea, Norway, Canada, Iceland, Poland, Denmark, and the United Kingdom are provided in Table 12.
The IR of fishing vessels in South Korea is about seven times higher than Norway, four times higher than Canada, and two times higher than Iceland. The IR of Korean fishing vessels is similar to that of Poland and Denmark, and it is 1.2 time smaller than the IR of the United Kingdom. On average, the individual risk to fishermen on Korean fishing vessels is about three times higher than on fishing vessels in other countries, which means that we need to learn from these countries how they control the risks and improve the safety of fishing vessels.
4.1.2. Statistical Review of Accident Type and Casualty
The distribution of various fishing vessel accident types is provided in Table 2 and Figure 2 and Figure 3 in the Section 3.1.2. The results show that mechanical damage and navigational accidents account for 49% and 36% of all fishing vessel accidents in South Korea, respectively, based on the number of accidents. Occupational accidents account for only 7% of all accidents. However, occupational accidents account for about 40% of all casualties and 56% of all deaths, while few persons got injured by mechanical damage. The second largest impact to casualty accidents is collision accidents, which account for about 34% of all casualties and 41% of all injuries. This significant impact of occupational and collision accidents on casualties can be found in Table 3 and Figure 4.
The largest number of fishing vessel accidents caused by mechanical damage may mislead us to spend our valuable resources in improving mechanical reliability, first and foremost. However, high mechanical reliability can hardly improve the safety of fishing vessels because most of the casualties are caused by occupational and collision accidents, and few fishermen got injured by mechanical problems. It is, therefore, necessary to focus on occupational and collision accidents to improve the safety of fishing vessels in South Korea, even though the number of accidents caused by them is not as high as that of mechanical damage accidents.
4.1.3. Statistical Review on Vessel Size
In Section 3.1.3, the number of registered fishing vessels and accidents were reviewed by size of the vessels, and the results were provided in Table 4 and Figure 5. As summarised in the results, the largest number of accidents occurred with fishing vessel sized between 5 and 10 tons, and about two-thirds of the total accidents occurred from fishing vessels sized less than 10 tons. However, the accident frequency of these small fishing vessels was relatively lower. High accident frequency was shown in fishing vessels sized between 20 and 100 tons. The average accident frequency of fishing vessels over 10 tons is 0.145 per ship year, which is about six times higher than that of fishing vessels less than 10 tons.
These results show that there is a large number of smaller fishing vessels (less than 10 tons) registered in South Korea, so, of course, the number of accidents itself is also large, but the accident rate is very low. Therefore, simple safety measures that can be easily and widely applied to a large number of vessels simultaneously need to be developed for these small fishing vessels. On the other hand, larger fishing vessels (over 10 tons) have a lower number of accidents due to the small number of registered vessels, but the accident rate is significantly higher than smaller fishing vessels. For these larger vessels, comprehensive and detailed safety measures that can be applied to a small number of fishing vessels to reduce the occurrence of accidents need to be developed.
4.1.4. Statistical Review of Vessel Age
The number of registered fishing vessels and their accidents were reviewed in Section 3.1.4. As shown in the results in Table 5 and Figure 6, both the number of accident and accident frequency did not show much difference between new and old vessels, contrary to the general perception that the older vessels can be involved in more accidents. The largest number of accidents occurred with vessels aged 15–20 years, and the least accidents occurred with the fishing vessels of more than 25 years. The highest accident frequency was from vessels of more than 25 years, but it was only 3% higher than the frequency of newer vessels (5–10 years). The lowest frequency was from vessels aged between 10 and 15 years, which was about 30% lower than the vessels aged more than 26 years old, and the difference between the accident frequency of the newest fishing vessels (less than 5 years) and the oldest vessels (more than 25 years) was also about 30%. Considering that almost half of the fishing vessel accidents are caused by machinery damage, this result can confirm that the reliability of machinery in old fishing vessels is relatively well managed and controlled in South Korea, and the future safety policy needs to take care of the safety of fishing vessels evenly for all age groups.
4.2. Causes and Types of Fishing Accidents
4.2.1. Causes and Types of Collision Accidents
The collision accidents accounted for about 34% of overall casualties in fishing vessel accidents, which was the second highest proportion after occupational accidents. The results from the Fault Tree Analysis (FTA) in Figure 7 showed that thirteen causes from give-way vessels and six causes from stand-on vessels were involved in collision accidents of fishing vessels in South Korea. The give-way vessel is always at fault in the Collision accidents, while the stand-on vessel can be either at fault or not at fault, depending on the situation. The common causes from both give-way vessels and stand-on vessels were poor lookout, overspeed, and drunk sailing. Among the three causes, poor lookout accounted for 68% of all causes of give-way vessels, and 52% of stand-on vessels, as shown in Figure 8. It is, therefore, necessary to develop a safety policy to reduce poor lookout for both give-way and stand-on vessels. One interesting issue in poor lookout is that the automated navigation system sometimes has a negative effect. In some collision accidents, the captain put too much faith in the automated navigation system and did not take enough care in sailing. Comprehensive safety measures that take into account various factors need to be developed.
Eleven out of thirteen causes from give-way vessels were related to human errors, and four out of six causes were human errors in stand-on vessels. However, considering that the remaining two causes are not the fault of stand-on vessel (stand-on vessel not in sail and not able to avoid collision), all the faults by stand-on vessels are human errors. The three common causes discussed above are also human errors. The human errors accounted for 99% of all causes in give-way vessels and 90% of stand-on vessels, as shown in Figure 9.
The results from detailed human error analysis using the SRK model in Table 7 and Figure 9 show that the majority of human errors in collision accidents are rather simple human errors. For the give-way vessels, 68% of all causes were simple human errors from routine activities, and 18% from familiar activities with well-established procedures. Only 13% of the causes were related to complex and unfamiliar situations where the captain could not make a proper decision. This result shows that training and education may not be an efficient way to reduce collision accidents, because 68% of simple human errors in routine activities are not normally prevented by training and education. Rather, various other measures can be used to reduce collision accidents, like the continuous monitoring of the performance of fishermen, additional collision warning and alarm systems, self-checklists as a cognitive aid, fatigue management, and so on.
The results from the detailed human error analysis using the SLMV classification in Table 8 and Figure 10 show similar results as the SRK model. The simple human errors (slips and lapses) accounted for 65% of all causes in give-way vessels, and 48% in stand-on vessels. The wrong decision-making causing collision accidents accounted for 17% of causes in give-way vessel, and 37% in stand-on vessels. Similar to the results from the SRK model, it can be confirmed that training and education alone may not be efficient to reduce collision accidents of fishing vessels. It is also remarkable that 17% of causes from give-way vessels and 5% of stand-on vessels were intentional violations of regulations or rules, like overspeed, drunk sailing, and so on. This is a unique aspect of the SLMV classification compared with the SRK model, and we need completely different measures to prevent violation-related accidents, because they are normally hidden by the operators. Enhancing the safety regulations and clampdown are required to reduce collision accidents caused by intended violations.
4.2.2. Causes and Types of Occupational Accidents
The occupational accidents accounted for about 40% of all fishing vessel accidents, and human errors accounted for about 80% of occupational accidents in fishing vessel accidents. The human errors of occupational accidents were also reviewed in detail using the SRK model and SLMV classification, as shown in Table 9 and Figure 11. Similar to collision accidents, the majority of human errors of occupational accidents were simple errors in routine or familiar activities. Only 21% of occupational accidents were related to wrong decision-making with unfamiliar situation in the SRK model, and 28% in the SLMV classification. The two major differences between human errors in collision and occupational accidents were slips and violations in the SLMV classification. First, there were few or no slips in collision accidents (2% in give-way vessels and 0% in stand-on vessels), but slips accounted for 33% of occupational accidents. It is a reasonable result, considering that there are more simple and routine activities during fishing operations than navigation. The other was violations. Violations accounted for 17% of accidents in give-way vessels, but, in occupational accidents, only 3% of occupational accidents were intended violations of regulations or procedures. This implies that the crew members working on fishing operations are aware of the danger of fishing operations and try to prevent occupational accidents relatively more than captains do to prevent navigational accidents. However, the crew members make a large number of human errors due to external factors, like distractions, tiredness, heavy weather conditions, and so on. It is, therefore, necessary to develop a different safety policy to reduce occupational accidents than that of collision accidents. For instance, various measures can be applied, like continuous monitoring of tiredness, protection from dangerous equipment and heavy weather, and so on.
4.2.3. Causes and Types of Poor Communication with International Crew
In Section 3.2.3, the correlation between poor communication and occurrence of fishing vessel accidents was analysed by comparing the numbers of accidents with and without international crew members, and the results were illustrated in Table 10 and Figure 12. The results showed significant differences in collision and occupational accidents. While only 6% of collision accidents were caused by fishing vessels with international crew members, approximately 28% of occupational accidents occurred from fishing vessels with international crew members. It is a reasonable result, considering that navigational activities are normally conducted by a Korean captain alone, but fishing operations are conducted in collaboration with multiple crew members including international crew members. The communication onboard is, therefore, more important for fishing operations that can lead to occupational accidents in fishing vessels. There has been a common perception of this communication problem with international crew, and this result confirms this communication problem with significant quantitative differences. It is, therefore, necessary to develop proper measures to improve communication between Korean and international crew members.
4.3. Suggestions for Safety Policy of Fishing Vessels in South Korea
Based on the analysis of previous accidents presented in this study, seven recommendations are proposed below.
4.3.1. Adopt Best Practices from Countries
It is necessary to learn from several countries with lower individual risk (IR). In comparison with other fishing vessels and commercial vessels in the world, the individual risk (IR) is significantly higher in Korean fishing vessels. It can be beneficial to analyse and benchmark the safety policies of the other countries with lower IR to improve the safety of fishing vessels in South Korea.
4.3.2. Prioritise Occupational and Collision Accidents
It is necessary to focus on occupational and collision accidents. While the number of mechanical damage accidents accounts for half of all accidents, few fishermen got injured by them. Rather, occupational and collision accidents need to be the focus of safety policy because about two-thirds of all casualties were caused by occupational and collision accidents.
4.3.3. Develop Customised Safety Strategy
Tailor-made strategies for different vessel size groups are necessary. There is a larger number of small fishing vessels (less than 10 tons) than larger vessels (over 10 tons), and, of course, the number of accidents is also larger in small vessels. However, the accident frequency is significantly higher in larger fishing vessels; even the absolute number of accidents is much lower than that of smaller vessels. It is, therefore, required to develop different safety measures for small and large fishing vessels. For smaller vessels, simple safety measures, like checklists, can be easily applied to a large number of vessels efficiently. On the other hand, more comprehensive safety measures, like a risk-based approach, can be useful.
4.3.4. Ensure Uniform Safety Policies across Vessel Ages
The vessels of different ages can be considered evenly from a safety point of view. Across different vessel ages, there have been a similar number of accidents with similar accident frequencies, contrary to the general perception that older vessels can be more dangerous. This implies that the technical reliability of old fishing vessels is currently well managed and controlled, and the future safety policy can take care of fishing vessels in all age groups evenly.
4.3.5. Enhance Lookout Protocols
It is necessary to improve lookout to reduce collision accidents. For collision accidents, poor lookout was confirmed to be the most critical cause from both a qualitative and quantitative point of view, and, therefore, it is necessary to develop a future safety policy to reduce poor lookout. Considering that automated navigation systems sometimes can negatively impact lookout, a comprehensive safety policy needs to be developed, rather than a single safety measure.
4.3.6. Implement Comprehensive Human Error Reduction Strategy
Comprehensive measures are needed to reduce human errors onboard fishing vessels. By the SRK model and SLMV classification, it was confirmed that simple human errors from routine activities accounted for most of causes in collision accidents, which can hardly be prevented by education or training alone. It is, therefore, necessary to develop various and comprehensive safety measures to prevent human errors onboard fishing vessels.
4.3.7. Address Communication Challenges with International Crew
Lastly, we need to carefully consider the communication problem between Korean and international crew members, which was confirmed by the analysis results in this study. Specifically, it was confirmed that communication issues predominantly impacted occupational accidents involving tasks performed collaboratively by multiple crew members, including those from international backgrounds.
4.4. Future Work
This study provided the statistical overview and insight into the major causes of overall fishing vessel accidents. Safety policies and regulations for fishing vessels in South Korea require a comprehensive review and enhancement in light of international benchmarks, including those of Norway, Canada, Iceland, Poland, Denmark, and the United Kingdom. This revision is imperative to effectively translate the principal findings of this study into practical applications, thereby mitigating the risks associated with fishing operations in South Korea. Future work should focus on applying these insights to real-world contexts to ensure the safety of these maritime activities. Considering that different types of fishing vessels can be associated with significantly different types of accidents and human errors, similar analyses for various types of fishing vessels can be another important focus of future work.
5. Conclusions
The main objective of this study was to analyse fishing accident in South Korea and present the direction of safety policy for fishing vessels based on the lessons learnt from previous accidents in Korean waters. For this purpose, the marine accident data from the last five years provided by the Korea Maritime Safety Tribunal [13], the statistical yearbook of oceans and fisheries provided by the Ministry of Oceans and Fisheries [12], and the statistical survey of marine fisheries provided by the Korean Statistical Information Service [27] were analysed using both quantitative and qualitative approaches. Statistical review was conducted by calculating accident frequency (AF), individual risk (IR), and Potential Loss of Life (PLL), and more detailed analyses for the accident types and causes were conducted by Fault Tree Analysis (FTA), the Skill–Rule–Knowledge (SRK) model, and the Slip–Lapse–Mistake–Violation (SLMV) classification. The results provided both statistical overviews of the fishing vessel accidents in South Korea and insight into the major causes of them, which can contribute to presenting the direction of future safety policy for fishing vessels in South Korea, as follows:
- (1)
- Adopt best practices from countries with lower rates of fishing accidents;
- (2)
- Prioritise safety policies targeting occupational and collision accidents;
- (3)
- Develop customised safety strategies according to vessel size;
- (4)
- Ensure uniform safety policies across vessels of varying ages;
- (5)
- Enhance lookout protocols to reduce collision accidents;
- (6)
- Implement comprehensive strategies to minimise human errors;
- (7)
- Address communication challenges between Korean and international crews.
The findings of this study are expected to be utilised for various subsequent studies on fishing vessel safety and developing effective and efficient safety policy for fishing vessels in South Korea.
Author Contributions
Conceptualisation, H.K. and S.K.; methodology, H.K. and H.L.; quantitative analysis, H.K. and H.L.; qualitative analysis, H.K. and K.K.; data curation, H.K., H.L. and S.K.; writing—original draft preparation, H.K. and K.K.; writing—review and editing, Y.L. and K.K. All authors have read and agreed to the published version of the manuscript.
Funding
This research was supported by the ‘Development and demonstration of data platform for AI based safe fishing vessel design (20220210)’ funded by the Ministry of Oceans and Fisheries (MOF, Republic of Korea).
Institutional Review Board Statement
Not applicable.
Informed Consent Statement
Not applicable.
Data Availability Statement
Data are contained within the article.
Conflicts of Interest
The authors declare no conflicts of interest.
References
- FAO. The State of World Fisheries and Aquaculture—2000 (Sofia); Fishery and Aquaculture Economics and Policy Division, The State of World Fisheries and Aquaculture (Sofia): Rome, Italy, 2000. [Google Scholar]
- Angermayr, G.; Palacio, A.; Chaminade, C. Small-Scale Freshwater Aquaculture, Income Generation and Food Security in Rural Madagascar. Sustainability 2023, 15, 15439. [Google Scholar] [CrossRef]
- Jin, D.; Kite-Powell, H.L.; Thunberg, E.; Solow, A.R.; Talley, W.K. A Model of Fishing Vessel Accident Probability. J. Saf. Res. 2002, 33, 497–510. [Google Scholar] [CrossRef]
- Wang, F.; Du, W.; Feng, H.; Ye, Y.; Grifoll, M.; Liu, G.; Zheng, P. Identification of Risk Influential Factors for Fishing Vessel Accidents Using Claims Data from Fishery Mutual Insurance Association. Sustainability 2023, 15, 13427. [Google Scholar] [CrossRef]
- Funda, U.; Yıldız, S.; Boran, M.; Uğurlu, Ö.; Wang, J. Analysis of Fishing Vessel Accidents with Bayesian Network and Chi-Square Methods. Ocean Eng. 2020, 198, 106956. [Google Scholar]
- Lincoln, J.; Lucas, D. Commercial Fishing Deaths-United States, 2000–2009. Morb. Mortal. Wkly. Rep. 2010, 59, 842–845. [Google Scholar]
- ILO Fishing among the Most Dangerous of All Professions, Says Ilo. International Labour Organization. Available online: https://www.ilo.org/global/about-the-ilo/newsroom/news/WCMS_071324/lang--en/index.htm (accessed on 13 November 2023).
- Roberts, S.; Williams, J. Update on Mortality for Workers in the UK Merchant Shipping and Fishing Sectors; Maritime and Coastguard Agency; Department of Transport: Southampton, UK, 2007; Volume 56.
- KOSIS. Consumption of Fishery Products. Korean Statistical Information Service. Available online: https://www.index.go.kr/unity/potal/eNara/main/EnaraMain.do?cdNo=000 (accessed on 16 April 2024).
- OECD; Food and Agriculture Organization of the United Nations. OECD-FAO Agricultural Outlook 2020–2029; OECD Publishing: Paris, France; FAO: Rome, Italy, 2020. [Google Scholar]
- Lee, H. Status of Industrial Accidents in 2021; Ministry of Employment and Labor: Sejong-si, Republic of Korea, 2021.
- MOF. Statistical Yearbook of Oceans and Fisheries; Ministry of Ocean and Fisheries: Sejong-si, Republic of Korea, 2022.
- KMST. Marine Accident Statistics 2022; Korea Maritime Safety Tribunal: Sejong-si, Republic of Korea, 2023.
- Di, J.; Thunberg, E. An Analysis of Fishing Vessel Accidents in Fishing Areas Off the Northeastern United States. Saf. Sci. 2005, 43, 523–540. [Google Scholar]
- Jiangping, W.; Pillay, A.; Kwon, Y.S.; Wall, A.D.; Loughran, C.G. An Analysis of Fishing Vessel Accidents. Accid. Anal. Prev. 2005, 37, 1019–1024. [Google Scholar]
- Antão, P.; Almeida, T.; Jacinto, C.; Soares, C.G. Causes of Occupational Accidents in the Fishing Sector in Portugal. Saf. Sci. 2008, 46, 885–899. [Google Scholar] [CrossRef]
- Carlos, P.-L.; Azofra, M.; Blanco, B.; Achutegui, J.; Gonzalez, J. Analysis of Accident Inequality of the Spanish Fishing Fleet. Accid. Anal. Prev. 2006, 38, 1168–1175. [Google Scholar]
- Edgar, M.; Aasjord, H.L.; Utne, I.B.; Holmen, I.M. Fatalities in the Norwegian Fishing Fleet 1990–2011. Saf. Sci. 2013, 57, 335–351. [Google Scholar]
- Lise, H.L.; Hansen, H.L.; Jensen, O.C. Fatal Occupational Accidents in Danish Fishing Vessels 1989–2005. Int. J. Inj. Control Saf. Promot. 2008, 15, 109–117. [Google Scholar]
- Gudrun, P.; Hjoervar, T.; Snorrason, H. Fatal Accidents in the Islandic Fishing Fleet 1980–2005. Int. Marit. Health 2007, 58, 47–58. [Google Scholar]
- Marianne, T.; Karlsson, R.; Sæthre, H.; Kadefors, R. Analysis of Serious Occupational Accidents in Swedish Fishery. Saf. Sci. 1995, 21, 93–111. [Google Scholar]
- Jensen, O.C.C.; Petursdottir, G.; Holmen, I.M.; Abrahamsen, A.; Lincoln, J. A Review of Fatal Accident Incidence Rate Trends in Fishing. Int. Marit. Health 2014, 65, 47–52. [Google Scholar] [CrossRef] [PubMed]
- Yong, R.K.; Choe, S.W.; Kim, Y.S.; Koo, K.H. The Trend of Occupational Injuries in Korea from 2001 to 2010. Saf. Health Work 2013, 4, 63–70. [Google Scholar]
- Kim, S.-H.; Ryu, K.-J.; Lee, S.-H.; Lee, K.-H.; Kim, S.-H.; Lee, Y.-W. Enhancing Sustainability through Analysis and Prevention: A Study of Fatal Accidents on Trap Boats within the Commercial Fishing Industry. Sustainability 2023, 15, 15382. [Google Scholar] [CrossRef]
- Sur, J.M.; Kim, D.J. Comprehensive Risk Estimation of Maritime Accident Using Fuzzy Evaluation Method–Focusing on Fishing Vessel Accident in Korean Waters. Asian J. Shipp. Logist. 2020, 36, 127–135. [Google Scholar] [CrossRef]
- Oh, J.-H.; Kim, K.-I.; Jeong, J.-S. A Study on the Risk Analysis Based on the Trajectory of Fishing Vessels in the Vts Area. Int. J. e-Navig. Marit. Econ. 2015, 2, 38–46. [Google Scholar] [CrossRef]
- KOSIS. Number of Workers in the Maritime and Fiheries Sectors; Korean Statistical Information Service: Daejeon, Republic of Korea, 2023; Available online: https://kosis.kr/statHtml/statHtml.do?orgId=146&tblId=DT_MLTM_5002851&vw_cd=MT_ZTITLE&list_id=K2_11&seqNo=&lang_mode=ko&language=kor&obj_var_id=&itm_id=&conn_path=MT_ZTITLE (accessed on 30 October 2023).
- IMO. Revised Guideline for Formal Safety Assessment (FSA) for Use in the Imo Rule-Making Process (Msc-Mepc2./Circ.12/Rev.2); International Maritime Organization: London, UK, 2018. [Google Scholar]
- IMO. Formal Safety Assessment—Container Vessels (Msc 83/Inf.8); International Maritime Organization: London, UK, 2007. [Google Scholar]
- IMO. Formal Safety Assessment—Cruise Ships (Msc 85/Inf.2); International Maritime Organization: London, UK, 2008. [Google Scholar]
- IMO. Formal Safety Assessment—Ropax Ships (Msc 85/Inf.3); International Maritime Organization: London, UK, 2008. [Google Scholar]
- KMST. Marine Safety Judgement Decision; Korea Maritime Safety Tribunal: Sejong-si, Republic of Korea, 2023. Available online: https://www.kmst.go.kr/web/verdictList.do?menuIdx=121 (accessed on 10 April 2023).
- Jens, R. Skills, Rules, and Knowledge; Signals, Signs, and Symbols, and Other Distinctions in Human Performance Models. IEEE Trans. Syst. Man Cybern. 1983, 13, 257–266. [Google Scholar]
- James, R. Human Error; Cambridge University Press: Cambridge, UK, 1990. [Google Scholar]
- Rausand, M.; Haugen, S. Risk Assessment: Theory, Methods, and Applications; Wiley: Hoboken, NJ, USA, 2020. [Google Scholar]
- Baker, C.C.; McCafferty, D.B. Accident Database Review of Human Element Concerns: What Do the Results Mean for Classification. In Proceedings of the International Conference Human Factors in Ship Design and Operation RINA 2005, London, UK, 23–24 February 2005. [Google Scholar]
- Sánchez-Beaskoetxea, J.; Basterretxea-Iribar, I.; Sotés, I.; Machado, M.D. Human error in marine accidents: Is the crew normally to blame? Marit. Transp. Res. 2021, 2, 100016. [Google Scholar] [CrossRef]
- Catherine, H.; Flin, R.; Mearns, K. Safety in Shipping: The Human Element. J. Saf. Res. 2006, 37, 401–411. [Google Scholar]
- IMO. Voluntary Guidelines for the Design, Construction and Equipment of Small Fishing Vessels; FAO: London, UK, 2005. [Google Scholar]
- Willman, R. Economic Factors of Excess Fishing Effort. In Proceedings of the Exploitation and Management of Marine Fishery Resources in Southeast Asia/22nd Session of the Indo-Pacific Fishery Commission, Darwin, Australia, 16–19 February 1987. [Google Scholar]
- IMO. Formal Safety Assessment—Crude Oil Tankers (Mepc 58/Inf.2); International Maritime Organization: London, UK, 2008. [Google Scholar]
Figure 1.
Number of fishing vessel accidents and casualties in South Korea by year (2018–2022).

Figure 2.
Fishing vessel accident types by year (2018–2022).

Figure 3.
Proportional distribution of six categories of fishing vessel accidents (2018–2022).

Figure 4.
Average number of Fatality/Missing and Injury by Accident Type (2018–2021).

Figure 5.
Distribution of fishing vessel accidents and frequency by vessel size (2018–2021).

Figure 6.
Distribution of fishing vessel accidents and frequency by vessel age (2018–2021).

Figure 7.
Fault tree of collision accidents of fishing vessels.

Figure 8.
Ratio of collision causes for give-way vessels (up) and stand-on vessels (down).

Figure 9.
Ratio of SRK behaviours of collision causes for give-way vessels (up) and stand-on vessels (down).
Figure 9.
Ratio of SRK behaviours of collision causes for give-way vessels (up) and stand-on vessels (down).

Figure 10.
Ratio of SLMV classification of collision causes for give-way vessels (up) and stand-on vessels (down).
Figure 10.
Ratio of SLMV classification of collision causes for give-way vessels (up) and stand-on vessels (down).

Figure 11.
Occupational accident ratio of SRK behaviour (up) and SLMV classification (down).

Figure 12.
Number of accidents and accident ratio with/without international crew.


Table 1.
Fishing vessel accidents in South Korea from 2018 to 2022.
| 2018 | 2019 | 2020 | 2021 | 2022 | Average | |
|---|---|---|---|---|---|---|
| Number of accidents | 1846 | 1951 | 2100 | 1786 | 1718 | 1880 |
| Number of accident vessels | 2013 | 2134 | 2331 | 1971 | 1904 | 2071 |
| Number of fatality and missing | 89 | 79 | 99 | 89 | 83 | 88 |
| Number of injury | 214 | 371 | 352 | 327 | 205 | 294 |
| Number of registered fishing vessels | 65,096 | 65,835 | 65,744 | 65,531 | 64,385 | 65,318 |
| Number of registered fishermen | 87,447 | 82,828 | 78,784 | 87,152 | - | 84,053 * |
| Accident frequency (per ship year) | 3.09 × 10⁻² | 3.24 × 10⁻² | 3.55 × 10⁻² | 3.01 × 10⁻² | 2.96 × 10⁻² | 3.17 × 10⁻² |
| Individual risk (per person year) | 1.02 × 10⁻³ | 9.54 × 10⁻⁴ | 1.26 × 10⁻³ | 1.02 × 10⁻³ | - | 1.06 × 10⁻³ * |
| Potential Loss of Life (per ship year) | 1.37 × 10⁻³ | 1.20 × 10⁻³ | 1.51 × 10⁻³ | 1.36 × 10⁻³ | 1.29 × 10⁻³ | 1.34 × 10⁻³ |
* Average from 2018 to 2021.
Table 2.
Six categories of fishing vessel accidents with number of accidents and frequencies.
| Category No | 2018 | 2019 | 2020 | 2021 | 2022 | Average | Accident Frequency | ||
|---|---|---|---|---|---|---|---|---|---|
| 1 | Mechanical Damage | Machinery Damage | 588 | 541 | 605 | 532 | 513 | 556 | 8.51 × 10⁻³ |
| Propeller Entangled | 222 | 277 | 287 | 268 | 250 | 261 | 3.99 × 10⁻³ | ||
| Shaft Damage | 146 | 149 | 127 | 102 | 98 | 124 | 1.90 × 10⁻³ | ||
| Rudder Damage | 81 | 83 | 102 | 65 | 69 | 80 | 1.22 × 10⁻³ | ||
| Total | 1037 | 1050 | 1121 | 967 | 930 | 1021 | 1.56 × 10⁻² | ||
| 2 | Navigational Accident | Collision | 333 | 341 | 392 | 319 | 299 | 337 | 5.16 × 10⁻³ |
| Flooding | 143 | 117 | 138 | 116 | 142 | 131 | 2.01 × 10⁻³ | ||
| Grounding | 107 | 112 | 158 | 94 | 115 | 117 | 1.79 × 10⁻³ | ||
| Sailing Hindered | 69 | 69 | 67 | 43 | 53 | 60 | 9.22 × 10⁻⁴ | ||
| Capsizing | 30 | 69 | 85 | 48 | 50 | 56 | 8.63 × 10⁻⁴ | ||
| Sinking | 23 | 36 | 39 | 27 | 12 | 27 | 4.19 × 10⁻⁴ | ||
| Contact | 7 | 12 | 18 | 25 | 15 | 15 | 2.36 × 10⁻⁴ | ||
| Total | 712 | 756 | 897 | 672 | 686 | 745 | 1.14 × 10⁻² | ||
| 3 | Occupational Accident | 136 | 184 | 149 | 147 | 115 | 146 | 2.24 × 10⁻³ | |
| 4 | Fire/Explosion | 91 | 91 | 110 | 137 | 108 | 107 | 1.64 × 10⁻³ | |
| 5 | Marine Pollution | 27 | 30 | 21 | 25 | 13 | 23 | 3.55 × 10⁻⁴ | |
| 6 | Others | 10 | 23 | 33 | 23 | 52 | 28 | 4.32 × 10⁻⁴ | |
| Sum | 2013 | 2134 | 2331 | 1971 | 1904 | 2071 | 3.17 × 10⁻² | ||
Table 3.
Numbers and frequencies of casualty by accident type (2018–2021).
| Avg. Casualty (Person) | Avg. Fatality/Missing (Persons) | Avg. Injury (Persons) | Casualty Frequency (Per Person Year) | Fatality/Missing Frequency (Per Person Year) | Injury Frequency (Per Person Year) | |
|---|---|---|---|---|---|---|
| Occupational | 158.3 | 49.8 | 108.5 | 2.13 × 10⁻³ | 5.92 × 10⁻⁴ | 1.52 × 10⁻³ |
| Collision | 139.3 | 10.0 | 129.3 | 1.97 × 10⁻³ | 1.19 × 10⁻⁴ | 1.85 × 10⁻³ |
| Capsizing | 30.3 | 19.5 | 10.8 | 3.86 × 10⁻⁴ | 2.32 × 10⁻⁴ | 1.47 × 10⁻⁴ |
| Grounding | 25.5 | 0.5 | 25.0 | 3.70 × 10⁻⁴ | 5.95 × 10⁻⁶ | 3.64 × 10⁻⁴ |
| Contact | 25.8 | 1.3 | 24.5 | 3.46 × 10⁻⁴ | 1.49 × 10⁻⁵ | 3.31 × 10⁻⁴ |
| Fire/Explosion | 17.8 | 6.0 | 11.8 | 2.63 × 10⁻⁴ | 7.14 × 10⁻⁵ | 1.90 × 10⁻⁴ |
| Sinking | 3.3 | 1.0 | 2.3 | 3.98 × 10⁻⁵ | 1.19 × 10⁻⁵ | 2.76 × 10⁻⁵ |
| Others | 5.0 | 1.0 | 4.0 | 7.35 × 10⁻⁵ | 1.19 × 10⁻⁵ | 6.12 × 10⁻⁵ |
| Total | 405.0 | 89.0 | 316.0 | 5.43 × 10⁻³ | 1.06 × 10⁻³ | 4.37 × 10⁻³ |
Table 4.
Fishing vessel accidents by vessel size (2018–2021).
| Avg. Number of Registered Vessels | Avg. Number of Accidents | Accident Frequency | |
|---|---|---|---|
| Less than 1 ton | 13,602 | 59 | 4.32 × 10⁻³ |
| 1–2 tons | 20,892 | 249 | 1.19 × 10⁻² |
| 2–3 tons | 7865 | 196 | 2.50 × 10⁻² |
| 3–5 tons | 10,638 | 391 | 3.68 × 10⁻² |
| 5–10 tons | 8929 | 658 | 7.37 × 10⁻² |
| 10–20 tons | 1023 | 49 | 4.77 × 10⁻² |
| 20–30 tons | 1048 | 182 | 1.74 × 10⁻¹ |
| 30–50 tons | 522 | 118 | 2.26 × 10⁻¹ |
| 50–100 tons | 683 | 149 | 2.19 × 10⁻¹ |
| Over 100 tons | 553 | 59 | 1.06 × 10⁻¹ |
| Total | 65,754 | 2111 | 3.21 × 10⁻² |
Table 5.
Fishing vessel accidents by vessel age (2018–2021).
| Avg. Number of Registered Vessels | Avg. Number of Accidents | Accident Frequency | |
|---|---|---|---|
| Less than 5 years | 12,203 | 320 | 2.62 × 10⁻² |
| 5–10 years | 9711 | 361 | 3.72 × 10⁻² |
| 10–15 years | 11,273 | 295 | 2.62 × 10⁻² |
| 15–20 years | 13,810 | 447 | 3.23 × 10⁻² |
| 20–25 years | 11,742 | 353 | 3.00 × 10⁻² |
| More than 25 years | 7015 | 269 | 3.84 × 10⁻² |
| Total | 65,754 | 2045 | 3.11 × 10⁻² |
Table 6.
Number of each collision cause for give-way vessels (left) and stand-on vessels (right).
| Collision Cause of Give-Way Vessel | Collision Cause of Stand-On Vessel | ||
|---|---|---|---|
| Poor Lookout | 197 | Poor Lookout | 150 |
| Overspeed | 45 | Negligence in Collision Avoidance | 95 |
| Sailing while Dozing | 9 | Stand-on vessel not in Sail | 19 |
| Improper Route | 8 | Not enough Time to Evade | 11 |
| Improper Steering | 7 | Overspeed | 11 |
| Others | 22 | Drunk Sail | 2 |
| Total | 288 | Total | 288 |
Table 7.
SRK model of collision causes for give-way vessels (left) and stand-on vessels (right).
| SRK Model (Give-Way Vessel) | SRK Model (Stand-On Vessel) | ||
|---|---|---|---|
| Skill-based | 196 | Skill-Based | 137 |
| Rule-based | 53 | Rule-Based | 106 |
| Knowledge-based | 36 | Knowledge-Based | 17 |
| Others | 3 | Others | 28 |
| Total | 288 | 288 | |
Table 8.
SLMV classification of collision causes for give-way vessels (left) and stand-on vessels (right).
Table 8.
SLMV classification of collision causes for give-way vessels (left) and stand-on vessels (right).
| SLMV Classification (Give-Way Vessel) | SLMV Classification (Stand-On Vessel) | ||
|---|---|---|---|
| Slip | 5 | Slip | 0 |
| Lapse | 181 | Lapse | 137 |
| Mistake | 49 | Mistake | 108 |
| Violation | 50 | Violation | 15 |
| Others | 3 | Others | 28 |
| Total | 288 | Total | 288 |
Table 9.
SRK model and SLMV classification for occupational accidents.
| SRK Model for Occupational Accidents | SLMV Classification for Occupational Accidents | ||
|---|---|---|---|
| Skill-based | 27 | Slip | 22 |
| Rule-based | 12 | Lapse | 10 |
| Knowledge-based | 14 | Mistake | 19 |
| Not human error | 14 | Violation | 2 |
| Not human error | 14 | ||
| Sum | 67 | Sum | 67 |
Table 10.
Number of accidents with/without international crew member.
| Number of Accidents without International Crew | Number of Accidents with International Crew | Ratio | |
|---|---|---|---|
| Collision | 290 | 17 | 5.9% |
| Occupational | 67 | 19 | 28.4% |
| Others | 96 | 13 | 13.5% |
| Sum | 453 | 49 | 10.8% |
Table 11.
Comparison of accidents of fishing vessels in Korea and other commercial vessels.
| Fishing Vessel in Korea | Container Ship | Tanker Ship | Cruise Ship | Ro–Pax Ship | |
|---|---|---|---|---|---|
| Accident frequency (per ship year) | 3.17 × 10⁻² | 3.28 × 10⁻² | 3.28 × 10⁻² | 4.40 × 10⁻² | 4.52 × 10⁻² |
| Individual risk (per person year) | 1.06 × 10⁻³ | 2.25 × 10⁻⁴ | 4.21 × 10⁻⁴ | 1.60 × 10⁻⁴ | 2.61 × 10⁻⁴ |
| Potential Loss of Life (per ship year) | 1.34 × 10⁻³ | 9.00 × 10⁻³ | 1.26 × 10⁻² | 4.20 × 10⁻¹ | 2.22 × 10⁻¹ |
Table 12.
Comparison of individual risks of fishing vessels in Korea and other countries.
| Fishing Vessel in Korea | Norway | Canada | Iceland | Poland | Denmark | UK | |
|---|---|---|---|---|---|---|---|
| Individual risk (per person year) | 1.06 × 10⁻³ | 1.45 × 10⁻⁴ | 2.40 × 10⁻⁴ | 5.00 × 10⁻⁴ | 9.00 × 10⁻⁴ | 1.00 × 10⁻³ | 1.26 × 10⁻³ |
Disclaimer/Publisher’s Note: The statements, opinions and data contained in all publications are solely those of the individual author(s) and contributor(s) and not of MDPI and/or the editor(s). MDPI and/or the editor(s) disclaim responsibility for any injury to people or property resulting from any ideas, methods, instructions or products referred to in the content. |
© 2024 by the authors. Licensee MDPI, Basel, Switzerland. This article is an open access article distributed under the terms and conditions of the Creative Commons Attribution (CC BY) license (https://creativecommons.org/licenses/by/4.0/).
Share and Cite
MDPI and ACS Style
Kim, H.; Koo, K.; Lim, H.; Kwon, S.; Lee, Y. Analysis of Fishing Vessel Accidents and Suggestions for Safety Policy in South Korea from 2018 to 2022. Sustainability 2024, 16, 3537. https://doi.org/10.3390/su16093537
AMA Style
Kim H, Koo K, Lim H, Kwon S, Lee Y. Analysis of Fishing Vessel Accidents and Suggestions for Safety Policy in South Korea from 2018 to 2022. Sustainability. 2024; 16(9):3537. https://doi.org/10.3390/su16093537
Chicago/Turabian StyleKim, Hyungju, Kwiyeon Koo, Hyunjeong Lim, Sooyeon Kwon, and Yoowon Lee. 2024. "Analysis of Fishing Vessel Accidents and Suggestions for Safety Policy in South Korea from 2018 to 2022" Sustainability 16, no. 9: 3537. https://doi.org/10.3390/su16093537
Note that from the first issue of 2016, this journal uses article numbers instead of page numbers. See further details here.