
Land-Use Transitions and Its Driving Mechanism Analysis in Putian City, China, during 2000–2020

1
College of Digital Economy, Fujian Agriculture and Forestry University, Fuzhou 350002, China
2
Institute of Agroecology, Fujian Agriculture and Forestry University, Fuzhou 350002, China
3
College of Rural Revitalization, Fujian Agriculture and Forestry University, Fuzhou 350002, China
4
Ecological Civilization Research Center, Fujian Agriculture and Forestry University, Fuzhou 350002, China
*
Authors to whom correspondence should be addressed.
Sustainability 2024, 16(9), 3549; https://doi.org/10.3390/su16093549
Submission received: 18 March 2024
/
Revised: 19 April 2024
/
Accepted: 21 April 2024
/
Published: 24 April 2024
(This article belongs to the Special Issue Eco-Environmental Effects and Spatio-Temporal Evolution Characteristics of Land Use Change)
Abstract
:Investigating the spatial-temporal evolution of land use and its driving forces provides a scientific basis for policy formulation, land-use structure adjustment, and ecological civilization development. Using the Google Earth Engine (GEE) platform, this study analyzed remote sensing images from 2000, 2010, and 2020 to derive basic land-use data for Putian City and its five districts and counties. These data were then systematically analyzed using methodologies such as Single Land-use Dynamics and Geo-informatic Tupu to reveal the characteristics of land-use transitions (LUTs), and the spatial-temporal evolution pattern over the past two decades in Putian City, China. Subsequently, socioeconomic conditions and macro policies were identified as driving factors to further explore the mechanisms behind land-use evolution in the study area through canonical correspondence analysis (CCA). The findings revealed that: (1) The predominant land-use structure in Putian City consisted mainly of cultivated land and forest land, with other land types interspersed within them, while built-up land exhibited continual outward expansion. (2) Various regions within Putian City exhibited varying degrees of abandoned farmland, ultimately transforming into wasteland (grassland) with weed growth, presenting significant challenges for ensuring food security and mitigating the conversion of cultivated land to non-agricultural and non-grain uses. (3) Specific macro-economic development objectives during distinct periods, particularly urban expansion and the growth of the secondary industry resulting from municipal and county mergers, emerged as pivotal factors driving the spatial and temporal evolution of land use and influenced the differential distribution pattern across Putian City. Consequently, this study suggests bolstering scientific planning and implementing effective regulations concerning land use, and it advocates for the efficient utilization of space-time resources pertaining to cultivated land, integrating them with agriculture, culture, and tourism endeavors. Such measures are proposed to ensure the harmonized and sustainable development of the regional ecological economy.
1. Introduction
Land-use and land-cover change (LULCC), driven by a variety of natural and anthropogenic factors, is the most direct consequence of human activities on surface systems and a central aspect of global environmental change and sustainable development. Rapid urban expansion and industrial development are among the most significant drivers of land-use change [1,2,3]. As cities grow, the demand for residential, commercial, and industrial land increases, leading to the conversion of agricultural land and natural habitats into built-up areas. On the other hand, government policies such as subsidies, taxes, and land-use regulations can significantly influence land-use patterns [4,5,6]. For example, policies that promote industrialization and urban development can lead to the conversion of agricultural land to non-agricultural uses. Market forces, including demand for particular crops or commodities, can also drive land-use change as farmers and landowners respond to economic incentives. Thus, it can be seen that the ongoing process of globalization, coupled with rapid urbanization and industrialization worldwide, particularly in developing countries, has profoundly influenced the socio-economic landscape [7,8,9], thereby elevating land-use transition as a new topic and frontier in LULCC investigations.
Since the 1990s, China’s urban-rural transformation has triggered significant land-use transitions (LUTs), profoundly impacting ecosystem structure and its service functions. This phenomenon poses threats to human sustainable development, the provision of ecosystem services, and the habitat of wild animals [10]. For instance, the transition of native grasslands, forests, and wetlands into farmland, artificial forests, and developed areas has notably increased the production of food, wood, housing, and other commodities. However, this comes at the expense of diminished ecosystem services and biodiversity [11,12]. Moreover, LUTs serves as a significant driver of global climate change and a notable source of greenhouse gas (GHG) emissions [13,14]. Afforestation, a commonly employed method for carbon dioxide removal, is constrained by suitable land availability. Studies indicate a potential cumulative CO2 sequestration of 730 GtCO2 between 2030 and 2100 [15]. Additionally, changes in crop and pasture land use exert both direct and indirect effects on CO2 emissions [16]. Therefore, in-depth analysis of the spatial and temporal characteristics of LUTs is crucial not only for elucidating the process and, causes of such transition, but also for promoting the rational utilization of land resources and fostering sustainable socio-economic development.
In recent years, the dynamic temporal and spatial changes in land use have garnered increasing attention from researchers worldwide. Numerous research achievements have been attained, offering valuable insights for further understanding the processes and drivers of land-use transitions (LUTs), enhancing resource utilization rates, and guiding research endeavors in typical or specific areas. Researchers primarily focus on the transition of cultivated land, wetlands, and other land types [17,18], and most of these studies concentrate on macro scales such as provinces, basins, and plains [5,19,20]. Land-use dynamic index [21,22], land-use degree [23], land-use comprehensive index [24,25] are employed to analyze the spatial-temporal change characteristics of land use while spatial econometric regression analysis [26,27], landscape pattern index [28], and CLUE-S model [29,30], PLUS Model [31], etc., are commonly adopted to investigate the evolution of land-use spatial pattern. While the aforementioned research methods provide insights into the spatial and temporal evolution characteristics of LUTs, they often fail to effectively integrate the temporal process with the spatial pattern. Consequently, the obtained characteristics lack a visual sense, and non-spatial data are not adequately represented in terms of spatial location. Geo-informatic Tupu, however, offers a spatiotemporal analysis method capable of illustrating the spatial structure characteristics and temporal changes of phenomena through data mining and specialized processing. By generating a series of intuitive graphs, images, and schema information in the form of Tupu units, this approach facilitates the visualization of land-use change processes [8,32,33,34,35]. In essence, Geo-informatic Tupu enables the recording of composite spatiotemporal land-use change information using Tupu units, thereby enhancing the accuracy, intuitiveness, and realism of LUTs research. Currently, Geo-informatic Tupu finds applications in various domains, including ecosystem services valuation [8,36], landscape multifunctionality [37], and habitat quality [38], etc. However, the existing literatures predominantly focuses on statistical analysis and the spatial-temporal distribution of land-use Tupu, while giving less attention to the underlying reasons for changes in Tupu units and regional differences. Moreover, research efforts are predominantly concentrated in river basins, economically developed regions, and ecologically vulnerable areas.
Coastal cities, endowed with abundant natural and economic resources, have historically been pioneers in the development of the marine economy. Their pursuit of sustainable development has introduced new challenges to land-use planning and management. Consequently, exploring the land-use evolution in coastal cities is particularly pertinent and illustrative [39,40,41]. Putian City, an emerging coastal tourist destination in China, boasts abundant biodiversity resources. It serves as the national production base for longan, litchi, and olive, and is renowned as a prime location for south subtropical crops such as loquat and Wendan pomelo, earning the title of “the first hometown of loquat in China” from Ministry of Agriculture and Rural Affairs. Positioned as a pivotal component of the Economic Zone on the West Bank of the Strait, Putian City plays a crucial role in the ecological security framework of Fujian Province, China. In recent years, accelerated highway/railway construction, industrialization, and urbanization have contributed to the conversion of a significant amount of agricultural and ecological land in Putian City into built-up areas. This has resulted in a conflict between the protection of cultivated land and ecological conservation, and the expansion of urban areas. Such resource consumption patterns have led to issues like sensitive land-use changes and inefficient urbanization [42]. However, there have been limited studies on land-use transitions (LUTs) and their ecological implications in Putian City. We argue that it is essential to monitor and analyze changes in land use, and promptly investigate the spatial and temporal patterns of LUTs and their underlying causes in Putian City. Accordingly, the existing literature lacks comprehensive analysis regarding the spatial-temporal evolution of land-use transitions (LUTs), with the insufficient integration of “spatial pattern” and “time process”. Thus, the innovative aspects of our study lie in its comprehensive approach to analyzing LUTs by coupling Geo-informatic Tupu and Canonical Correspondence Analysis (CCA) models. This integration provides a unique spatiotemporal perspective that enhances the understanding of LUTs. Hence, the main objectives of this study were: (1) to employ Geo-informatics and canonical Correspondence Analysis (CCA) methods to assess the spatial-temporal evolution pattern of land use; (2) to investigate the driving mechanisms of land use in Putian City, China, from 2000 to 2020; and (3) to provide practical measures that will not only optimize land-use patterns, but also improve the efficiency and effectiveness of land use. The results aim to offer decision-making references for optimizing land resource allocation, fostering rational development and utilization, and informing the formulation of regional economic sustainable development strategies.
2. Study Area and Methods
2.1. Overview of the Study Area
Putian City is situated in the central coastal area of Fujian Province, southeastern China, spanning between 24°59′–25°46′ N and 118°27′–119°39′ E. It governs five districts and counties: Licheng District, Hanjiang District, Chengxiang District, Xiuyu District, and Xianyou County. Renowned as the birthplace of Mazu, the goddess of peace at sea, it is home to the world Mazu Cultural Center (Figure 1). The northwest region of Putian City is characterized by high-lying mountain ranges, while the southeastern coast is predominantly composed of low hills and plains. Notably, the city encompasses the Xinghua plain, the third largest plain in Fujian Province, renowned as the largest “land of fish and rice” within the city limits. Putian City experiences a marine subtropical monsoon climate, with an average annual temperature ranging between 18–21 °C and abundant but spatially uneven rainfall, averaging between 1000–1800 mm annually. The city boasts a relatively developed water system, comprising the Mulan River, Yanshou River, and Qiulu River. The predominant soil types are red soil and paddy soil, while the vegetation predominantly consists of evergreen broad-leaved forests. As of 2020, the city achieved a forest coverage rate of 60.21%, earning the title of “National Forest City”. However, due to production and construction activities, slope farmland experiences significant water and soil loss, with widespread occurrences of such losses under forest cover. In 2020, Putian City’s GDP amounted to 264.397 billion CNY, with a resident population of 3.2107 million. The primary, secondary, and tertiary industries accounted for 4.75%, 51.53%, and 43.72% of the GDP, respectively.
It is worth noting that while Putian City may not represent the entire country’s land-use dynamics due to China’s vast geographical and socio-economic diversity, it does offer insights into the processes and drivers of land-use change that are relevant to other coastal regions undergoing similar development trajectories. The city’s experience with urbanization, industrialization, and the pursuit of sustainable development is reflective of broader trends in China’s coastal areas, where economic growth and environmental conservation often intersect. Thus, by examining the land-use transitions (LUTs) in Putian City, this study aims to inform policy-making and planning strategies at the local and regional levels, which can be adapted or scaled up to address land-use challenges in other parts of the country.
2.2. Data Acquisition and Processing
In recent years, several geospatial data cloud computing platforms have flourished, such as Google Earth Engine (GEE), PIE-Engine (PIE), etc., which have changed the traditional way of storing, managing, and analyzing geospatial data, and greatly improved the computing efficiency by integrating the data resources, providing big data processing tools and high-performance arithmetic power [43,44,45,46]. Utilizing the GEE cloud platform, Landsat remote sensing images from 2000, 2010, and 2020 were selected as the foundational data, ensuring cloud cover remained below 5%. These images possess a spatial resolution of 30 m (the information on remote sensing images can be found in Table 1). To perform land-use classification, we first need to draw training samples for each type on remote sensing images, which must be updated through visual interpretation and field validation using high-resolution Sentinel images and high-precision historical Google Earth images to obtain the sample training set. On this basis, a random forest classifier is then used to classify the land-use data in the study area. Due to the fact that the entire procedure is too lengthy, and has been presented many times in previous studies, such as [47], it will not be repeated in this study.
To enhance interpretation accuracy, the normalized difference vegetation index (NDVI), normalized difference build-up index (NDBI), and enhanced vegetation index (EVI) were employed as training variables for the random forest (RF) algorithm. Land-use types were categorized into cultivated land (CL), forest land (FL), orchard land (OL), grassland (GL), water body (WB), built-up land (BL), and unused land (UL), aligning with the actual conditions and research objectives of the study area. Subsequently, a land-use spatial database for Putian City was established by assigning codes 1 through 7 to each respective land-use region. Additionally, the data for socio-economic indicators were from Putian Statistical Yearbook were extracted from 2001 to 2021 (https://www.putian.gov.cn/zjpt/pttjnj/, accessed on 16 November 2023).
2.3. Methodologies
2.3.1. Random Forest Algorithm (RF Algorithm)
The RF algorithm, proposed by Leo Breiman in 2001 [48] is a supervised machine learning algorithm widely utilized in classification and regression problems, particularly in land-use classification [49,50,51,52]. Known for its high classification accuracy, the RF algorithm operates based on the following principles: (1) Bootstrap sampling method: N groups of training sets are repeatedly and randomly extracted from the original dataset, and each group is returned. (2) Each group’s training set comprises approximately two-thirds of the original data, while the test set encompasses around one-third of the original data. (3) Each decision tree consists of a group of corresponding training sets. During the construction of each tree, m (where m ≤ M) feature variables are randomly selected from M feature variables to divide the internal nodes. This subset, composed of m variables, is referred to as the feature random subspace. (4) The prediction results of N decision trees are integrated, and new sample categories are determined through voting. (5) Through the aforementioned steps, an RF model with N decision trees is established. Its performance is evaluated using the test set, and the importance of each feature is ranked.
As previously mentioned, the RF algorithm was chosen for land-use classification due to its high accuracy and ability to handle a large number of input variables. This supervised learning algorithm operates by constructing multiple decision trees during training and outputs the class that is the mode of the classes (for classification) of the individual trees. It is particularly useful for remote sensing image classification because it can effectively integrate spectral indices, such as NDVI, NDBI, and EVI, which are crucial for differentiating between various land-use types.
2.3.2. Three Spectral Indices
The NDVI (Normalized Difference Vegetation Index) is a dimensionless index that quantifies the difference between the reflectance of visible light and near-infrared light by vegetation coverage. It serves as a measure to estimate the density of vegetation on the land surface. The calculation formula for NDVI is as follows [53]:
The NDBI (Normalized Difference Built-up Index) is utilized for the automated mapping of built-up areas. Its primary advantage lies in its distinctive spectral response to built-up areas compared to other land cover types. The calculation formula for NDBI is as follows [54]:
The EVI (Enhanced Vegetation Index) is regarded as an enhanced version of NDVI, designed to improve sensitivity and vegetation monitoring capabilities in high biomass areas. It achieves this by decoupling the canopy background signal and reducing atmospheric impact. EVI was endorsed by the MODIS (Moderate Resolution Imaging Spectroradiometer) terrestrial discipline group as the second global vegetation index for monitoring terrestrial photosynthetic vegetation activities. The calculation formula for EVI is as follows [55]:
where ρNIR, ρRED, ρSWIR, and ρBLUE are the reflectance of near-infrared, red, shortwave infrared light, and blue, respectively, in Landsat images.
2.3.3. Single Land-Use Dynamic Index
The Single Land-use Dynamic Index quantitatively describes the speed of regional land-use change, playing a pivotal role in comparing regional differences in land-use transitions and analyzing trends in land-use change [5]. The formula is as follows:
where K refers to the Single Land-use Dynamic Index, Ua and Ub denote the area of a specific land type at the beginning and the end of the study period, respectively, and T represents the duration of the research period.
2.3.4. Geo-Informatic Tupu
The Geo-informatic Tupu is a spatiotemporal analysis method that records land-use change using Tupu units. It possesses dual properties of graph and pedigree. The graph and the pedigree are utilized to represent spatial location characteristics and process variation, respectively. The calculation formula for the Tupu unit is as follows [8,56]:
where C represents the newly generated code value, indicating the type of land-use Tupu unit. A and B refer to the code values of the land-use type at the previous and later stages, respectively. For instance, code 12 signifies the transition of cultivated land to forest land (the meaning of the code is detailed in Section 2.2).
The transition Tupu of land use in Putian City from 2000 to 2010 and from 2010 to 2020 can be generated by comprehensively employing Tupu code fusion and map algebra superposition operations to synthesize Tupu units integrating characteristics of “space-attribute-process”. Land-use transitions (LUTs) encompasses two aspects: transfer in and transfer out. The area transferred from other land types into a particular land type is classified as the new area of that land type, denoted as the rising Tupu. Conversely, all areas transferred out of the land type are classified as the reduced area of the land type, referred to as the falling Tupu. Therefore, the rising and falling Tupu of Putian City from 2000 to 2010 and from 2010 to 2020 can be obtained through spatial analysis and reclassification.
The transfer ratio of a land-use type is calculated to determine the proportion of a specific land type transfer compared to all land types transferred, providing further insights into the change characteristics of the number of LUTs Tupu units. The calculation formula for the transfer ratio is as follows: [56]:
where P represents the transfer ratio of land-use type; Sij refers to the area of Tupu unit of the i-th land use type at the initial stage to the j-th land-use type at the final stage; n means the number of land-use types.
2.3.5. Accuracy Evaluation Model for Land Classification Results
The accuracy evaluation model for land classification results is crucial for assessing the reliability of interpretation outcomes following the application of classification algorithms to analyze remote sensing images. In this study, two key metrics, namely overall accuracy (OA) and the Kappa coefficient, are employed to evaluate the accuracy of land classification results. The calculation formulas for these metrics are as follows [57]:
where N and xii represent the total number of pixels and the total number of correctly classified pixels, respectively; c is the number of categories; xi+ and x+i refer to the sum of rows and columns in the confusion matrix, respectively.
2.3.6. Canonical Correspondence Analysis (CCA)
Canonical Correspondence Analysis (CCA) is a multivariate constrained ordination technique developed to extract comprehensive environmental gradients from eco-environmental datasets. It aims to elucidate the relationship between biological assemblages of species and their environment [58,59,60]. Hence, this study applied CCA to quantitatively analyze the key drivers of land-use change.
- (1)
- Index selection. The study opted for seven types of land use in Putian City and its five districts and counties as species variables. As previously mentioned, land-use transitions (LUTs) refer to changes in the land structure and land characteristics of an area as a result of various direct and indirect human activities through the use of land, and more and more studies have proved that socio-economic driving forces are the main motivation for land use change. Many cities in China are in the process of accelerated urbanization and industrialization, and Putian City is no exception. Studying LUTs from a socio-economic perspective is conducive to achieving rapid economic growth while safeguarding the sustainable use of land resources. Therefore, this study mainly considered socio-economic drivers to explore the mechanism of macro-policy on LUTs in the study area. Based on the regional socio-economic development trend and data availability, 17 socio-economic indicators demonstrating extremely significant correlations with land use change were selected as environmental variables. These indicators include fishery output value (l), gross value of primary industry (g), GDP (f), total industrial output value (m), urbanization rate (c), gross value of tertiary industry (i), gross value of secondary industry (h), economic crops area (q), non-agricultural population (a), total retail sales of social consumer goods (e), total population (b), agricultural population (d), pesticide use (o), grain crop area (p), total agricultural output value (j), agricultural fertilizer use (n), and forestry output value (k). These indicators essentially encompass the primary socio-economic metrics of the region.
- (2)
- Computing platform. CANOCO 4.5 and CANOD RAW 4.5 were used for Canonical Correspondence Analysis (CCA). CANOCO 4.5 is a widely used software for multivariate statistical analysis, particularly for ordination techniques such as CCA. It is a powerful tool that allows researchers to analyze the relationships between species and environmental variables, making it an ideal choice for our study’s objectives. The software’s capabilities include the calculation of eigenvalues, species scores, and environmental gradients, which are essential for understanding the complex interactions between land-use types and driving factors. And CANOD RAW 4.5, on the other hand, is a companion software to CANOCO that focuses on redundancy analysis and other related statistical methods. It is particularly useful for further exploring the relationships between variables and identifying potential outliers or influential cases in the dataset.As previously mentioned, the working flow chart of this study was shown in Figure 2.
3. Results and Analysis
3.1. Land-Use Structure Change
The land-use classification status map of Putian City for 2000, 2010, and 2020 was acquired utilizing the GEE platform (Figure 3). According to Formulas (7) and (8), the overall accuracy for remote sensing interpretation in the three phases were determined to be 93.35%, 92.17%, and 93.13%, respectively. Correspondingly, their kappa coefficients were calculated at 88.13%, 86.64%, and 87.51%, respectively. It could be seen that the interpretation results of the three-phase of land-use classification demonstrate high accuracy and met the requirements of the research requirement.
As could be seen from Figure 3 and Table 2, forest land constituted the largest land type in Putian City, surpassing 50% of the total area across all three-time nodes. Cultivated land followed as the second-largest type, covering an area exceeding 1000 km2. The average proportion of cultivated land to the total area across the three-time nodes reached 28.80%, indicating that the land-use structure of Putian City over the past two decades primarily centered on agricultural and forestry production. Nevertheless, the areas of cultivated land, forest land, and grassland experienced declines during this period, while orchard land, water bodies, built-up land, and unused land witnessed increases. Notably, cultivated land experienced the most substantial decline among all land types, exhibiting a continuous downward trajectory from 1261.15 km2 in 2000 to 1003.29 km2 in 2020, representing a decrease of 20.45%. Among all land types, forest land exhibited the smallest area reduction over the past 20 years, with a decrease of 24.79 km2. The grassland area experienced a notable decline from 2000 to 2010, with a reduction area of 45.44 km2 and an average annual reduction rate of 0.09%, while it witnessed a slight increase of 2.67 km2 from 2010 to 2020. We believe that some of the increased area may be attributed to natural succession, leading to overgrown weeds due to the abandonment of certain dry lands (cultivated land). Regarding orchard land, its area was 12.76 km2 in 2000, reflecting a 50.86% increase over the past two decades, reaching 19.25 km2. This growth is primarily attributable to Putian City’s location in the middle subtropical zone, which is conducive to the development of regional characteristic fruit trees such as longan, litchi, loquat, grapefruit, and olive, vigorously promoted by the government. Built-up land expanded from 109.15 km2 in 2000, accounting for 2.78% of the total area, to 335.65 km2 in 2020, representing a more than two-fold increase and marking the largest increase. Following built-up land, the area of unused land experienced the second largest increase, growing by 148.92% over the past 20 years. Moreover, the water body area displayed a consistent upward trend, attributed to Putian City’s endeavors to promote river ecological governance and the ecological restoration and governance project of the Mulan River, which have yielded significant results.
The change of Land-use Dynamic Index can also serve as a measure of the alteration in land-use structure over a specific period from another perspective. As indicated in Table 2, the average values of the Single Land-Use Dynamic Index for the stages 2000–2010 and 2010–2020 were 21.96% and 8.17%, respectively. This suggests that the land-use transitions in Putian City have been continuous over the past 20 years. The rate of land-use changes from 2000 to 2020 reached 19.09%, indicating significant interference by human activities in the land-use transitions of Putian City. From 2000 to 2020, the dynamic degrees of cultivated land, forest land, and grassland were −1.02%, −0.06%, and −0.69%, respectively, indicating a downward trend in the area of these land types. Conversely, the dynamic degree of the water body was 0.49%, suggesting a slow increasing trend. The dynamic degree of orchard land was 2.55%, indicating a relatively fast increase rate. The dynamic degree of built-up land was the highest, reaching 10.37%, while the dynamic degree of unused land ranked second at 7.44%, indicating accelerating rates of increase for built-up land and unused land.
From the distribution results of land use (Figure 3), distinct patterns of land-use change were observed across the city’s spatial distribution. Moving from the city center towards the periphery, the predominant land types transitioned from built-up land to cultivated land, forest land, and others. Cultivated land was primarily concentrated in Xiuyu District in the southeast of Putian City and Xianyou County in the southwest. Forest land, on the other hand, was mainly distributed in Hanjiang District in the northeast and Xianyou County in the northwest. Grassland predominantly occupied the plain areas in the southeast of Putian City, with Xiuyu District containing the largest proportion, potentially linked to the conversion of deserted dry land to grassland. Orchard land was mainly distributed in the dry land and plateau regions of Hanjiang District and Xianyou County. Water bodies were predominantly found in coastal areas such as Hanjiang District and Xiuyu District, with the exception of reservoirs in the districts and counties. Fish farming activities in these coastal areas were more developed compared to inland regions.
3.2. Tupu Analysis of Land-Use Transitions (LUTs)
3.2.1. LUTs Tupu from 2000 to 2010
The spatial distribution of LUTs Tupu units in Putian City from 2000 to 2010 showed significant differences. The most notable changes observed in Tupu units were “cultivated land → built-up land” (code 16), “grassland → built-up land” (code 46), and “cultivated land → unused land” (code 17), accounting for 28.56%, 23.79%, and 18.18% of the total converted land use types, respectively (Table 3). These three types of Tupu units exhibited a large-scale, high-density distribution across the study area (Figure 4a). Additionally, “cultivated land → forest land” (code 12) and “forest land → cultivated land” (code 21) accounted for 6.70% and 6.03% of all converted land-use types, respectively. Noteworthy Tupu units also included “cultivated land → water body” (code 15) and “cultivated land → grassland” (code 14), comprising 4.11% and 3.34% of the total converted land-use types, respectively. These land-use types were widely distributed in the southern and coastal areas of the study region. Factors contributing to these changes include policy initiatives such as reclamation, afforestation, fruit production, and grain production, as well as the shift of labor to non-agricultural industries, resulting in the abandonment of cultivated land. Abandoned cultivated land may undergo a transition to mixed growth of grass and forest, eventually evolving into grassland or unused land. Alternatively, long-term water accumulation in low-lying abandoned areas can lead to the formation of water bodies.
According to the analysis results concerning the transition area of each land type (Table 3), cultivated land exhibited the largest transfer-out area among all land types, amounting to 150.94 km2. Within this area, 46.62% was converted into built-up land (70.37 km2), 29.68% into unused land (44.80 km2), 10.94% into forest land (16.52 km2), 6.71% into water body (10.12 km2), 5.45% into grassland (8.23 km2), and 0.60% into orchard land (0.90 km2). Conversely, the transfer-in area of cultivated land was only 15.63 km2, with 95.10% originating from forest land (14.86 km2) and the remaining from grassland (0.77 km2). Examining the spatial distribution of cultivated land transferred out, it primarily converted into built-up land in urban areas, and into forest land and orchard land in certain mountainous areas such as Xianyou County and Hanjiang District. This trend was closely associated with policy incentives and the proactive development of suitable forest and fruit industries.
3.2.2. LUTs Tupu from 2010 to 2020
The total area of land-use transitions from 2010 to 2020 was 183.21 km2, which marked a decrease of 63.17 km2 compared to the previous period (2000–2010) (Table 4). Among all the transition Tupu units, cultivated land remained the most significant land type in transition, with a total of 146.38 km2 transferred out. Over half of this area was converted to built-up land, constituting 58.41% (85.50 km2), predominantly distributed in coastal areas, particularly in Xiuyu District (Figure 4b). The transfer-in area of cultivated land amounted to only 23.80 km2, primarily sourced from forest land and grassland. The increased and decreased proportions of cultivated land were notably unbalanced. The transferred-out area of forest land amounted to 22.26 km2, with 74.10% (16.50 km2) converted to cultivated land, 17.21% (3.83 km2) to grassland, 8.14% (1.81 km2) to orchard land, and 0.55% (0.12 km2) to water bodies. Forest land had a transferred area of 14.10 km2, primarily from cultivated land and orchard land. The transferred-out area of grassland (9.01 km2) was smaller than the transferred-in area (7.73 km2), with a difference of 1.28 km2. Grassland transferred out mainly converted to cultivated land (5.35 km2), while the transferred-in area primarily originated from cultivated land (7.49 km2). The conversion of cultivated land to grassland was mainly due to abandoned cultivated land, which eventually evolved into grassland, with most of the grassland ultimately transitioning into built-up land. Land use and its transition were primarily linked to the cycle wherein the transfer of labor force led to the abandonment of cultivated land, which in turn transformed into grassland, unused land, and eventually became built-up land.
3.3. Land-Use Rising/Falling Tupu Analysis
3.3.1. Land-Use Rising Tupu
The difference in land-use structure transition in Putian City was examined by generating the rising Tupu for the periods 2000–2010 and 2010–2020 (Figure 5), along with conducting statistical analysis on the transferred data (Table 5).
Table 5 and Figure 5 illustrate that from 2000 to 2010, the changed area and unchanged area of land use in Putian City were 246.45 km2 and 3676.32 km2, respectively, constituting 6.28% and 93.72% of the study area’s total area. Among the changed areas, newly increased built-up land accounted for the largest portion, reaching 136.45 km2, representing 55.37% of the total newly increased area. This was followed by newly increased unused land (48.93 km2), newly increased forest land (16.89 km2), newly increased cultivated land (15.63 km2), newly increased grassland (14.65 km2), newly increased water body (10.52 km2), and newly increased orchard land (3.38 km2). Regarding districts and counties, Xianyou County exhibited the highest proportion of unchanged areas (48.49%), indicating the most stable land use change. Conversely, Licheng District had the lowest proportion of unchanged areas (6.57%) and the highest newly added built-up land area at 30.04 km2, indicating its status as the most active district in land-use transitions. Concerning the area of newly added land types, Xianyou County had the largest area of newly added cultivated land at 6.52 km2, followed by Xiuyu District (3.56 km2), Hanjiang District (2.46 km2), Chengxiang District (2.00 km2), and Licheng District (1.10 km2). Regarding forest land, Xianyou County, Hanjiang District, and Chengxiang District were the three areas with the largest newly added forest land, accounting for 92.78% of all newly added forest land. As the main fruit production bases in Putian City, Hanjiang District and Xianyou County had a newly added orchard land of 3.28 km2, representing 97.04% of the total newly added orchard land. Notably, among the newly added built-up land, Xiuyu District had the largest newly added area, reaching 57.87 km2, followed by Licheng District, Chengxiang District, Xianyou County, and Hanjiang District. Consequently, the transfer of land use to built-up land was most active in Xiuyu District during this period, while Chengxiang District remained relatively stable.
From 2010 to 2020, the area of land-use changes in Putian City decreased compared to the previous period (2000–2010), totaling 168.88 km2. The newly increased area of built-up land was 90.04 km2, marking the highest increase. This rise was primarily driven by accelerated urbanization and industrialization, leading to the squeezing and occupation of cultivated land, forest land, and grassland, which were then transformed into built-up land. The area of newly increased cultivated land reached 23.82 km2, accounting for 14.10% of the total newly increased area. Meanwhile, the area of newly increased forest land and grassland decreased by 2.64 km2 and 2.90 km2, respectively, compared to the previous period (2000–2010). From a district and county perspective, Xianyou County had the largest newly increased cultivated land area at 12.61 km2, followed by Hanjiang District with a newly increased area of 5.08 km2. The area of newly increased built-up land in all districts and counties significantly decreased compared to the previous period (2000–2010), with Licheng District experiencing the largest reduction of 16.20 km2. Additionally, except for Licheng District and Xiuyu District, the area of newly increased forest land in other districts and counties decreased compared to the previous period, with Xianyou County showing the largest reduction. The newly added orchard land was primarily located in Xianyou County (2.15 km2), Xiuyu District (0.63 km2), Chengxiang District (0.60 km2), and Licheng District (0.01 km2).
In summary, the characteristics of land-use rise in Putian City exhibited high similarity between the periods of 2000–2010 and 2010–2020. However, it is noteworthy that while newly added built-up land remained the main new land type in all districts and counties during both periods, the rate of new construction land in the later period had slowed down.
3.3.2. Land-Use Falling Tupu
The temporal and spatial evolution of land-use transitions in Putian City was investigated by generating the falling Tupu of the city for the periods of 2000–2010 and 2010–2020 (Figure 6), along with conducting statistical analysis on the transferred data (Table 6).
According to Table 6 and Figure 6, it is evident that the decreased area of cultivated land in Putian City from 2000 to 2010 reached 150.94 km2, accounting for 61.24% of the total, followed by the decreased area of grassland and forest land, which accounted for 24.38% and 13.64%, respectively. The decreased areas of orchard land, water area, and unused land were relatively small, each accounting for less than 1%. In terms of occurrence area, the decreased of cultivated land was predominantly concentrated in Xianyou County and Xiuyu District, accounting for 55.55% of the total shrinkage. In the central area of Putian (Chengxiang District and Licheng District), the main types of decreased land were cultivated land and grassland (62.76 km2), significantly larger than the newly added area of these two land types (5.30 km2) during the same period. Consequently, the land-use change in the entire urban areas was characterized by the significant decreased of cultivated land area and the sharp expansion of built-up land during this period.
From 2010 to 2020, the decreased area and structure of land types in Putian City maintained a high similarity with the previous period. It is noteworthy that although the decreased area of cultivated land was not significantly different from the previous period, it remained the land type with the largest decreased area, indicating that the trend of cultivated land occupation during this stage had not been reversed. Compared with the previous period (2000–2010), the decreased area of grassland in Xiuyu District decreased significantly, from 32.66 km2 in the previous period to 2.31 km2, marking a decrease of 92.93%. This decrease was related to the district being newly established, with abandoned land converted into grassland in the previous period, eventually used for built-up land. The decreased area of other land types was relatively small, with insignificant changes. Among all districts and counties, Xiuyu District had the highest decreased area of cultivated land, reaching 71.56 km2, followed by Xianyou County with a decreased area of cultivated land at 27.65 km2. Other districts and counties also experienced decreases. Specifically, the decreased area of forest land and grassland in Xianyou County was 12.12 km2 and 4.46 km2, respectively, while the decreased area of forest land in Hanjiang District was 4.76 km2. In general, compared with the decreased area of land use types in the previous stage, this stage experienced a decrease, but the spatial distribution had expanded.
3.4. Key Driving Force of Land-Use Change
3.4.1. Socio-Economic Driving Force
Canonical correlation analysis (CCA) revealed that the total eigenvalue of the ranking axis was 0.9504, indicating the correlation between the development of social and economic indicators and the ranking axis. The first two ranking axes explained 82.22% and 12.82% of the total data, respectively. From Table 7 and Figure 7, it is evident that the changes in 17 social and economic statistical indicators of Putian City and its districts and counties over the past 20 years correlated significantly with the first and second ranking axes. The fishery output value (l), gross value of primary industry (g), GDP (f), total industrial output value (m), urbanization rate (c), gross value of tertiary industry (i), and gross value of secondary industry (h) were significantly positively correlated with the first ranking axis. Conversely, the non-agricultural population (a), total retail sales of social consumer goods (e), total population (b), total agricultural output value (j), and forestry output value (k) were significantly negatively correlated with the first ranking axis. The second axis showed negative correlations with economic crop area (q), agricultural population (d), pesticide use (o), grain crop area (p), and agricultural fertilizer application (n). Hence, the first ranking axis could be considered the growth axis of socio-economic production input and output, while the second one primarily represented the growth axis of indicators related to the agricultural economy, although its interpretation rate was low. It is noteworthy that more than 95% of the relationship between land use change and socio-economic development was reflected on the first ranking axis, which encapsulated the major information about the relationship between socio-economic indicators and land-use change. Consequently, the results of canonical correspondence analysis effectively explained the correlation between land use change and changes in socio-economic statistical indicators.
Further analysis from the ranking of the importance of socio-economic indicators of Putian City districts and counties (Table 8) revealed six indicators with extremely significant differences. A larger r2 value and smaller Pr indicated greater importance of the index. The order of importance was as follows: gross value of secondary industry (h), forestry output value (k), total industrial output value (m), GDP (f), total retail sales of social consumer goods (e), and gross value of tertiary industry (i). In the CCA ranking (Figure 7), built-up land (BL), water bodies (WB), and unused land (UL) were situated on the upper right side of the first principal axis, while cultivated land (CL) was on the lower right side, and orchard land (OL) and forest land (FL) were on the upper left side. Grassland (GL) was positioned on the lower left side. This positioning indicated that the growth of social and economic production input and output drove the increase in built-up land area, resulting in the extrusion of cultivated land, grassland, and forest land. This trend was closely related to the significant growth of the gross value of the secondary industry and the total industrial output value of Putian City, which increased by 13.09 and 13.16 times, respectively, over the 20 years from 2000 to 2020. Meanwhile, built-up land increased by 2.07 times, while cultivated land, grassland, and forest land decreased by 20.45%, 13.84%, and 1.97%, respectively.
According to the ranking of districts and counties, Xiuyu District and Licheng District were positioned on the right side of the first main axis, positively correlated with built-up land and unused land (in fact, most were also planned to be developed), and negatively correlated with cultivated land. This indicates that over the past 20 years, the secondary industry in these two districts experienced rapid development, leading to an increased use of non-agricultural land by 1.91 and 2.75 times, respectively. Consequently, there was a significant reduction in cultivated land, decreasing by 24.79% and 31.00%, respectively. Simultaneously, abandonment of agriculture for commercial purposes increased unused land by 2.67 and 1.10 times, respectively. The ranking figure depicted the relative position and relationship between changes in land-use types and major socioeconomic indicators, clearly illustrating the driving effect of socioeconomic indicators on land-use type changes and the corresponding change in ecosystem value.
3.4.2. Driving Force of Macro Policy
The results of CCA ranking indicate that the most direct driving force of land-use type change in Putian City was the continuous development of the regional economic aggregate. Particularly, the growth of the secondary industry, mainly real estate, had the most significant impact on land-use change. Following the merger of Putian City and counties in 2002 to form Chengxiang District, Licheng District, Hanjiang District, Xiuyu District, Meizhou Island Management Committee, and Meizhou Bay North Bank Management Committee, urban expansion was inevitably promoted. This merger objectively resulted in an increase in non-agricultural land and a reduction in cultivated land. This trend is also evident in the overall layout of the “two points, three lines, and three levels” in Putian City Master Plan (1993–2010). According to the plan, Putian aimed to achieve the common development of the north and south triangle areas, with the spatial layout of Chengxiang District and Hanjiang District gradually forming a pattern of “cluster structure and zoning balance” [61]. During the same period, the development of the Meizhou Bay Area in the south of Putian, including Xiuyu District, Licheng District, and two administrative committees, emerged as a significant direction for the city’s development. Therefore, urban expansion and the rapid development of the secondary industry, primarily real estate, were crucial macro factors driving the economic and social development of Putian City.
Moreover, according to investigations, the Fujian Provincial Party Committee and the Provincial Government issued a notice on the overall plan for the comprehensive reform experiment of urban-rural integration in Putian City in July 2012. This notice officially approved Putian City as a pilot project for the comprehensive reform of the province’s urban-rural integration. In 2014, Putian City was further approved as the first batch of new urbanization comprehensive reform pilots in China. Putian City adopted the urbanization of people as the core concept and gradually developed the Putian local urbanization mode known as “five integration and five transition”. This mode aimed to integrate planning, functions, policies, industries, and communities comprehensively, while simultaneously achieving form intensification, urbanization of life, welfare equalization, land enlargement, and nearby urbanization. As a result of these efforts, the urbanization rate increased steadily after 2015. The Putian on-site urbanization mode of “five integration and five modernization” gradually took shape. This entailed promoting planning integration, functional integration, policy integration, industry-community integration, and governance integration, while simultaneously realizing form intensification, urbanization of life, welfare equalization, land enlargement, and nearby urbanization. The urbanization rate of the resident population rose from 51.8% in 2012 to 61.7% in 2019, advancing from the sixth to the fourth place in the province. By 2020, the urbanization rate of the entire city further increased to 63.5%, subsequently promoting the national economy and the per capita economic disposable amount.
In recent years, the Putian municipal government has placed significant emphasis on participating in the planning and preparation of the Fuzhou metropolitan area development plan. It actively integrates into the high-quality development plan of the Fuzhou metropolitan area and participates in the construction of the metropolitan area across various aspects, including industry, transportation, digital infrastructure, and green development. In 2021, a total of 37 key projects were identified and planned for implementation. This initiative expanded to 44 key projects in 2022, with an investment of 210.6 billion CNY. Putian City is committed to providing robust support for achieving co-construction, co-governance, and resource sharing. It aims to establish a regional development pattern characterized by “city circle linkage”, with the provincial capital central city leading the Fuzhou metropolitan area. The goal is to construct a modern metropolitan area with significant influence and to comprehensively promote high-quality development. As a result, it is foreseeable that the city’s non-agricultural land will continue to expand. Consequently, it becomes crucial to plan effectively to promote the sustainable development of the regional ecological economy. Furthermore, there exists a significant disparity in the social environment between urban and rural areas, leading to an imbalance in the flow of resource elements. Rural infrastructure and social security systems are less developed compared to urban areas, and the lingering effects of the old registered residence system persist, hindering the complete elimination of dual barriers between urban and rural regions. Consequently, the rural resident population exhibits a low willingness to settle in cities, rendering the task of urbanizing agricultural transfer population challenging. Thus, the urbanization process in Putian City essentially translates into “landing urbanization”. Addressing the urbanization of household registration simultaneously presents a considerable challenge and remains a long-term endeavor.
4. Discussion and Conclusions
Based on the land-use data acquired from Landsat remote sensing images in 2000, 2010, and 2020, this study systematically analyzed the land-use transitions (LUTs) characteristics in Putian City of China. It employed methods such as Single Land-use Dynamics and Geo-informatic Tupu to uncover the driving forces behind LUTs in Putian City and its five districts and counties through the Canonical Correspondence Analysis (CCA) method. The results are intended to provide several practical applications for optimizing regional land-use patterns, and improving the regional ecological environment. The main research conclusions are outlined below:
- (1)
- The land-use pattern of Putian City predominantly comprised cultivated land and forest land, with other land types embedded within them. Notably, built-up land exhibited an outward expansion trend. The study revealed that from 2000 to 2020, the areas of cultivated land and forest land decreased annually, while orchard land, water bodies, built-up land, and unused land showed yearly increases. Cultivated land experienced the most significant decline among all land types, exhibiting a continuous downward trend. Specifically, it decreased from 1261.15 km2 in 2000 to 1003.29 km2 in 2020, marking a decrease of 20.45%. Grassland reduction followed as the second largest, with a reduction of 42.77 km2 over 20 years, whereas forest land experienced the smallest reduction in area among all land types. Meanwhile, the area of built-up land exhibited consistent growth over the years. In 2000, built-up land in Putian City covered only 109.15 km2, accounting for 2.78% of the total area. However, after two decades of development, this area doubled to 335.65 km2. This trend indicates that Putian City is currently experiencing rapid urbanization and industrialization, leading to an increasing demand for land resources. Consequently, significant ecological lands, including cultivated land, have been requisitioned, raising concerns about the ecological environment quality of Putian City. But, compared with the previous decade (2000–2010), the decline in environmental quality from 2010 to 2020 has relatively slowed down, reflecting the determination and effectiveness of the Putian municipal government to improve environmental quality [62], and the results further elucidated that the reasonableness of land use inevitably affects the quality of the regional ecosystem environment, which in turn affects the function of ecosystem services and the realization of their value, and ultimately impedes the coordinated sustainable development of the municipal socio-ecological economy. Additionally, the spatial distribution of land types exhibited distinct patterns. Cultivated land was primarily concentrated in Xiuyu District in the southeast of Putian City and Xianyou County in the southwest. Forest land was mainly distributed in Hanjiang District in the northeast and Xianyou County in the northwest. Grassland predominated in the plain area in the southeast of the city, with Xiuyu District having the largest proportion of grassland area. Orchard land was primarily distributed in Hanjiang District and Xianyou County, while water bodies were mainly found in the coastal areas of Hanjiang, Xiuyu, and Licheng Districts, as well as in the reservoirs located in the districts and counties. The rapid urbanization observed in Putian City necessitates careful planning of infrastructure projects to minimize the impact on agricultural land and natural ecosystems. By understanding the patterns and drivers of land-use change, the local government can develop more targeted and effective land-use plans. Our findings highlight the need for strategic planning that balances urban expansion with the conservation of agricultural land and natural habitats. This could include the establishment of urban growth boundaries, the promotion of smart growth principles, and the implementation of land use policies that promote sustainable development. Moreover, from the results of this study, the authors believe that geomatics information mapping has obvious advantages in analyzing land-use transitions (LUTs), which can fully demonstrate the spatial distribution of each class, show multidimensional spatial information, and is a new method to explore LUTs. Other research results have the same conclusions as ours [8,33,63,64].
- (2)
- The spatial distribution of Tupu units representing land-use transitions in Putian City exhibited significant disparities, with the area of cultivated land and grassland undergoing the most notable changes. Over the period from 2000 to 2020, other land types in Putian City consistently transitioned into built-up land. A total of 226.45 km2 was converted into built-up land over 20 years, primarily in economically developed areas surrounding the cities and counties, notably Xiuyu District. The primary types of transferred Tupu units observed during 2000–2010 and 2010–2020 were “cultivated land → built-up land” and “cultivated land → grassland → built-up land”. In the past two decades, a total of 297.32 km2 of cultivated land had been transferred out, while only 39.43 km2 had been transferred in, highlighting a significant imbalance in the increase and decrease of cultivated land. Notably, the rate of built-up land expansion in Xiuyu District surpassed that of all other districts and counties, experiencing a 275% increase and expanding by 109.75 km2 over 20 years. Given the limited availability of land resources, the continuous expansion of built-up land inevitably encroaches upon other land types, particularly production and ecological lands. Additionally, various areas of Putian City have been abandoned to varying degrees due to factors such as poor agricultural conditions (e.g., saline-alkaline land), low grain efficiency, and rural labor migration, ultimately evolving into deserted fields (grassland) and resulting in the wastage of limited land resources. Putian City serves as a primary grain sales area in Fujian Province, heavily relying on external sources for its grain supply. The region’s basic farmland is predominantly situated in Xiuyu District and Xianyou County, posing significant challenges in ensuring food security and mitigating the “non-agricultural” and “non-grain” conversion of cultivated land. The significant decrease in cultivated land poses challenges for food security and the sustainability of agricultural practices. To address these challenges, our research suggests the need for policies that promote the efficient use of agricultural land, such as crop rotation, intercropping, and the adoption of agroecological practices. This can help maintain the productivity of the land while reducing the pressure to convert agricultural land for urban uses. And optimizing the layout of urban, rural, industrial, and mining lands, as well as renovating abandoned lands, is crucial. Furthermore, enhancing the utilization rate of land resources is essential. For instance, the research team identified that fields in Xiuyu District of Putian City were primarily composed of saline and alkaline land with poor fertility, limiting the growth of crops to primarily sweet potatoes and soybeans. Monoculture practices have led to continuous cropping obstacles, resulting in decreased yields and quality [65,66]. Taking Dongzhuang Town, Xiuyu District, Putian City, as a pilot, our research team proposed a strategy for effectively utilizing the spatiotemporal resources of cultivated land, integrating agriculture, culture, and tourism. This strategy involves cultivating renowned, specialty, and high-yield crops with low investment, short growth cycles, and high efficiency. We implemented rotational and intercropping practices to enhance the multiple cropping index and diversified agricultural functions. Moreover, we organized events such as farmers’ harvest festivals, research activities, and experiential learning projects. Considering local soil, climate, and ecological conditions, we explored two planting modes: (1) Fruit Corn/Fruit Corn/Winter Potato (Strawberry or Radish); (2) Chestnut Pumpkin/Chestnut Pumpkin/Cherry Tomatoes. Through sustained efforts, we assisted local residents in establishing large-scale modern agricultural demonstration fields, creating an ecological leisure agricultural brand. We transformed saline-alkaline lands unsuitable for crop growth into fertile “golden lands”, significantly boosting farmers’ incomes, solidifying and expanding poverty alleviation efforts. This initiative garnered recognition from local governments, new business entities, and farmers, further facilitating its widespread adoption and application.
- (3)
- The driving forces behind the spatial and temporal evolution of land use in Putian City, particularly urban expansion and the development of the secondary industry due to city-county mergers, were key factors shaping its differential distribution patterns. Data analysis spanning from 2000 to 2020 revealed that the area of newly increased built-up land in Putian City reached 226.49 km2, constituting 52.68% of the total newly increased area. Conversely, the largest decrease was observed in cultivated land, totaling 297.32 km2 and accounting for 69.15% of the total decreased area. CCA results underscored that LUTs in Putian City were driven by socioeconomic development, notably the growth of the secondary industry, urbanization, and urban expansion. These factors directly and indirectly contributed to the conversion of cultivated land into built-up land areas, precipitating a range of environmental and ecological economic challenges. Concurrently, population migration, particularly the influx of non-agricultural populations and suboptimal agricultural practices, accelerated the decline in cultivated land area. Furthermore, agricultural abandonment for commercial purposes exacerbated farmland abandonment. Notably, newly added forest land and orchard land primarily occurred in Hanjiang District and Xianyou County. This can be attributed to Putian City’s vigorous implementation of afforestation projects, policies promoting the conversion of cultivated land to forest and orchard land.
Part of the abandoned farmland and sloped cropland has undergone a transition into economic forests and ecological forests, leading to the emergence of a new forest and fruit industry pattern. This pattern integrates bionic cultivation of Chinese medicinal materials under the forest canopy, cultivation of loquat, Wendan pomelo, and other crops. Given the policy constraints on strictly controlling the occupation of ecological protection red lines and permanent basic farmland, efficiently utilizing land resources and developing the forest economy, including forest medicine and forest tourism, in mountainous areas becomes an inevitable choice. This approach can create greater space for regional sustainable development and ecological balance, particularly in areas not easily accessible to the industrial chain. For instance, Dayang Township in Hanjiang District, Putian City, situated in a mountainous area, serves as a primary production zone for high-quality rice and is renowned for its medicinal materials. With an impressive forest coverage rate of 85% and abundant under-forest resources, the township presents an opportunity for efficient land resource utilization and enhancing the output and quality of Chinese herbal medicines. This endeavor holds significant implications for increasing local farmers’ income and advancing rural revitalization efforts. The research team has leveraged the diversity of the ecosystem to establish a comprehensive ecological network. They have developed a model that combines traditional Chinese medicine cultivation techniques with the mountain and forest environment in Dayang Township, tailored to local conditions. This approach has transformed the traditional consumption of forestry resources into an ecological economic model, yielding remarkable results within a short timeframe. Thus, the identification of socio-economic indicators as key drivers of land-use change provides valuable insights for policymakers. By understanding the relationship between economic development and land use, policymakers can implement strategies that promote economic growth while mitigating the negative impacts on land resources.
In conclusion, urbanization and industrialization has undoubtedly been a driving force behind the economic and social advancement for China. However, as the land dividend continues to diminish, scholars are increasingly confronted with the imperative of land-use transitions and resource management. Therefore, there is a pressing need to intensify research efforts into the scientific transition of land use and its associated pathways. Of particular importance is the need for in-depth exploration and practical implementation of strategies pertaining to cultivated land use and agricultural transition. Moving forward, we are committed to furthering our investigations in these areas through ongoing research endeavors.
Author Contributions
Conceptualization, Q.P. and D.W.; methodology, Q.P. and K.S.; software, Q.P. and K.S.; validation, Q.P., W.L. and S.F.; formal analysis, Q.P., D.W. and K.S.; investigation, Q.P., D.W. and K.S.; data curation, Q.P. and S.F.; writing—original draft preparation, Q.P.; writing—review and editing, K.S., S.F. and W.L.; visualization, Q.P., D.W. and K.S.; supervision, W.L. and S.F.; project administration, S.F.; funding acquisition, S.F., W.L. and K.S., Q.P. and D.W. contributed equally. All authors have read and agreed to the published version of the manuscript.
Funding
This research was funded by the Humanity and Social Science Foundation of Ministry of Education of China (Grant No. 23YJCZH192), Natural Science Foundation of Fujian Province (Grant No. 2021J01650), Major Project Funding for Social Science Research Base in Fujian Province Social Science Planning: Ecological Civilization Research Center (Grant No. FJ2022JDZ035), Fujian Agriculture and Forestry University Tea Industry Chain Science and Technology Innovation Team Project: Tea Industry Economy and Creativity Research (Grant No. K1520012A08), Science and Education Special Project of Fujian Province: Science and Technology Integration and Mechanism of “Small Industrial Courtyard” for Special Modern Agriculture (Grant No. K8120K01a), and National Scientific Research Project Cultivation Plan of Anxi College of Tea Science of Fujian Agricultural and Forestry University (Grant No. ACKY2023011).
Institutional Review Board Statement
Not applicable.
Informed Consent Statement
Not applicable.
Data Availability Statement
The data that support the findings of this study are available from the authors upon reasonable request.
Acknowledgments
The authors also thank “Fujian Provincial Key Laboratory of Agroecological Processing and Safety Monitoring” and “Fujian-Taiwan Joint Innovative Centre for Germplasm Resources and Cultivation of Crop (Grant No. 2015-75)” for their support.
Conflicts of Interest
The authors declare no conflicts of interest.
References
- Gao, J.; O’Neill, B.C. Mapping Global Urban Land for the 21st Century with Data-Driven Simulations and Shared Socioeconomic Pathways. Nat. Commun. 2020, 11, 2302. [Google Scholar] [CrossRef] [PubMed]
- Simkin, R.D.; Seto, K.C.; McDonald, R.I.; Jetz, W. Biodiversity Impacts and Conservation Implications of Urban Land Expansion Projected to 2050. Proc. Natl. Acad. Sci. USA 2022, 119, e2117297119. [Google Scholar] [CrossRef] [PubMed]
- Allan, A.; Soltani, A.; Abdi, M.H.; Zarei, M. Driving Forces behind Land Use and Land Cover Change: A Systematic and Bibliometric Review. Land 2022, 11, 1222. [Google Scholar] [CrossRef]
- Zuo, Q.; Zhou, Y.; Wang, L.; Li, Q.; Liu, J. Impacts of Future Land Use Changes on Land Use Conflicts Based on Multiple Scenarios in the Central Mountain Region, China. Ecol. Indic. 2022, 137, 108743. [Google Scholar] [CrossRef]
- Su, K.; Wei, D.; Lin, W. Evaluation of Ecosystem Services Value and Its Implications for Policy Making in China—A Case Study of Fujian Province. Ecol. Indic. 2020, 108, 105752. [Google Scholar] [CrossRef]
- Krawchenko, T.; Tomaney, J. The Governance of Land Use: A Conceptual Framework. Land 2023, 12, 608. [Google Scholar] [CrossRef]
- Liu, Y.; Zhou, T.; Yu, W. Analysis of Changes in Ecological Environment Quality and Influencing Factors in Chongqing Based on a Remote-Sensing Ecological Index Mode. Land 2024, 13, 227. [Google Scholar] [CrossRef]
- Chen, W.; Zhao, H.; Li, J.; Zhu, L.; Wang, Z.; Zeng, J. Land Use Transitions and the Associated Impacts on Ecosystem Services in the Middle Reaches of the Yangtze River Economic Belt in China Based on the Geo-Informatic Tupu Method. Sci. Total Environ. 2020, 701, 134690. [Google Scholar] [CrossRef]
- Hong, X.; Peng, Q.; Zheng, R.; Lin, W.; Fan, S.; Su, K. Evaluating the Spatial Evolution of the Eco-Economy Harmony in Anxi County, China, Based on Ecosystem Services Value. Sustainability 2024, 16, 1491. [Google Scholar] [CrossRef]
- Chen, W.; Chi, G.; Li, J. The Spatial Association of Ecosystem Services with Land Use and Land Cover Change at the County Level in China, 1995–2015. Sci. Total Environ. 2019, 669, 459–470. [Google Scholar] [CrossRef]
- Assessment, Millennium Ecosystem. Ecosystems and Human Well-Being: A Framework for Assessment; Alcamo, J., World Resources Institute, Eds.; Island Press: Washington, DC, USA, 2003; ISBN 978-1-55963-403-8. [Google Scholar]
- Costanza, R.; Limburg, K.; Naeem, S.; O’Neill, R.V.; Paruelo, J.; Raskin, R.G.; Sutton, P. The Value of the World’s Ecosystem Services and Natural Capital. Nature 1997, 387, 253–260. [Google Scholar] [CrossRef]
- Foley, J.; Defries, R.; Asner, G.; Barford, C.; Bonan, G.; Carpenter, S.; Chapin, F.S., III; Coe, M.; Daily, G.; Gibbs, H.; et al. Global Consequences of Land Use. Science 2005, 309, 570–574. [Google Scholar] [CrossRef]
- Houghton, R.A. Terrestrial Fluxes of Carbon in GCP Carbon Budgets. Glob. Chang. Biol. 2020, 26, 3006–3014. [Google Scholar] [CrossRef] [PubMed]
- Caldera, U.; Breyer, C. Afforesting Arid Land with Renewable Electricity and Desalination to Mitigate Climate Change. Nat. Sustain. 2023, 6, 526–538. [Google Scholar] [CrossRef]
- Barati, A.A.; Zhoolideh, M.; Azadi, H.; Lee, J.-H.; Scheffran, J. Interactions of Land-Use Cover and Climate Change at Global Level: How to Mitigate the Environmental Risks and Warming Effects. Ecol. Indic. 2023, 146, 109829. [Google Scholar] [CrossRef]
- Ke, X.; Zhang, Y.; Zhou, T. Spatio-Temporal Characteristics and Typical Patterns of Eco-Efficiency of Cultivated Land Use in the Yangtze River Economic Belt, China. J. Geogr. Sci. 2023, 33, 357–372. [Google Scholar] [CrossRef]
- Tepe, E.; Safikhani, A. Spatio-Temporal Modeling of Parcel-Level Land-Use Changes Using Machine Learning Methods. Sustain. Cities Soc. 2023, 90, 104390. [Google Scholar] [CrossRef]
- Yangouliba, G.I.; Zoungrana, B.J.-B.; Hackman, K.O.; Koch, H.; Liersch, S.; Sintondji, L.O.; Dipama, J.-M.; Kwawuvi, D.; Ouedraogo, V.; Yabré, S.; et al. Modelling Past and Future Land Use and Land Cover Dynamics in the Nakambe River Basin, West Africa. Model. Earth Syst. Environ. 2023, 9, 1651–1667. [Google Scholar] [CrossRef]
- Wang, L.; Nie, Z.; Yuan, Q.; Liu, M.; Cao, L.; Zhu, P.; Lu, H.; Feng, B. Spatiotemporal Oasis Land Use/Cover Changes and Impacts on Groundwater Resources in the Central Plain of the Shiyang River Basin. Water 2023, 15, 457. [Google Scholar] [CrossRef]
- Liu, Y.; Yuan, X.; Li, J.; Qian, K.; Yan, W.; Yang, X.; Ma, X. Trade-Offs and Synergistic Relationships of Ecosystem Services under Land Use Change in Xinjiang from 1990 to 2020: A Bayesian Network Analysis. Sci. Total Environ. 2023, 858, 160015. [Google Scholar] [CrossRef]
- Ray, R.; Das, A.; Hasan, M.S.U.; Aldrees, A.; Islam, S.; Khan, M.A.; Lama, G.F.C. Quantitative Analysis of Land Use and Land Cover Dynamics Using Geoinformatics Techniques: A Case Study on Kolkata Metropolitan Development Authority (KMDA) in West Bengal, India. Remote Sens. 2023, 15, 959. [Google Scholar] [CrossRef]
- Fan, Z.; Luo, Q.; Yu, H.; Liu, J.; Xia, W. Spatial–Temporal Evolution of the Coupling Coordination Degree between Water and Land Resources Matching and Cultivated Land Use Eco-Efficiency: A Case Study of the Major Grain-Producing Areas in the Middle and Lower Reaches of the Yangtze River. Land 2023, 12, 982. [Google Scholar] [CrossRef]
- Liu, X.; Zhang, Z.; Li, M.; Fu, Y.; Hui, Y. Spatial Conflict Simulation of Land-Use Based on Human-Land-Landscape Elements Intercoordination: A Case Study in Tianjin, China. Environ. Monit. Assess. 2022, 194, 317. [Google Scholar] [CrossRef] [PubMed]
- Cao, W.; Zhou, W.; Wu, T.; Wang, X.; Xu, J. Spatial-Temporal Characteristics of Cultivated Land Use Eco-Efficiency under Carbon Constraints and Its Relationship with Landscape Pattern Dynamics. Ecol. Indic. 2022, 141, 109140. [Google Scholar] [CrossRef]
- Punzo, G.; Castellano, R.; Bruno, E. Using Geographically Weighted Regressions to Explore Spatial Heterogeneity of Land Use Influencing Factors in Campania (Southern Italy). Land Use Policy 2022, 112, 105853. [Google Scholar] [CrossRef]
- Chen, Z.; Li, X.; Xia, X. Temporal-Spatial Pattern and Driving Factors of Cultivated Land Use Transition at Country Level in Shaanxi Province, China. Env. Monit. Assess. 2022, 194, 365. [Google Scholar] [CrossRef] [PubMed]
- Huang, M.; Li, Y.; Ran, C.; Li, M. Dynamic Changes and Transitions of Agricultural Landscape Patterns in Mountainous Areas: A Case Study from the Hinterland of the Three Gorges Reservoir Area. J. Geogr. Sci. 2022, 32, 1039–1058. [Google Scholar] [CrossRef]
- Nasiakou, S.; Vrahnakis, M.; Chouvardas, D.; Mamanis, G.; Kleftoyanni, V. Land Use Changes for Investments in Silvoarable Agriculture Projected by the CLUE-S Spatio-Temporal Model. Land 2022, 11, 598. [Google Scholar] [CrossRef]
- Chasia, S.; Olang, L.O.; Sitoki, L. Modelling of Land-Use/Cover Change Trajectories in a Transboundary Catchment of the Sio-Malaba-Malakisi Region in East Africa Using the CLUE-s Model. Ecol. Model. 2023, 476, 110256. [Google Scholar] [CrossRef]
- Zhong, Y.; Zhang, X.; Yang, Y.; Xue, M. Optimization and Simulation of Mountain City Land Use Based on MOP-PLUS Model: A Case Study of Caijia Cluster, Chongqing. ISPRS Int. J. Geo-Inf. 2023, 12, 451. [Google Scholar] [CrossRef]
- Kong, X.; Han, M.; Li, Y.; Kong, F.; Sun, J.; Zhu, W.; Wei, F. Spatial Differentiation and Formation Mechanism of Ecological Sensitivity in Large River Basins: A Case Study of the Yellow River Basin, China. Ecol. Indic. 2024, 158, 111571. [Google Scholar] [CrossRef]
- Long, H.; Yuan, L.; Yin, Z.; Wu, X. Spatiotemporal of Ecosystem Service Values Response to Land Use/Cover Change Based on Geo-Informatic Tupu—A Case Study in Tianjin, China. Ecol. Indic. 2023, 154, 110511. [Google Scholar] [CrossRef]
- Wang, Y.; Zhang, Z.; Chen, X. Land Use Transitions and the Associated Impacts on Carbon Storage in the Poyang Lake Basin, China. Remote Sens. 2023, 15, 2703. [Google Scholar] [CrossRef]
- Xing, J.; Zhang, J.; Wang, J.; Li, M.; Nie, S.; Qian, M. Ecological Restoration in the Loess Plateau, China Necessitates Targeted Management Strategy: Evidence from the Beiluo River Basin. Forests 2023, 14, 1753. [Google Scholar] [CrossRef]
- Lu, X.; Shi, Y.; Chen, C.; Yu, M. Monitoring Cropland Transition and Its Impact on Ecosystem Services Value in Developed Regions of China: A Case Study of Jiangsu Province. Land Use Policy 2017, 69, 25–40. [Google Scholar] [CrossRef]
- Liang, X.; Jin, X.; Ren, J.; Gu, Z.; Zhou, Y. A Research Framework of Land Use Transition in Suzhou City Coupled with Land Use Structure and Landscape Multifunctionality. Sci. Total Environ. 2020, 737, 139932. [Google Scholar] [CrossRef] [PubMed]
- Song, Y.; Wang, M.; Sun, X.; Fan, Z. Quantitative Assessment of the Habitat Quality Dynamics in Yellow River Basin, China. Environ. Monit. Assess. 2021, 193, 614. [Google Scholar] [CrossRef] [PubMed]
- Zhu, L.; Song, R.; Sun, S.; Li, Y.; Hu, K. Land Use/Land Cover Change and Its Impact on Ecosystem Carbon Storage in Coastal Areas of China from 1980 to 2050. Ecol. Indic. 2022, 142, 109178. [Google Scholar] [CrossRef]
- Abijith, D.; Saravanan, S. Assessment of Land Use and Land Cover Change Detection and Prediction Using Remote Sensing and CA Markov in the Northern Coastal Districts of Tamil Nadu, India. Environ. Sci. Pollut. Res. 2022, 29, 86055–86067. [Google Scholar] [CrossRef]
- Xin, X.; Zhang, T.; He, F.; Zhang, W.; Chen, K. Assessing and Simulating Changes in Ecosystem Service Value Based on Land Use/Cover Change in Coastal Cities: A Case Study of Shanghai, China. Ocean Coast. Manag. 2023, 239, 106591. [Google Scholar] [CrossRef]
- Su, K.; Wei, D.; Lin, W. Regional differences and spatial patterns of urbanization efficiency in Fujian Province, China. Acta Ecol. Sin. 2019, 39, 5450–5459. [Google Scholar]
- Ganjirad, M.; Bagheri, H. Google Earth Engine-Based Mapping of Land Use and Land Cover for Weather Forecast Models Using Landsat 8 Imagery. Ecol. Inform. 2024, 80, 102498. [Google Scholar] [CrossRef]
- Velastegui-Montoya, A.; Montalván-Burbano, N.; Carrión-Mero, P.; Rivera-Torres, H.; Sadeck, L.; Adami, M. Google Earth Engine: A Global Analysis and Future Trends. Remote Sens. 2023, 15, 3675. [Google Scholar] [CrossRef]
- Xu, X.; Zhou, C.; Gong, H.; Chen, B.; Wang, L. Monitoring and Analysis of Land Subsidence in Cangzhou Based on Small Baseline Subsets Interferometric Point Target Analysis Technology. Land 2023, 12, 2114. [Google Scholar] [CrossRef]
- Chen, Y.; Wang, X.; Xie, Z. Land Cover Diversity: Reshaping the Socioeconomic Value of Land. J. Environ. Manag. 2023, 332, 117404. [Google Scholar] [CrossRef] [PubMed]
- Yang, J.; Huang, X. The 30 m Annual Land Cover Dataset and Its Dynamics in China from 1990 to 2019. Earth Syst. Sci. Data 2021, 13, 3907–3925. [Google Scholar] [CrossRef]
- Breiman, L. Random Forests. Mach. Learn. 2001, 45, 5–32. [Google Scholar] [CrossRef]
- Thonfeld, F.; Steinbach, S.; Muro, J.; Kirimi, F. Long-Term Land Use/Land Cover Change Assessment of the Kilombero Catchment in Tanzania Using Random Forest Classification and Robust Change Vector Analysis. Remote Sens. 2020, 12, 1057. [Google Scholar] [CrossRef]
- Billah, M.; Islam, A.K.M.S.; Mamoon, W.B.; Rahman, M.R. Random Forest Classifications for Land Use Mapping to Assess Rapid Flood Damage Using Sentinel-1 and Sentinel-2 Data. Remote Sens. Appl. Soc. Environ. 2023, 30, 100947. [Google Scholar] [CrossRef]
- Nguyen, L.H.; Joshi, D.R.; Clay, D.E.; Henebry, G.M. Characterizing Land Cover/Land Use from Multiple Years of Landsat and MODIS Time Series: A Novel Approach Using Land Surface Phenology Modeling and Random Forest Classifier. Remote Sens. Environ. 2020, 238, 111017. [Google Scholar] [CrossRef]
- Liu, H.; Homma, R.; Liu, Q.; Fang, C. Multi-Scenario Prediction of Intra-Urban Land Use Change Using a Cellular Automata-Random Forest Model. ISPRS Int. J. Geo-Inf. 2021, 10, 503. [Google Scholar] [CrossRef]
- Huang, S.; Tang, L.; Hupy, J.P.; Wang, Y.; Shao, G. A Commentary Review on the Use of Normalized Difference Vegetation Index (NDVI) in the Era of Popular Remote Sensing. J. For. Res. 2021, 32, 1–6. [Google Scholar] [CrossRef]
- Zheng, Y.; Tang, L.; Wang, H. An Improved Approach for Monitoring Urban Built-up Areas by Combining NPP-VIIRS Nighttime Light, NDVI, NDWI, and NDBI. J. Clean. Prod. 2021, 328, 129488. [Google Scholar] [CrossRef]
- Martín-Ortega, P.; García-Montero, L.G.; Sibelet, N. Temporal Patterns in Illumination Conditions and Its Effect on Vegetation Indices Using Landsat on Google Earth Engine. Remote Sens. 2020, 12, 211. [Google Scholar] [CrossRef]
- Tang, C.; Li, Y. Geo-information Tupu process of land use/cover change in polycentric urban agglomeration: A case study of Changsha-Zhuzhou-Xiangtan urban agglomeration. Geogr. Res. 2020, 39, 2626–2641. [Google Scholar]
- Wu, L.; Li, X.; Mao, D.; Wang, Z. Urban land use classification based on remote sensing and multi-source geographic data. Remote Sens. Nat. Resour. 2022, 34, 127–134. [Google Scholar]
- Vázquez, C.; Verdenelli, R.A.; Merlo, C.; Pérez Brandan, C.; Kowaljow, E.; Meriles, J.M. Influence of Land-Use Changes on Microbial Community Structure and Diversity in a Semiarid Region. Land Degrad. Dev. 2022, 33, 3690–3702. [Google Scholar] [CrossRef]
- Zhao, X.; Sun, Y.; Huang, J.; Wang, H.; Tang, D. Effects of Soil Heavy Metal Pollution on Microbial Activities and Community Diversity in Different Land Use Types in Mining Areas. Environ. Sci. Pollut. Res. 2020, 27, 20215–20226. [Google Scholar] [CrossRef] [PubMed]
- Andaryani, S.; Nourani, V.; Abbasnejad, H.; Koch, J.; Stisen, S.; Klöve, B.; Haghighi, A.T. Spatio-Temporal Analysis of Climate and Irrigated Vegetation Cover Changes and Their Role in Lake Water Level Depletion Using a Pixel-Based Approach and Canonical Correlation Analysis. Sci. Total Environ. 2023, 873, 162326. [Google Scholar] [CrossRef]
- Wang, Y.; Wang, Y.; Zhang, J.; Wang, Q. Land use transition in coastal area and its associated eco-environmental effect: A case study of coastal area in Fujian Province. Acta Sci. Circumstantiae 2021, 41, 3927–3937. [Google Scholar] [CrossRef]
- Hu, Q.; Song, J.; Huang, D.; Ding, L.; Lin, Z.; Hu, J. Research on Water Quality Parameters Inversion in Mulan River Based on Remote Sensing Images. Environ. Monit. China 2023, 39, 206–214. [Google Scholar] [CrossRef]
- Zhang, Y.; Peng, J.; Wang, J.; Yang, H. Analysis on spatial and temporal change of land use in Jianghan Plain based on Geo-information Atlas. Res. Soil Water Conserv. 2020, 27, 85–92+2. [Google Scholar] [CrossRef]
- Li, B.; Griffith, D.A. The Moran Spectrum as a Geoinformatic Tupu: Implications for the First Law of Geography. Ann. GIS 2022, 28, 69–83. [Google Scholar] [CrossRef]
- Arafat, Y.; Tayyab, M.; Khan, M.U.; Chen, T.; Amjad, H.; Awais, S.; Lin, X.; Lin, W.; Lin, S. Long-Term Monoculture Negatively Regulates Fungal Community Composition and Abundance of Tea Orchards. Agronomy 2019, 9, 466. [Google Scholar] [CrossRef]
- Liu, Y.; Liu, Y.; Zeng, C.; Wang, J.; Nyimbo, W.J.; Jiao, Y.; Wu, L.; Chen, T.; Fang, C.; Lin, W. Intercropping with Achyranthes Bidentata Alleviates Rehmannia Glutinosa Consecutive Monoculture Problem by Reestablishing Rhizosphere Microenvironment. Front. Plant Sci. 2022, 13, 1041561. [Google Scholar] [CrossRef]
Figure 1.
The location of study area (Putian City, China).

Figure 2.
The research workflow for this study.

Figure 3.
Land-use pattern in Putian City of China from 2000 to 2020.

Figure 4.
(a) Tupu of LUTs in Putian City from 2000 to 2010 and (b) Tupu of LUTs in Putian City from 2010 to 2020. Note: Cultivated land (CL), forest land (FL), orchard land (OL), grassland (GL), water body (WB), built-up land (BL), and unused land (UL) were established by assigning codes 1 through 7, respectively. Code 12 means the transition of cultivated land to forest land. Code 26 signifies the transition of forest land to built-up land. The rest of the code follows the same rules.

Figure 5.
(a) Land-use rising Tupu in Putian City from 2000 to 2010; (b) Land-use rising Tupu in Putian City from 2010 to 2020.
Figure 5.
(a) Land-use rising Tupu in Putian City from 2000 to 2010; (b) Land-use rising Tupu in Putian City from 2010 to 2020.

Figure 6.
(a) Land-use falling Tupu in Putian City from 2000 to 2010; (b) Land-use falling Tupu in Putian City from 2010 to 2020.
Figure 6.
(a) Land-use falling Tupu in Putian City from 2000 to 2010; (b) Land-use falling Tupu in Putian City from 2010 to 2020.

Figure 7.
Two-dimensional ranking of land-use types and socio-economic indicators.


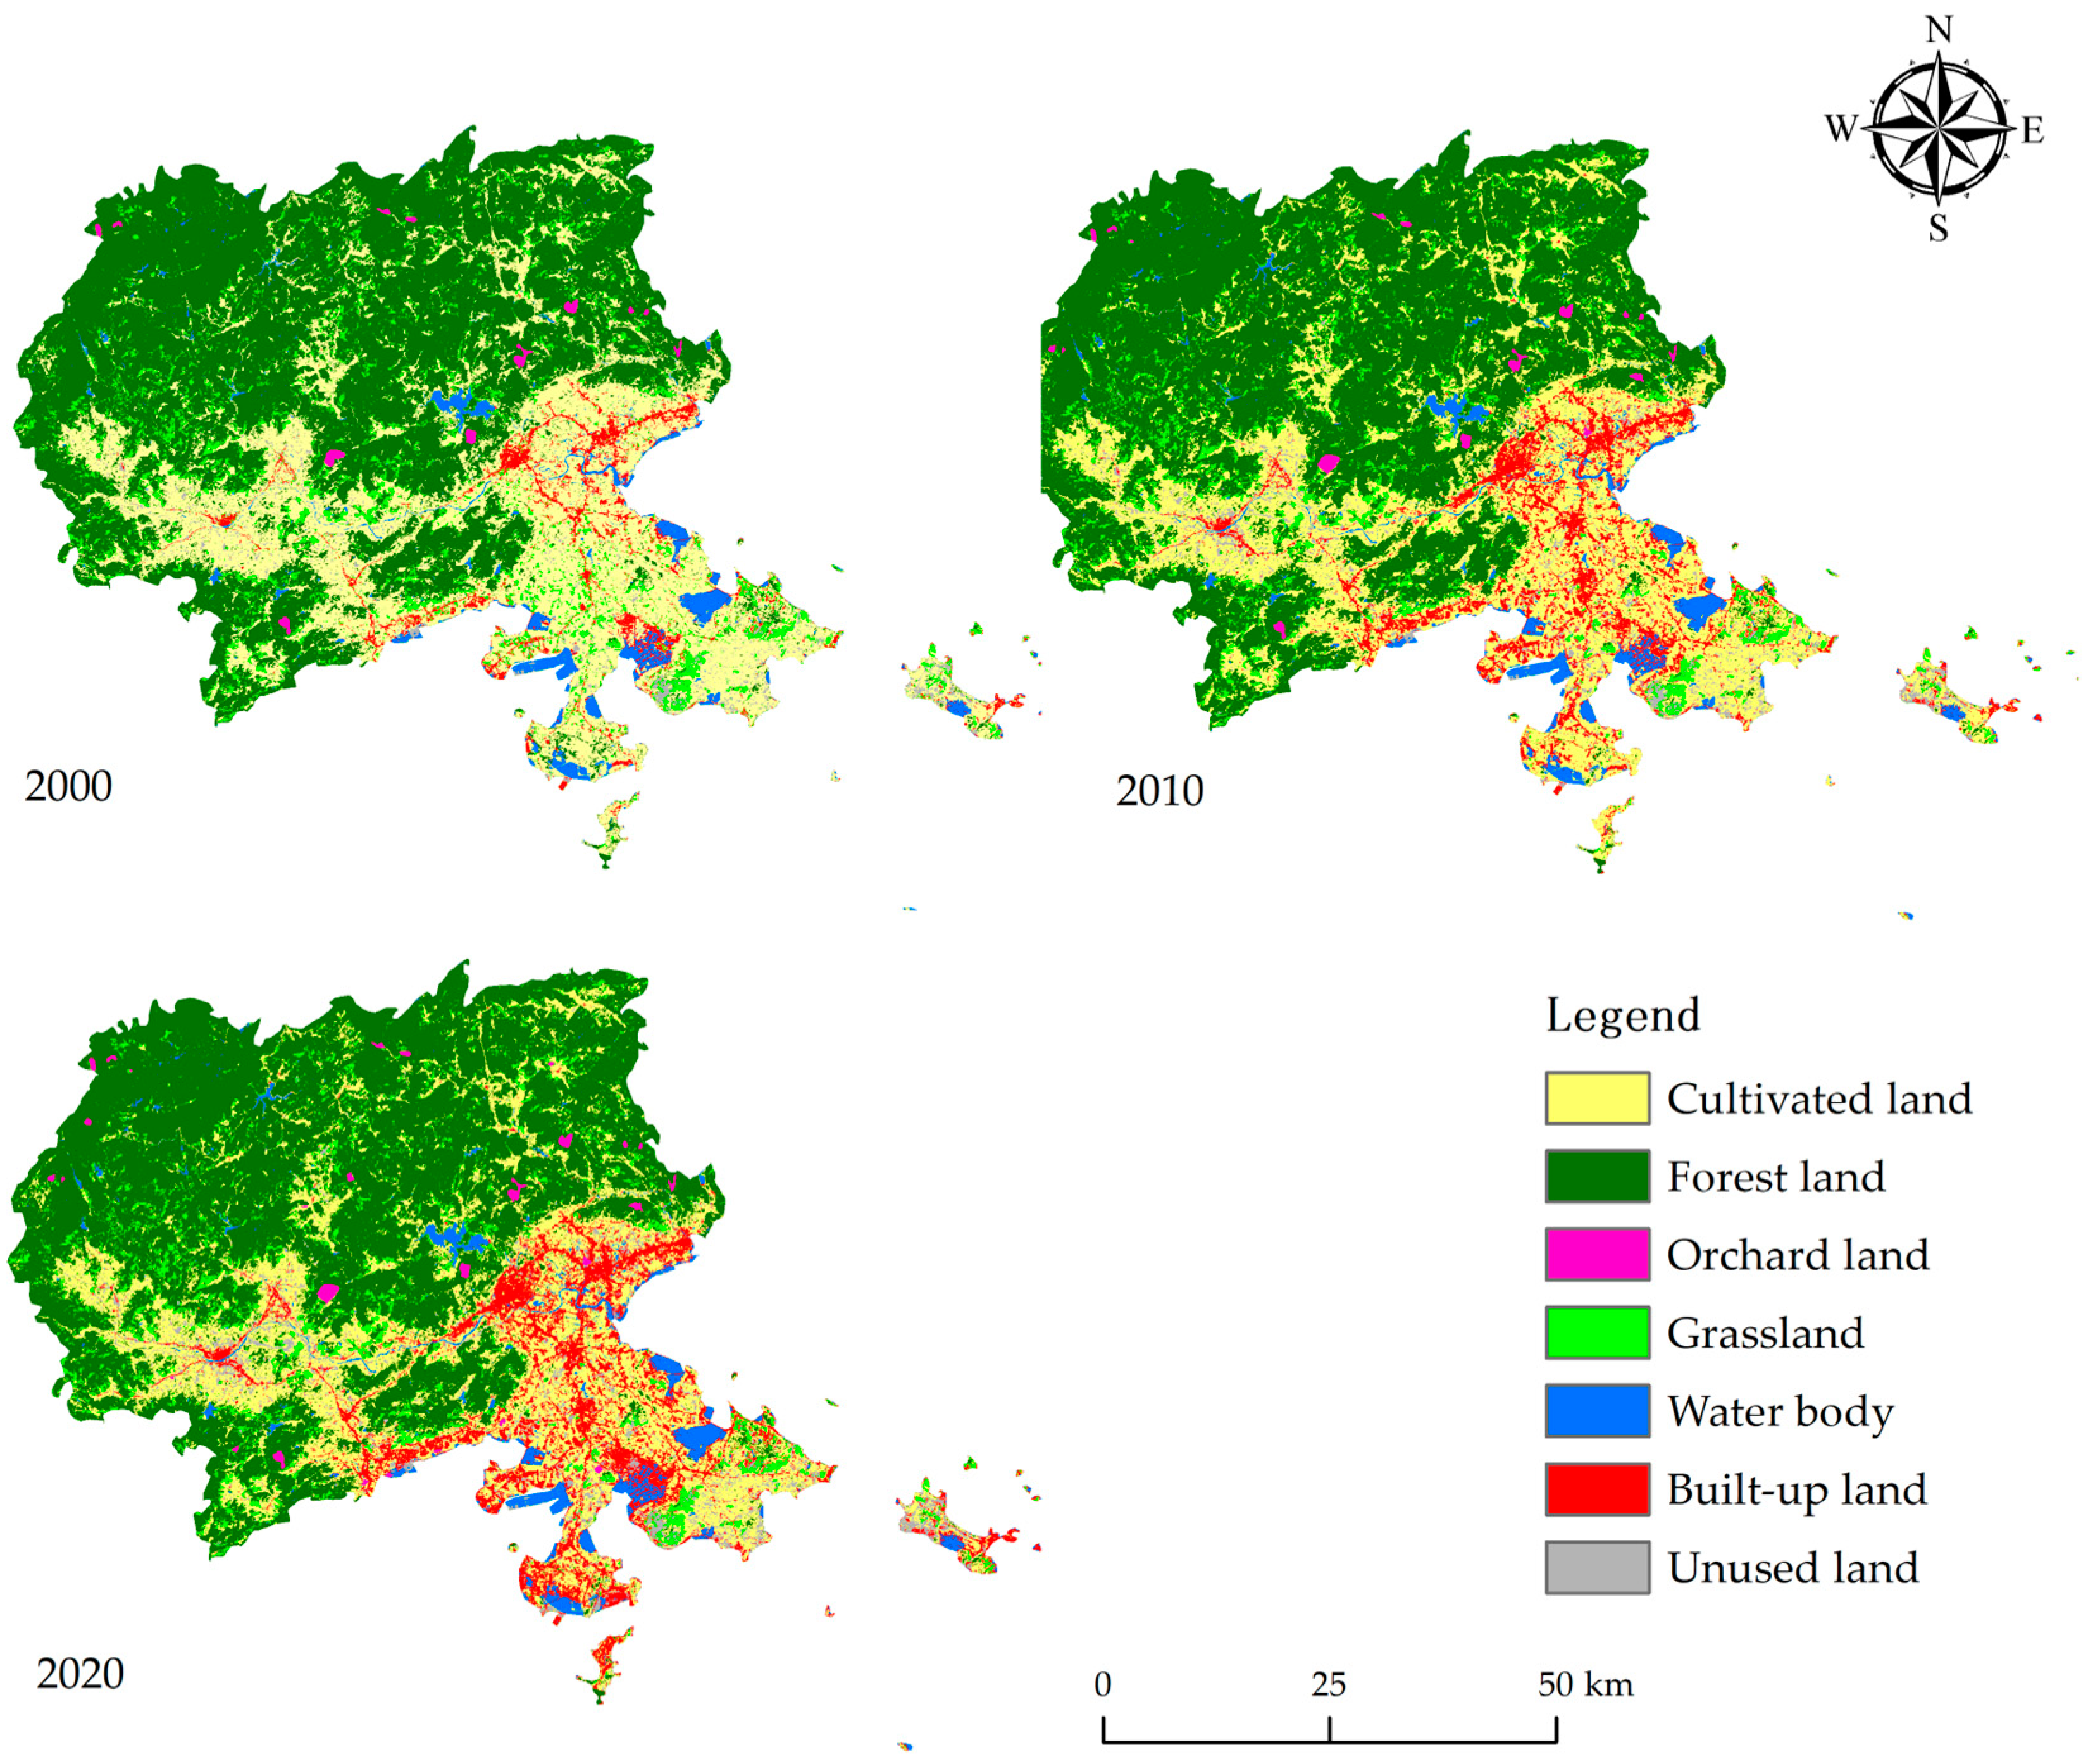
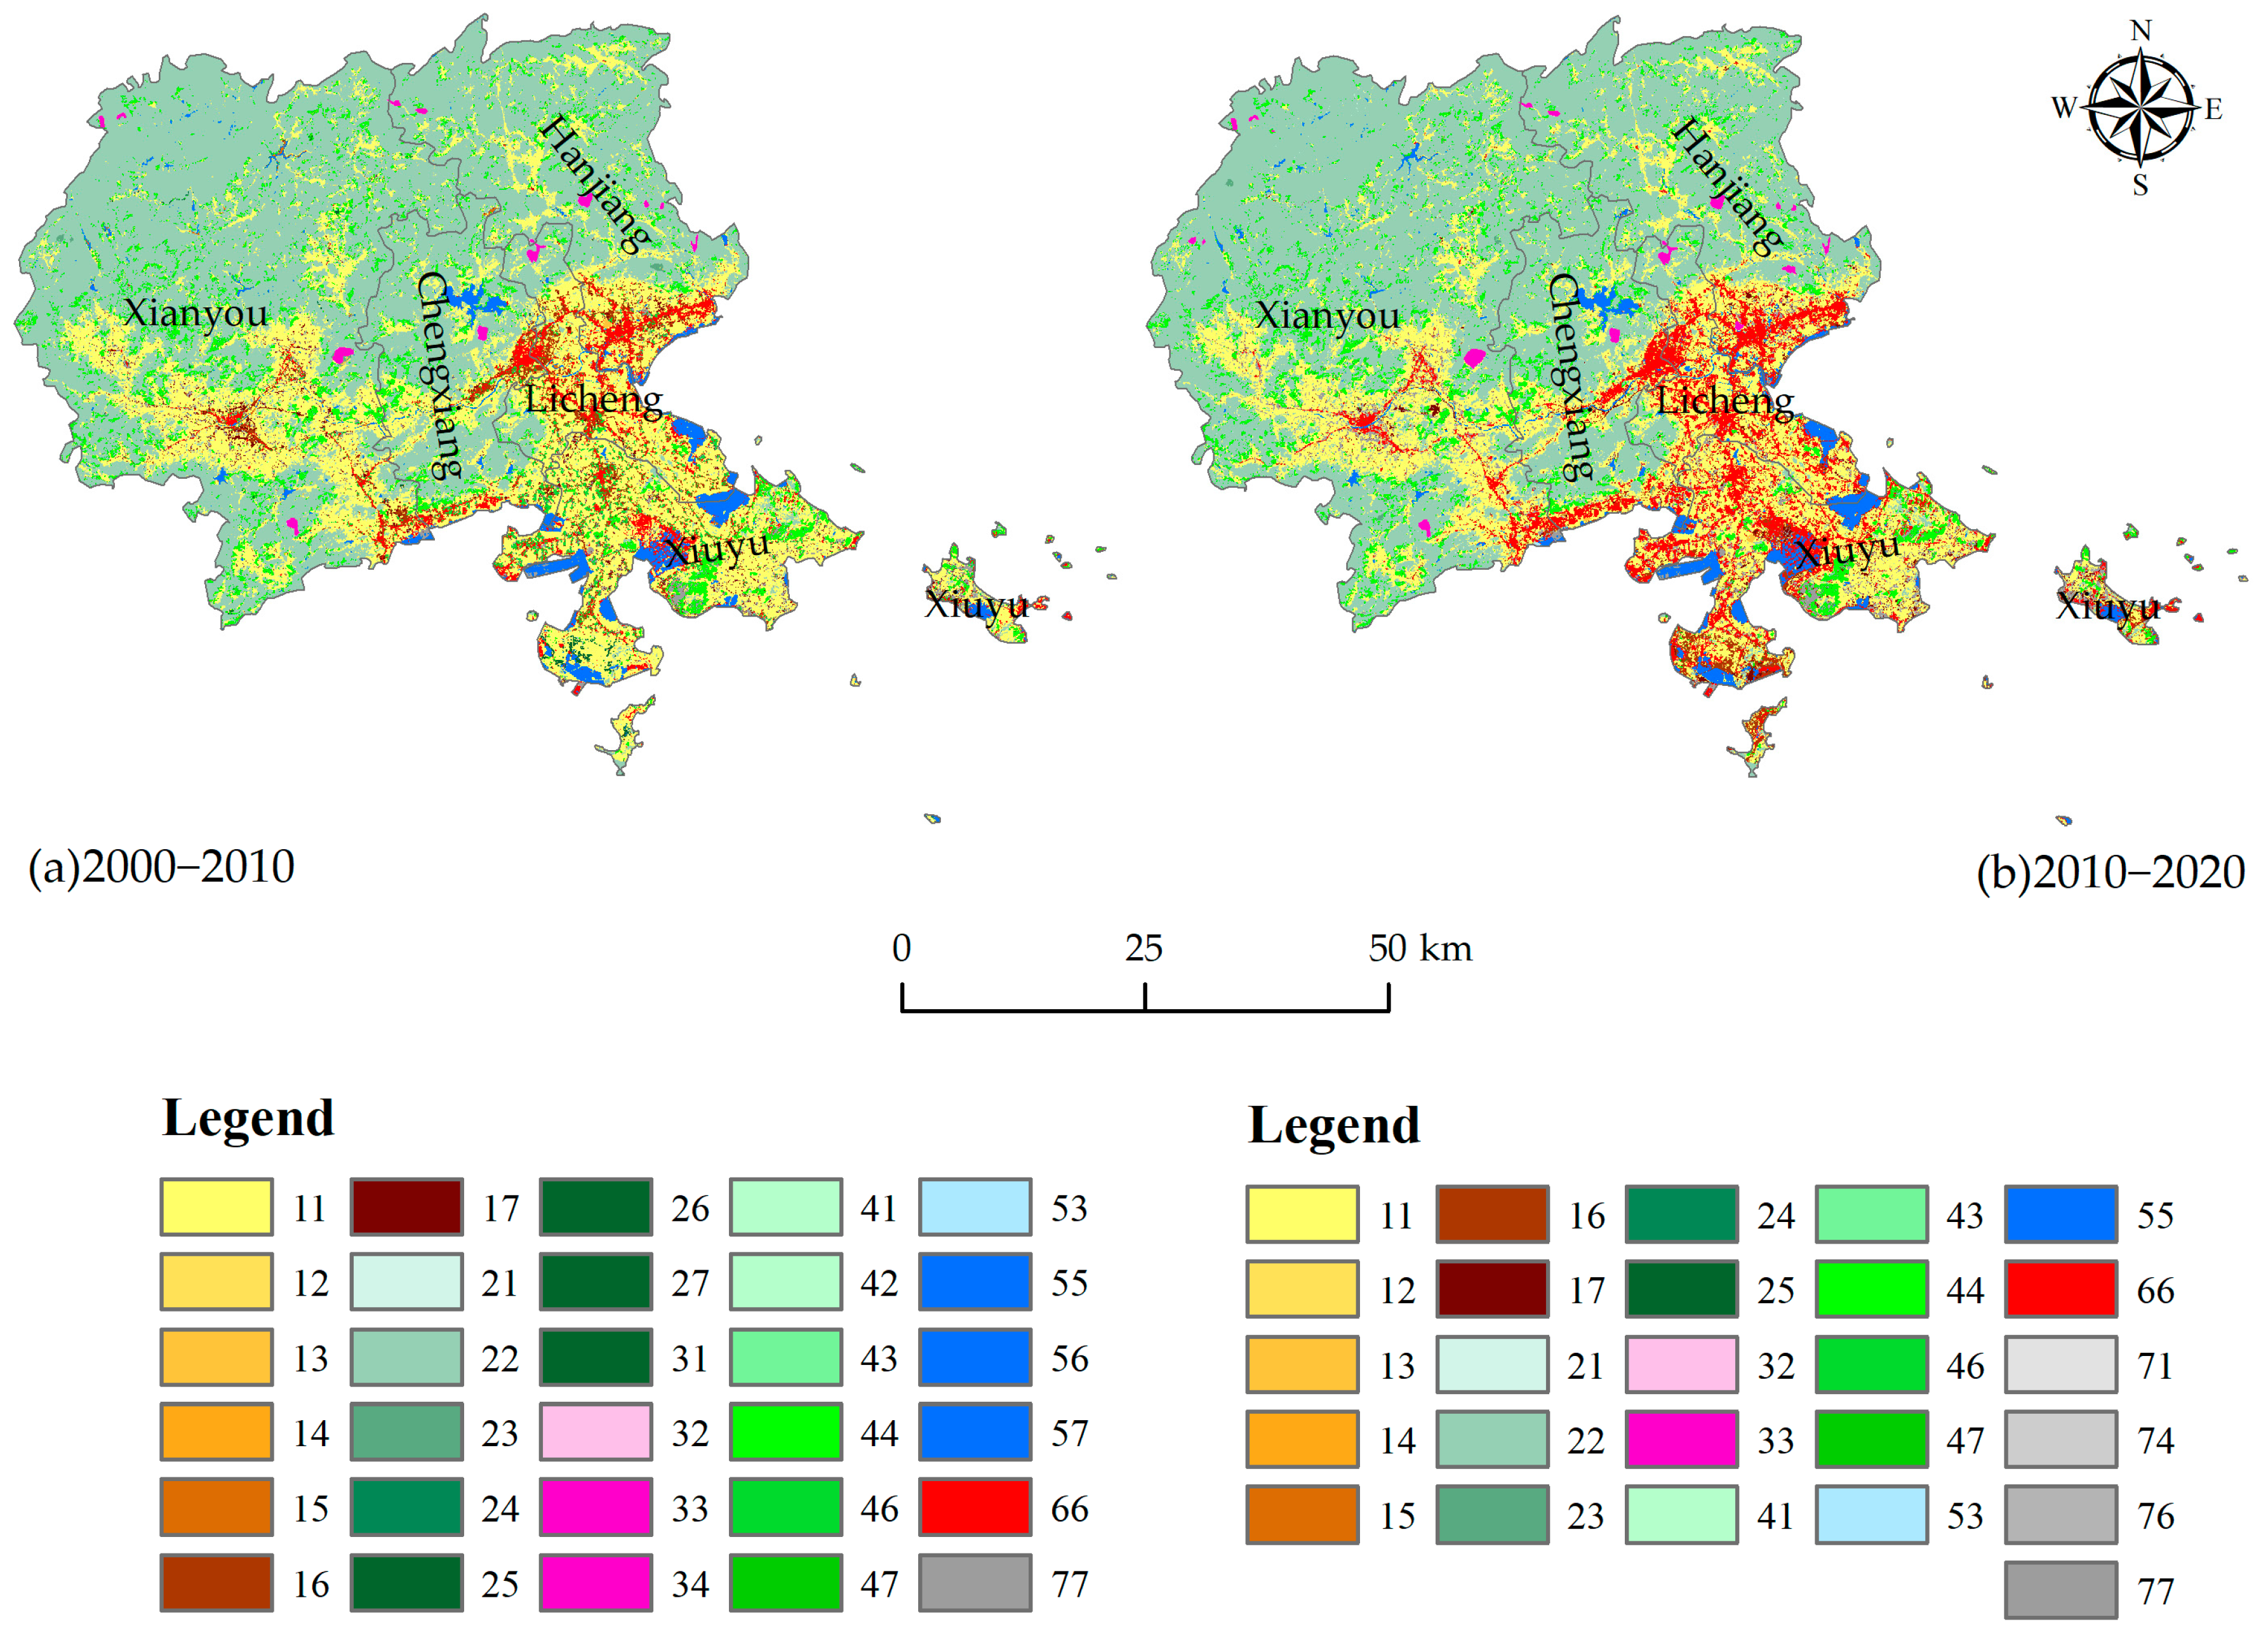
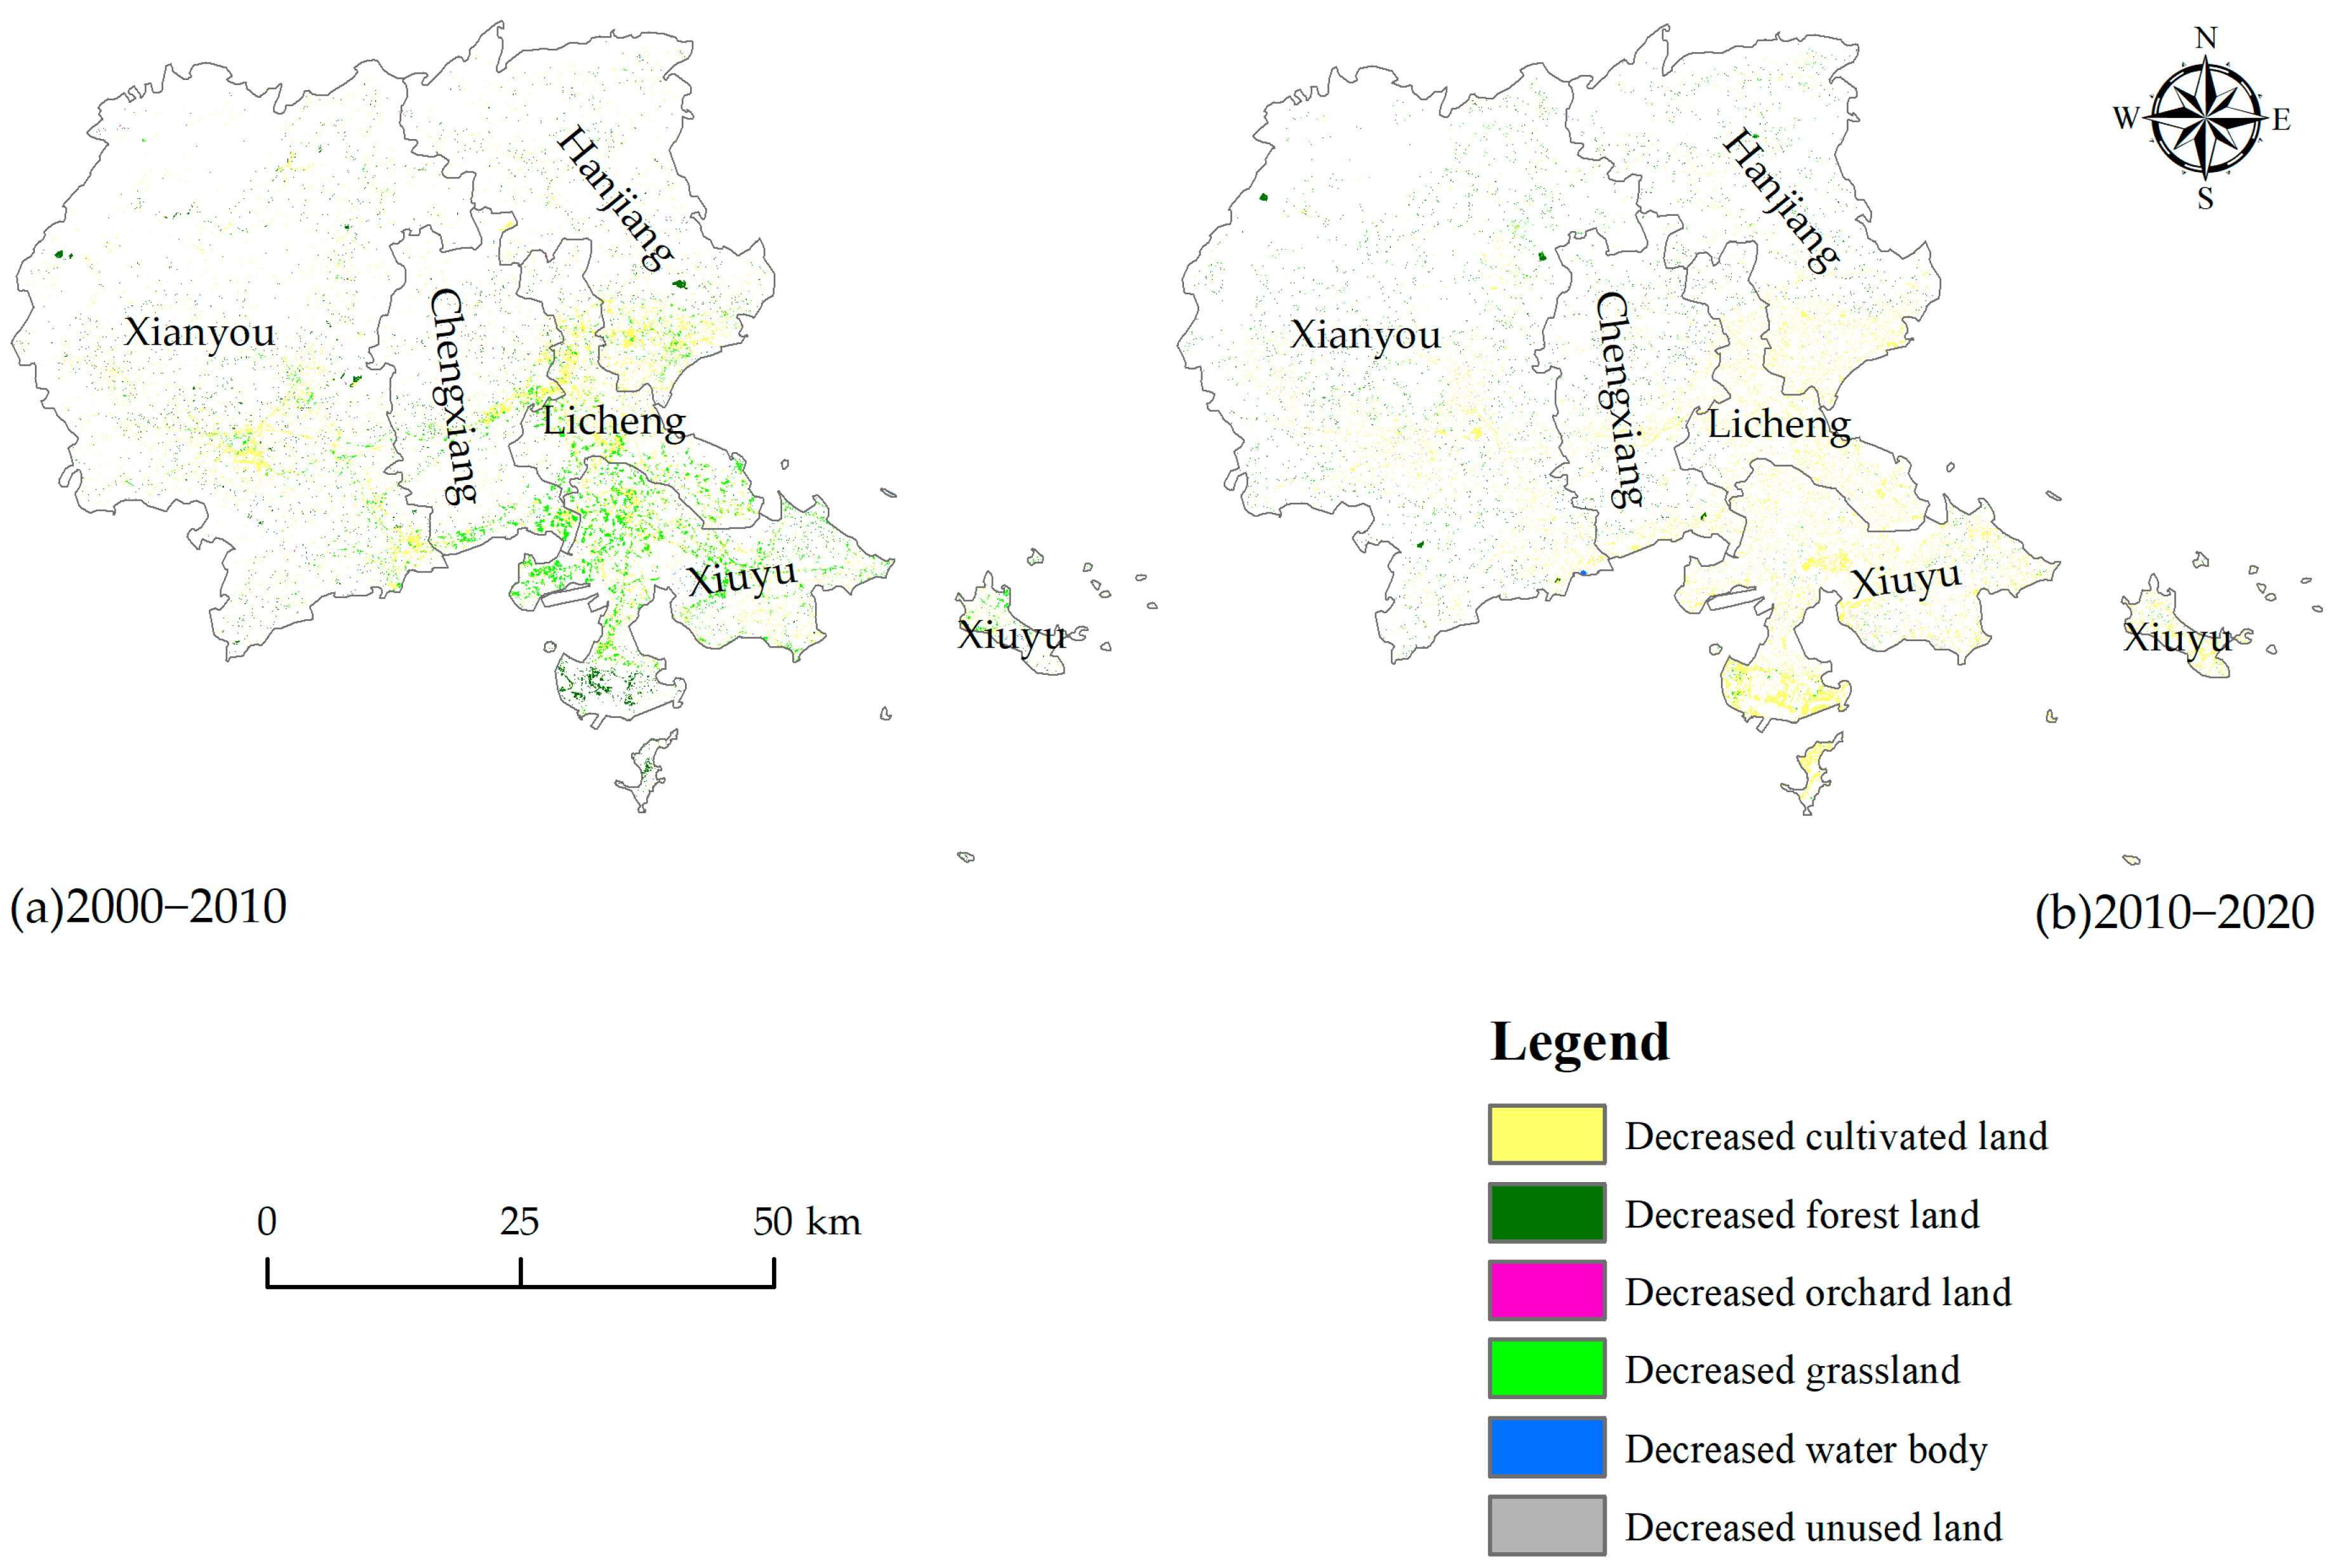
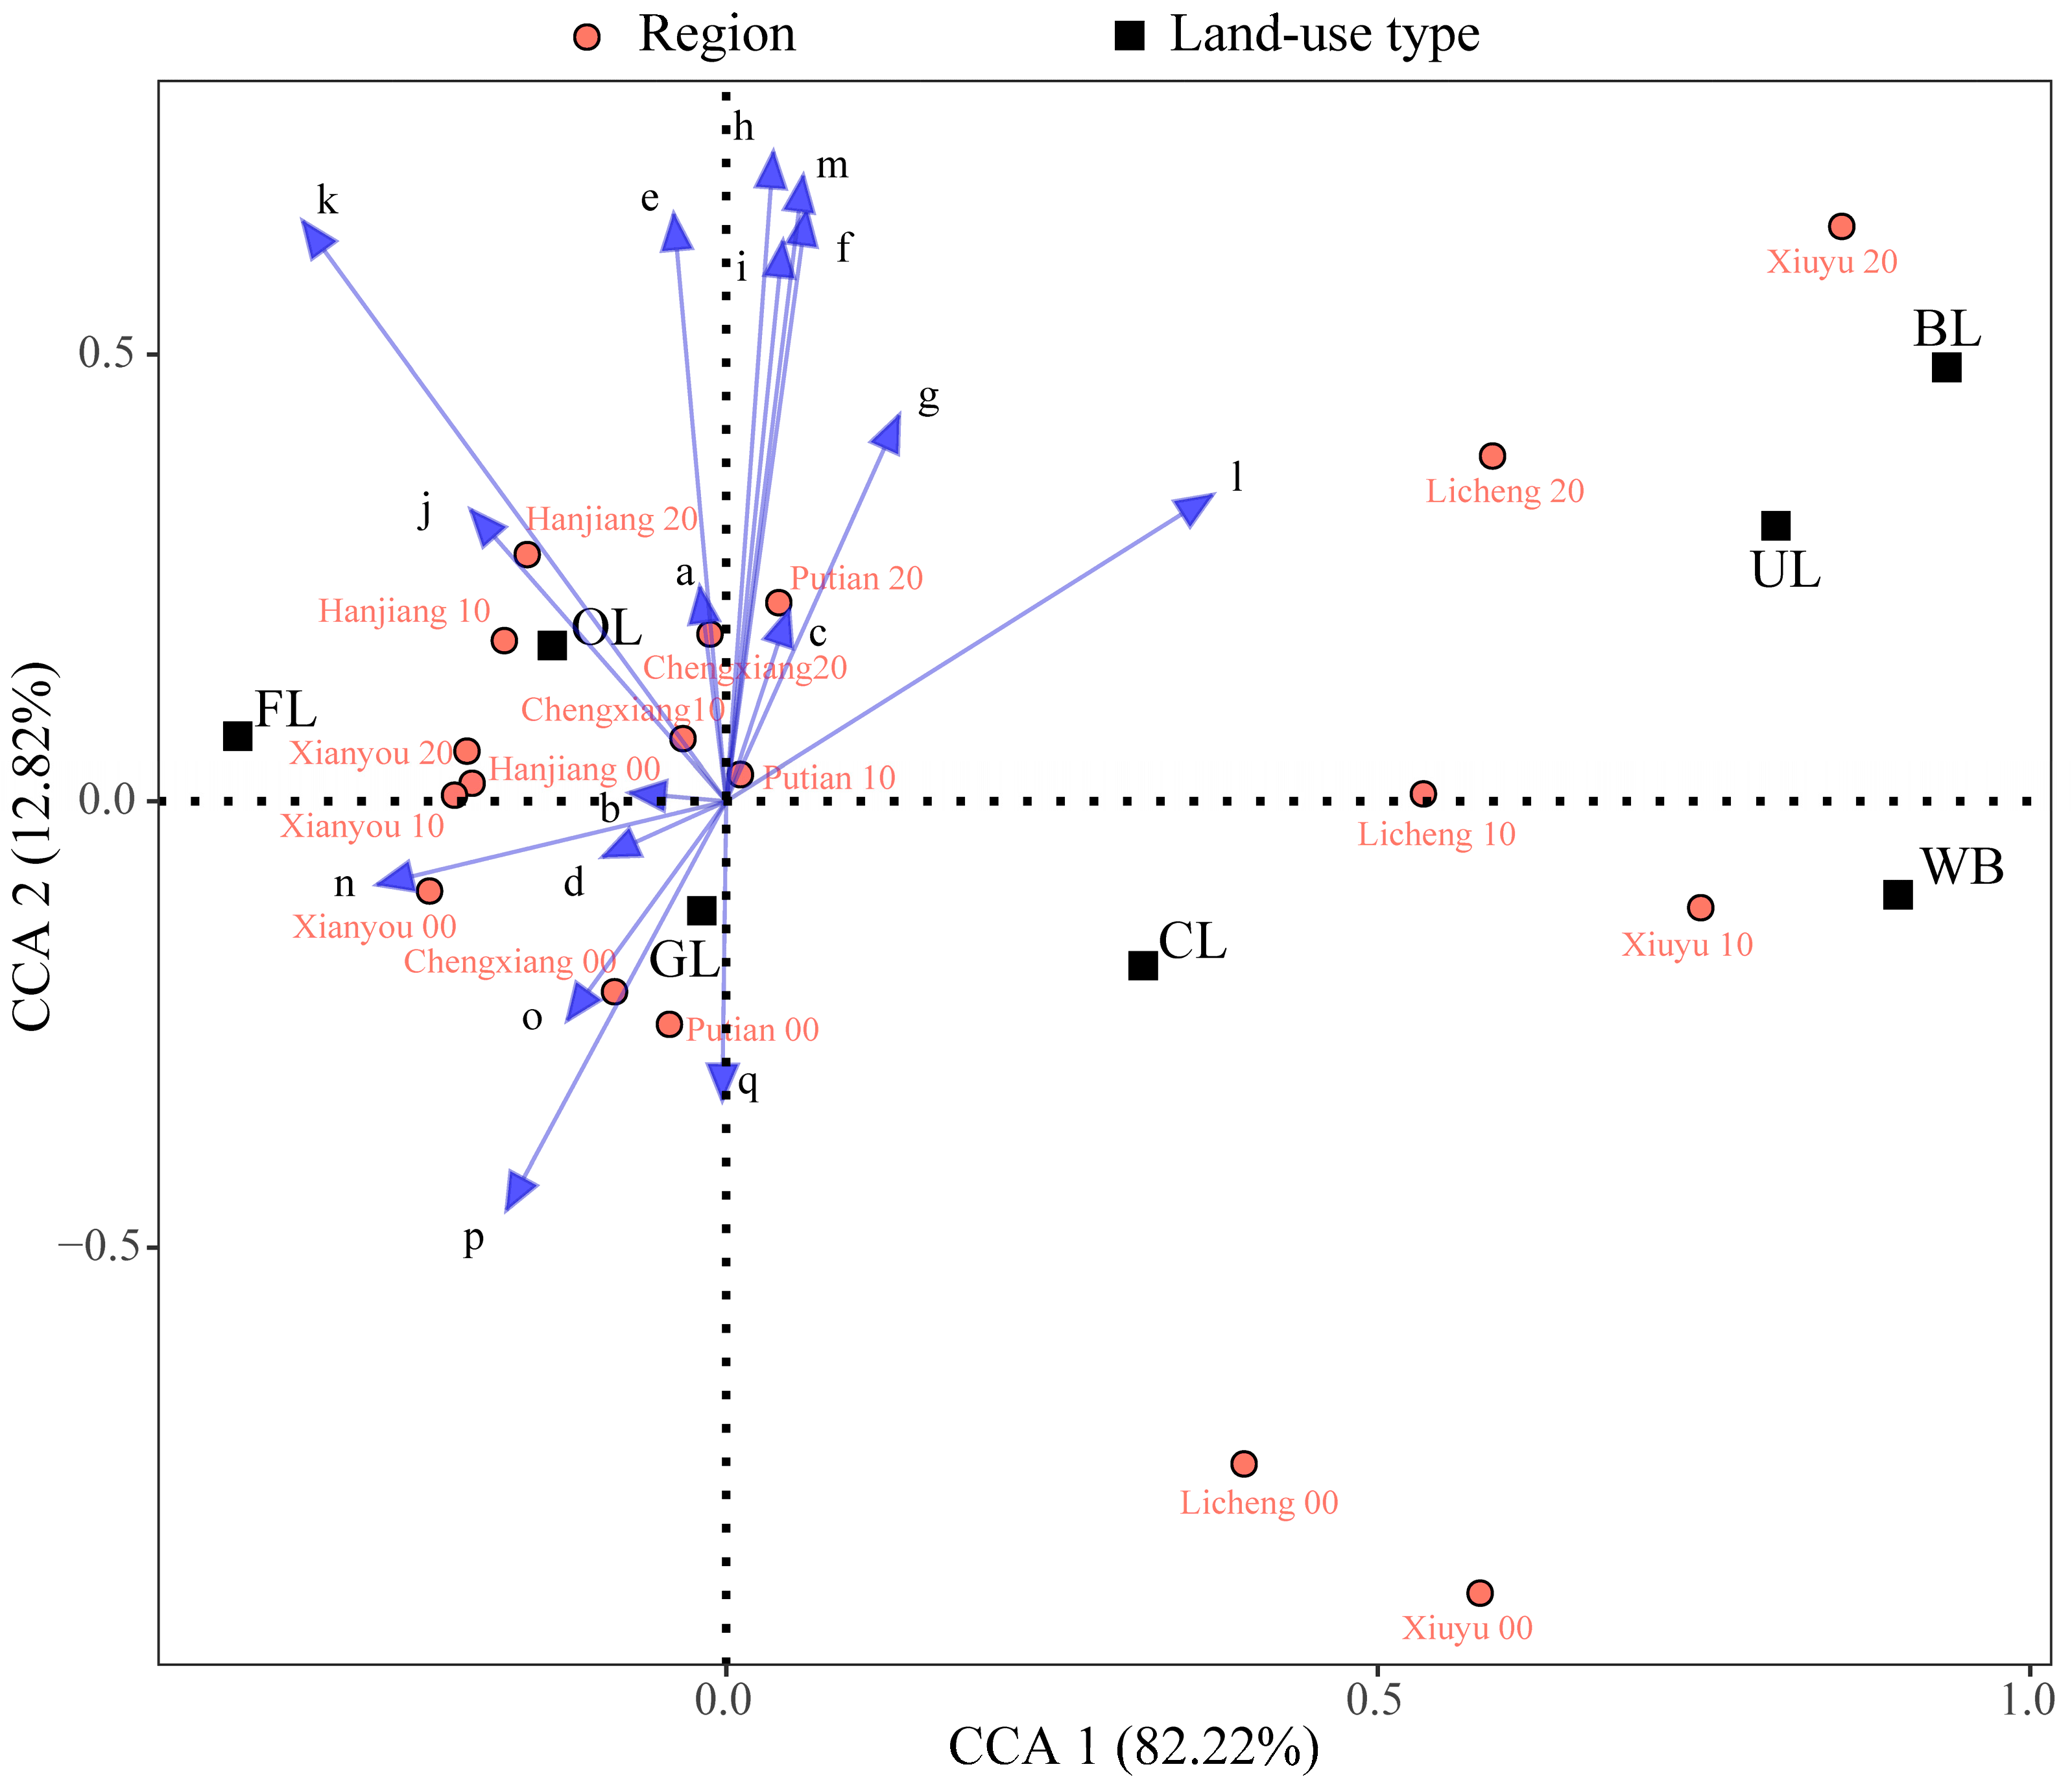
Table 1.
The information on Landsat remote sensing images.
| Year | Path | Row | Cloud Cover | Date |
|---|---|---|---|---|
| 2000 | 118 | 041 | <5% | 14 April |
| 118 | 042 | 14 April | ||
| 119 | 041 | 4 April | ||
| 2010 | 119 | 042 | 4 April | |
| 119 | 043 | 18 March | ||
| 118 | 041 | 27 March | ||
| 2020 | 120 | 042 | 20 February | |
| 119 | 042 | 16 March | ||
| 118 | 042 | 4 October |
Table 2.
Land-use structure in Putian City from 2000 to 2020.
| Land Type | 2000 | 2010 | 2020 | Single Land-Use Dynamic Index/% | |||||
|---|---|---|---|---|---|---|---|---|---|
| Area/km2 | Ratio/% | Area/km2 | Ration/% | Area/km2 | Ration/% | 2000–2010 | 2010–2020 | 2000–2020 | |
| Cultivated land | 1261.15 | 32.14 | 1125.85 | 28.70 | 1003.29 | 25.57 | −1.07 | −1.09 | −1.02 |
| Forest land | 2071.01 | 52.78 | 2054.28 | 52.36 | 2046.22 | 52.15 | −0.08 | −0.04 | −0.06 |
| Orchard land | 12.76 | 0.33 | 15.73 | 0.40 | 19.25 | 0.49 | 2.33 | 2.24 | 2.55 |
| Grassland | 309.00 | 7.88 | 263.56 | 6.72 | 266.23 | 6.79 | −1.47 | 0.10 | −0.69 |
| Water body | 105.33 | 2.68 | 114.44 | 2.92 | 115.74 | 2.95 | 0.87 | 0.11 | 0.49 |
| Construction land | 109.15 | 2.78 | 245.61 | 6.26 | 335.65 | 8.55 | 12.50 | 3.67 | 10.37 |
| Unused land | 55.09 | 1.40 | 104.02 | 2.65 | 137.13 | 3.49 | 8.88 | 3.18 | 7.44 |
| Total | 3923.49 | - | 3923.49 | - | 3923.49 | - | 21.96 | 8.17 | 19.09 |
Table 3.
Tupu unit ranking of LUTs in Putian City from 2000 to 2010 (Top 10).
| Code | Transition Tupu Unit | Number of Tupu Unit/No. | Transition Area/km2 | Change Ratio/% |
|---|---|---|---|---|
| 16 | Cultivated land → Built-up land | 78,184 | 70.37 | 28.56 |
| 46 | Grassland → Built-up land | 65,136 | 58.62 | 23.79 |
| 17 | Cultivated land → Unused land | 49,782 | 44.80 | 18.18 |
| 12 | Cultivated land → Forest land | 18,352 | 16.52 | 6.70 |
| 21 | Forest land → Cultivated land | 16,516 | 14.86 | 6.03 |
| 15 | Cultivated land → Water body | 11,246 | 10.12 | 4.11 |
| 14 | Cultivated land → Grass land | 9143 | 8.23 | 3.34 |
| 24 | Forest land → Grass land | 7113 | 6.40 | 2.60 |
| 26 | Forest land → Built-up land | 6781 | 6.10 | 2.48 |
| 27 | Forest land → Unused land | 3945 | 3.55 | 1.44 |
Table 4.
Tupu unit ranking of LUTs in Putian City from 2010 to 2020 (Top 10).
| Code | Transition Tupu Unit | Number of Tupu Unit/No. | Transition Area/km2 | Change Ratio/% |
|---|---|---|---|---|
| 16 | Cultivated land → Built-up land | 94,999 | 85.50 | 46.67 |
| 17 | Cultivated land → Unused land | 40,640 | 36.58 | 19.96 |
| 21 | Forest land → Cultivated land | 18,329 | 16.50 | 9.00 |
| 12 | Cultivated land → Forest land | 15,545 | 13.99 | 7.64 |
| 14 | Cultivated land → Grassland | 8320 | 7.49 | 4.09 |
| 41 | Grassland → Cultivated land | 5939 | 5.35 | 2.92 |
| 24 | Forest land → Grassland | 4256 | 3.83 | 2.09 |
| 76 | Unused land → Built-up land | 3154 | 2.84 | 1.55 |
| 71 | Unused land → Cultivated land | 2175 | 1.96 | 1.07 |
| 23 | Forest land → Orchard land | 2014 | 1.81 | 0.99 |
Table 5.
The structure list of land-use rising Tupu in Putian City from 2000 to 2020 (km2).
| Period | District or County | Newly Added Cultivated Land | Newly Added Forest Land | Newly Added Orchard Land | Newly Added Grassland | Newly Added Water Body | Newly Added Built-Up Land | Newly Added Unused Land | Unchanged Area |
|---|---|---|---|---|---|---|---|---|---|
| 2000–2010 | Chengxiang | 2.00 | 3.06 | 0.03 | 1.86 | 1.49 | 18.70 | 3.08 | 451.62 |
| Hangjiang | 2.46 | 4.11 | 1.69 | 2.47 | 2.32 | 14.36 | 3.93 | 722.02 | |
| Licheng | 1.10 | 0.79 | 0.06 | 0.34 | 2.06 | 30.04 | 3.26 | 241.62 | |
| Xiuyu | 3.56 | 0.43 | 0.00 | 1.36 | 1.40 | 57.87 | 17.66 | 478.36 | |
| Xianyou | 6.52 | 8.50 | 1.59 | 8.62 | 3.25 | 15.48 | 21.00 | 1782.70 | |
| Total | 15.63 | 16.89 | 3.38 | 14.65 | 10.52 | 136.45 | 48.93 | 3676.32 | |
| 2010–2020 | Chengxiang | 3.70 | 1.93 | 0.60 | 1.43 | 0.27 | 5.87 | 4.15 | 463.89 |
| Hangjiang | 5.08 | 2.44 | 0.26 | 2.05 | 0.35 | 9.74 | 2.70 | 730.74 | |
| Licheng | 0.92 | 1.08 | 0.01 | 0.26 | 0.26 | 13.84 | 2.85 | 260.03 | |
| Xiuyu | 1.51 | 2.39 | 0.63 | 1.39 | 0.23 | 51.77 | 19.34 | 483.38 | |
| Xianyou | 12.61 | 6.40 | 2.15 | 6.63 | 0.42 | 8.81 | 9.37 | 1801.27 | |
| Total | 23.82 | 14.25 | 3.66 | 11.75 | 1.54 | 90.04 | 23.82 | 3739.31 |
Table 6.
The structure list of land-use falling Tupu in Putian City from 2000 to 2020 (km2).
| Period | District or County | Unchanged Area | Decreased Cultivate Land | Decreased forest LAND | Decreased Orchard Land | Decreased Grassland | Decreased Water Body | Decreased Built-Up Land | Decreased Unused Land |
|---|---|---|---|---|---|---|---|---|---|
| 2000–2010 | Chengxiang | 451.62 | 17.99 | 3.24 | 0.04 | 8.87 | 0.09 | 0.00 | 0.00 |
| Hangjiang | 722.02 | 23.03 | 4.77 | 0.19 | 3.20 | 0.15 | 0.00 | 0.01 | |
| Licheng | 241.62 | 26.07 | 1.53 | 0.06 | 9.83 | 0.17 | 0.00 | 0.01 | |
| Xiuyu | 478.36 | 38.65 | 10.04 | 0.00 | 32.66 | 0.94 | 0.00 | 0.00 | |
| Xianyou | 1782.70 | 45.20 | 14.05 | 0.12 | 5.53 | 0.06 | 0.00 | 0.00 | |
| Total | 3676.32 | 150.94 | 33.62 | 0.40 | 60.09 | 1.41 | 0.00 | 0.02 | |
| 2010–2020 | Chengxiang | 463.89 | 13.03 | 3.91 | 0.01 | 0.79 | 0.00 | 0.00 | 0.22 |
| Hangjiang | 730.74 | 16.22 | 4.76 | 0.06 | 1.23 | 0.00 | 0.00 | 0.35 | |
| Licheng | 260.03 | 17.92 | 0.83 | 0.02 | 0.21 | 0.00 | 0.00 | 0.25 | |
| Xiuyu | 483.38 | 71.56 | 0.69 | 0.00 | 2.31 | 0.01 | 0.00 | 2.70 | |
| Xianyou | 1801.27 | 27.65 | 12.12 | 0.06 | 4.56 | 0.23 | 0.00 | 1.77 | |
| Total | 3739.31 | 146.38 | 22.31 | 0.14 | 9.09 | 0.24 | 0.00 | 5.30 |
Table 7.
Correlation between socioeconomic indicators and ranking axis.
| Symbol | Indicator | CCA1 | CCA2 |
|---|---|---|---|
| l | Fishery output value | 0.373071 | 0.3432 |
| g | Gross value of primary industry | 0.132691 | 0.432421 |
| f | GDP | 0.061692 | 0.662864 |
| m | Total industrial output value | 0.059091 | 0.700707 |
| c | Urbanization rate | 0.04841 | 0.214636 |
| i | Gross value of tertiary industry | 0.043508 | 0.627488 |
| h | Gross value of secondary industry | 0.036183 | 0.727325 |
| q | Economic crops area | −0.003031 | −0.335187 |
| a | Non-agricultural population | −0.020272 | 0.24007 |
| e | Total retail sales of social consumer goods | −0.04027 | 0.657806 |
| b | Total population | −0.074218 | 0.009524 |
| d | Agricultural population | −0.094883 | −0.062492 |
| o | Pesticide use | −0.121958 | −0.245523 |
| p | Grain crop area | −0.168553 | −0.457895 |
| j | Total agricultural output value | −0.196017 | 0.326368 |
| n | Agricultural fertilizer use | −0.268036 | −0.093573 |
| k | Forestry output value | −0.324892 | 0.649751 |
Table 8.
Importance ranking of socio-economic indicators.
| Symbol | Indicator | r2 | Pr (>r) |
|---|---|---|---|
| h | Gross value of secondary industry | 0.5457 | 0.001 *** |
| k | Forestry output value | 0.5295 | 0.008 ** |
| m | Total industrial output value | 0.5121 | 0.002 ** |
| f | GDP | 0.4603 | 0.003 ** |
| e | Total retail sales of social consumer goods | 0.4455 | 0.008 ** |
| i | Gross value of tertiary industry | 0.4105 | 0.009 ** |
| l | Fishery output value | 0.3092 | 0.054 |
| p | Grain crops area | 0.2496 | 0.109 |
| g | Gross value of primary industry | 0.2359 | 0.125 |
| j | Total agricultural output value | 0.1342 | 0.341 |
| q | Economic crop area | 0.1265 | 0.352 |
| o | Pesticide use | 0.0704 | 0.567 |
| a | Non-agricultural population | 0.0590 | 0.643 |
| n | Agricultural fertilizer use | 0.0554 | 0.652 |
| c | Urbanization rate | 0.0547 | 0.679 |
| d | Agricultural population | 0.0035 | 0.976 |
| b | Total population | 0.0000 | 1.000 |
Note: ** and *** refer to significant difference at 1% and 0.1% level.
Disclaimer/Publisher’s Note: The statements, opinions and data contained in all publications are solely those of the individual author(s) and contributor(s) and not of MDPI and/or the editor(s). MDPI and/or the editor(s) disclaim responsibility for any injury to people or property resulting from any ideas, methods, instructions or products referred to in the content. |
© 2024 by the authors. Licensee MDPI, Basel, Switzerland. This article is an open access article distributed under the terms and conditions of the Creative Commons Attribution (CC BY) license (https://creativecommons.org/licenses/by/4.0/).
Share and Cite
MDPI and ACS Style
Peng, Q.; Wu, D.; Lin, W.; Fan, S.; Su, K. Land-Use Transitions and Its Driving Mechanism Analysis in Putian City, China, during 2000–2020. Sustainability 2024, 16, 3549. https://doi.org/10.3390/su16093549
AMA Style
Peng Q, Wu D, Lin W, Fan S, Su K. Land-Use Transitions and Its Driving Mechanism Analysis in Putian City, China, during 2000–2020. Sustainability. 2024; 16(9):3549. https://doi.org/10.3390/su16093549
Chicago/Turabian StylePeng, Qingxia, Dongqing Wu, Wenxiong Lin, Shuisheng Fan, and Kai Su. 2024. "Land-Use Transitions and Its Driving Mechanism Analysis in Putian City, China, during 2000–2020" Sustainability 16, no. 9: 3549. https://doi.org/10.3390/su16093549
Note that from the first issue of 2016, this journal uses article numbers instead of page numbers. See further details here.