
Pixel-Based Spatio-Statistical Analysis of Landslide Probability in Humid and Seismically Active Areas of Himalaya and Hindukush

 , , , ,
  and
and
Abstract
:1. Introduction
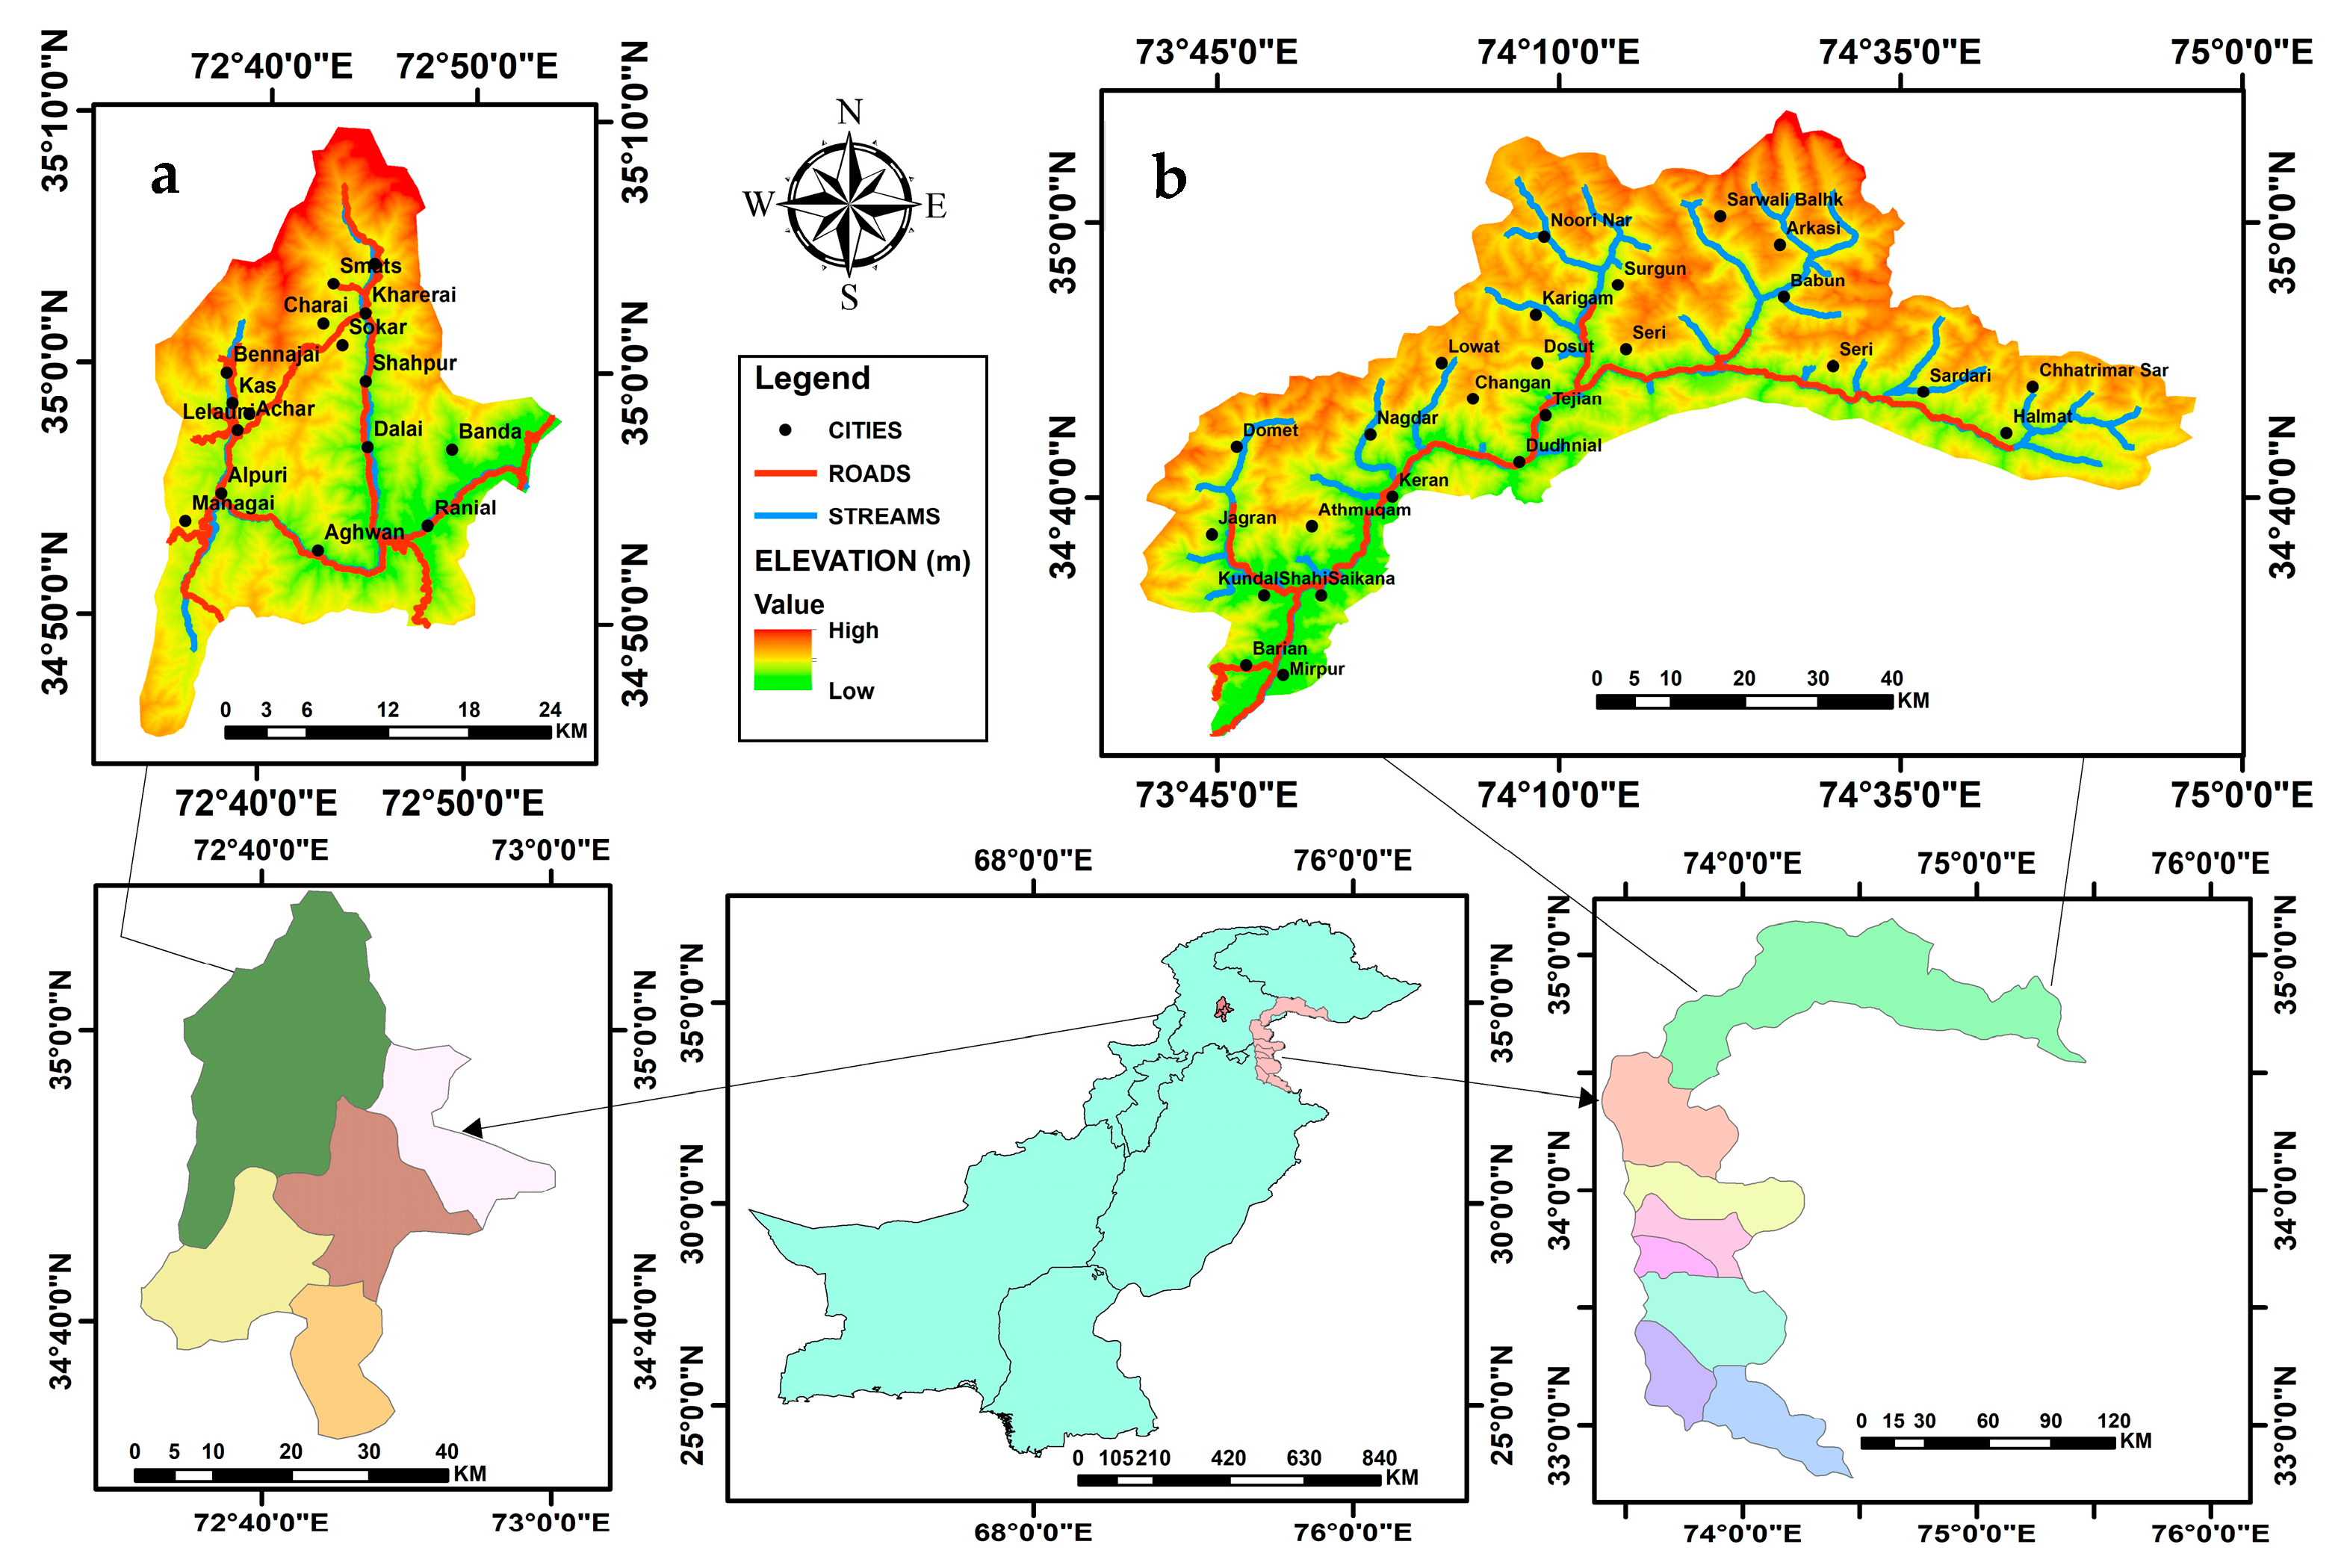
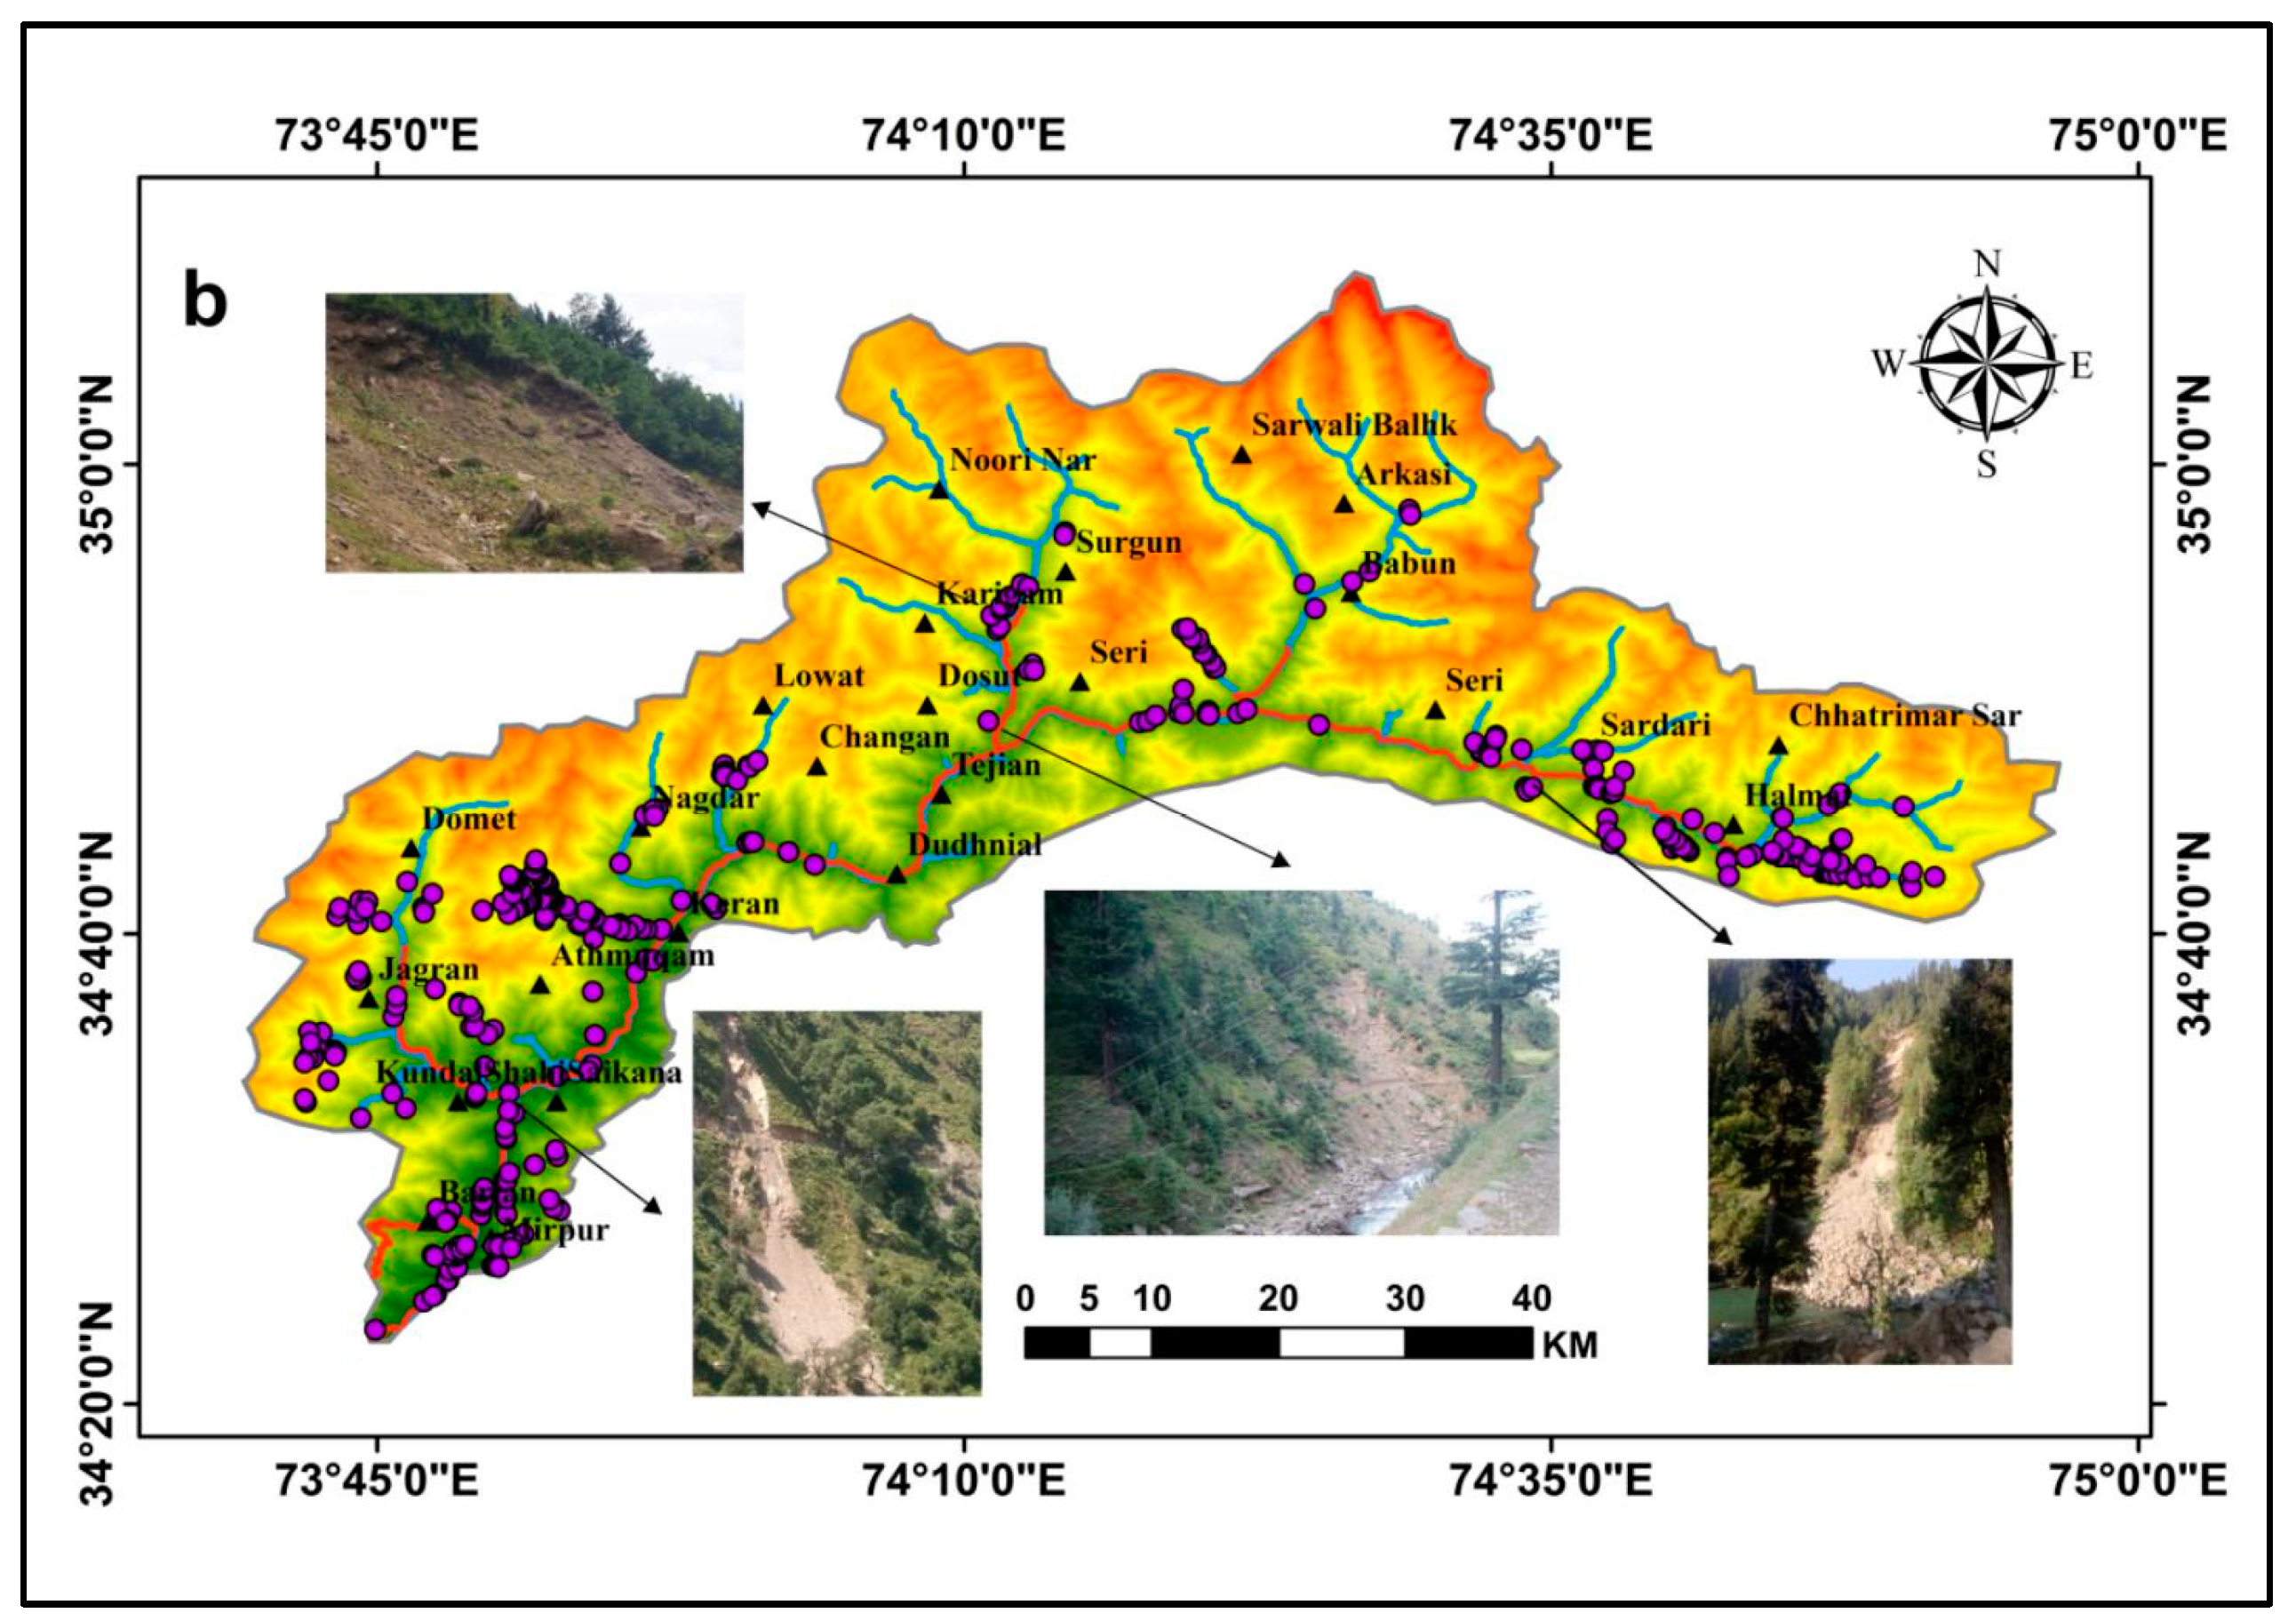
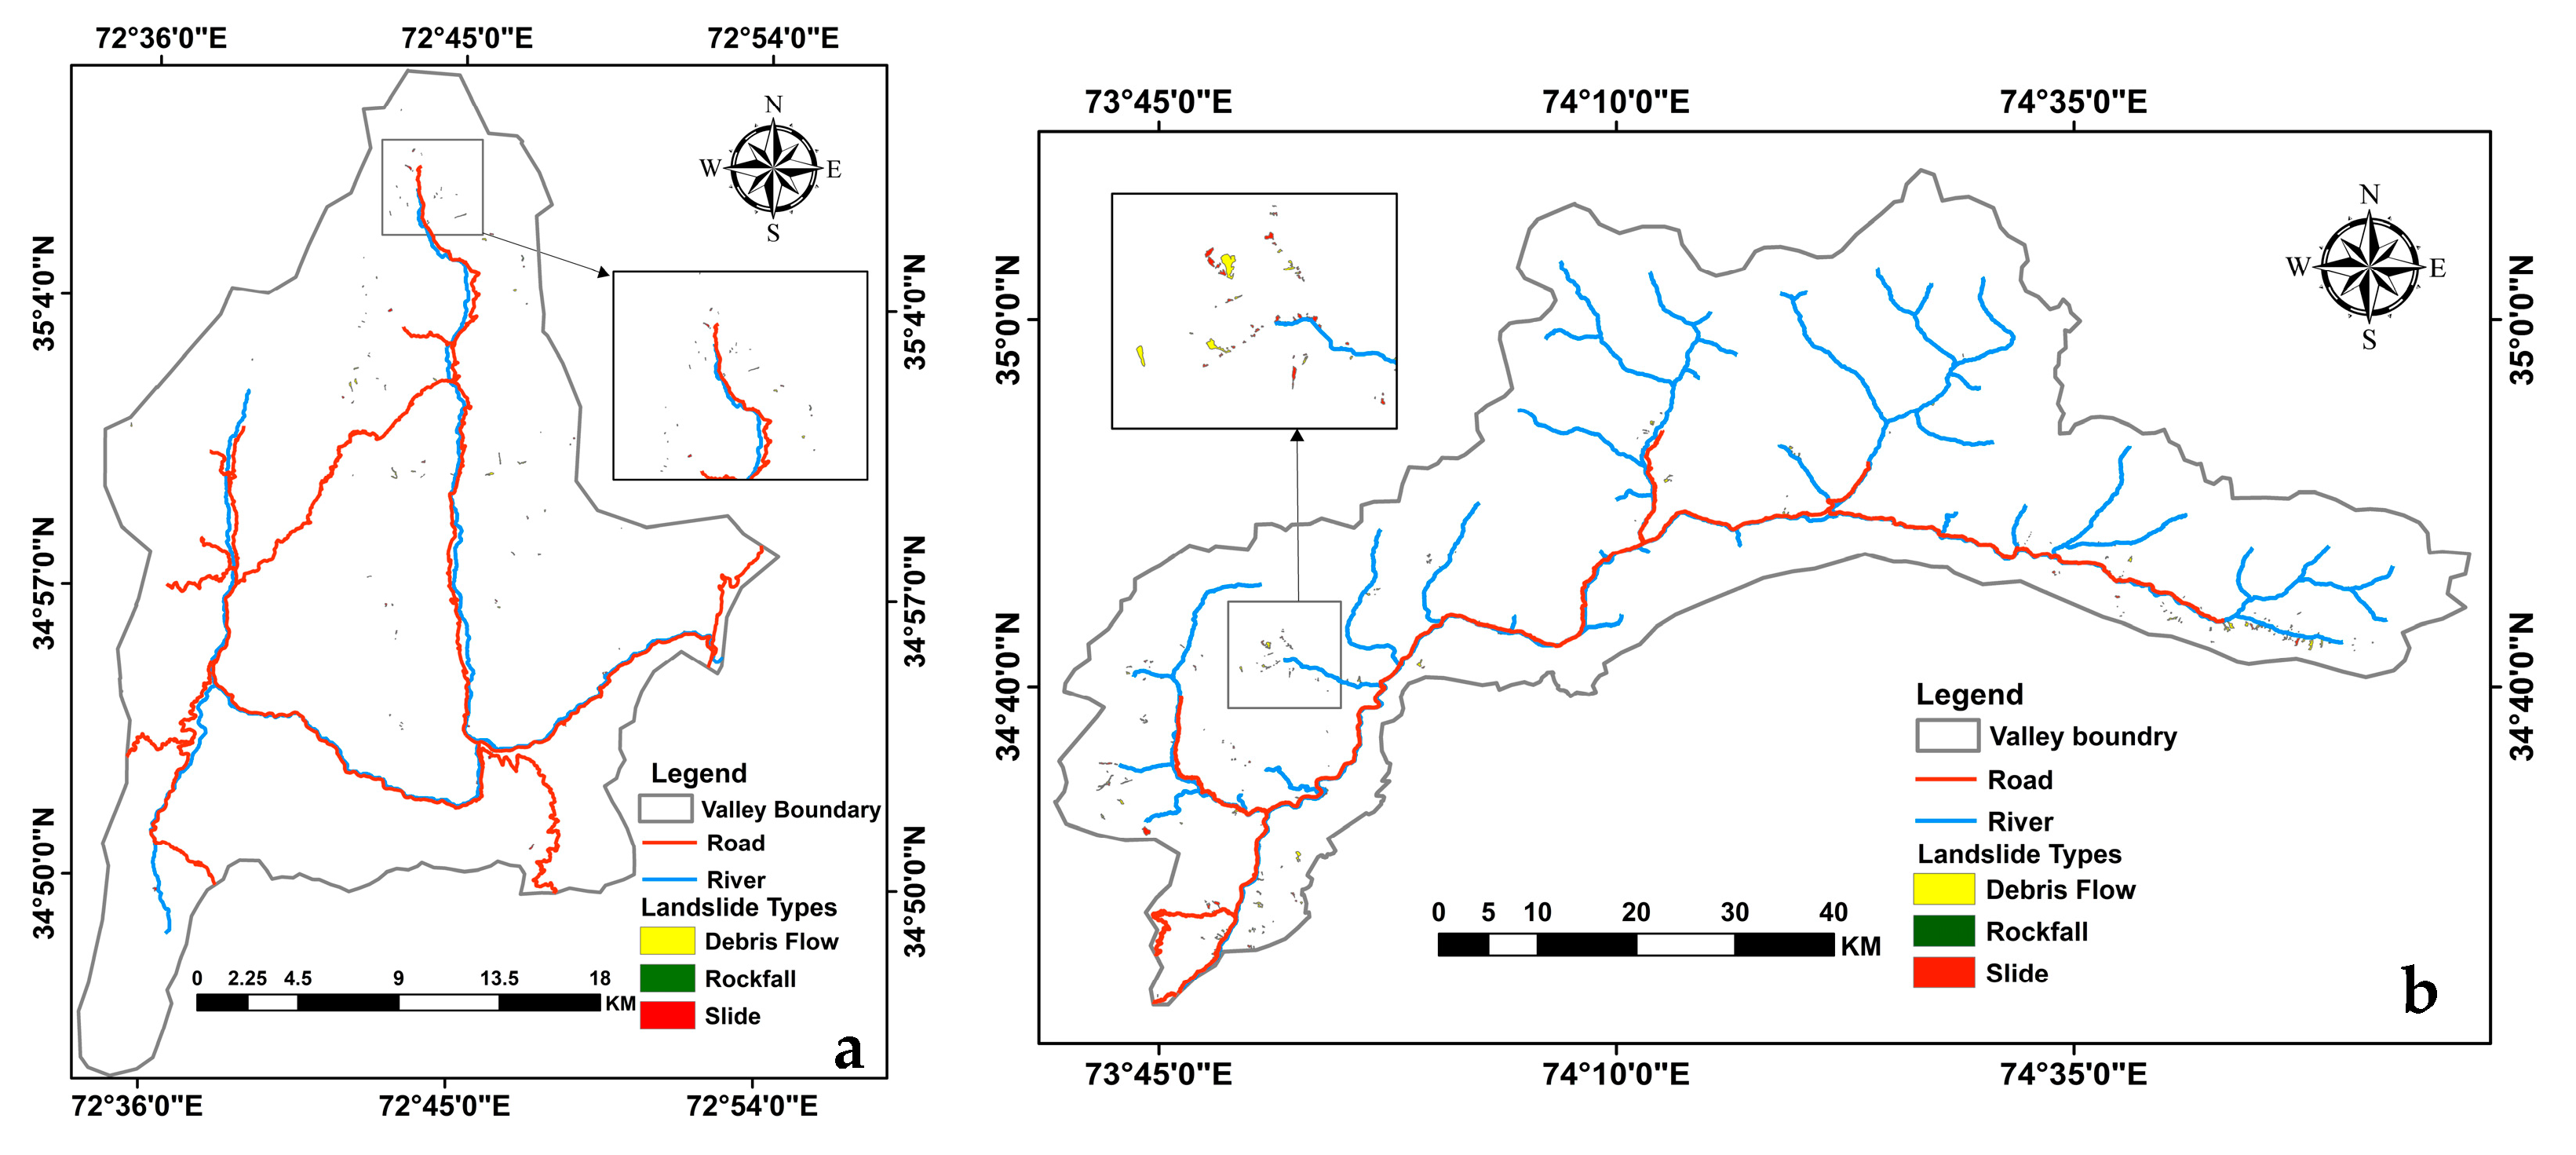
2. Study Area
3. Materials and Methods
3.1. Data Preparation
3.2. Geomorphological Factors
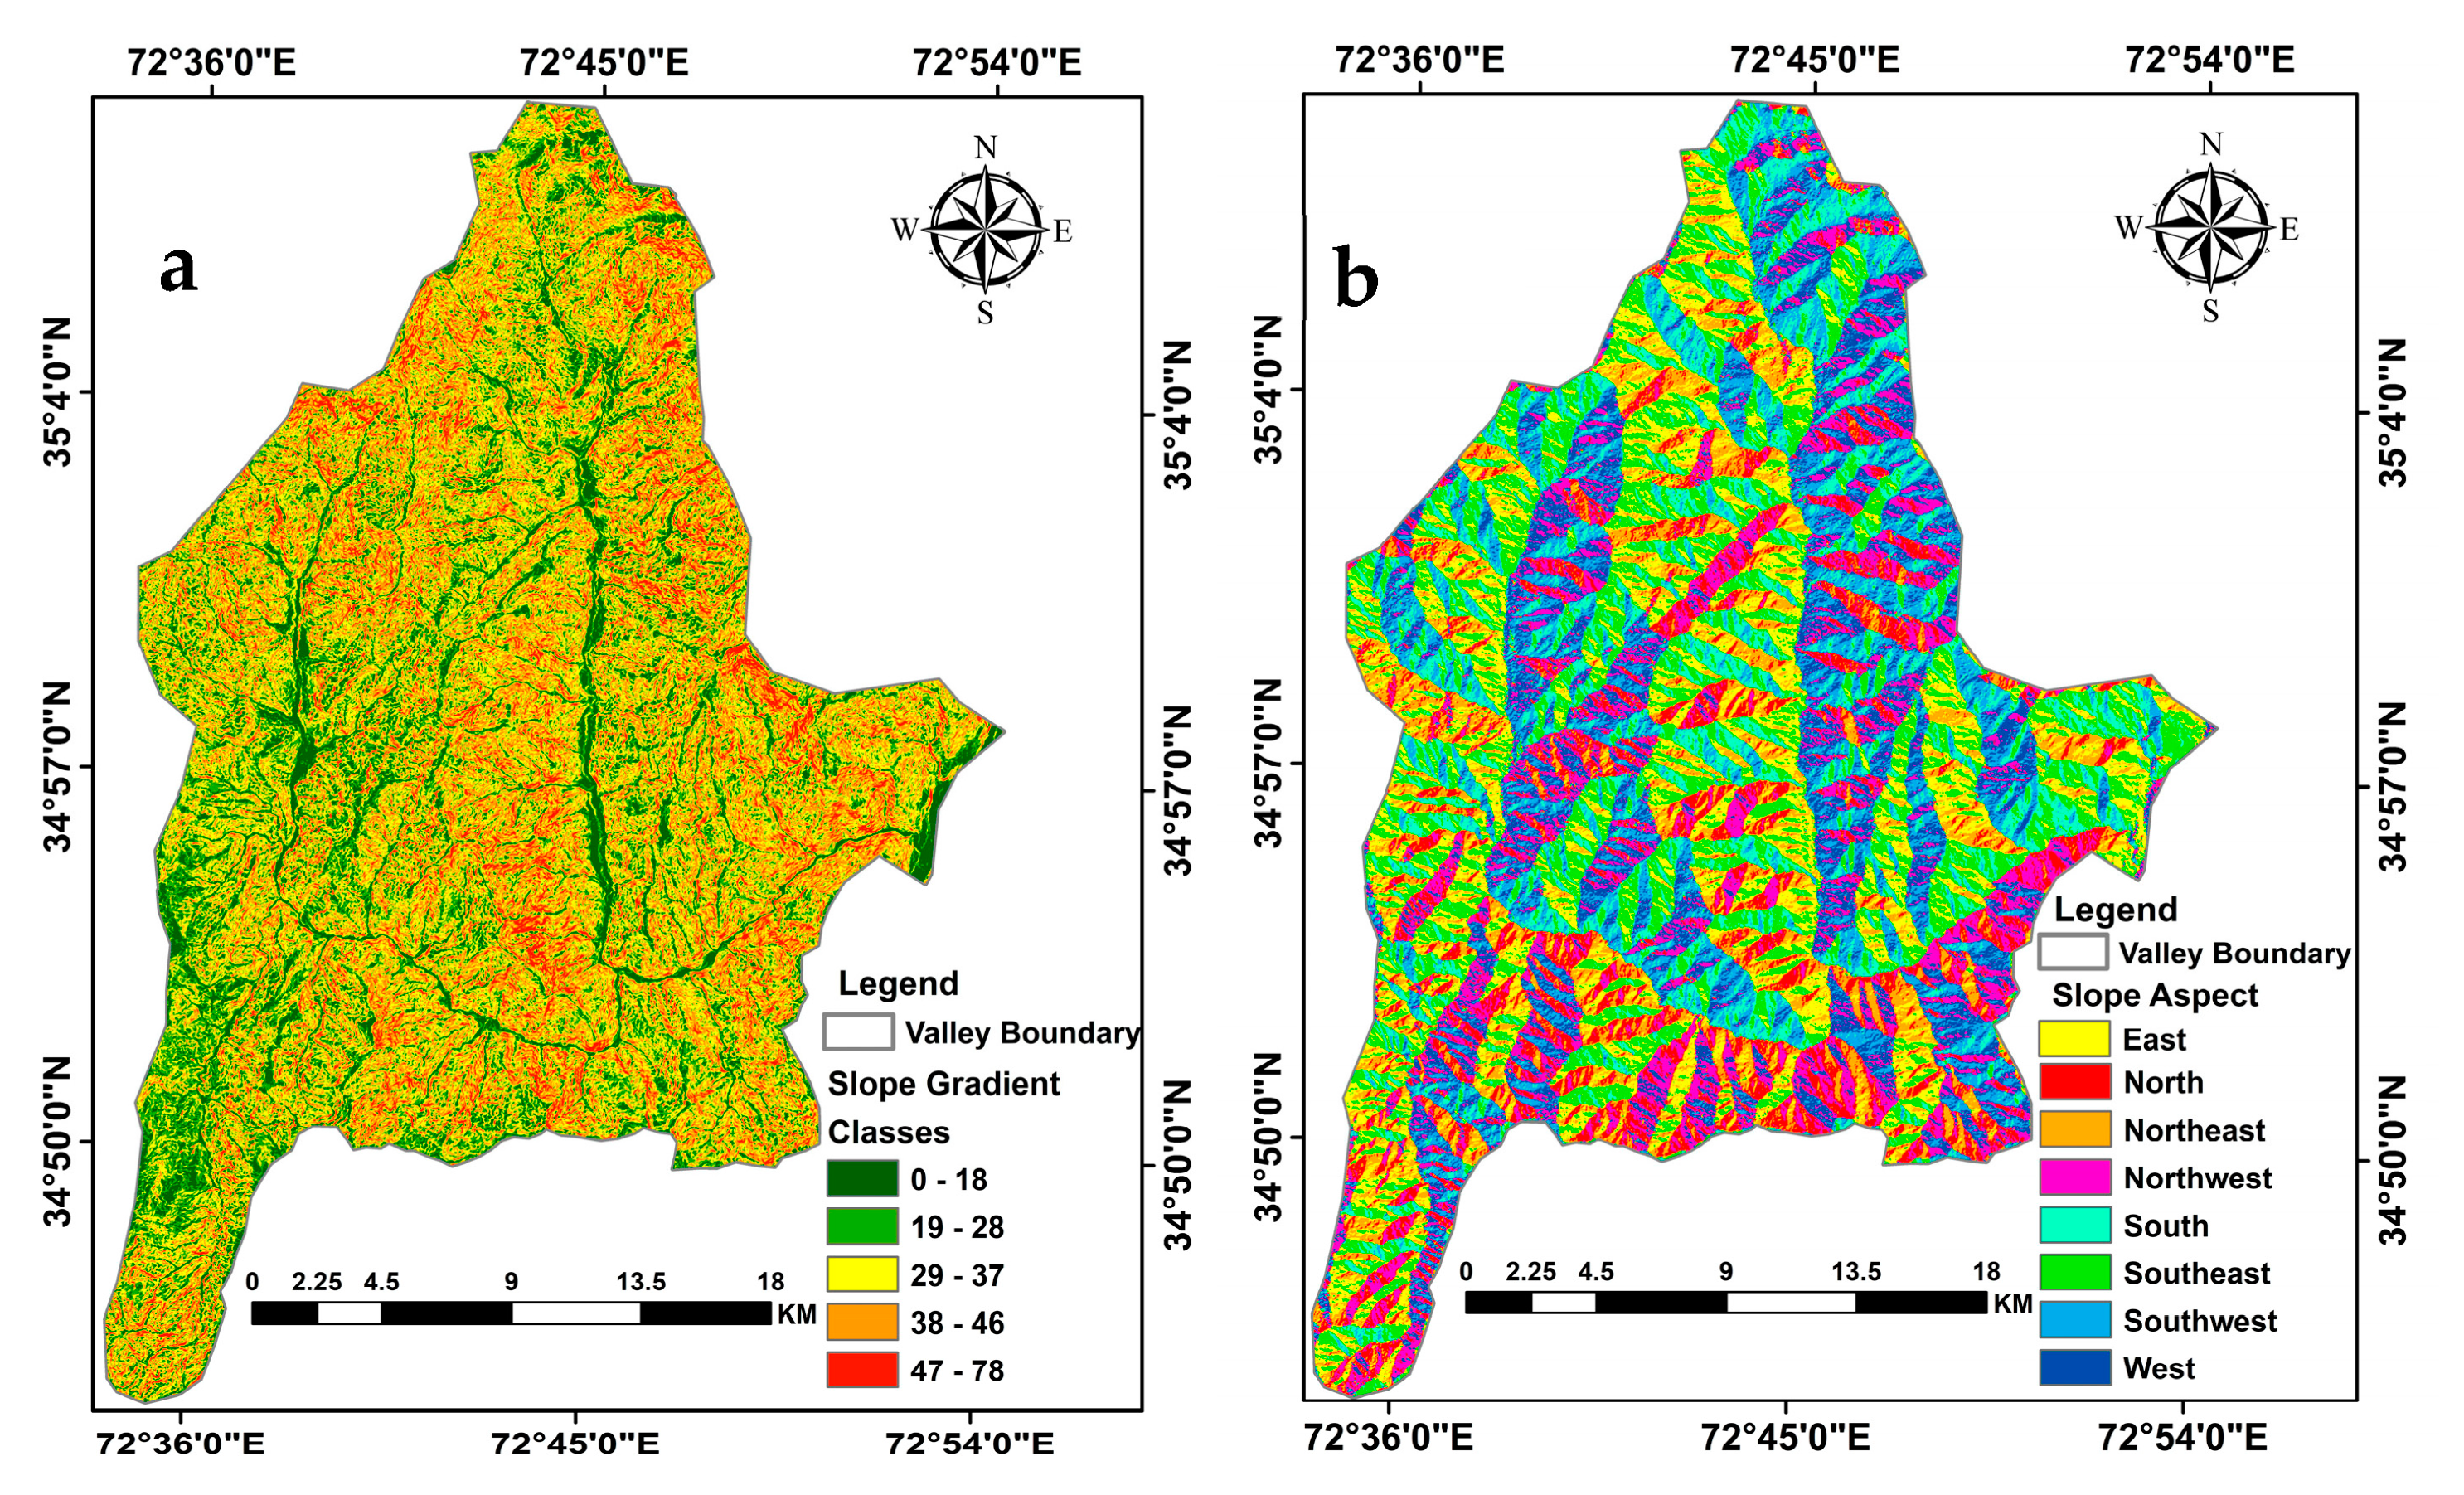
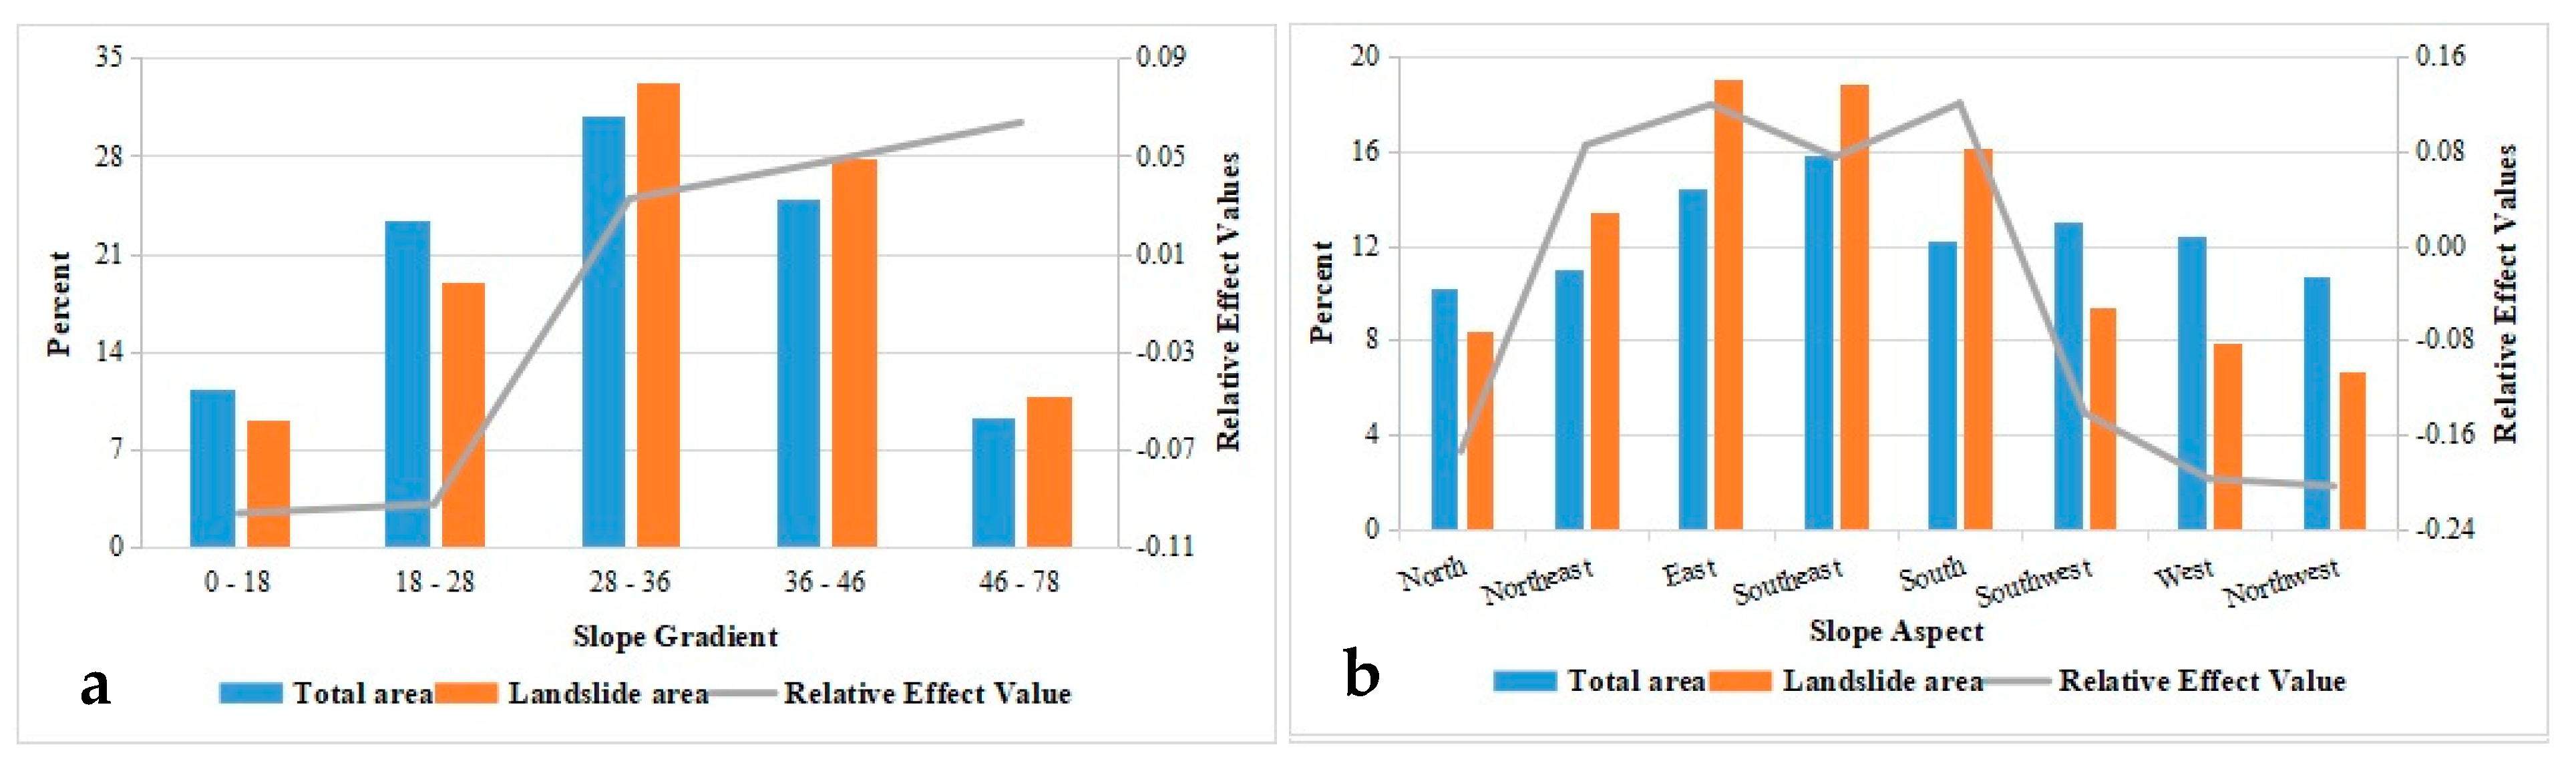
3.2.1. Slope Gradient
3.2.2. Slope Aspect
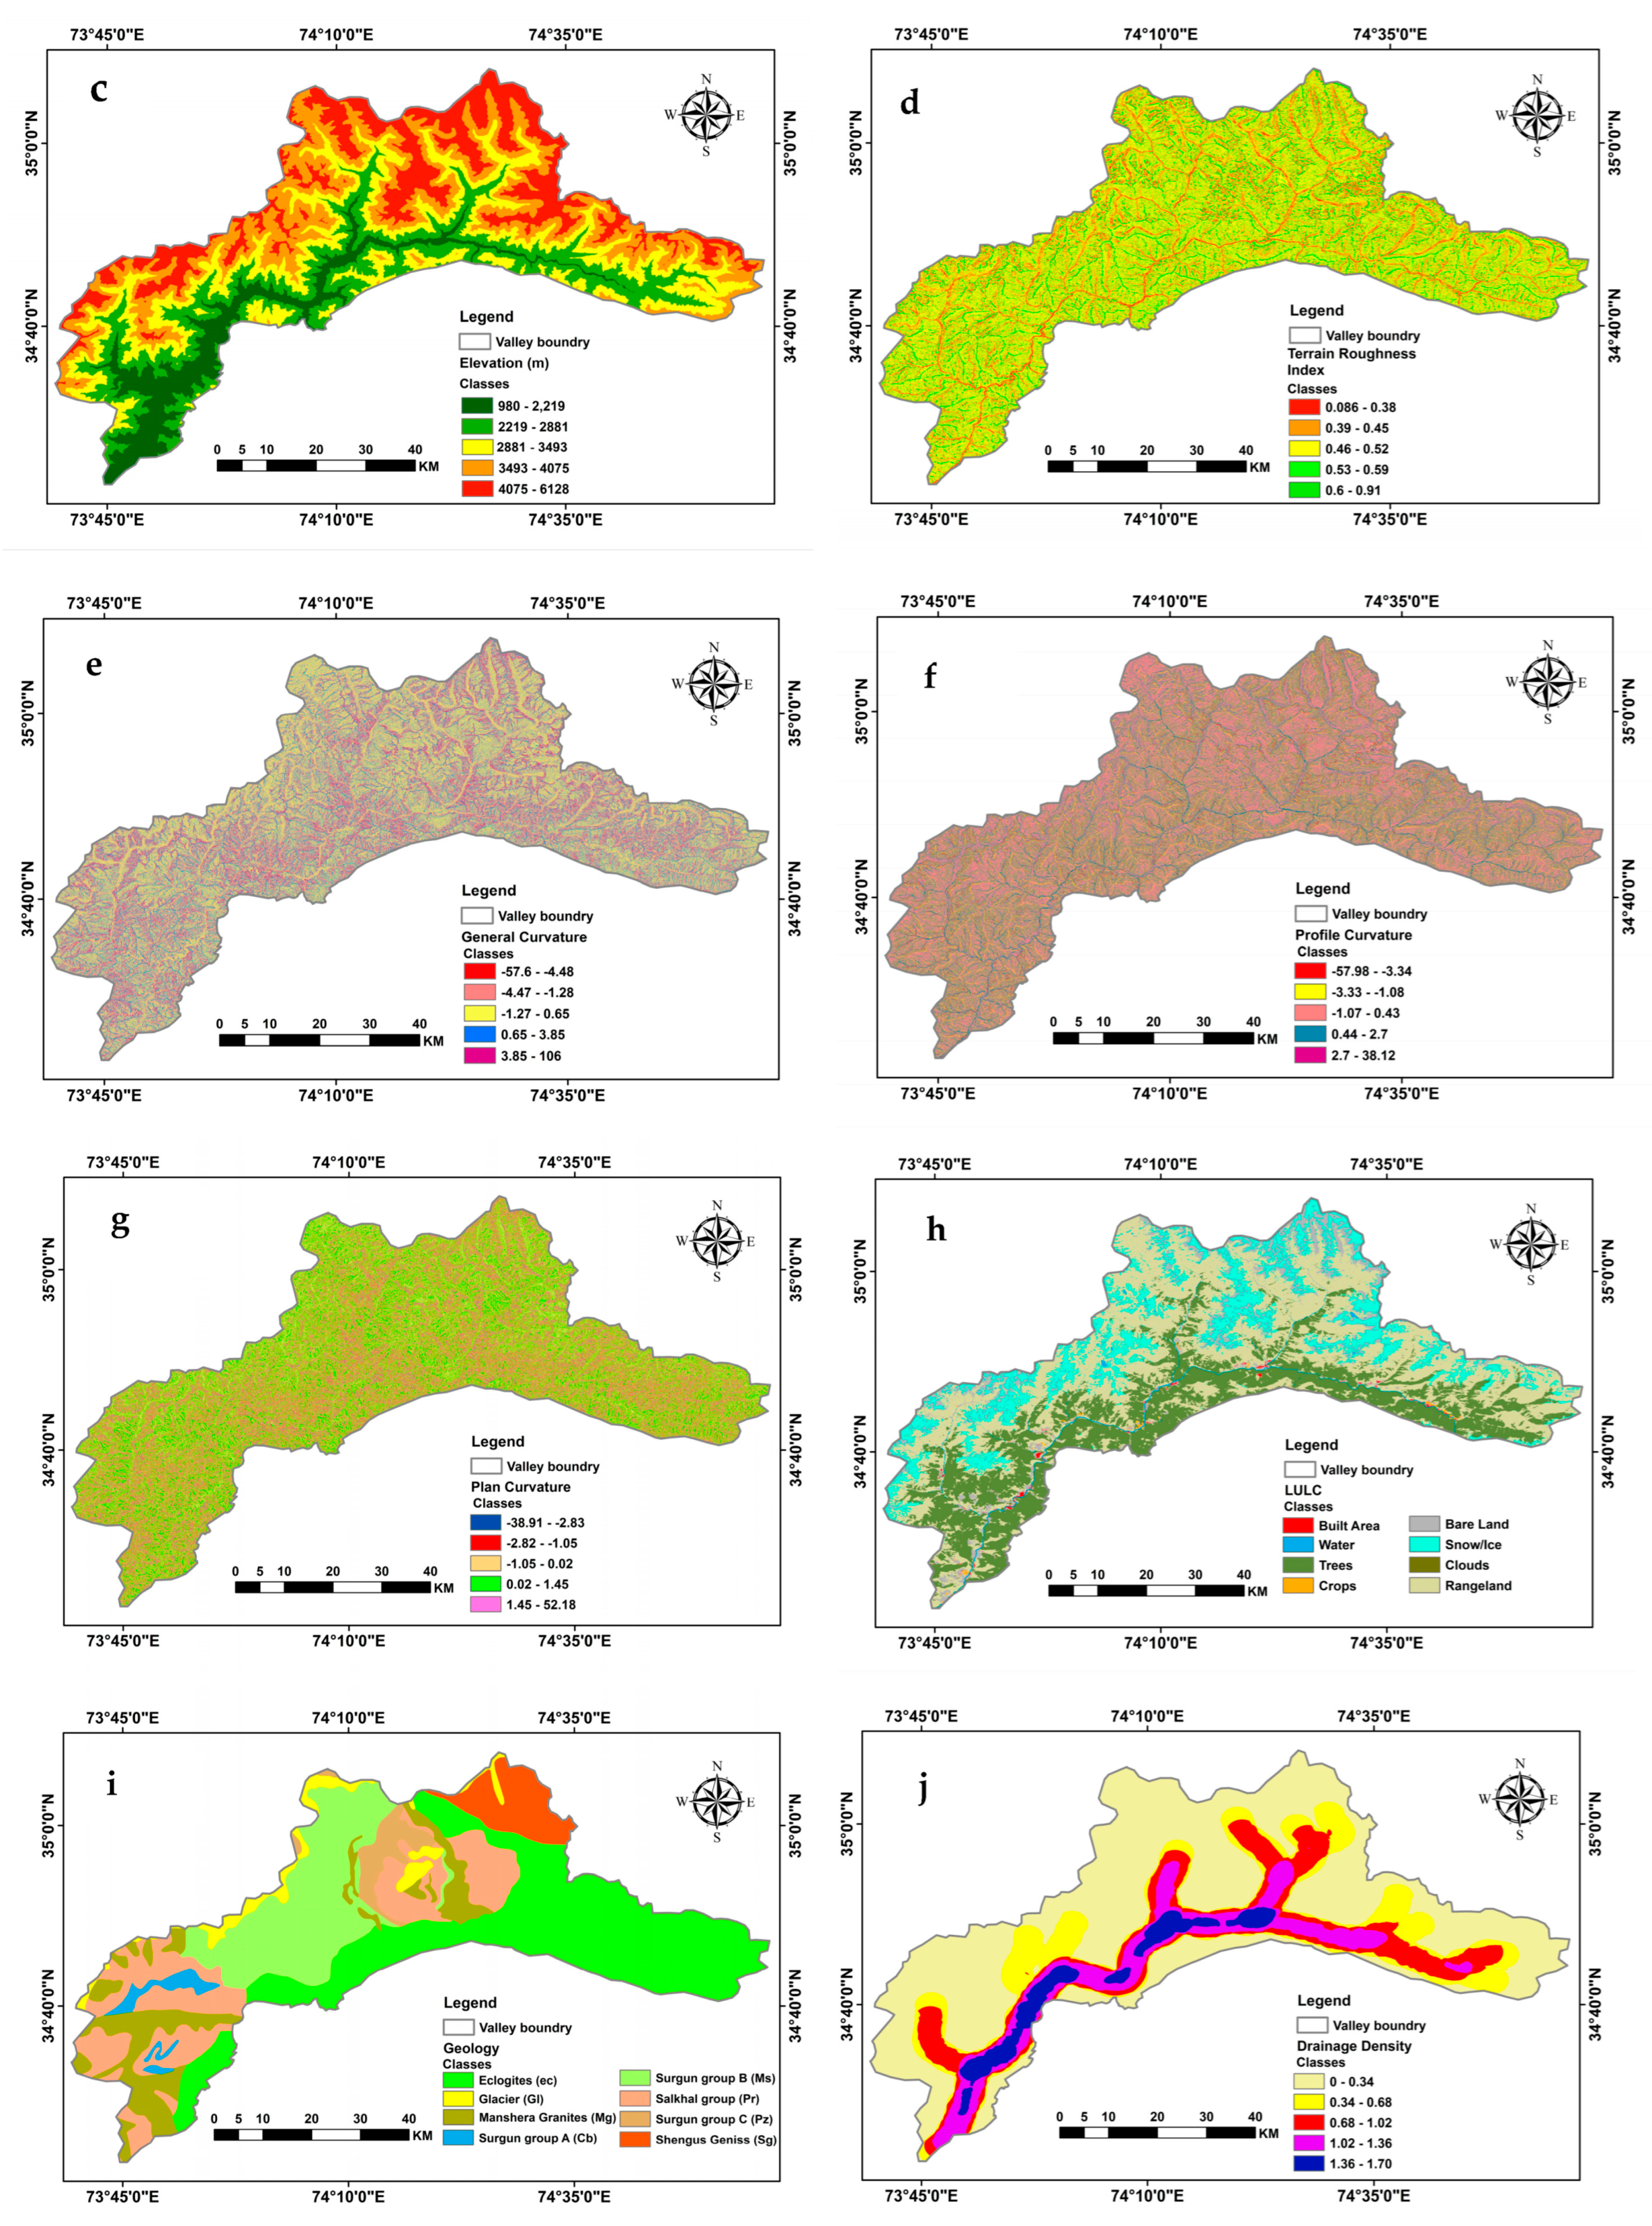
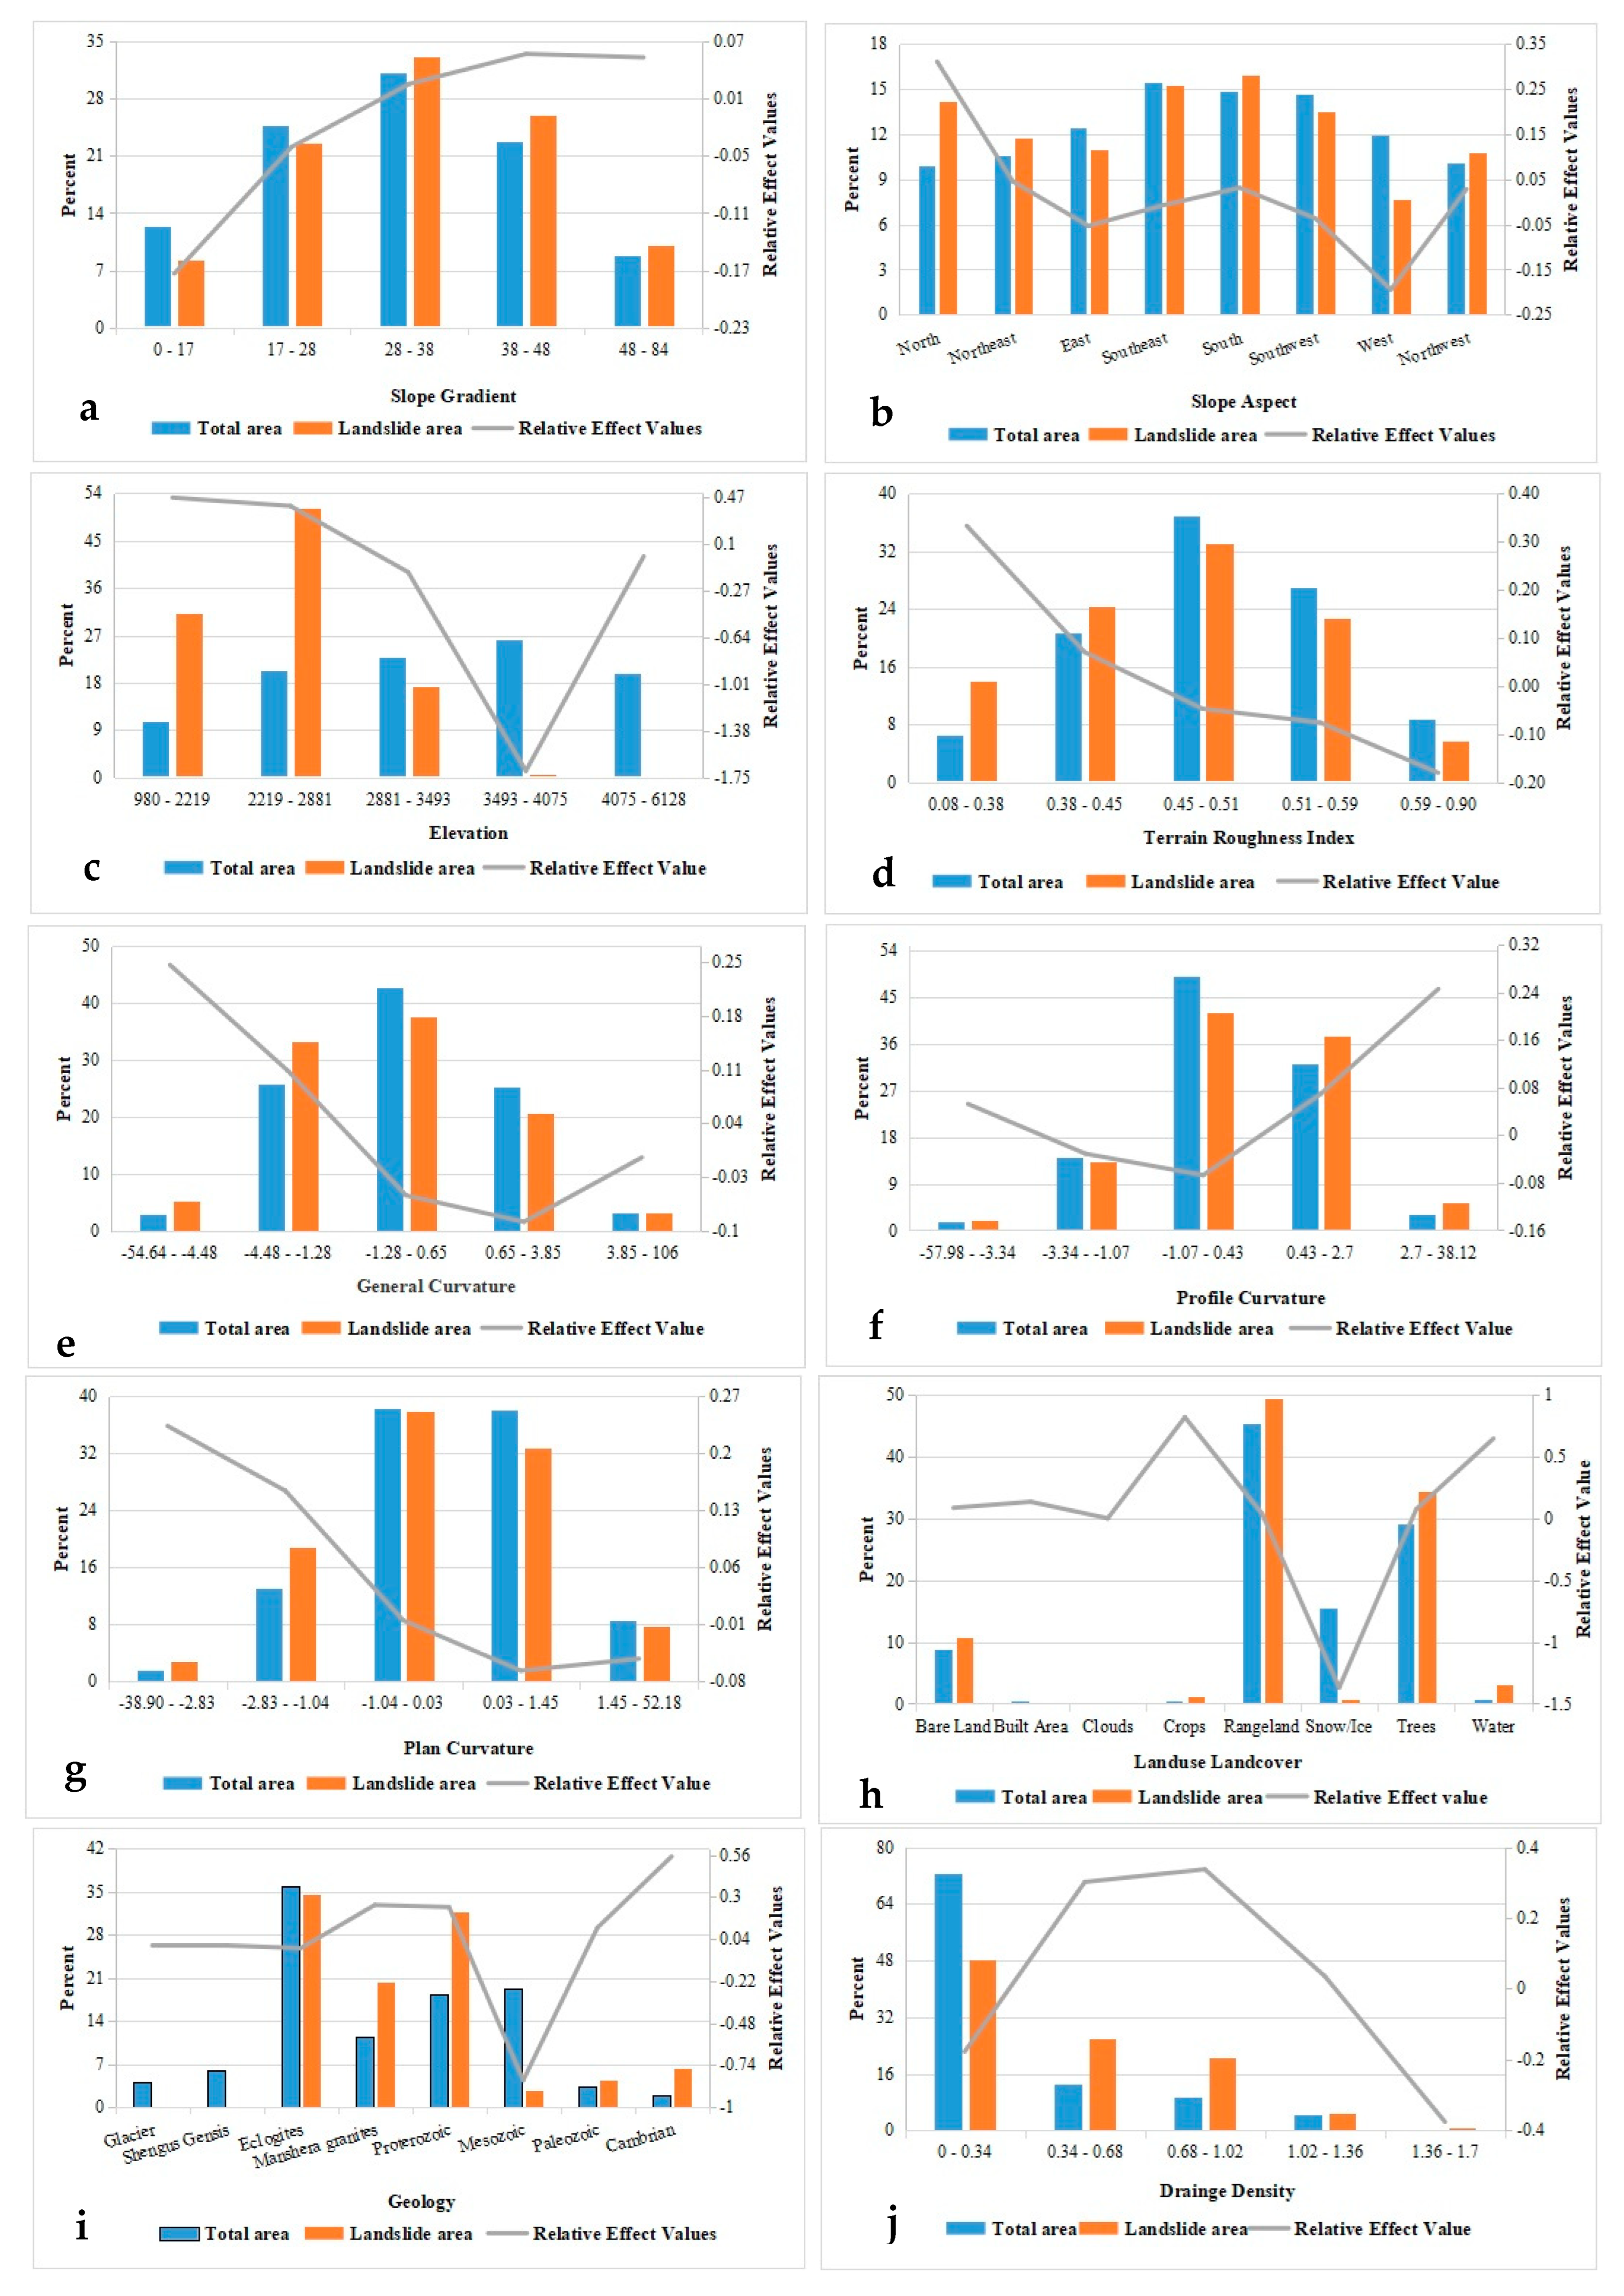
3.2.3. Elevation
3.2.4. Terrain Roughness Index (TRI)
3.2.5. General Curvature
3.2.6. Profile Curvature
3.2.7. Plan Curvature
3.2.8. Land-Use Land-Cover (LULC)
3.3. Geological Factor (Surface Geology)
3.4. Hydrological Factors
3.4.1. Drainage Density
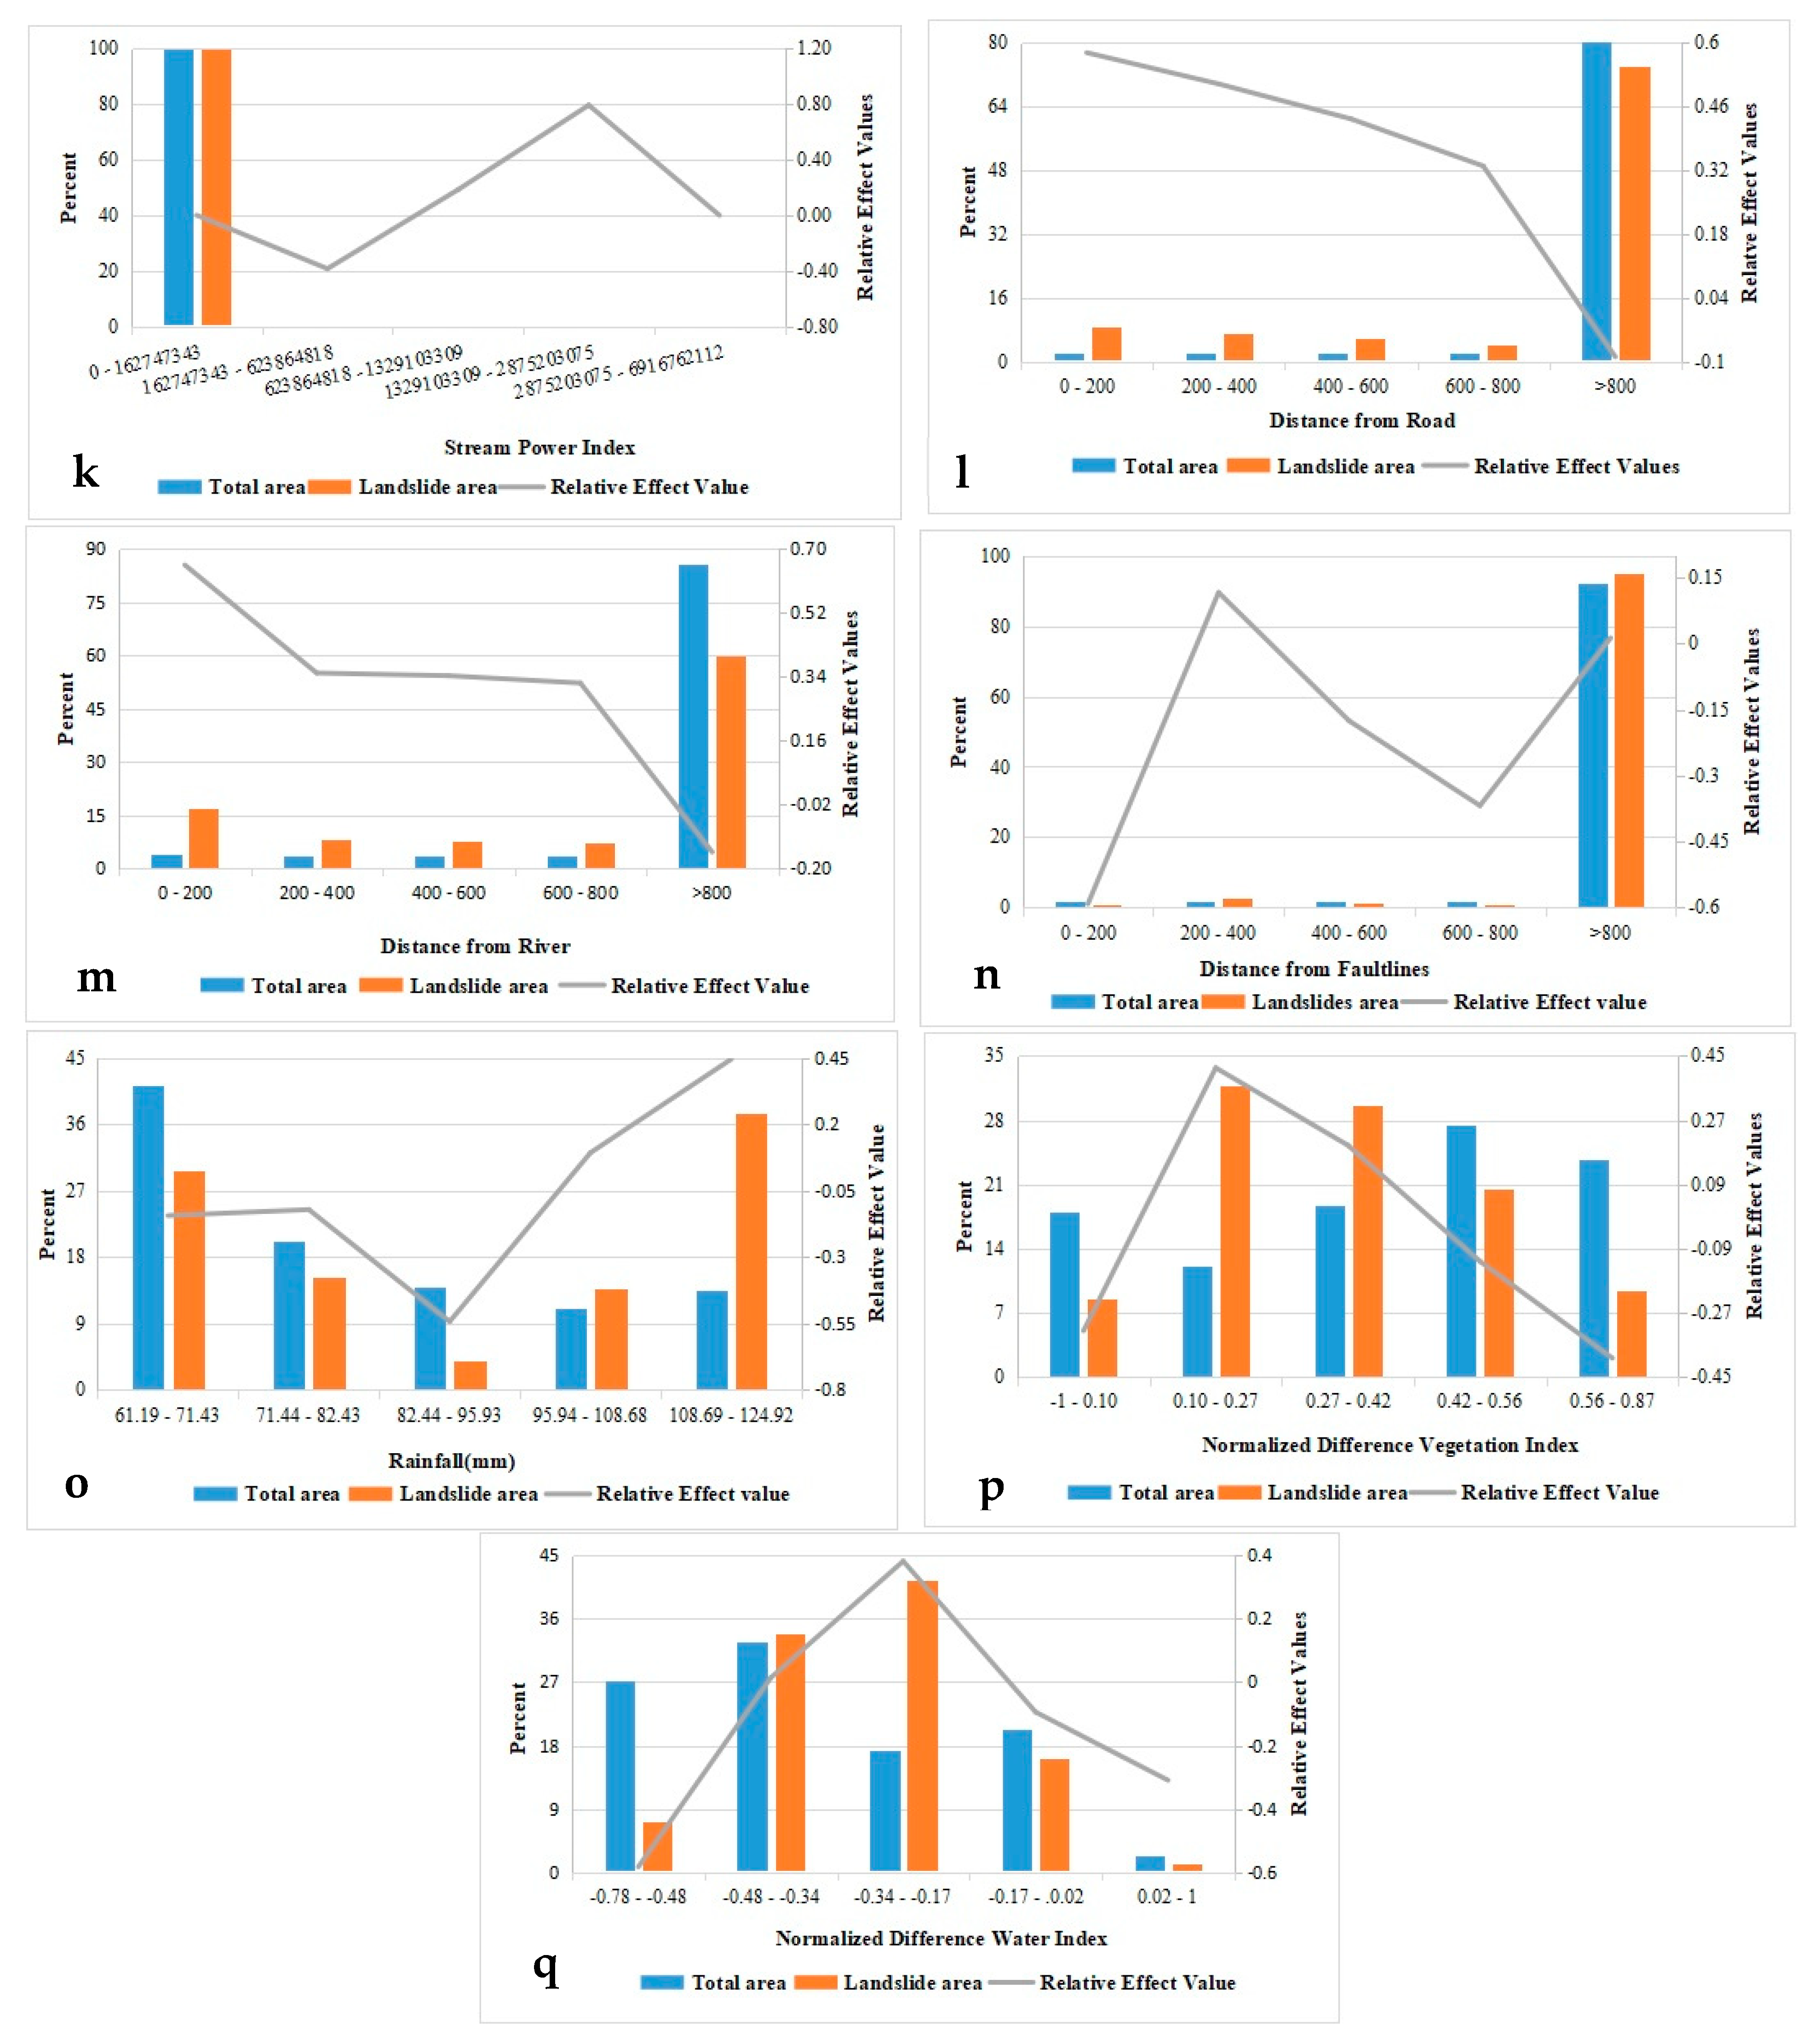
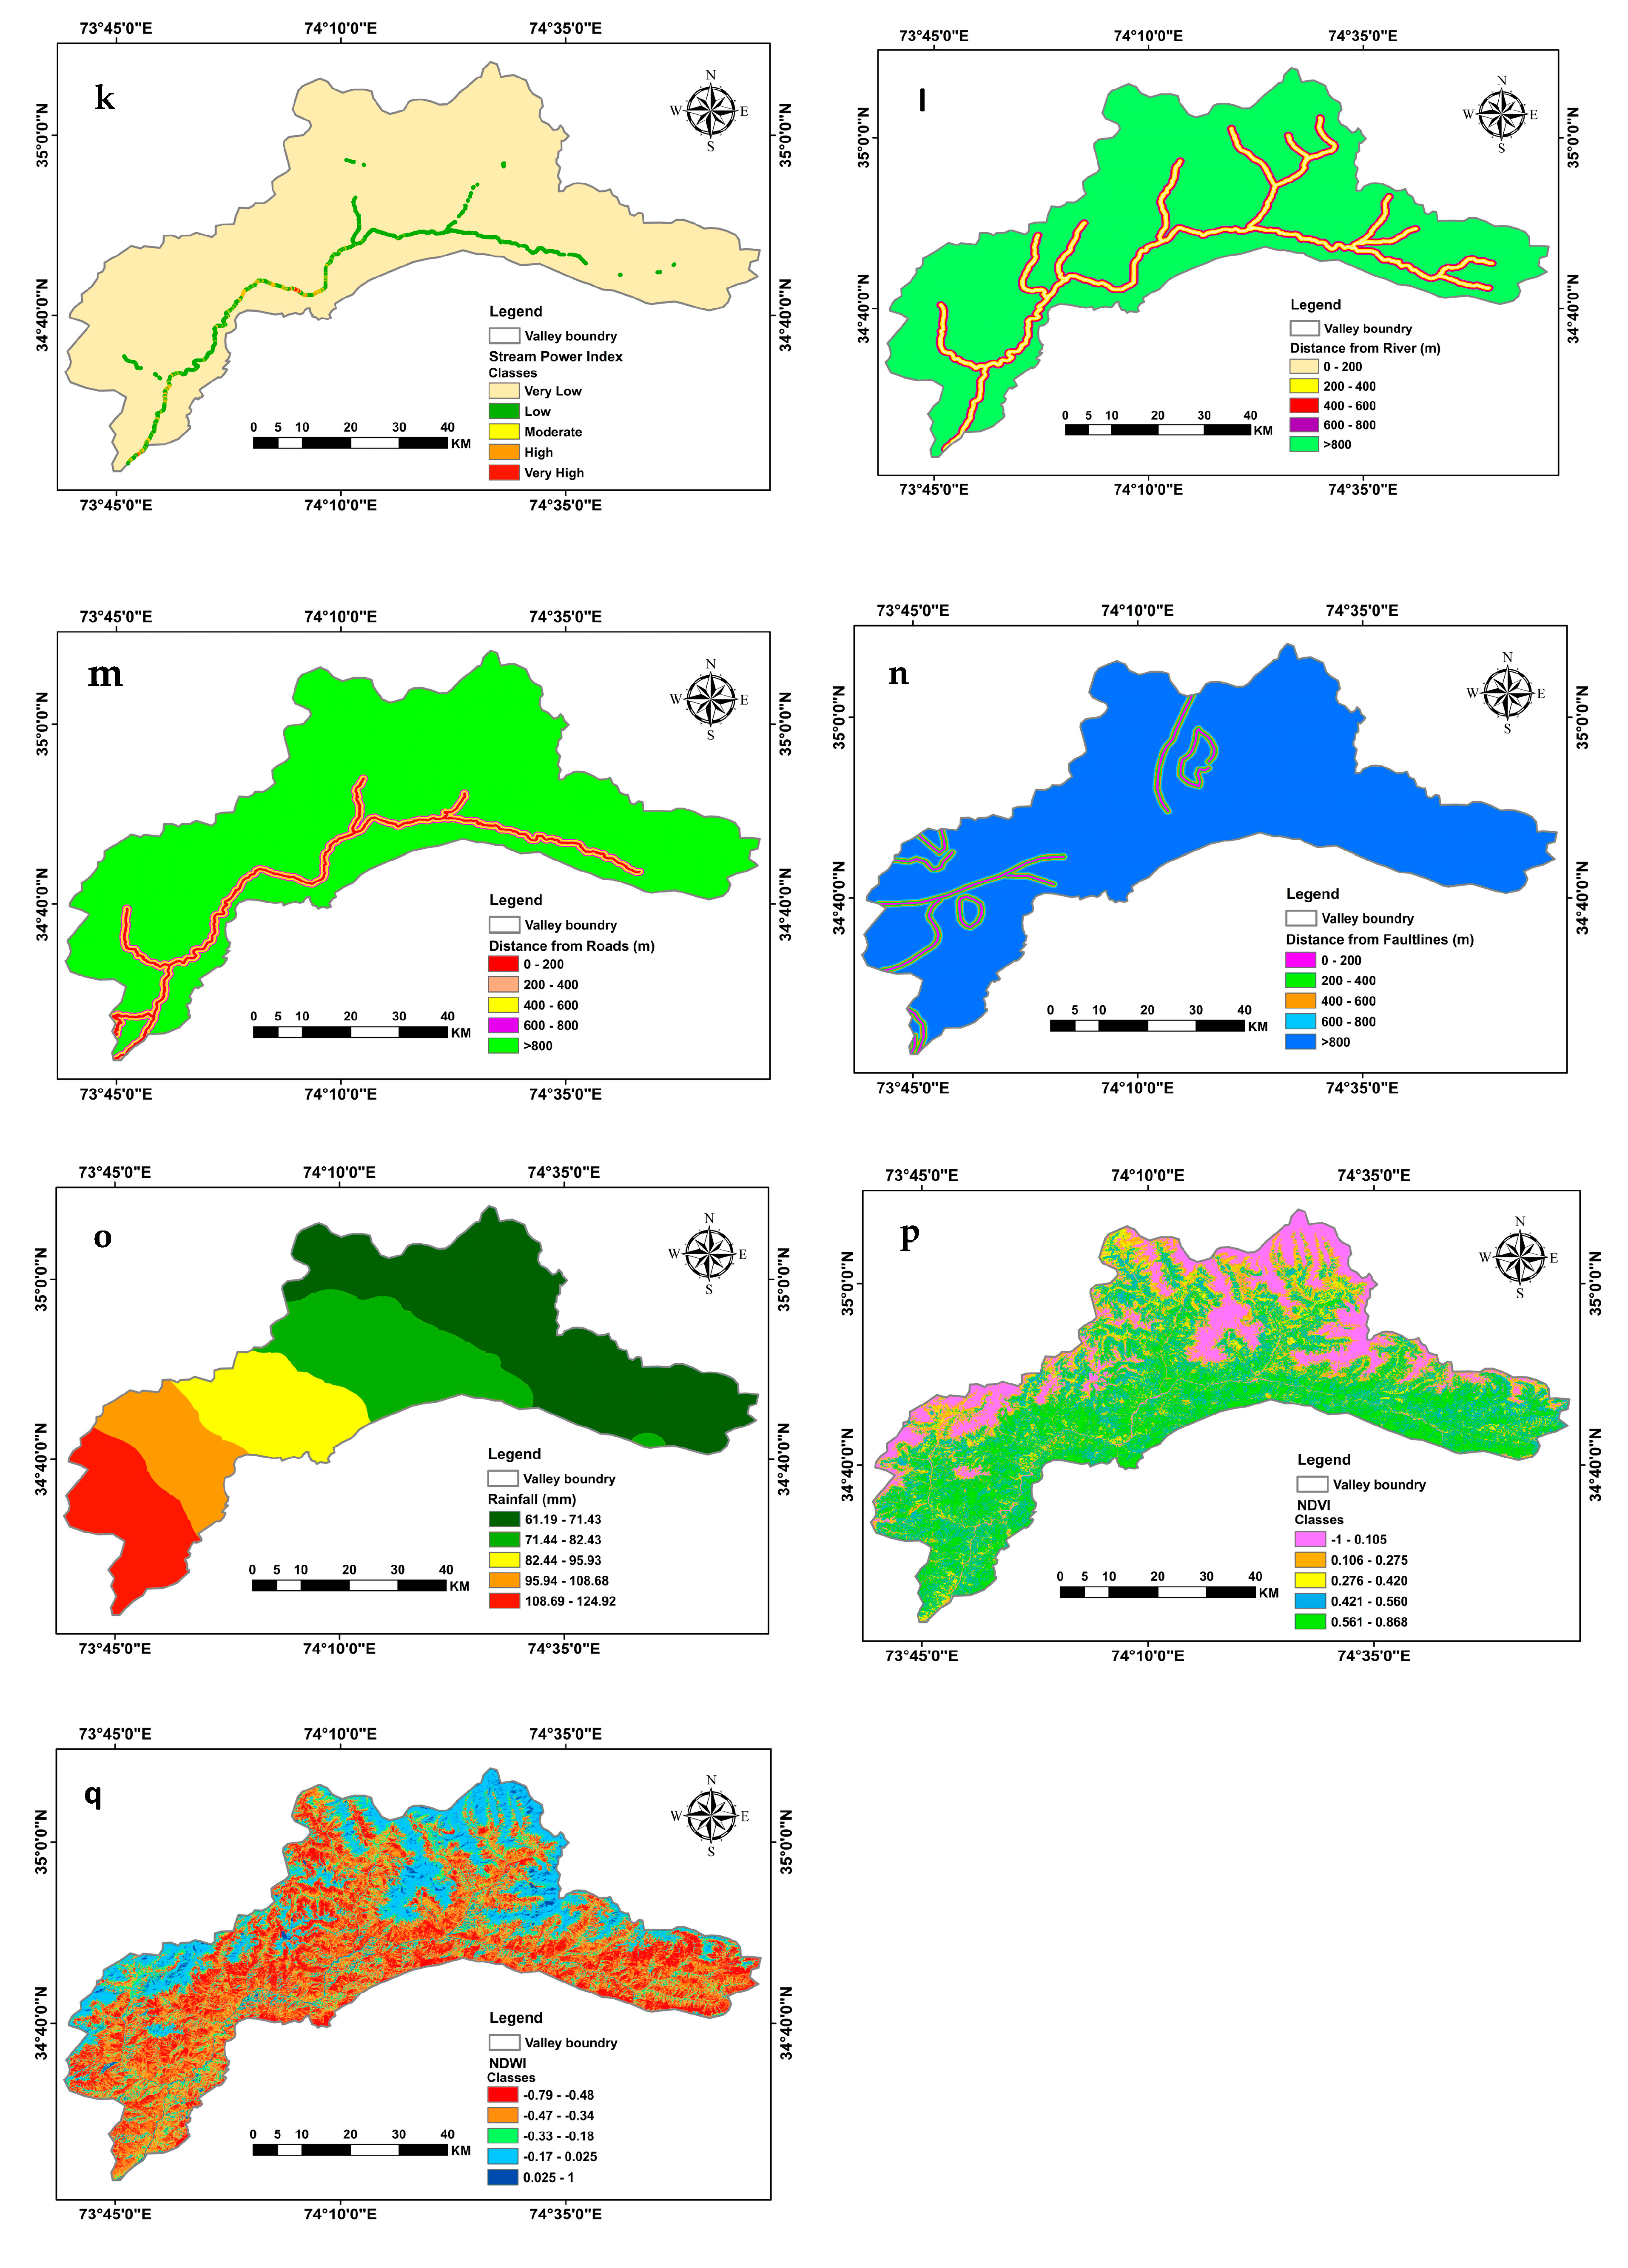
3.4.2. Stream Power Index (SPI)
3.5. Proximity Factors
3.5.1. Distance from Roads
3.5.2. Distance from River
3.5.3. Distance from Fault Line
3.6. Triggering Factor (Rainfall Data)
3.7. Other Factors
3.7.1. Normalize Difference Vegetation Index (NDVI)
3.7.2. Normalize Difference Water Index (NDWI)
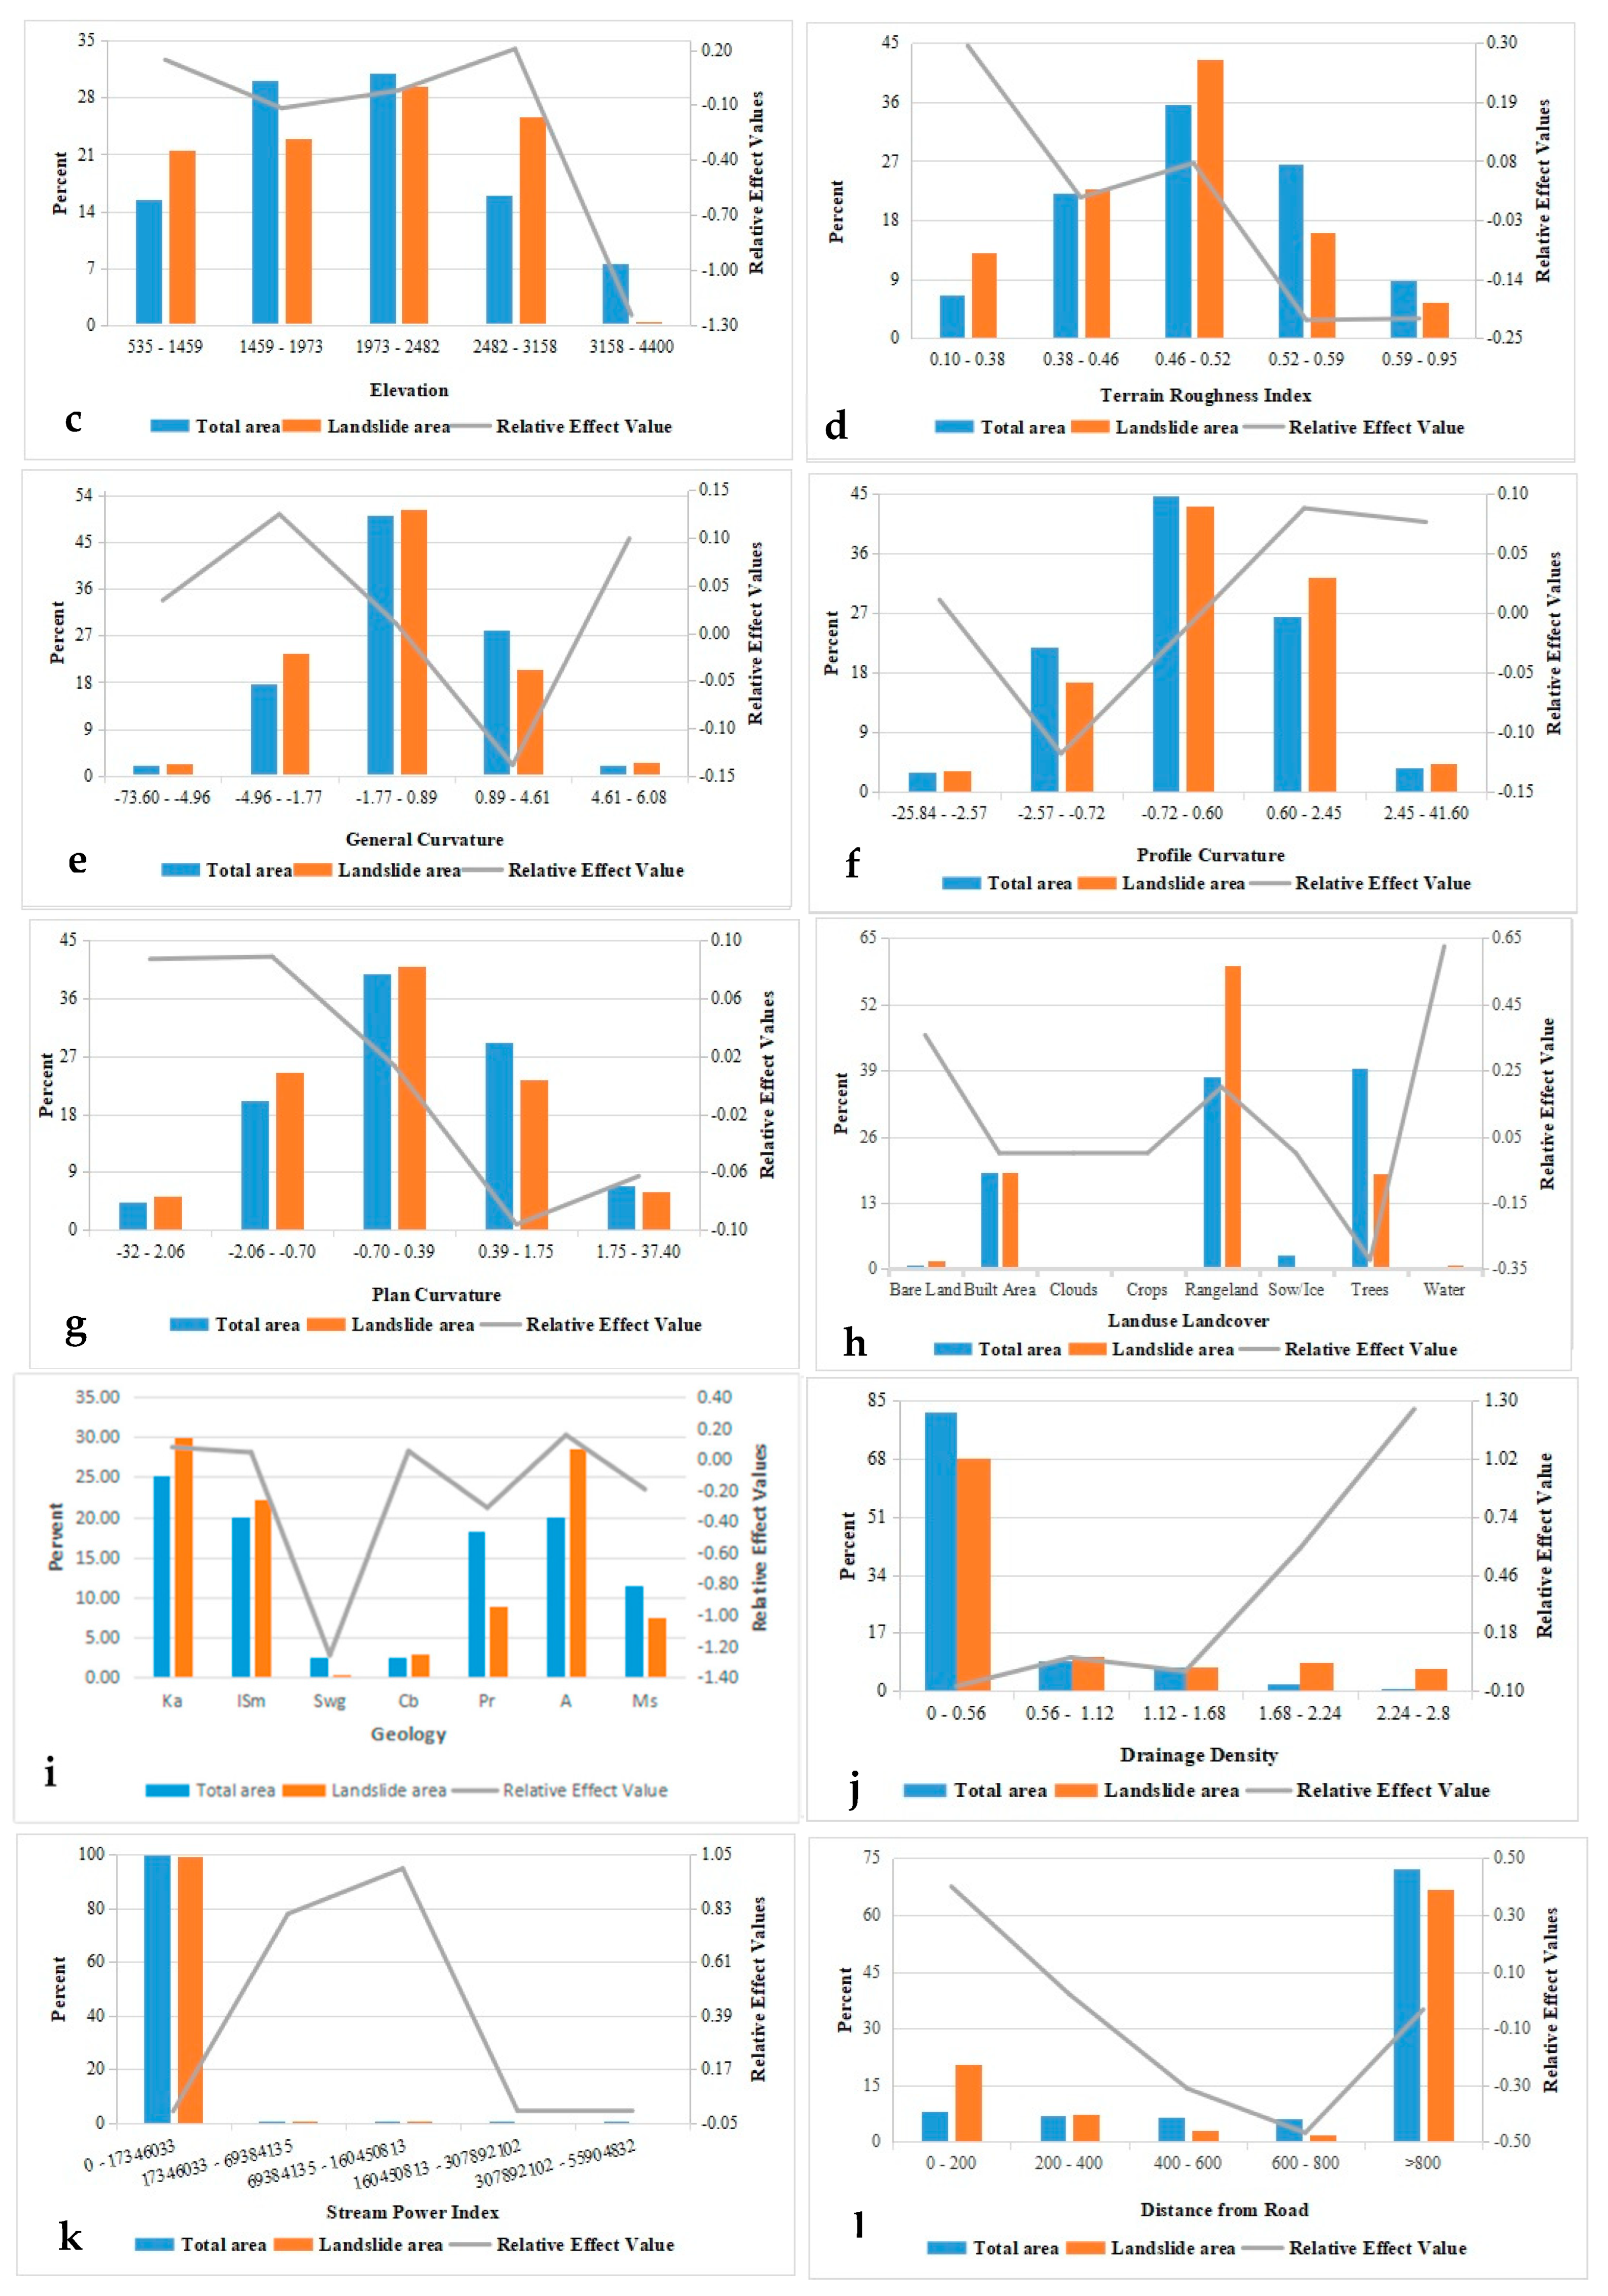
3.8. Application of Relative Effect Method
4. Results
4.1. Landslide Inventory
4.2. Modelling Results of Relative Effect Model
4.3. Relationship of Landslides Occurrence with Causative Factors
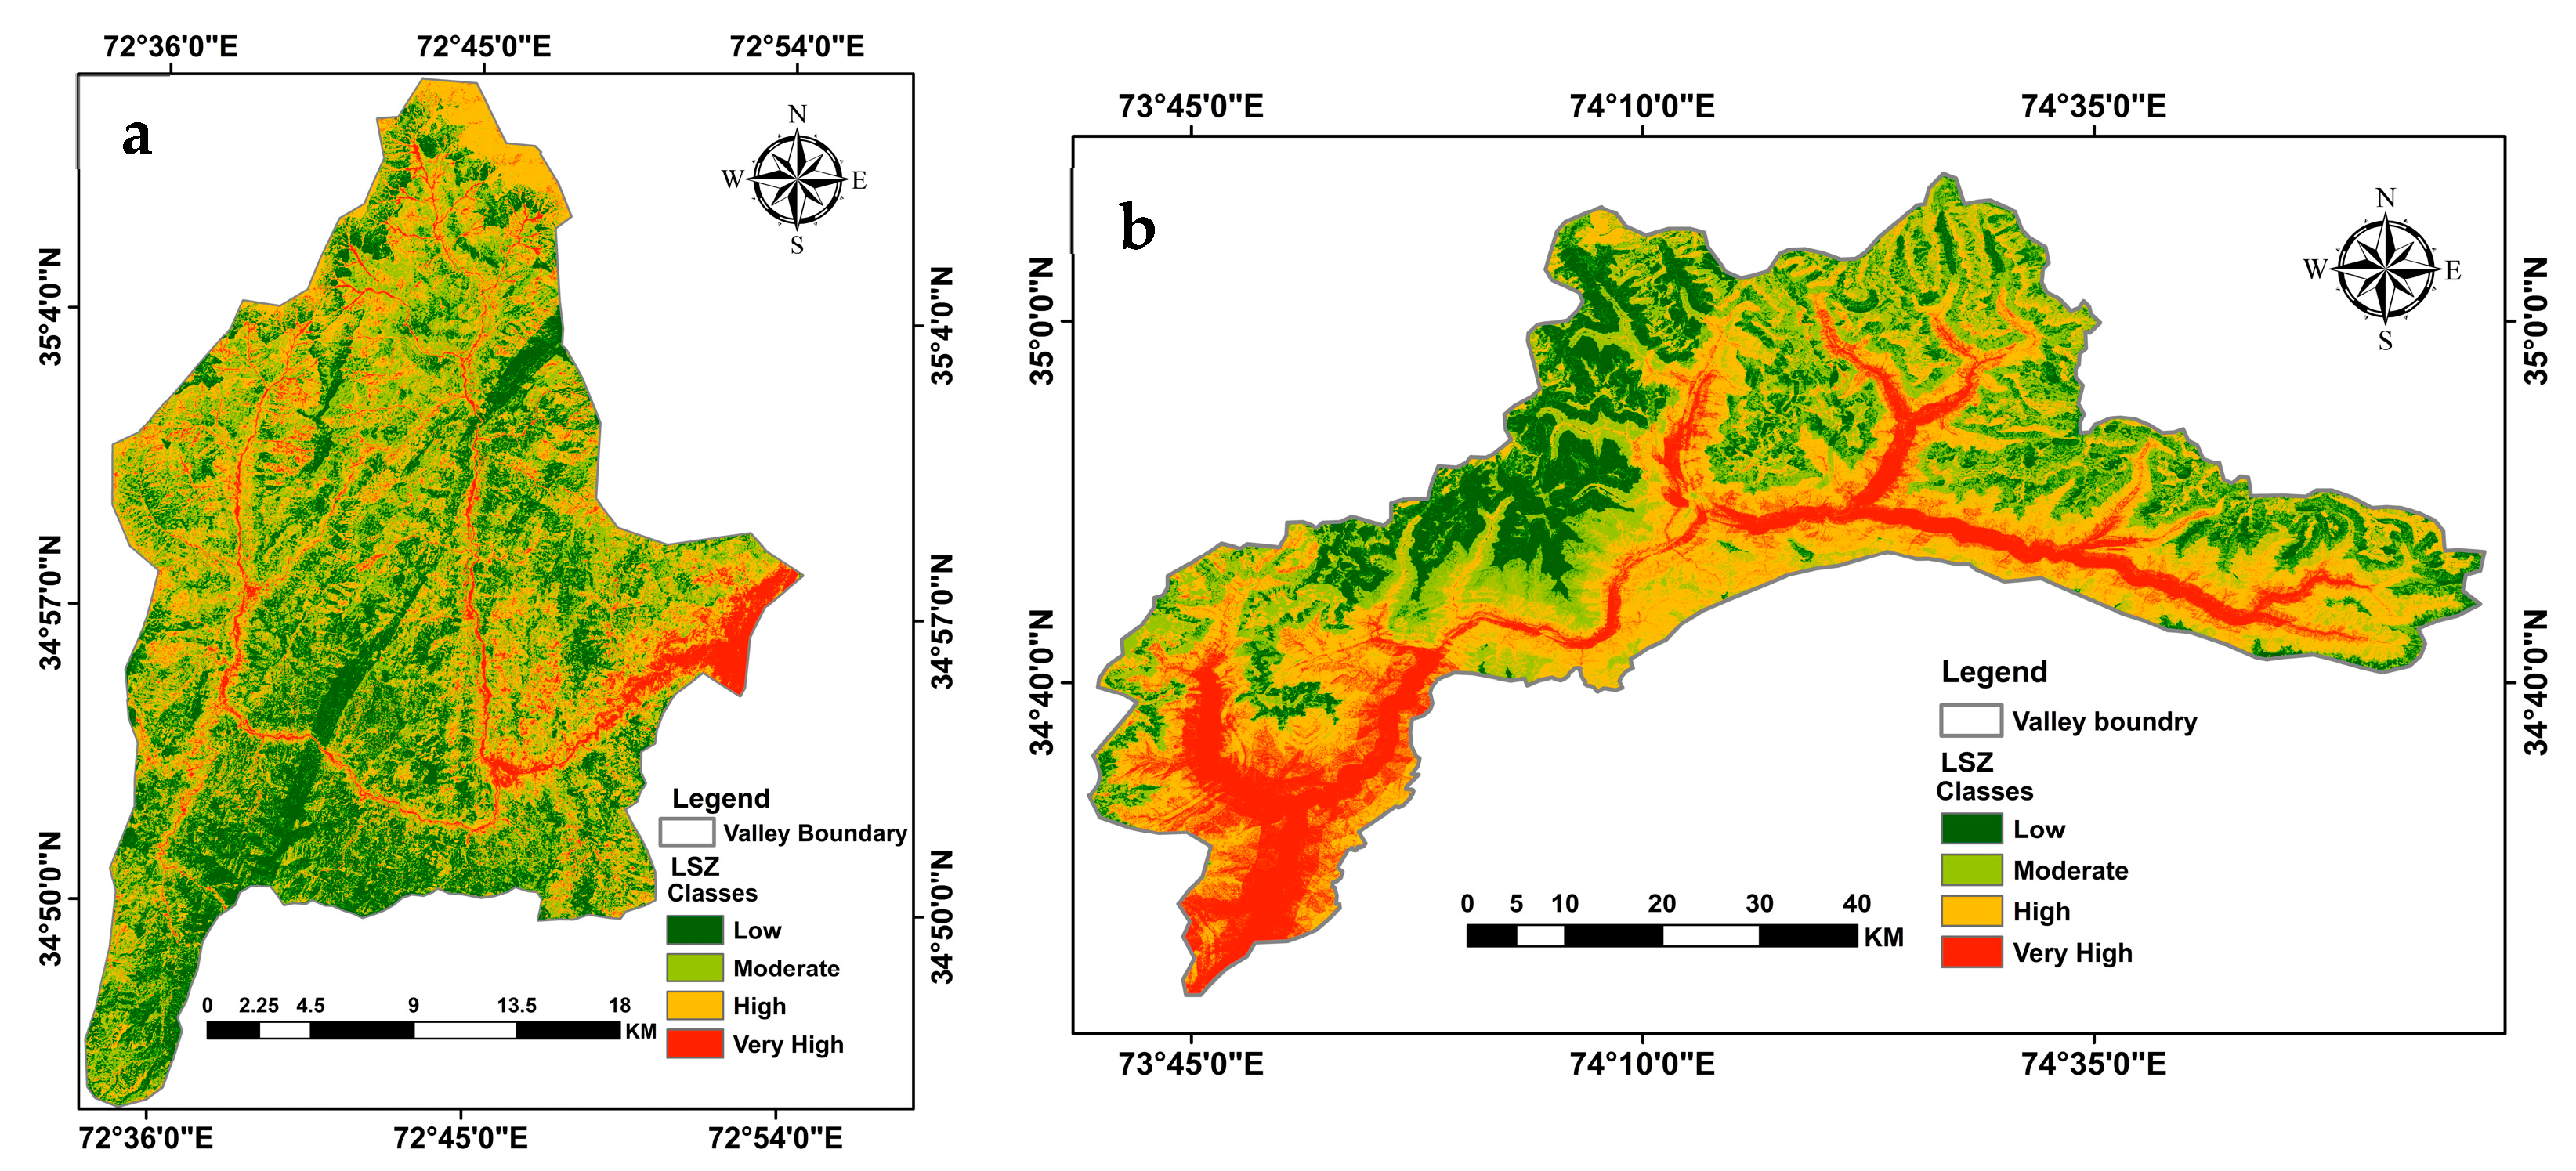
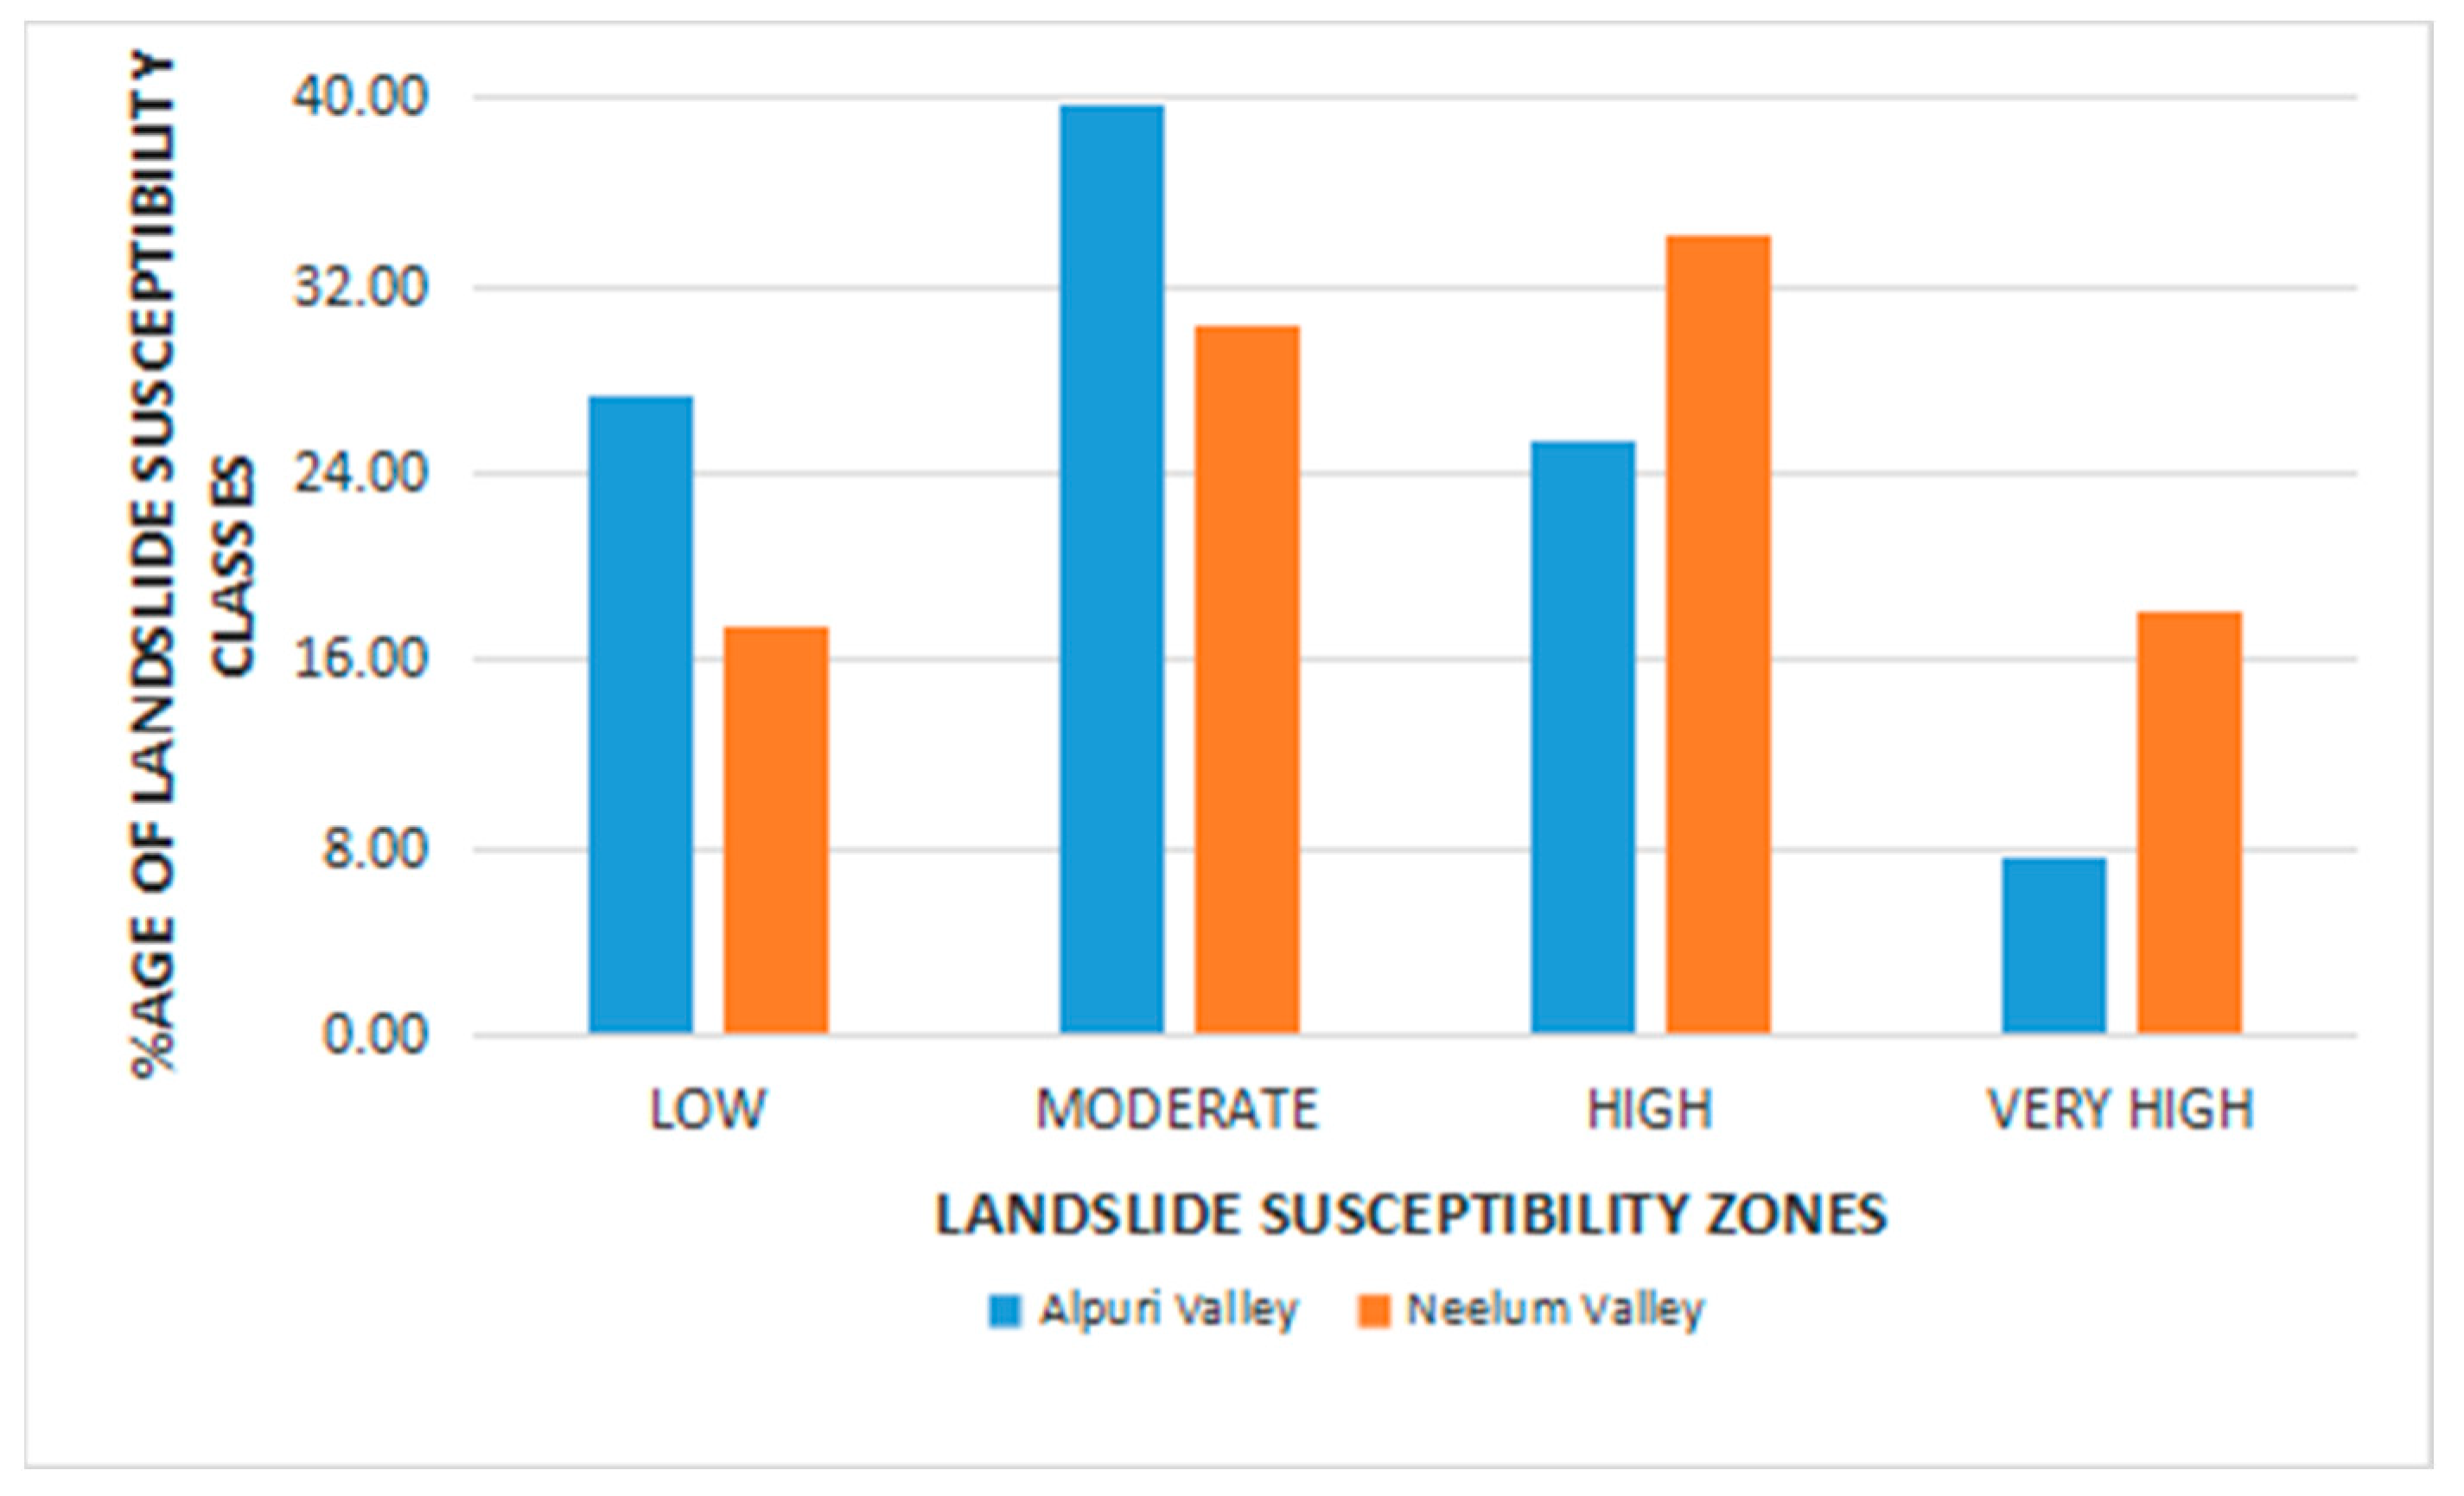
4.4. Landslide Susceptibility Mapping and Zonation
4.5. Model Validation
5. Discussion
6. Conclusions
Author Contributions
Funding
Institutional Review Board Statement
Informed Consent Statement
Data Availability Statement
Acknowledgments
Conflicts of Interest
References
- Dou, J.; Yunus, A.P.; Bui, D.T.; Merghadi, A.; Sahana, M.; Zhu, Z.; Chen, C.-W.; Han, Z.; Pham, B.T. Improved landslide assessment using support vector machine with bagging, boosting, and stacking ensemble machine learning framework in a mountainous watershed, Japan. Landslides 2020, 17, 641–658. [Google Scholar] [CrossRef]
- Dagdelenler, G.; Nefeslioglu, H.A.; Gokceoglu, C. Modification of seed cell sampling strategy for landslide susceptibility mapping: An application from the Eastern part of the Gallipoli Peninsula (Canakkale, Turkey). Bull. Eng. Geol. Environ. 2016, 75, 575–590. [Google Scholar] [CrossRef]
- Kirschbaum, D.; Stanley, T.; Zhou, Y. Spatial and temporal analysis of a global landslide catalogue. Geomorphology 2015, 249, 4–15. [Google Scholar] [CrossRef]
- Froude, M.J.; Petley, D.N. Global fatal landslide occurrence from 2004 to 2016. Nat. Hazards Earth Syst. Sci. 2018, 18, 2161–2181. [Google Scholar] [CrossRef]
- Alshehri, F.; Sultan, M.; Karki, S.; Alwagdani, E.; Alsefry, S.; Alharbi, H.; Sahour, H.; Sturchio, N. Mapping the Distribution of Shallow Groundwater Occurrences Using Remote Sensing-Based Statistical Modeling over Southwest Saudi Arabia. Remote Sens. 2020, 12, 1361. [Google Scholar] [CrossRef]
- Owen, L.A.; Kamp, U.; Khattak, G.A.; Harp, E.L.; Keefer, D.K.; Bauer, M.A. Landslides triggered by the 8 October 2005 Kashmir earthquake. Geomorphology 2008, 94, 1–9. [Google Scholar] [CrossRef]
- Weissel, J.K.; Stark, C.P. Landslides triggered by the 1999 Mw7. 6 Chi-Chi earthquake in Taiwan and their relationship to topography. In Scanning the Present and Resolving the Future, Proceedings of the IGARSS 2001, IEEE 2001 International Geoscience and Remote Sensing Symposium (Cat. No. 01CH37217), Sydney, NSW, Australia, 9–13 July 2001; IEEE: Piscataway, NJ, USA, 2001; Volume 2, pp. 759–761. [Google Scholar]
- Xu, C. Preparation of earthquake-triggered landslide inventory maps using remote sensing and GIS technologies: Principles and case studies. Geosci. Front. 2015, 6, 825–836. [Google Scholar] [CrossRef]
- Kamp, U.; Growley, B.J.; Khattak, G.A.; Owen, L.A. GIS-based landslide susceptibility mapping for the 2005 Kashmir earthquake region. Geomorphology 2008, 101, 631–642. [Google Scholar] [CrossRef]
- Shano, L.; Raghuvanshi, T.K.; Meten, M. Landslide susceptibility evaluation and hazard zonation techniques—A review. Geoenviron. Disasters 2020, 7, 18. [Google Scholar] [CrossRef]
- Reichenbach, P.; Rossi, M.; Malamud, B.D.; Mihir, M.; Guzzetti, F. A review of statistically-based landslide susceptibility models. Earth-Sci. Rev. 2018, 180, 60–91. [Google Scholar] [CrossRef]
- Akgun, A.; Erkan, O. Landslide susceptibility mapping by geographical information system-based multivariate statistical and deterministic models: In an artificial reservoir area at Northern Turkey. Arab. J. Geosci. 2016, 9, 165. [Google Scholar] [CrossRef]
- Ahmad, K.S.; Hameed, M.; Fatima, S.; Ashraf, M.; Ahmad, F.; Naseer, M.; Zahoor, A.; Ahmad, I. Tribe Andropogoneae from Neelum Valley, Azad Jammu and Kashmir: Phylogeny Based On Morpho-Anatomy. Pak. J. Bot. 2017, 49, 73–82. [Google Scholar]
- Rahman, A.-U.; Khan, A.N.; Collins, A.E. Analysis of landslide causes and associated damages in the Kashmir Himalayas of Pakistan. Nat. Hazards 2014, 71, 803–821. [Google Scholar] [CrossRef]
- Van Den Eeckhaut, M.; Reichenbach, P.; Guzzetti, F.; Rossi, M.; Poesen, J. Combined landslide inventory and susceptibility assessment based on different mapping units: An example from the Flemish Ardennes, Belgium. Nat. Hazards Earth Syst. Sci. 2009, 9, 507–521. [Google Scholar] [CrossRef]
- Park, S.; Choi, C.; Kim, B.; Kim, J. Landslide susceptibility mapping using frequency ratio, analytic hierarchy process, logistic regression, and artificial neural network methods at the Inje area, Korea. Environ. Earth Sci. 2013, 68, 1443–1464. [Google Scholar] [CrossRef]
- Guillard, C.; Zezere, J. Landslide susceptibility assessment and validation in the framework of municipal planning in Portugal: The case of Loures municipality. Environ. Manag. 2012, 50, 721–735. [Google Scholar] [CrossRef]
- Yalcin, A.; Reis, S.; Aydinoglu, A.C.; Yomralioglu, T. A GIS-based comparative study of frequency ratio, analytical hierarchy process, bivariate statistics and logistics regression methods for landslide susceptibility mapping in Trabzon, NE Turkey. Catena 2011, 85, 274–287. [Google Scholar] [CrossRef]
- Mika. Weathering of Igneous Rocks. 2013. Available online: http://www.geomika.com/blog/2013/08/17/weathering-igneous/ (accessed on 1 September 2003).
- Youssef, A.M.; Al-Kathery, M.; Pradhan, B. Landslide susceptibility mapping at Al-Hasher area, Jizan (Saudi Arabia) using GIS-based frequency ratio and index of entropy models. Geosci. J. 2015, 19, 113–134. [Google Scholar] [CrossRef]
- Singh, S. Geomorphology; Prayag Pustak Bhawan: Allahabad, India, 2007. [Google Scholar]
- Jebur, M.N.; Pradhan, B.; Tehrany, M.S. Manifestation of LiDAR-derived parameters in the spatial prediction of landslides using novel ensemble evidential belief functions and support vector machine models in GIS. IEEE J. Sel. Top. Appl. Earth Obs. Remote Sens. 2014, 8, 674–690. [Google Scholar] [CrossRef]
- Riley, S.J.; DeGloria, S.D.; Elliot, R. Index that quantifies topographic heterogeneity. Intermt. J. Sci. 1999, 5, 23–27. [Google Scholar]
- Bui, D.T.; Ho, T.C.; Revhaug, I.; Pradhan, B.; Nguyen, D.B. Landslide susceptibility mapping along the national road 32 of Vietnam using GIS-based J48 decision tree classifier and its ensembles. In Cartography from Pole to Pole; Springer: Berlin/Heidelberg, Germany, 2014; pp. 303–317. [Google Scholar]
- Wang, Q.; Li, W.; Wu, Y.; Pei, Y.; Xing, M.; Yang, D. A comparative study on the landslide susceptibility mapping using evidential belief function and weights of evidence models. J. Earth Syst. Sci. 2016, 125, 645–662. [Google Scholar] [CrossRef]
- Thomas, G.B. Calculus and Analytic Geometry; Addison-Wesley: Boston, MA, USA, 1968. [Google Scholar]
- Ayalew, L.; Yamagishi, H. The application of GIS-based logistic regression for landslide susceptibility mapping in the Kakuda-Yahiko Mountains, Central Japan. Geomorphology 2005, 65, 15–31. [Google Scholar] [CrossRef]
- Varnes, D.J. Landslide Hazard Zonation: A Review of Principles and Practice; United Nations: New York, NY, USA, 1984. [Google Scholar]
- Hack, J.T.; Goodlett, J.C. Geomorphology and Forest Ecology of a Mountain Region in the Central Appalachians; United States Government Printing Office: Washington, DC, USA, 1960.
- Dietrich, W.E. The importance of hollows in debris flow studies; Examples from Marin County, California. In Debris Flows/Avalanches: Process, Recognition, and Mitigation; Geological Society of America: Boulder, CO, USA, 1987; Volume 7, p. 165. [Google Scholar]
- Carson, M.A.; Kirkby, M.J. (Eds.) Hillslope Form and Process; Cambridge University Press: London, UK, 1972; p. 475. [Google Scholar]
- Kouli, M.; Loupasakis, C.; Soupios, P.; Vallianatos, F. Landslide hazard zonation in high-risk areas of Rethymno Prefecture, Crete Island, Greece. Nat. Hazards 2010, 52, 599–621. [Google Scholar] [CrossRef]
- Ayalew, L.; Yamagishi, H. Slope failures in the Blue Nile basin, as seen from landscape evolution perspective. Geomorphology 2004, 57, 95–116. [Google Scholar] [CrossRef]
- Montgomery, D.R.; Schmidt, K.M.; Greenberg, H.M.; Dietrich, W.E. Forest clearing and regional landsliding. Geology 2000, 28, 311–314. [Google Scholar] [CrossRef]
- Alshehri, F.; Abd El-Hamid, H.T.; Mohamed, A. Mapping coastal groundwater potential zones using remote sensing based AHP model in Al Qunfudhah region along Red Sea, Saudi Arabia. Heliyon 2024, 10, e28186. [Google Scholar] [CrossRef] [PubMed] [PubMed Central]
- Strahler, A.N. Quantitative Geomorphology of Drainage Basins and Channel networks. In Handbook of Applied Hydrology; Chow, V.T., Ed.; McGraw-Hill: New York, NY, USA, 1964; pp. 411–476. [Google Scholar]
- Moore, I.D.; Wilson, J.P. Length-slope factors for the Revised Universal Soil Loss Equation: Simplified method of estimation. J. Soil Water Conserv. 1992, 47, 423–428. [Google Scholar]
- Oh, H.-J.; Pradhan, B. Application of a neuro-fuzzy model to landslide-susceptibility mapping for shallow landslides in a tropical hilly area. Comput. Geosci. 2011, 37, 1264–1276. [Google Scholar] [CrossRef]
- Jaafari, A.; Najafi, A.; Pourghasemi, H.R.; Rezaeian, J.; Sattarian, A. GIS-based frequency ratio and index of entropy models for landslide susceptibility assessment in the Caspian forest, northern Iran. Int. J. Environ. Sci. Technol. 2014, 11, 909–926. [Google Scholar] [CrossRef]
- Zhao, C.; Chen, W.; Wang, Q.; Wu, Y.; Yang, B. A comparative study of the statistical index and certainty factor models in landslide susceptibility mapping: A case study for the Shangzhou District, Shaanxi Province, China. Arab. J. Geosci. 2015, 8, 9079–9088. [Google Scholar] [CrossRef]
- Mancini, F.; Ceppi, C.; Ritrovato, G. GIS and statistical analysis for landslide susceptibility mapping in the Daunia area, Italy. Nat. Hazards Earth Syst. Sci. 2010, 10, 1851–1864. [Google Scholar] [CrossRef]
- Sujatha, E.R.; Rajamanickam, G.V.; Kumaravel, P. Landslide susceptibility analysis using Probabilistic Certainty Factor Approach: A case study on Tevankarai stream watershed, India. J. Earth Syst. Sci. 2012, 121, 1337–1350. [Google Scholar] [CrossRef]
- Swanson, F.J.; Dyrness, C.T. Impact of clear-cutting and road construction on soil erosion by landslides in the western Cascade Range, Oregon. Geology 1975, 3, 393–396. [Google Scholar] [CrossRef]
- Larsen, I.J.; Montgomery, D.R. Landslide erosion coupled to tectonics and river incision. Nat. Geosci. 2012, 5, 468–473. [Google Scholar] [CrossRef]
- Chen, W.; Li, W.; Chai, H.; Hou, E.; Li, X.; Ding, X. GIS-based landslide susceptibility mapping using analytical hierarchy process (AHP) and certainty factor (CF) models for the Baozhong region of Baoji City, China. Environ. Earth Sci. 2016, 75, 63. [Google Scholar] [CrossRef]
- Tibaldi, A.; Ferrari, L.; Pasquarè, G. Landslides triggered by earthquakes and their relations with faults and mountain slope geometry: An example from Ecuador. Geomorphology 1995, 11, 215–226. [Google Scholar] [CrossRef]
- Felicísimo, Á.M.; Bonham-Carter, G.F. (1996): Geographic information systems for geoscientists. Modelling with GIS. GeoFocus Rev. Int. Cienc. Tecnol. Inf. Geográfica 2003, 20, 9–12. [Google Scholar]
- Du, G.-L.; Zhang, Y.-S.; Iqbal, J.; Yang, Z.-H.; Yao, X. Landslide susceptibility mapping using an integrated model of information value method and logistic regression in the Bailongjiang watershed, Gansu Province, China. J. Mt. Sci. 2017, 14, 249–268. [Google Scholar] [CrossRef]
- McFeeters, S.K. The use of the Normalized Difference Water Index (NDWI) in the delineation of open water features. Int. J. Remote Sens. 1996, 17, 1425–1432. [Google Scholar] [CrossRef]
- Rasyid, A.R.; Bhandary, N.P.; Yatabe, R. Performance of frequency ratio and logistic regression model in creating GIS-based landslides susceptibility map at Lompobattang Mountain, Indonesia. Geoenviron. Disasters 2016, 3, 19. [Google Scholar] [CrossRef]
- Mahdadi, F.; Boumezbeur, A.; Hadji, R.; Kanungo, D.P.; Zahri, F. GISbased landslide susceptibility assessment using statistical models: A case study from Souk Ahras province, NE Algeria. Arab. J. Geosci. 2018, 11, 476. [Google Scholar] [CrossRef]
- Banshtu, R.S.; Versain, L.D.; Pandey, D.D. Risk assessment using quantitative approach: Central Himalaya, Kullu, Himachal Pradesh, India. Arab. J. Geosci. 2020, 13, 219. [Google Scholar] [CrossRef]
- Chen, W.; Fan, L.; Li, C.; Pham, B.T. Spatial prediction of landslides using hybrid integration of artificial intelligence algorithms with frequency ratio and index of entropy in nanzheng county, China. Appl. Sci. 2020, 10, 29. [Google Scholar] [CrossRef]
- Weng, Q. Remote Sensing and GIS Integration: Theories, Methods, and Applications; McGraw-Hill: New York, NY, USA, 2010. [Google Scholar]
- Devkota, K.C.; Regmi, A.D.; Pourghasemi, H.R.; Yoshida, K.; Pradhan, B.; Ryu, I.C.; Dhital, M.R.; Althuwaynee, O.F. Landslide susceptibility mapping using certainty factor, index of entropy and logistic regression models in GIS and their comparison at Mugling–Narayanghat road section in Nepal Himalaya. Nat. Hazards 2013, 65, 135–165. [Google Scholar] [CrossRef]
- Zhao, X.; Chen, W. GIS-based evaluation of landslide susceptibility models using certainty factors and functional trees-based ensemble techniques. Appl. Sci. 2020, 10, 16. [Google Scholar] [CrossRef]
- Zhao, X.; Chen, W. Optimization of computational intelligence models for landslide susceptibility evaluation. Remote Sens. 2020, 12, 2180. [Google Scholar] [CrossRef]


| Landslide Inventory | Field Data and Satellite Images | Scale | Polygons and Points |
|---|---|---|---|
| Lithology | Geological map | 1:50,000 | Lithological units |
| Slope gradient | ALOSPALSAR DEM | 12.5 m | Natural break |
| Slope aspect | ALOSPALSARDEM | 12.5 m | Natural break |
| Elevation | ALOSPALSAR DEM | 12.5 m | Natural break |
| General curvature | ALOSPALSAR DEM | 12.5 m | Natural break |
| Profile curvature | ALOSPALSAR DEM | 12.5 m | Natural break |
| Plan curvature | ALOSPALSAR DEM | 12.5 m | Natural break |
| TRI | ALOSPALSARDEM | 12.5 m | Natural break |
| SPI | ALOSPALSAR DEM | 12.5 m | Natural break |
| Distance to streams | ALOSPALSAR DEM | 12.5 m | Natural break |
| Drainage density | ALOSPALSAR DEM | 12.5 m | Natural break |
| Distance to roads | Topographic map | 1:50,000 | Natural break |
| NDVI | Sentinel 2 | 10 m | Natural break |
| NDWI | Sentinel 2 | 10 m | Natural break |
| Land-use, land-cover | Sentinel 2 | 10 m | Natural break |
| Distance from faults | Geological map | 1:50,000 | Natural break |
| Rainfall (mm) | GPM | 30 m | Natural break |
| Landslides in Alpuri Valley | Landslides in Neelum Valley | ||||||||
|---|---|---|---|---|---|---|---|---|---|
| LS Types | Total LS | LS (%) | LS Area (Km2) | LS Area (%) | LS Types | Total LS | LS (%) | LS Area (Km2) | LS Area (%) |
| Slide | 57 | 64.05 | 0.224 | 48.17 | Slide | 240 | 65.22 | 3.47 | 47.7 |
| Debris flow | 31 | 34.83 | 0.011 | 49.46 | Debris flow | 124 | 33.70 | 3.76 | 51.65 |
| Rock fall | 1 | 1.12 | 0.230 | 2.37 | Rock fall | 4 | 1.08 | 0.05 | 0.68 |
| Total | 89 | 100 | 0.465 | 100 | Total | 368 | 100 | 7.28 | 100 |
| Alpuri Valley | Neelum Vally | ||||||
|---|---|---|---|---|---|---|---|
| Classes | % of Pixels in a Class | % of Landslide Pixels in a Class | RE | Classes | % of Pixels in a Class | % of Landslide Pixels in a Class | RE |
| Geology | Geology | ||||||
| A (Archean–Besham group) | 20 | 28.59 | 0.16 | Cb (Surgun group A) | 1.78 | 6.34 | 0.55 |
| Cb (Cambrian Manglaur) | 2.52 | 2.84 | 0.05 | Ec (eclogites) | 35.92 | 34.53 | −0.02 |
| Ism (Indus Suture mélange) | 20.07 | 22.19 | 0.04 | Gl (glacier) | 4.08 | 0 | 0 |
| Ka (Kamila amphibolite complex) | 25.14 | 30.01 | 0.08 | Mg (Manshera granites) | 11.39 | 20.29 | 0.25 |
| Ms (Alpuri schist) | 11.56 | 7.4 | −0.19 | Ms (Surgun group B) | 19.24 | 2.81 | −0.84 |
| Pr (Karor group) | 18.13 | 8.82 | −0.31 | Pr (Salkhala group) | 18.34 | 31.69 | 0.24 |
| Swg (Swat granites) | 2.58 | 0.14 | −1.26 | Pz (Surgun group C) | 3.38 | 4.35 | 0.11 |
| Nil | Nil | Nil | Nil | Sg (Shengus gneiss) | 5.87 | 0 | 0 |
| Slope Gradient | Slope Gradient | ||||||
| 0–18 | 11.31 | 9.06 | −0.096 | 0–17 | 12.32 | 8.26 | −0.17 |
| 18–28 | 23.47 | 18.97 | −0.093 | 17–28 | 24.81 | 22.6 | −0.04 |
| 28–36 | 30.89 | 33.29 | 0.032 | 28–38 | 31.21 | 33.09 | 0.03 |
| 36–46 | 24.99 | 27.88 | 0.047 | 38–48 | 22.78 | 25.99 | 0.06 |
| 46–78 | 9.34 | 10.81 | 0.064 | 48–84 | 8.89 | 10.05 | 0.05 |
| Slope Aspect | Slope Aspect | ||||||
| North | 10.24 | 8.38 | −0.17 | North | 9.93 | 14.19 | 0.31 |
| Northeast | 11.05 | 13.44 | 0.09 | Northeast | 10.61 | 11.77 | 0.05 |
| East | 14.45 | 19.03 | 0.12 | East | 12.4 | 10.96 | −0.05 |
| Southeast | 15.84 | 18.84 | 0.08 | Southeast | 15.46 | 15.21 | −0.01 |
| South | 12.23 | 16.14 | 0.12 | South | 14.87 | 15.97 | 0.03 |
| Southwest | 13.05 | 9.42 | −0.14 | Southwest | 14.71 | 13.52 | −0.04 |
| West | 12.38 | 7.86 | −0.2 | West | 11.94 | 7.63 | −0.19 |
| Northwest | 10.74 | 6.72 | −0.2 | Northwest | 10.07 | 10.74 | 0.03 |
| Distance from Road | Distance from Road | ||||||
| 0–200 | 8.22 | 20.63 | 0.4 | 0–200 | 2.3 | 8.71 | 0.58 |
| 200–400 | 7.06 | 7.4 | 0.02 | 200–400 | 2.17 | 7 | 0.51 |
| 400–600 | 6.52 | 3.18 | −0.31 | 400–600 | 2.08 | 5.64 | 0.43 |
| 600–800 | 6.13 | 2.09 | −0.47 | 600–800 | 2.03 | 4.33 | 0.33 |
| >800 | 72.07 | 66.71 | −0.03 | >800 | 91.43 | 74.32 | −0.09 |
| Distance from River | Distance from River | ||||||
| 0–200 | 5.17 | 20.72 | 0.60 | 0–200 | 3.72 | 16.81 | 0.65 |
| 200–400 | 5 | 3.41 | −0.17 | 200–400 | 3.63 | 8.13 | 0.35 |
| 400–600 | 4.89 | 5.97 | 0.09 | 400–600 | 3.53 | 7.77 | 0.34 |
| 600–800 | 4.79 | 2.89 | −0.22 | 600–800 | 3.51 | 7.36 | 0.32 |
| >800 | 80.16 | 67 | −0.08 | >800 | 85.61 | 59.93 | −0.15 |
| General Curvature | General Curvature | ||||||
| −73.6–−4.96 | 2.02 | 2.18 | 0.03 | −54.64–−4.48 | 3.04 | 5.35 | 0.25 |
| −4.96–−1.77 | 17.61 | 23.47 | 0.12 | −4.48–−1.28 | 25.87 | 33.17 | 0.11 |
| −1.77–0.89 | 50.3 | 51.45 | 0.01 | −1.28–0.65 | 42.65 | 37.7 | −0.05 |
| 0.89–4.61 | 28.07 | 20.39 | −0.14 | 0.65–3.85 | 25.26 | 20.62 | −0.09 |
| 4.61–6.08 | 2 | 2.51 | 0.1 | 3.85–106 | 3.19 | 3.16 | 0 |
| Elevation | Elevation | ||||||
| 535–1459 | 15.42 | 21.57 | 0.15 | 980–2219 | 10.65 | 31.06 | 0.46 |
| 1459–1973 | 30.07 | 22.9 | −0.12 | 2219–2881 | 20.46 | 51.23 | 0.4 |
| 1973–2482 | 30.96 | 29.45 | −0.02 | 2881–3493 | 22.92 | 17.18 | −0.13 |
| 2482–3158 | 16 | 25.65 | 0.21 | 3493–4075 | 26.22 | 0.53 | −1.7 |
| 3158–4400 | 7.56 | 0.43 | −1.25 | 4075–6128 | 19.75 | 0 | 0 |
| Plan Curvature | Plan Curvature | ||||||
| −32–2.06 | 4.23 | 5.17 | 0.09 | −38.9–−2.83 | 1.69 | 2.9 | 0.23 |
| −2.06–−0.7 | 20.02 | 24.56 | 0.09 | −2.83–−1.04 | 13.2 | 18.83 | 0.15 |
| −0.7–0.39 | 39.77 | 41.01 | 0.01 | −1.04–0.03 | 38.27 | 37.85 | 0 |
| 0.39–1.75 | 29.19 | 23.38 | −0.1 | 0.03–1.45 | 38.17 | 32.74 | −0.07 |
| 1.75–37.40 | 6.8 | 5.88 | −0.06 | 1.45–52.18 | 8.66 | 7.69 | −0.05 |
| Profile Curvature | Profile Curvature | ||||||
| −25.84–−2.57 | 3.1 | 3.18 | 0.01 | −57.98–−3.34 | 1.75 | 1.98 | 0.05 |
| −2.57–−0.72 | 21.82 | 16.64 | −0.12 | −3.34–−1.07 | 14.09 | 13.11 | −0.03 |
| −0.72–0.6 | 44.82 | 43.24 | −0.02 | −1.07–0.43 | 49.16 | 42.11 | −0.07 |
| 0.60–2.45 | 26.52 | 32.48 | 0.09 | 0.43–2.7 | 32.04 | 37.59 | 0.07 |
| 2.45–41.60 | 3.74 | 4.46 | 0.08 | 2.7–38.12 | 2.96 | 5.22 | 0.25 |
| Terrain Roughness Index | Terrain Roughness Index | ||||||
| 0.10–0.38 | 6.62 | 13.04 | 0.29 | 0.08–0.38 | 6.48 | 13.94 | 0.33 |
| 0.38–0.46 | 22.13 | 22.76 | 0.01 | 0.38–0.45 | 20.8 | 24.46 | 0.07 |
| 0.46–0.52 | 35.74 | 42.58 | 0.08 | 0.45–0.51 | 36.91 | 33.1 | −0.05 |
| 0.52–0.59 | 26.6 | 16.17 | −0.22 | 0.51–0.59 | 27.07 | 22.72 | −0.08 |
| 0.59–0.95 | 8.91 | 5.45 | −0.21 | 0.59–0.90 | 8.74 | 5.77 | −0.18 |
| NDVI | NDVI | ||||||
| −0.4–0.18 | 2.63 | 11.66 | 0.65 | −1–0.10 | 17.93 | 8.58 | −0.32 |
| 0.18–0.39 | 7.1 | 44.71 | 0.8 | 0.10–0.27 | 12.2 | 31.79 | 0.42 |
| 0.39–0.53 | 18.84 | 24.23 | 0.11 | 0.27–0.42 | 18.72 | 29.6 | 0.2 |
| 0.53–0.62 | 35.38 | 13.13 | −0.43 | 0.42–0.56 | 27.47 | 20.54 | −0.13 |
| 0.62–0.86 | 36.04 | 6.26 | −0.76 | 0.56–0.87 | 23.69 | 9.5 | −0.4 |
| Stream Power Index | Stream Power Index | ||||||
| 0–17,346,033 | 99.93 | 99.53 | 0 | 0–162,747,343 | 99.97 | 99.96 | −0.00002 |
| 17,346,033–69,384,135 | 0.05 | 0.33 | 0.81 | 162,747,343–623,864,818 | 0.02 | 0.01 | −0.4 |
| 69,384,135–160,450,813 | 0.01 | 0.14 | 0.99 | 623,864,818–1,329,103,309 | 0.01 | 0.01 | 0.2 |
| 160,450,813–307,892,102 | 0 | 0 | 0 | 1,329,103,309–2,875,203,075 | 0 | 0.02 | 0.8 |
| 307,892,102–55,904,832 | 0 | 0 | 0 | 2,875,203,075–6,916,762,112 | 0 | 0 | 0 |
| NDWI | NDWI | ||||||
| −0.74–−0.52 | 26.57 | 4.98 | −0.73 | −0.78–−0.48 | 27.28 | 7.12 | −0.58 |
| −0.52–0.44 | 38.76 | 14.46 | −0.43 | −0.48–−0.34 | 32.81 | 33.89 | 0.01 |
| 0.44–0.33 | 23.11 | 27.5 | 0.08 | −0.34–−0.17 | 17.21 | 41.5 | 0.38 |
| 0.33–0.17 | 8.37 | 41.68 | 0.7 | −0.17–0.02 | 20.25 | 16.29 | −0.09 |
| 0.17–0.51 | 3.19 | 11.38 | 0.55 | 0.02–1 | 2.44 | 1.2 | −0.31 |
| Drainage Density | Drainage Density | ||||||
| 0–0.56 | 81.57 | 68.14 | −0.08 | 0–0.34 | 72.59 | 48.21 | −0.18 |
| 0.56–1.12 | 8.73 | 10.05 | 0.06 | 0.34–0.68 | 13.03 | 26.11 | 0.3 |
| 1.12–1.68 | 7.2 | 7.11 | −0.01 | 0.68–1.02 | 9.54 | 20.75 | 0.34 |
| 1.68–2.24 | 2.13 | 8.2 | 0.59 | 1.02–1.36 | 4.38 | 4.74 | 0.04 |
| 2.24–2.8 | 0.36 | 6.5 | 1.00 | 1.36–1.7 | 0.46 | 0.2 | −0.38 |
| Land-use Land-cover | Land-use Land-cover | ||||||
| Bare Land | 0.75 | 1.70 | 0.35 | Bare Land | 8.90 | 10.83 | 0.08 |
| Built Area | 18.98 | 18.97 | −0.0002 | Built Area | 0.24 | 0.33 | 0.13 |
| Clouds | 0.0002 | 0 | 0 | Clouds | 0.0005 | 0 | 0 |
| Crops | 0.28 | 0 | 0 | Crops | 0.16 | 1.07 | 0.81 |
| Rangeland | 37.74 | 59.69 | 0.19 | Rangeland | 45.35 | 49.54 | 0.04 |
| Snow/Ice | 2.68 | 0 | 0 | Snow/Ice | 15.62 | 0.66 | −1.37 |
| Trees | 39.35 | 18.73 | −0.32 | Trees | 29.02 | 34.45 | 0.07 |
| Water | 0.21 | 0.90 | 0.62 | Water | 0.70 | 3.10 | 0.64 |
| Rainfall | Rainfall | ||||||
| 96.73–101.88 | 10.21 | 16.83 | 0.21 | 61.19–71.43 | 41.30 | 29.62 | −0.14 |
| 101.89–105.67 | 18.75 | 24.37 | 0.11 | 71.44–82.43 | 20.25 | 15.29 | −0.12 |
| 105.68–109.21 | 26.97 | 26.22 | −0.01 | 82.44–95.93 | 13.88 | 3.98 | −0.54 |
| 109.22–112.43 | 25.45 | 20.19 | −0.10 | 95.94–108.68 | 11.09 | 13.7 | 0.09 |
| 112.44–117.26 | 18.61 | 12.37 | −0.17 | 108.69–124.92 | 13.46 | 37.40 | 0.44 |
| Distance from Fault lines | Distance from Fault lines | ||||||
| 0–200 | 11.57 | 17.21 | 0.17 | 0–200 | 2.01 | 0.51 | −0.59 |
| 200–400 | 10.94 | 13.94 | 0.10 | 200–400 | 2.01 | 2.63 | 0.11 |
| 400–600 | 10.14 | 9.00 | −0.05 | 400–600 | 1.99 | 1.32 | −0.17 |
| 600–800 | 9.23 | 8.25 | −0.05 | 600–800 | 1.94 | 0.83 | −0.37 |
| >800 | 58.12 | 51.60 | −0.05 | >800 | 92.04 | 94.70 | 0.01 |
| Zones | Low | Moderate | High | Very High |
|---|---|---|---|---|
| Alpuri Valley | 27.31 | 39.81 | 25.33 | 7.55 |
| Neelum Valley | 17.56 | 30.26 | 34.04 | 18.14 |
Disclaimer/Publisher’s Note: The statements, opinions and data contained in all publications are solely those of the individual author(s) and contributor(s) and not of MDPI and/or the editor(s). MDPI and/or the editor(s) disclaim responsibility for any injury to people or property resulting from any ideas, methods, instructions or products referred to in the content. |
© 2024 by the authors. Licensee MDPI, Basel, Switzerland. This article is an open access article distributed under the terms and conditions of the Creative Commons Attribution (CC BY) license (https://creativecommons.org/licenses/by/4.0/).
Share and Cite
Khan, S.M.; Rahman, A.-U.; Ali, M.; Alshehri, F.; Shahab, M.; Ullah, S. Pixel-Based Spatio-Statistical Analysis of Landslide Probability in Humid and Seismically Active Areas of Himalaya and Hindukush. Sustainability 2024, 16, 3556. https://doi.org/10.3390/su16093556
Khan SM, Rahman A-U, Ali M, Alshehri F, Shahab M, Ullah S. Pixel-Based Spatio-Statistical Analysis of Landslide Probability in Humid and Seismically Active Areas of Himalaya and Hindukush. Sustainability. 2024; 16(9):3556. https://doi.org/10.3390/su16093556
Chicago/Turabian StyleKhan, Sajjad Muhammad, Atta-Ur Rahman, Muhammad Ali, Fahad Alshehri, Muhammad Shahab, and Sajid Ullah. 2024. "Pixel-Based Spatio-Statistical Analysis of Landslide Probability in Humid and Seismically Active Areas of Himalaya and Hindukush" Sustainability 16, no. 9: 3556. https://doi.org/10.3390/su16093556