
Evaluation and Optimization of Interior Circadian Daylighting Performance for the Elderly in Traditional Dwellings: A Case Study in Western Hunan, China


Abstract
:1. Introduction
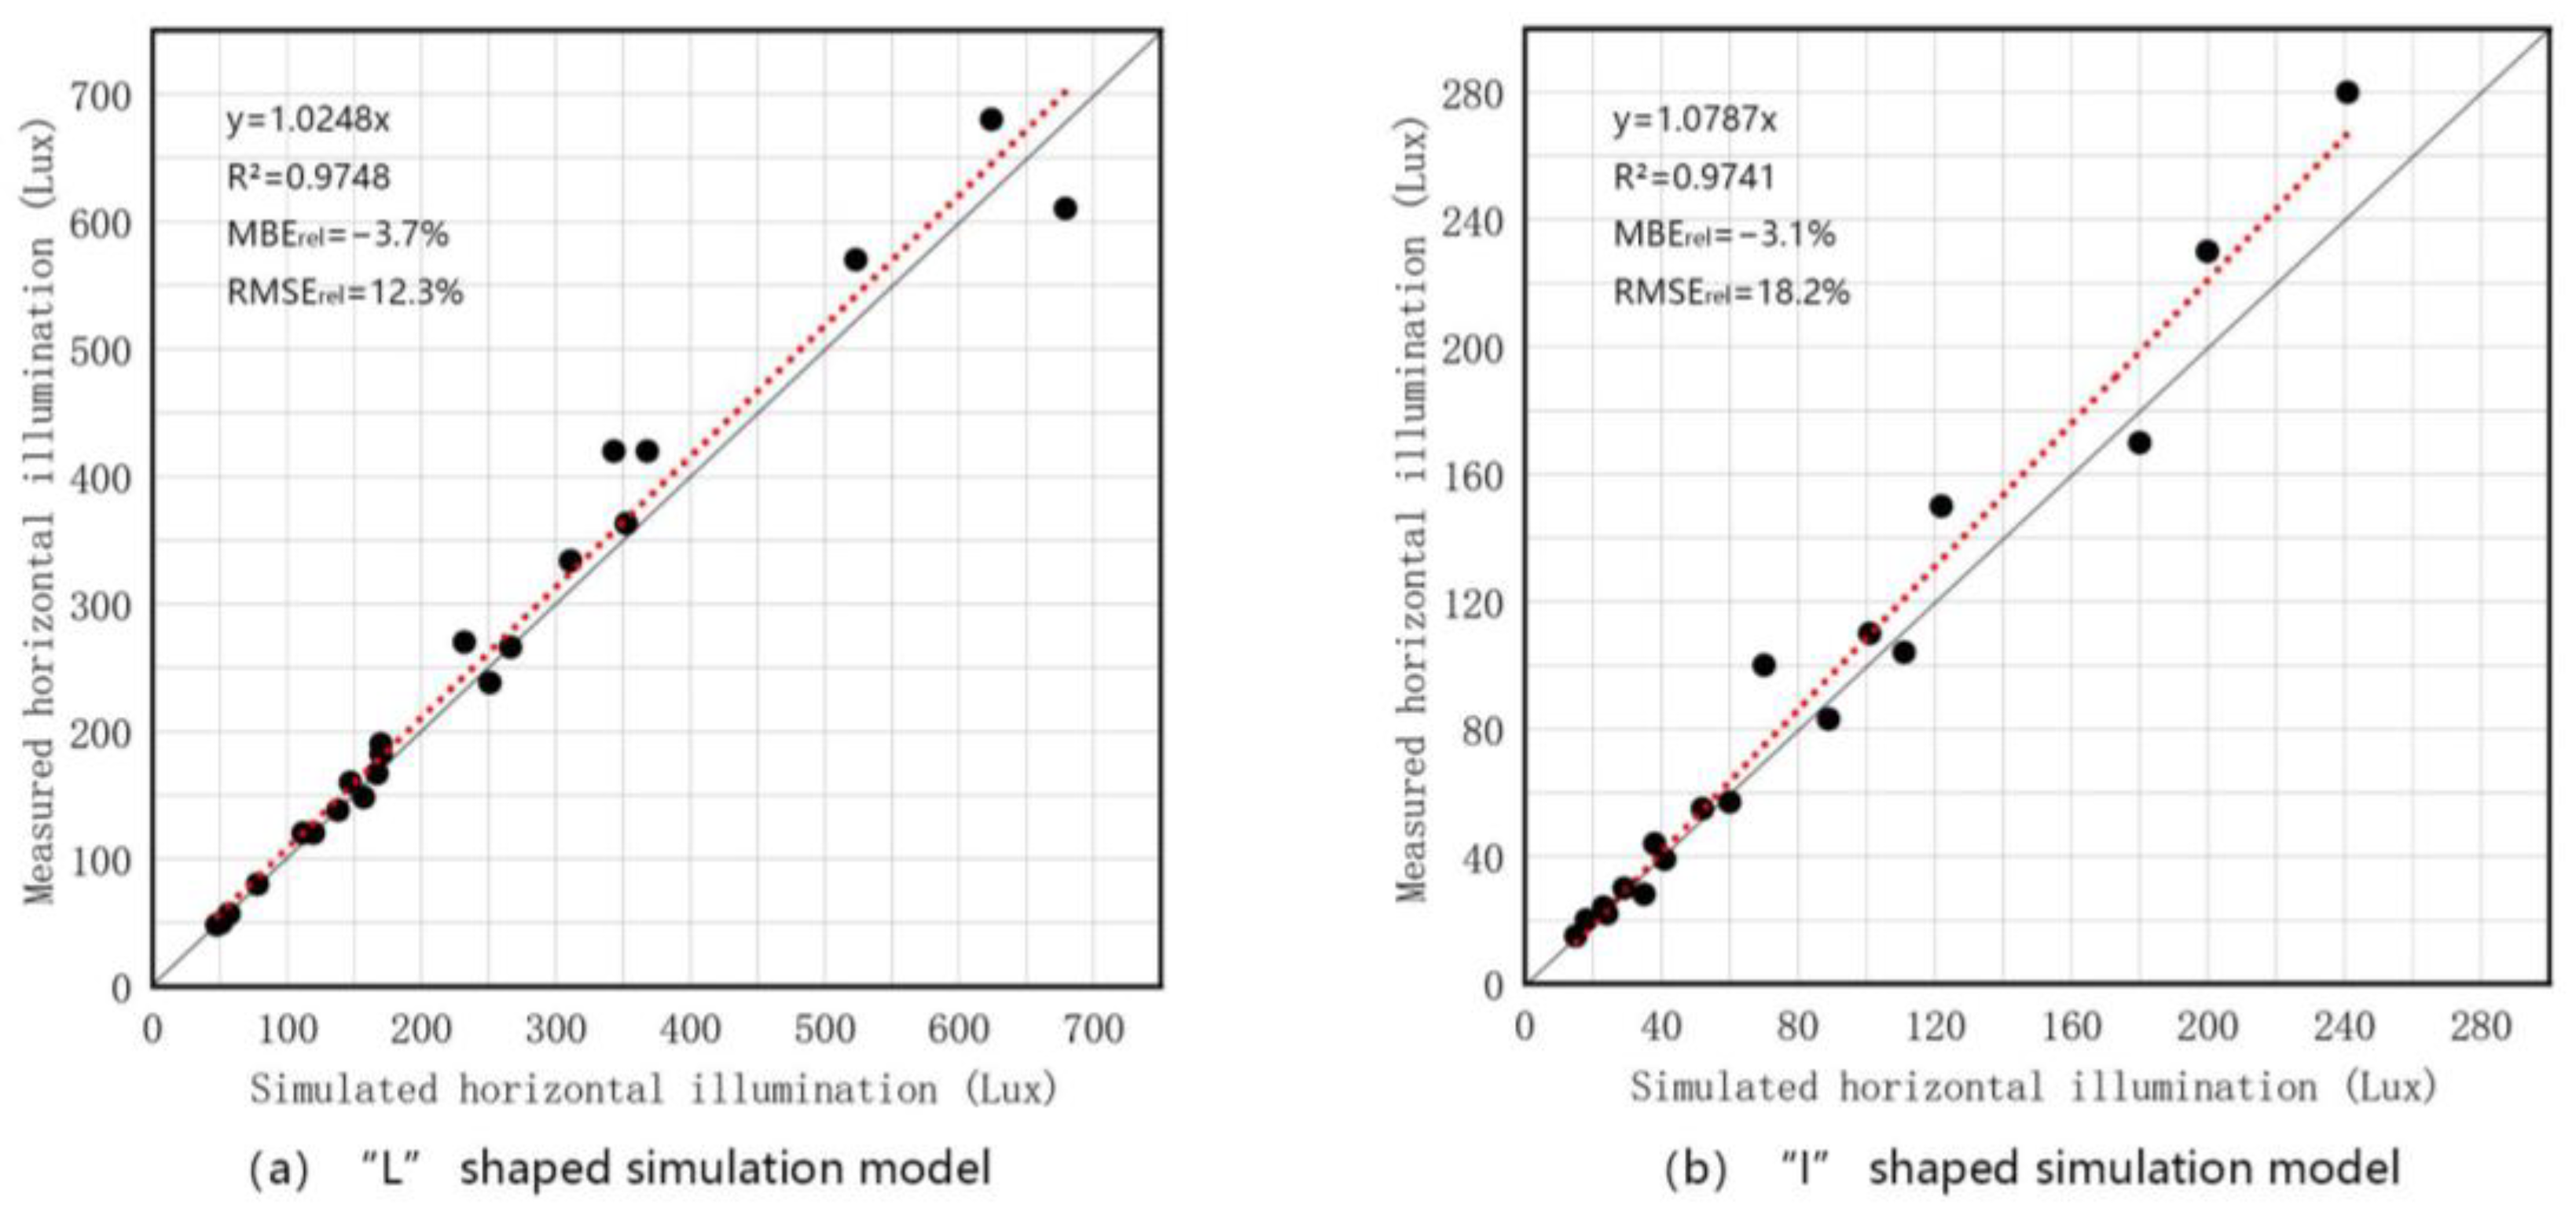
- Digital models of traditional dwellings in western Hunan were created using 3D laser scanning and drone tilt photography. Subsequently, a lighting simulation model was constructed in Rhino 7.0. The simulation results from Climate Studio were then cross-verified with actual field-measured illuminance data, affirming the reliability of Climate Studio’s simulations.
- Daylighting simulations, incorporating both dynamic and static approaches, were executed to evaluate the CS levels in the interiors of two distinct dwelling types (L-type and I-type) common among the Miao ethnic group in western Hunan.
- Simplified the fitting model of CS with WWR and reflectance, and verified its accuracy.
- The study conducted a statistical analysis and quantitative simulation of the WWR and reflectance of interior materials used in traditional Miao dwellings located in western Hunan. The aim was to establish the necessary dwellings parameter ranges for an appropriate circadian stimulus.
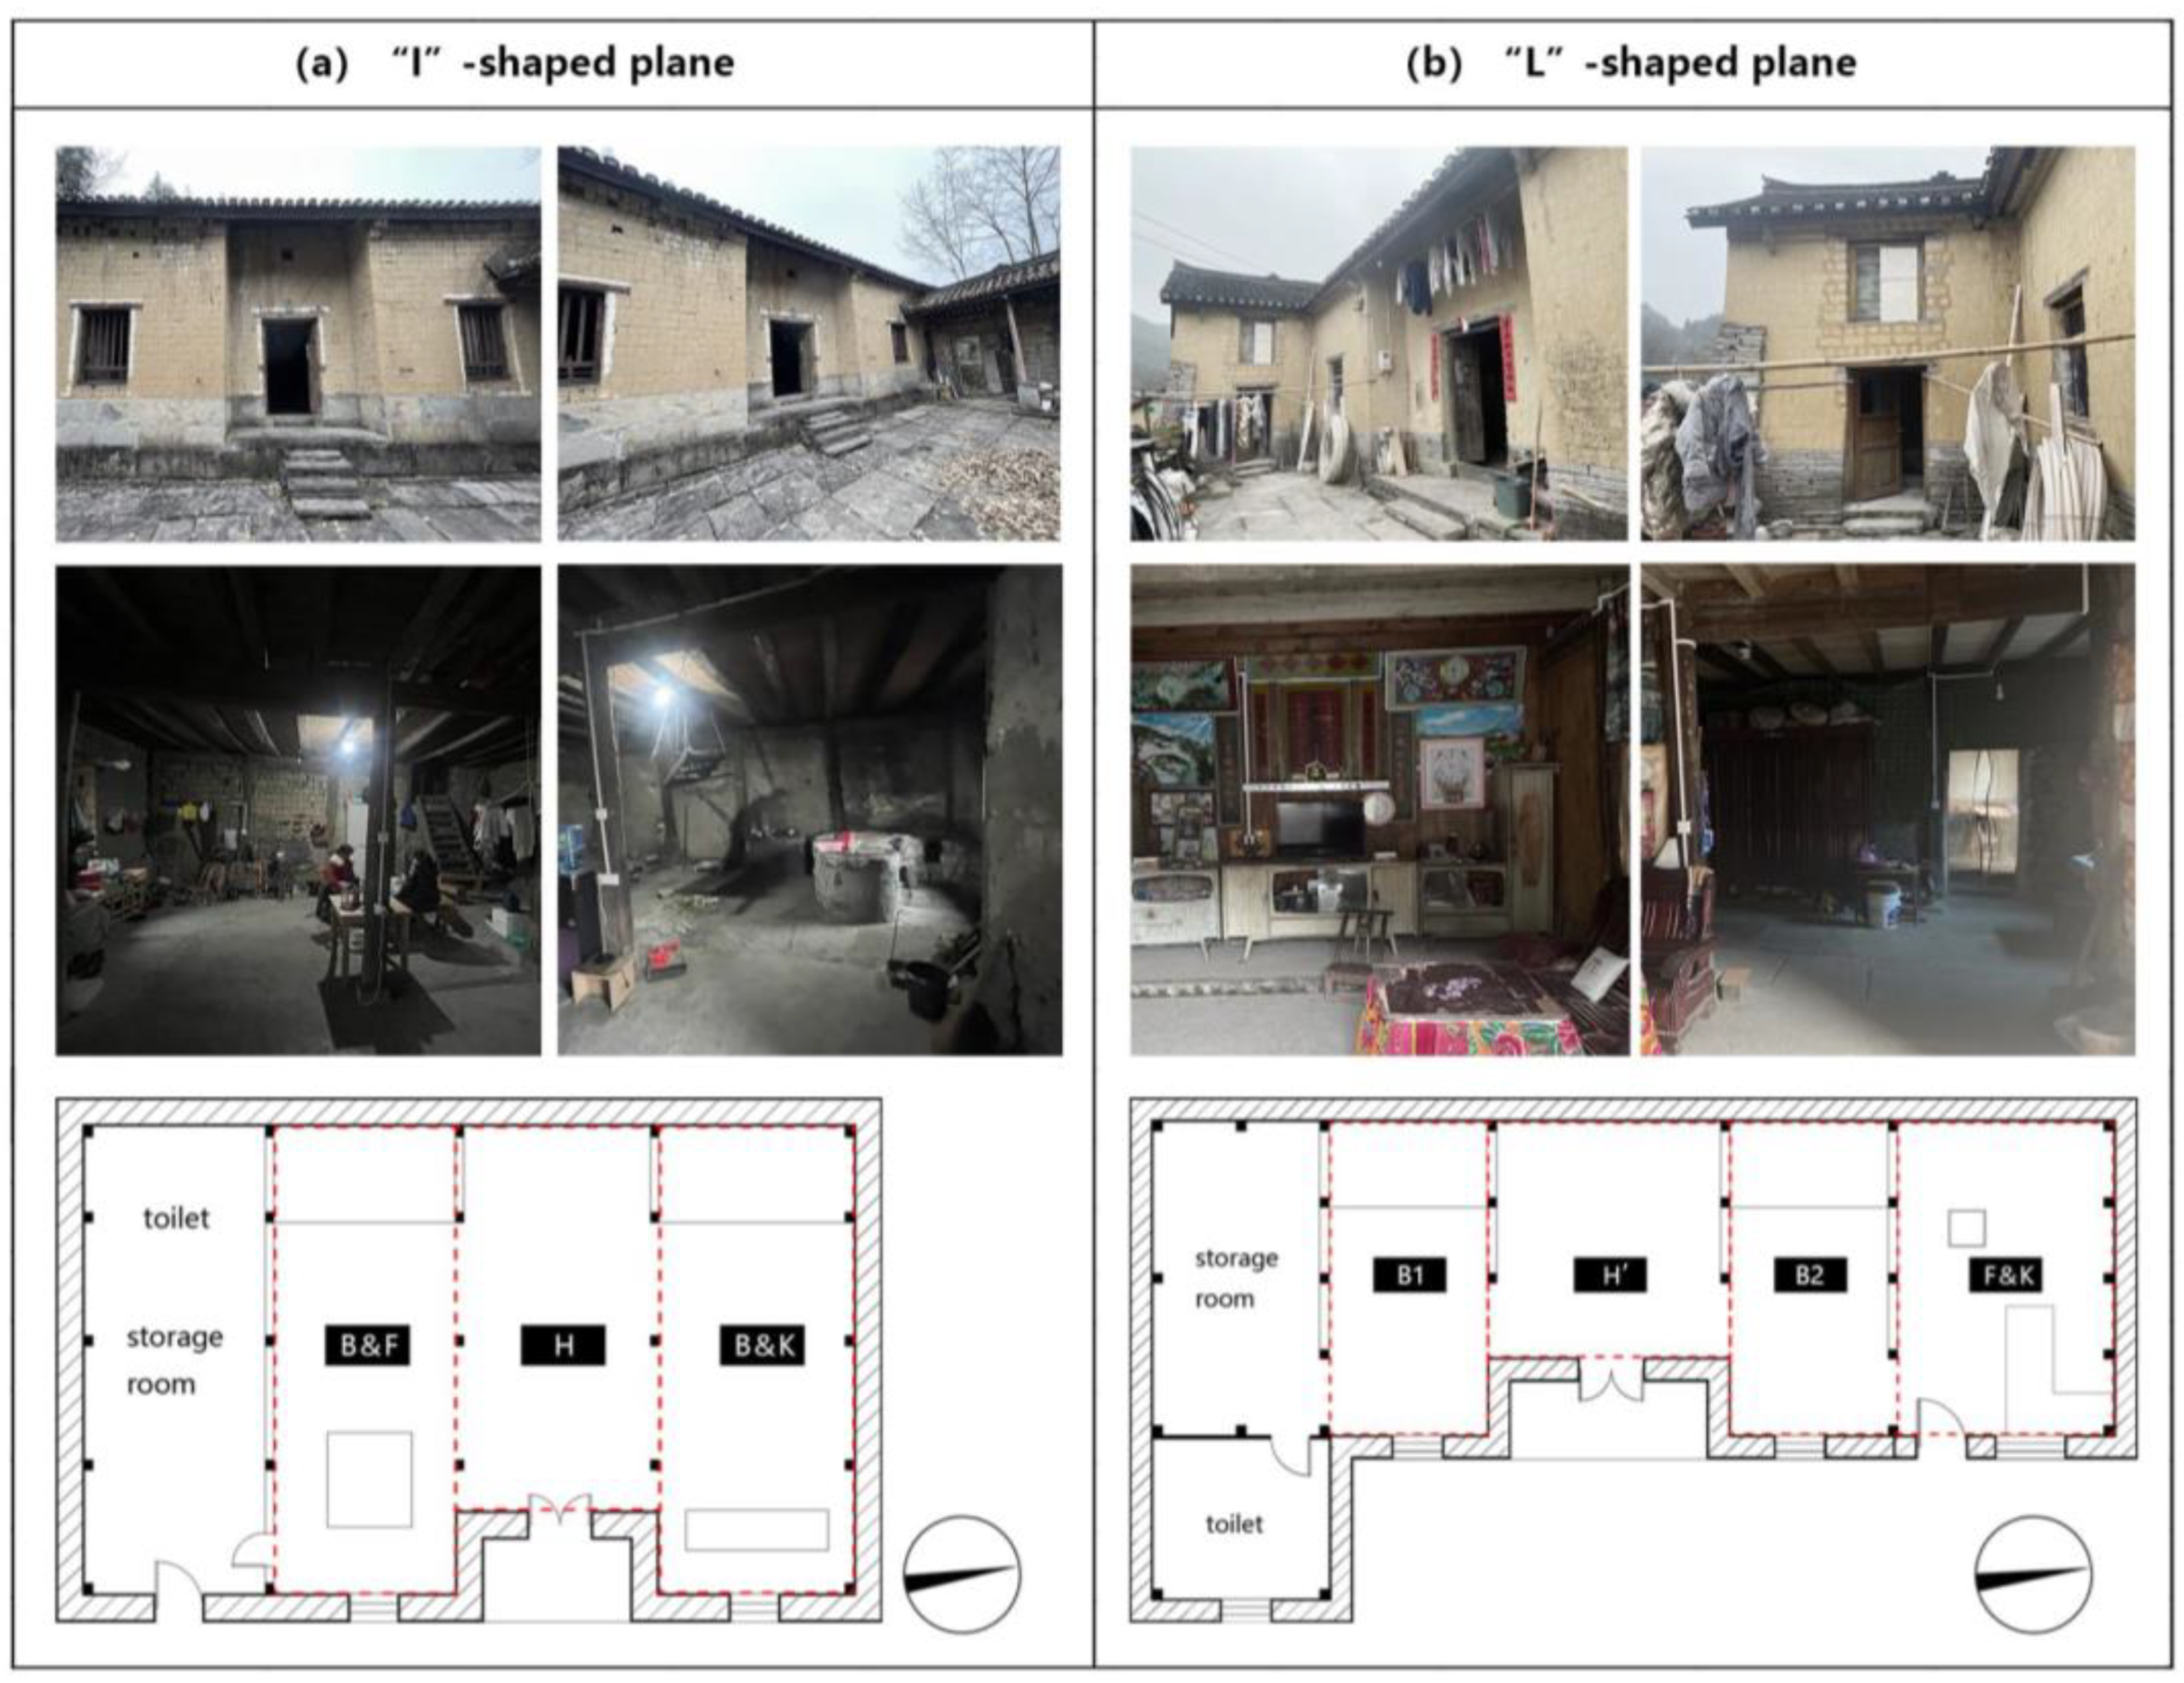
2. Research Object
3. Research Methods
3.1. Survey
3.2. Model Establishment and Validation
3.2.1. Modeling Process
- (1)
- There are long-term residents in the residence, and we can understand their visual task needs.
- (2)
- The dwellings have not been seriously damaged or constructed, and their basic appearance has been maintained.
- (3)
- The daylighting system of the residence is representative and can reflect and represent the daylighting situation of other residences in the village.
3.2.2. Validation
3.3. Circadian Evaluation System
- : circadian light
- : light source spectral irradiance distribution
- : melanopsin (corrected for crystalline lens transmittance)
- : S-cone fundamental
- : macular pigment transmittance
- : photopic luminous efficiency function
- : scotopic luminous efficiency function
- : half-saturation constant for bleaching rods = 6.5 W/m2
- = 0.2616
- = 0.7000
- = 3.3000
- : circadian light
- : corneal illuminance value
- : circadian spectral sensitivity function
- : spectral irradiance distribution
- : Spectral distance between two wavelengths
- : photopic visual sensitivity
- : sensitivity function of the short-wavelength cone
- : represents the blue-yellow channel response (positive for the ‘blue’ response and negative for the ‘yellow’ response)
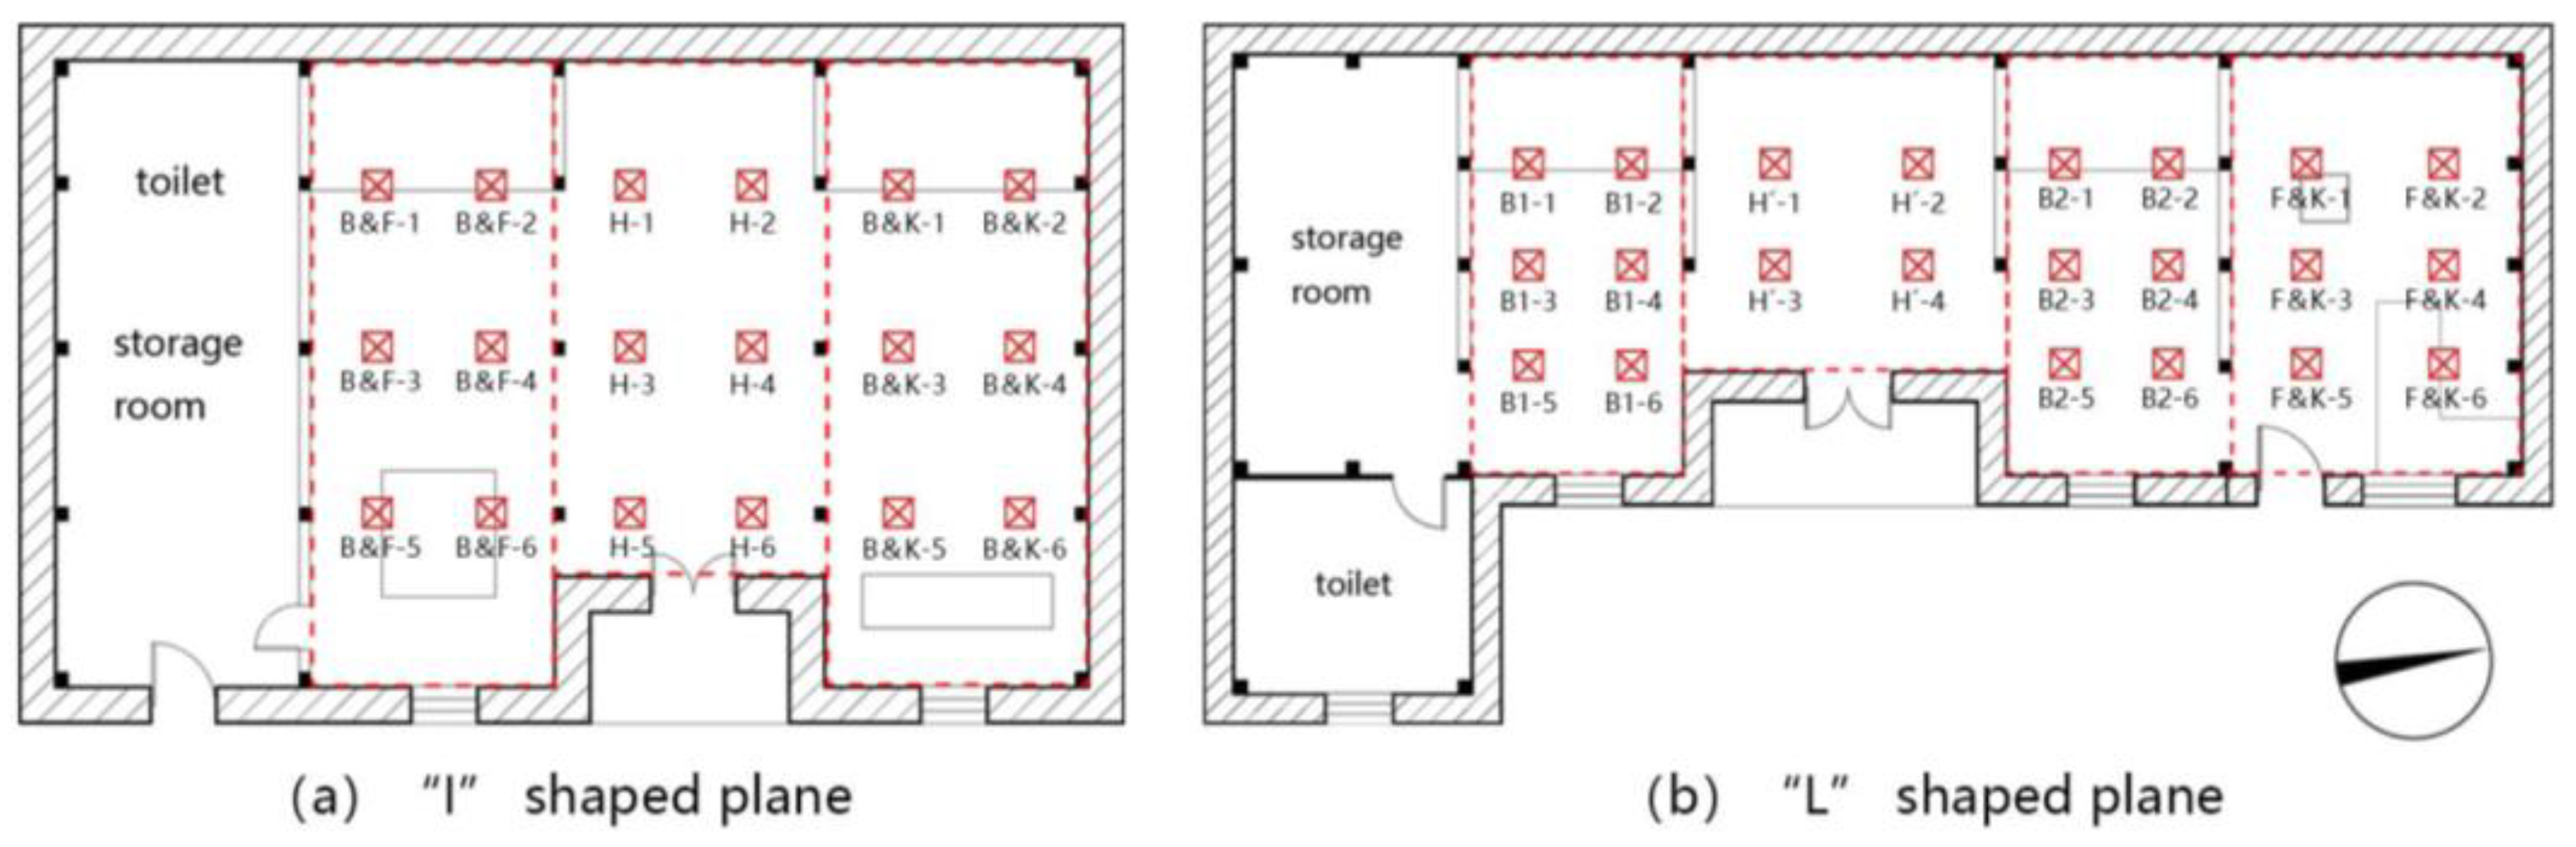
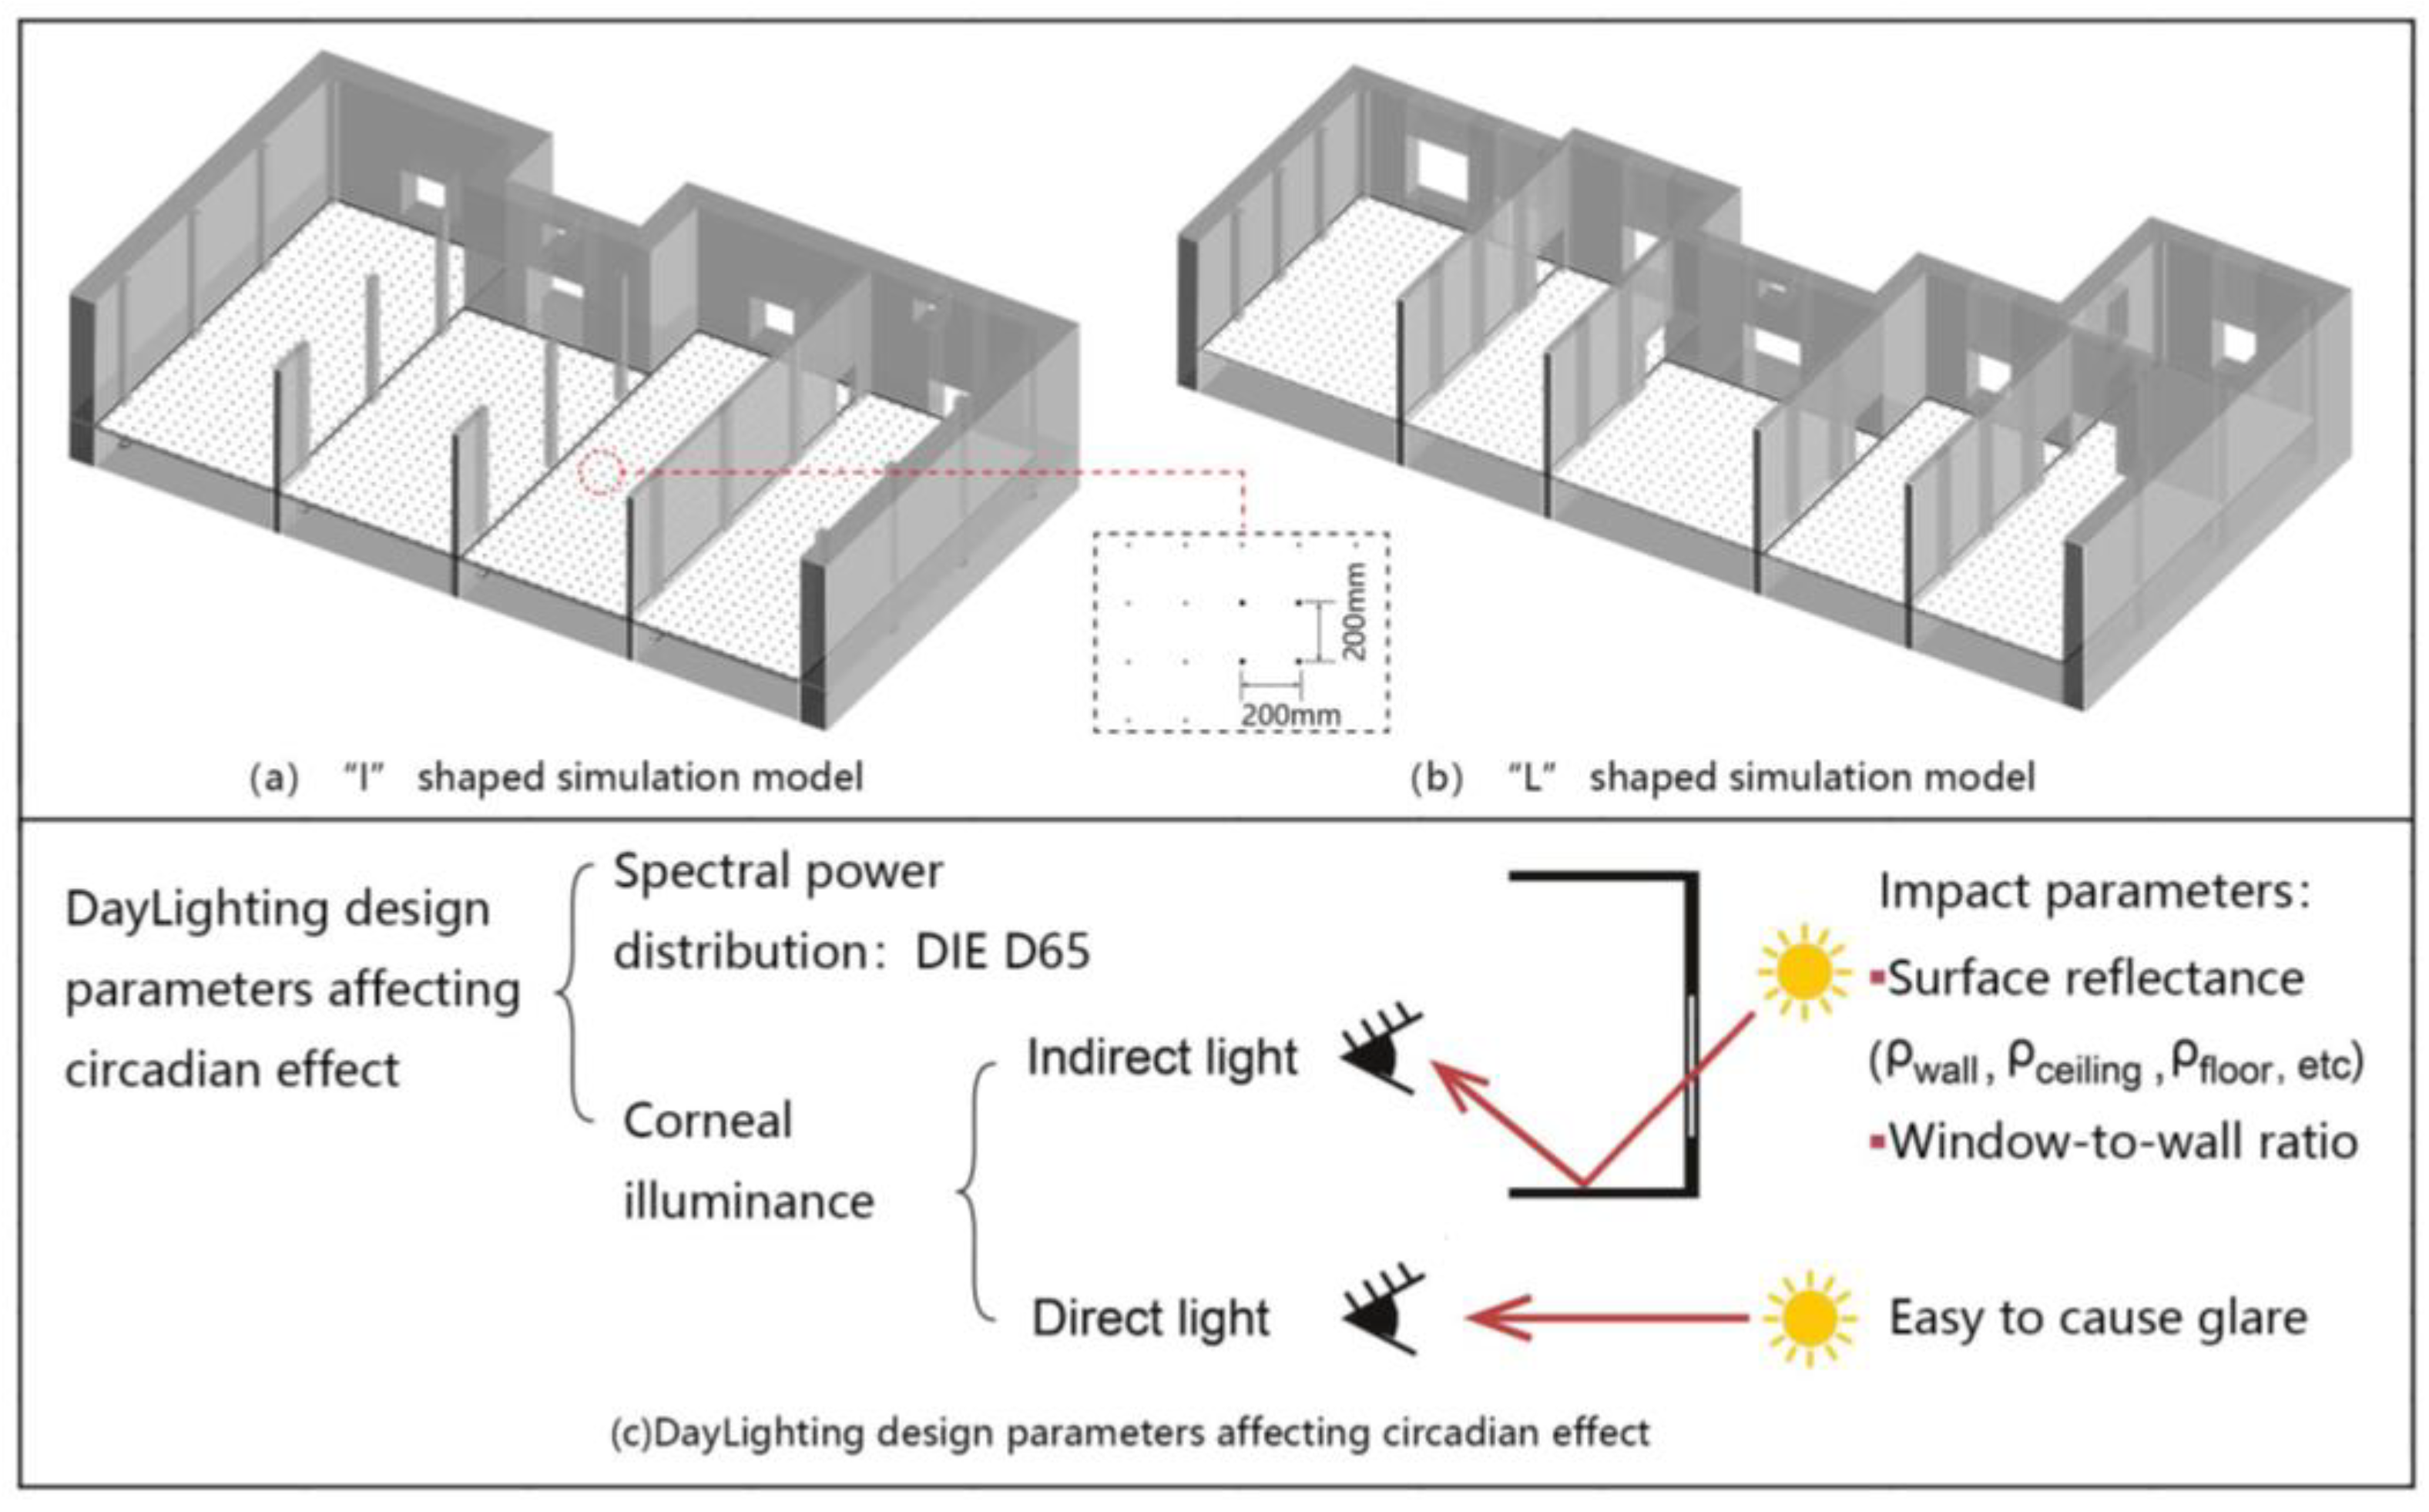
3.3.1. Corneal Illuminance Simulation
3.3.2. Circadian-Stimulus-Based WWR and Reflectance Design
- : corneal illuminance value
- : The direct portion of
- : The indirect portion of
- : A constant determined by factors such as sky condition, window direction, and total room surface area
- : Window-to-wall ratio
- : The reflectance of the surface where the first reflection occurs
- : The area-weighted average of room surface reflectance
3.3.3. Simplified Fitting Models
- : Circadian stimulus
- : The direct portion of CS
- : The indirect portion of CS
- : A constant determined by factors such as sky condition, window direction, and total room surface area
- : Window-to-wall ratio
- : The reflectance of the surface where the first reflection occurs
- : The area-weighted average of room surface reflectance.
4. Results and Discussion
4.1. Corneal Illuminance Simulation
4.1.1. Annual Corneal Illuminance Simulation
4.1.2. Point-in-Time Corneal Illuminance Simulation
4.2. Circadian-Stimulus-Based WWR and Reflectance Design, Validation of Simplified Fitting Models
4.2.1. Circadian-Stimulus-Based WWR and Reflectance Design
4.2.2. Validation of Simplified Fitting Models
- (1)
- The streamlined model exhibits a strong correlation with the experimental data, achieving an R2 (Goodness of Fit) ranging from 0.964 to 0.983 at a WWR of 0.3; for a WWR of 0.5, the R2 is between 0.954 and 0.976; and for a WWR of 0.7, it lies between 0.939 and 0.972.
- (2)
- Across six fittings, with a ρ of 0.2, the derived K·WWR (Equation (5)) values are 0.31, 0.33, 0.34, 0.32, with a minimal deviation of −4% and a maximal deviation of 5.3% from the mean. When ρ is set at 0.4, the resulting K·WWR values are 0.144, 0.145, 0.14, 0.141, showing a minimum deviation of −1.9% and a maximum of 2.9% from the average.
- (1)
- For L-type residences with a WWR of 0.3, if the first reflective surface has a reflectance of 0.2, the indoor surface’s weighted reflectance should exceed 0.57. With a reflectance of 0.4, it should be above 0.59. I-type residences may not meet these criteria.
- (2)
- With a WWR of 0.5, I-type residences require an indoor surface weighted reflectance above 0.52 when the first reflective surface has a 0.2 reflectivity, and above 0.53 when it is 0.4. L-type residences generally meet these requirements.
- (3)
- For a WWR of 0.7, I-type residences need an indoor surface weighted albedo over 0.33 with a first reflective surface albedo of 0.2, and over 0.35 with an albedo of 0.4. L-type residences satisfy these conditions.
5. Conclusions
- Assessment of the current indoor lighting conditions and circadian impact in traditional Miao dwellings in western Hunan. Seasonal variations had limited effects on the duration of the optimal circadian stimulus throughout the year. However, in winter, the CS significantly dropped, with an average CS < 0.14 in all units and even lower values in main activity areas, indicating challenges for elderly individuals in obtaining a sufficient circadian stimulus during winter.
- Implementation of a simplified fitting model to guide circadian design, with validation against simulation data from Climate Studio 1.9. This model primarily applies to the indirect circadian component and is suitable for daylighting scenarios. It provides a quick field tool for circadian design and promotes healthy circadian concepts.
- Exploration of different combinations of daylight conditions using Climate Studio daylighting software, involving indoor surface-weighted reflectance, first-reflection surface reflectance, and WWR for two types of traditional dwellings in simulations. The study provides dwellings parameter ranges required to achieve an appropriate circadian stimulus in traditional Miao dwellings in western Hunan.
- Highlighting the significance of indoor surface-weighted reflectance over WWR in improving the circadian stimulus. The super linear dependency of indirect circadian stimulation on indoor weighted reflectance implies that higher indoor reflectance can contribute significantly to circadian well-being, surpassing the impact of direct light. Moreover, changes in indoor weighted albedo primarily enhance the indirect component of corneal illuminance, aiding in glare reduction and avoiding window modifications, which would otherwise alter the traditional residential landscape. This approach facilitates a more uniform distribution of indoor circadian lighting, aligning with the unique characteristics of traditional Miao dwellings in western Hunan, characterized by substantial depth.
Author Contributions
Funding
Institutional Review Board Statement
Informed Consent Statement
Data Availability Statement
Acknowledgments
Conflicts of Interest
References
- Publicity Department of the CPC Central Committee Held a Press Conference on Measures and Achievements for High-Quality Development of Housing and Urban and Rural Development in the New Era. 2022. Available online: https://www.mohurd.gov.cn/xinwen/jsyw/202209/20220915_768000.html (accessed on 15 September 2023).
- Sun, J.; Peng, B.; Wang, C.C.; Chen, K.; Zhong, B.; Wu, J. Building displacement measurement and analysis based on UAV images. Autom. Constr. 2022, 140, 104367. [Google Scholar] [CrossRef]
- Bouzas, Ó.; Cabaleiro, M.; Conde, B.; Cruz, Y.; Riveiro, B. Structural health control of historical steel structures using HBIM. Autom. Constr. 2022, 140, 104308. [Google Scholar] [CrossRef]
- Fu, J.; Zhou, J.; Deng, Y. Heritage values of ancient vernacular residences in traditional villages in Western Hunan, China: Spatial patterns and influencing factors. Build. Environ. 2021, 188, 107473. [Google Scholar] [CrossRef]
- Xu, J.; Lu, Z.; Huo, X. The evolution and adaptive development of traditional dwelling in Southern Shaanxi, China. Environ. Sci. Pollut. Res. 2019, 26, 13914–13930. [Google Scholar] [CrossRef]
- Agnihotri, S. Greying China: Challenges and solutions. In Modern China; Routledge India: London, UK, 2019. [Google Scholar]
- Zhang, X. The Application of Spatial Information Technology in the Rural Elderly Care Model under the Strategy of “Building a Country with a Strong Transportation Network” in China. Transp. Res. Procedia 2022, 61, 481–486. [Google Scholar] [CrossRef]
- Zhang, M.; You, S.; Zhang, L.; Zhang, H.; Wang, Y. Dynamic Analysis of the Effects of Aging on China’s Sustainable Economic Growth. Sustainability 2023, 15, 5076. [Google Scholar] [CrossRef]
- Barron, G.C.; Laryea-Adjei, G.; Vike-Freiberga, V.; Abubakar, I.; Dakkak, H.; Devakumar, D.; Johnsson, A.; Karabey, S.; Labonté, R.; Legido-Quigley, H.; et al. Safeguarding people living in vulnerable conditions in the COVID-19 era through universal health coverage and social protection. Lancet Public Health 2022, 7, e86–e92. [Google Scholar] [CrossRef]
- Kuppusamy, P.P.; Bhatia, A.; Verma, A.; Shah, N.R.; Pratyush, P.; Shanmugarajan, V.; Kim, S.C.; Poongavanam, G.; Duraisamy, S. Accumulation of biomedical waste during the COVID-19 pandemic: Concerns and strategies for effective treatment. Environ. Sci. Pollut. Res. 2022, 29, 55528–55540. [Google Scholar] [CrossRef]
- Alvis, B.D.; Hughes, C.G. Physiology Considerations in Geriatric Patients. Anesth. Clin. 2015, 33, 447–456. [Google Scholar] [CrossRef] [PubMed]
- Emens, J.S.; Burgess, H.J. Effect of Light and Melatonin and Other Melatonin Receptor Agonists on Human Circadian Physiology. Sleep Med. Clin. 2015, 10, 435–453. [Google Scholar] [CrossRef] [PubMed]
- Blume, C.; Garbazza, C.; Spitschan, M. Effects of light on human circadian rhythms, sleep and mood. Somnologie 2019, 23, 147–156. [Google Scholar] [CrossRef]
- Boyce, P.R. Human Factors in Lighting; CRC Press: Boca Raton, FL, USA, 2014. [Google Scholar] [CrossRef]
- Jamrozik, A.; Clements, N.; Hasan, S.S.; Zhao, J.; Zhang, R.; Campanella, C.; Loftness, V.; Porter, P.; Ly, S.; Wang, S.; et al. Access to daylight and view in an office improves cognitive performance and satisfaction and reduces eyestrain: A controlled crossover study. Build. Environ. 2019, 165, 106379. [Google Scholar] [CrossRef]
- Westland, S.; Pan, Q.; Lee, S. A review of the effects of colour and light on non-image function in humans. Color. Technol. 2017, 133, 349–361. [Google Scholar] [CrossRef]
- St Hilaire, M.A.; Gooley, J.J.; Khalsa, S.B.S.; Kronauer, R.E.; Czeisler, C.A.; Lockley, S.W. Human phase response curve to a 1 h pulse of bright white light. J. Physiol. 2012, 590, 3035–3045. [Google Scholar] [CrossRef]
- Andersen, M.; Mardaljevic, J.; Lockley, S. A framework for predicting the non-visual effects of daylight—Part I: Photobiology—based model. Light. Res. Technol. 2012, 44, 37–53. [Google Scholar] [CrossRef]
- Dijk, D.-J.; Lockley, S.W. Invited Review: Integration of human sleep-wake regulation and circadian rhythmicity. J. Appl. Physiol. 2002, 92, 852–862. [Google Scholar] [CrossRef]
- Liu, M.; Shen, S.; Luo, X. The Application Strategy of Natural Light In Buildings For The Aged. Chin. Hosp. Archit. Equip. 2018, 19, 76–79. [Google Scholar]
- Burns, A.C.; Saxena, R.; Vetter, C.; Phillips, A.J.; Lane, J.M.; Cain, S.W. Time spent in outdoor light is associated with mood, sleep, and circadian rhythm-related outcomes: A cross-sectional and longitudinal study in over 400,000 UK Biobank participants. J. Affect. Disord. 2021, 295, 347–352. [Google Scholar] [CrossRef]
- Kim, S.J.; Lim, Y.C.; Suh, I.B.; Lee, J.H. Disrupted sleep maintenance is associated with altered circadian phase and phase angle in community-dwelling adults. Sleep Med. 2020, 73, 250–256. [Google Scholar] [CrossRef]
- Lee, J.; Ma, K.; Moulik, M.; Yechoor, V. Untimely oxidative stress in β-cells leads to diabetes—Role of circadian clock in β-cell function. Free Radic. Biol. Med. 2018, 119, 69–74. [Google Scholar] [CrossRef]
- Hamza, N.; Nagari, K. Assessment of Daylight in Relation to the Agitation Levels of People with Dementia. 2016. Available online: https://www.researchgate.net/publication/311101121 (accessed on 20 July 2023).
- Figueiro, M.; Brons, J.; Plitnick, B.; Donlan, B.; Leslie, R. Measuring circadian light and its impact on adolescents. Light. Res. Technol. 2011, 43, 201–215. [Google Scholar] [CrossRef]
- Karami, Z.; Golmohammadi, R.; Heidaripahlavian, A.; Poorolajal, J.; Heidarimoghadam, R. Effect of Daylight on Melatonin and Subjective General Health Factors in Elderly People. Iran. J. Public Health 2016, 45, 636–643. [Google Scholar]
- Onega, L.L.; Pierce, T.W.; Epperly, L. Effect of Bright Light Exposure on Depression and Agitation in Older Adults with Dementia. Issues Ment. Health Nurs. 2016, 37, 660–667. [Google Scholar] [CrossRef]
- Walker, W.H.; Walton, J.C.; DeVries, A.C.; Nelson, R.J. Circadian rhythm disruption and mental health. Transl. Psychiatry 2020, 10, 28. [Google Scholar] [CrossRef]
- Hung, S.-M.; Milea, D.; Rukmini, A.V.; Najjar, R.P.; Tan, J.H.; Viénot, F.; Dubail, M.; Tow, S.L.C.; Aung, T.; Gooley, J.J.; et al. Cerebral neural correlates of differential melanopic photic stimulation in humans. Neuroimage 2017, 146, 763–769. [Google Scholar] [CrossRef]
- Souman, J.L.; Tinga, A.M.; te Pas, S.F.; van Ee, R.; Vlaskamp, B.N.S. Acute alerting effects of light: A systematic literature review. Behav. Brain Res. 2018, 337, 228–239. [Google Scholar] [CrossRef]
- Babilon, S.; Beck, S.; Khanh, T. A field test of a simplified method of estimating circadian stimulus. Light. Res. Technol. 2022, 54, 459–473. [Google Scholar] [CrossRef]
- Wang, S.; Zhao, J. New prospectives on light adaptation of visual system research with the emerging knowledge on non-image-forming effect. Front. Built. Environ. 2022, 8, 1019460. [Google Scholar] [CrossRef]
- Busatto, N.; Mora, T.D.; Peron, F.; Romagnoni, P. Application of Different Circadian Lighting Metrics in a Health Residence. J. Daylighting 2020, 7, 13–24. [Google Scholar] [CrossRef]
- Mariana, G.; Figueiro, M.S.R. A Working Threshold for Acute Nocturnal Melatonin Suppression from “White” Light Sources used in Architectural Applications. J. Carcinog. Mutagen. 2013, 4, 150–155. [Google Scholar]
- Lucas, R.J.; Peirson, S.N.; Berson, D.M.; Brown, T.M.; Cooper, H.M.; Czeisler, C.A.; Figueiro, M.G.; Gamlin, P.D.; Lockley, S.W.; O’hagan, J.B.; et al. Measuring and using light in the melanopsin age. Trends Neurosci. 2014, 37, 1–9. [Google Scholar] [CrossRef]
- Rea, M.; Figueiro, M.; Bierman, A.; Hamner, R. Modelling the spectral sensitivity of the human circadian system. Light. Res. Technol. 2012, 44, 386–396. [Google Scholar] [CrossRef]
- Rea, M.; Figueiro, M. Light as a circadian stimulus for architectural lighting. Light. Res. Technol. 2018, 50, 497–510. [Google Scholar] [CrossRef]
- Figueiro, M.; Nagare, R.; Price, L. Non-visual effects of light: How to use light to promote circadian entrainment and elicit alertness. Light. Res. Technol. 2018, 50, 38–62. [Google Scholar] [CrossRef]
- Dai, Q.; Huang, Y.; Hao, L.; Lin, Y.; Chen, K. Spatial and spectral illumination design for energy-efficient circadian lighting. Build. Environ. 2018, 146, 216–225. [Google Scholar] [CrossRef]
- Konis, K. Field evaluation of the circadian stimulus potential of daylit and non-daylit spaces in dementia care facilities. Build. Environ. 2018, 135, 112–123. [Google Scholar] [CrossRef]
- Acosta, I.; Leslie, R.; Figueiro, M. Analysis of circadian stimulus allowed by daylighting in hospital rooms. Light. Res. Technol. 2017, 49, 49–61. [Google Scholar] [CrossRef]
- Cai, W.; Yue, J.; Dai, Q.; Hao, L.; Lin, Y.; Shi, W.; Huang, Y.; Wei, M. The impact of room surface reflectance on corneal illuminance and rule-of-thumb equations for circadian lighting design. Build. Environ. 2018, 141, 288–297. [Google Scholar]
- Potočnik, J.; Cadena, J.D.B.; Košir, M.; Poli, T. Occupant perception of spectral light content variations due to glazing type and internal finish. IOP Conf. Ser. Earth Environ. Sci. 2019, 296, 012033. [Google Scholar] [CrossRef]
- Potočnik, J.; Košir, M. In Situ Determined Circadian and Visual Daylighting Potential of an Office. In Proceedings of the International Conference on Sustainable Built Environment, SBE19 Seoul, Seoul, Republic of Korea, 12–13 December 2019. [Google Scholar] [CrossRef]
- Yao, Q.; Cai, W.; Li, M.; Hu, Z.; Xue, P.; Dai, Q. Efficient circadian daylighting: A proposed equation, experimental validation, and the consequent importance of room surface reflectance. Energy Build. 2020, 210, 109784. [Google Scholar] [CrossRef]
- Stroner, M.; Kremen, T.; Braun, J.; Urban, R.; Blistan, P.; Kovanic, L. Comparison of 2.5D Volume Calculation Methods and Software Solutions Using Point Clouds Scanned before and after Mining. Acta Montan. Slovaca 2019, 24, 296–306. [Google Scholar]
- Thacker, B.H.; Doebling, S.W.; Hemez, F.M.; Anderson, M.C.; Pepin, J.E.; Rodriguez, E.A. Concepts of Model Verification and Validation; Los Alamos National Lab.: Los Alamos, NM, USA, 2004. [Google Scholar] [CrossRef]
- EnergyPlus, The U.S. Department of Energy. Available online: https://energyplus.net (accessed on 21 July 2023).
- Sui, G.; Liu, J.; Leng, J.; Yu, F. Daylighting performance assessment of traditional skywell dwellings: A case study in Fujian, China. J. Build. Eng. 2023, 68, 106028. [Google Scholar] [CrossRef]
- GB/T 5699-2017; Method of Daylighting Measurements. Standards Press of China: Beijing, China, 2017. (In Chinese)
- GB 10000-1988; Human Dimensions of Chinese Adults. Standards Press of China: Beijing, China, 2021. (In Chinese)
- Quek, G.; Jakubiec, J.A. Calibration and Validation of Climate-Based Daylighting Models Based on One-Time Field Measurements: Office Buildings in the Tropics. Leukos 2021, 17, 75–90. [Google Scholar] [CrossRef]
- Jones, N.L.; Reinhart, C.F. Experimental validation of ray tracing as a means of image-based visual discomfort prediction. Build. Environ. 2017, 113, 131–150. [Google Scholar] [CrossRef]
- Bellia, L.; Seraceni, M. A proposal for a simplified model to evaluate the circadian effects of light sources. Light. Res. Technol. 2014, 46, 493–505. [Google Scholar] [CrossRef]
- Nagare, R.; Rea, M.S.; Plitnick, B.; Figueiro, M.G. Nocturnal Melatonin Suppression by Adolescents and Adults for Different Levels, Spectra, and Durations of Light Exposure. J. Biol. Rhythm. 2019, 34, 178–194. [Google Scholar] [CrossRef]
- Acosta, I.; Navarro, J.; Sendra, J.J. Towards an Analysis of Daylighting Simulation Software. Energies 2011, 4, 1010–1024. [Google Scholar] [CrossRef]
- Dai, Q.; Cai, W.; Shi, W.; Hao, L.; Wei, M. A proposed lighting-design space: Circadian effect versus visual illuminance. Build. Environ. 2017, 122, 287–293. [Google Scholar] [CrossRef]
- Dai, Q.; Cai, W.; Hao, L.; Shi, W.; Wang, Z. Spectral optimisation and a novel lighting-design space based on circadian stimulus. Light. Res. Technol. 2018, 50, 1198–1211. [Google Scholar] [CrossRef]
- EN 12464-1-2011; Lighting of Work Places. Standards Press of CEN: Brussels, Belgium, 2010.
- GB 50189-2005; Design Standard for Energy Efficiency of Public Buildings. Standards Press of China: Beijing, China, 2005. (In Chinese)


| Material | Position | Reflectance | Material | Position | Reflectance |
|---|---|---|---|---|---|
| Rammed earth | Upper end of exterior wall | 21.7% | China Fir | Structure | 21.1% |
| Stone | Lower end of exterior wall | 25.3% | Yellow paint wood | Ceiling | 29.6% |
| Red paint wood | Column, Interior wall | 19.6% | Cement | Interior flooring | 18.1% |
| Grey Tile | Roof | 7.3% | Brown paint wood | Door | 18.3% |
| Zone | Season | Avg. CS<0.14 | Avg. CS0.14–0.3 | Avg. CS0.3–0.5 | Avg. CS0.5–0.7 |
|---|---|---|---|---|---|
| B&F | Spring | 58.15% | 27.63% | 11.38% | 2.84% |
| Summer | 49.96% | 32.08% | 13.25% | 4.71% | |
| Autumn | 68.46% | 21.56% | 8.72% | 1.26% | |
| Winter | 73.74% | 19.16% | 6.24% | 0.86% | |
| Cv | 16.96% | 23.33% | 30.97% | 72.43% | |
| H | Spring | 31.36% | 40.49% | 20.85% | 7.30% |
| Summer | 20.71% | 46.85% | 22.52% | 9.92% | |
| Autumn | 43.97% | 35.76% | 14.06% | 6.21% | |
| Winter | 56.55% | 27.70% | 13.15% | 2.60% | |
| Cv | 40.68% | 21.40% | 26.80% | 46.63% | |
| B&K | Spring | 55.75% | 32.83% | 9.26% | 2.16% |
| Summer | 48.05% | 35.42% | 12.45% | 4.08% | |
| Autumn | 63.46% | 24.58% | 10.04% | 1.92% | |
| Winter | 75.72% | 14.49% | 9.20% | 0.59% | |
| Cv | 19.42% | 35.17% | 14.88% | 65.75% | |
| B-1 | Spring | 39.48% | 40.24% | 15.80% | 4.48% |
| Summer | 26.15% | 44.34% | 22.60% | 6.91% | |
| Autumn | 49.45% | 32.97% | 13.57% | 4.01% | |
| Winter | 69.29% | 19.56% | 8.73% | 2.42% | |
| Cv | 39.42% | 31.74% | 37.97% | 41.72% | |
| H’ | Spring | 23.66% | 28.45% | 33.46% | 14.43% |
| Summer | 16.29% | 25.36% | 40.83% | 17.52% | |
| Autumn | 27.55% | 35.82% | 27.02% | 9.61% | |
| Winter | 29.21% | 40.73% | 26.27% | 3.79% | |
| Cv | 23.78% | 21.41% | 21.24% | 52.85% | |
| B-2 | Spring | 31.47% | 39.02% | 23.70% | 5.81% |
| Summer | 25.74% | 38.60% | 26.23% | 9.43% | |
| Autumn | 41.52% | 30.19% | 23.04% | 5.25% | |
| Winter | 60.47% | 19.04% | 17.72% | 2.77% | |
| Cv | 38.30% | 29.56% | 15.77% | 47.26% | |
| F&K | Spring | 21.65% | 40.80% | 31.03% | 6.52% |
| Summer | 17.34% | 48.29% | 24.71% | 9.66% | |
| Autumn | 19.32% | 39.03% | 32.92% | 8.73% | |
| Winter | 34.45% | 36.21% | 26.18% | 3.16% | |
| Cv | 33.25% | 12.56% | 13.56% | 41.17% | |
| Schematic plan | 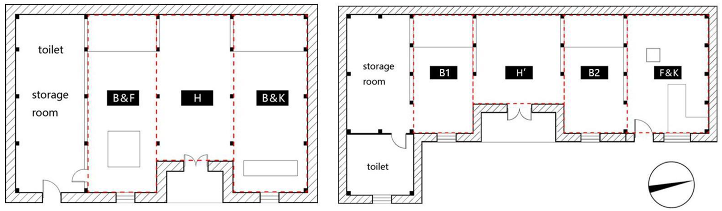 | ||||
| Zone Number | Window Area [m2] | Wall Area [m2] | Window-to-Wall Ratio | Daylighting Mode | ρ | ρ′ | Geometry Center-to-Window Distance [m] | Avg. Evor [lux] | Avg. CS |
|---|---|---|---|---|---|---|---|---|---|
| B&F-N | 1.1 | 16.8 | 0.07 | Direct | 18.10% | 21.87% | 2.80 | 30 | 0.06 |
| B&F-S | Indirect | 7.55 | 6 | 0.01 | |||||
| H-N | 3.6 | 19.5 | 0.18 | Direct | 18.10% | 21.88% | 2.10 | 61 | 0.12 |
| H-S | Indirect | 6.20 | 9 | 0.02 | |||||
| B&K-N | 1.1 | 16.8 | 0.07 | Direct | 18.10% | 21.86% | 2.80 | 29 | 0.06 |
| B&K-S | Indirect | 7.55 | 5 | 0.01 | |||||
| B1-N | 1.2 | 14.0 | 0.09 | Direct | 18.10% | 21.89% | 2.10 | 50 | 0.10 |
| B1-S | Indirect | 5.20 | 11 | 0.02 | |||||
| H´-N | 3.6 | 22.0 | 0.16 | Direct | 18.10% | 22.12% | 1.25 | 96 | 0.18 |
| H´-S | Indirect | 3.80 | 28 | 0.06 | |||||
| B2-N | 1.2 | 13.6 | 0.09 | Direct | 18.10% | 21.89% | 2.10 | 64 | 0.13 |
| B2-S | Indirect | 5.20 | 12 | 0.03 | |||||
| F&K-N | 4.2 | 20.1 | 0.21 | Direct | 18.10% | 22.57% | 2.10 | 158 | 0.27 |
| F&K-S | Indirect | 5.20 | 28 | 0.06 | |||||
| N/F plane division |  | ||||||||
| Distribution of overall corneal illuminance | 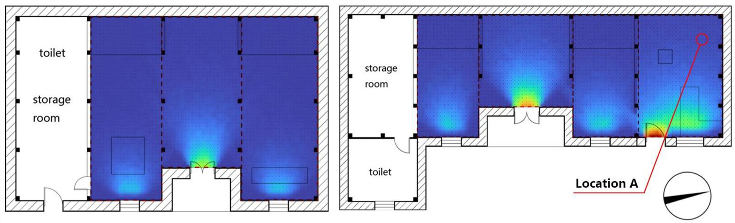 | ||||||||
| Room Surface Reflectance | |
|---|---|
| Item | Range |
| Ceiling | 0.7 to 0.9 |
| Walls | 0.5 to 0.8 |
| Floor | 0.2 to 0.4 |
| Window-to-Wall Ratio | |
| Item | Range |
| Window-to-wall ratio | 0 to 0.7 |
| Parameters | WWR | S Walls | S Window | ST-Walls | S Floor | S Ceiling | S Total |
|---|---|---|---|---|---|---|---|
| I: current value | 11% | 53.1 | 5.8 | 178.6 | 112.8 | 112.8 | 404.2 |
| Preset of type I | 30% | 53.1 | 15.9 | 168.5 | 112.8 | 112.8 | 394.1 |
| 50% | 53.1 | 26.6 | 157.8 | 112.8 | 112.8 | 383.4 | |
| 70% | 53.1 | 37.2 | 147.2 | 112.8 | 112.8 | 372.8 | |
| L: current value | 15% | 69.7 | 10.2 | 193.2 | 93.6 | 93.6 | 380.4 |
| Preset of type L | 30% | 69.7 | 20.9 | 182.5 | 93.6 | 93.6 | 369.7 |
| 50% | 69.7 | 34.9 | 168.5 | 93.6 | 93.6 | 355.7 | |
| 70% | 69.7 | 48.8 | 154.6 | 93.6 | 93.6 | 341.8 |
| Parameters | Avg. ρ Wall | Avg. ρ Floor | Avg. ρ Ceiling | “I” Shaped Plane | “L” Shaped Plane | ||||
|---|---|---|---|---|---|---|---|---|---|
| WWR = 0.3 ρ/(1 − ρ′) | WWR = 0.5 ρ/(1 − ρ′) | WWR = 0.7 ρ/(1 − ρ′) | WWR = 0.3 ρ/(1 − ρ′) | WWR = 0.5 ρ/(1 − ρ′) | WWR = 0.7 ρ/(1 − ρ′) | ||||
| Preset parameters | 0.40 | 0.20 | 0.40 | 0.30 | 0.30 | 0.30 | 0.31 | 0.31 | 0.31 |
| 0.40 | 0.20 | 0.60 | 0.33 | 0.33 | 0.33 | 0.33 | 0.33 | 0.33 | |
| 0.40 | 0.20 | 0.80 | 0.37 | 0.37 | 0.37 | 0.36 | 0.37 | 0.37 | |
| 0.40 | 0.40 | 0.40 | 0.67 | 0.67 | 0.67 | 0.67 | 0.67 | 0.67 | |
| 0.40 | 0.40 | 0.60 | 0.74 | 0.74 | 0.74 | 0.73 | 0.73 | 0.73 | |
| 0.40 | 0.40 | 0.80 | 0.82 | 0.83 | 0.84 | 0.80 | 0.81 | 0.82 | |
| 0.60 | 0.20 | 0.40 | 0.35 | 0.35 | 0.34 | 0.36 | 0.36 | 0.35 | |
| 0.60 | 0.20 | 0.60 | 0.39 | 0.39 | 0.38 | 0.40 | 0.40 | 0.39 | |
| 0.60 | 0.20 | 0.80 | 0.44 | 0.44 | 0.43 | 0.44 | 0.44 | 0.44 | |
| 0.60 | 0.40 | 0.40 | 0.78 | 0.77 | 0.77 | 0.80 | 0.79 | 0.78 | |
| 0.60 | 0.40 | 0.60 | 0.88 | 0.87 | 0.87 | 0.89 | 0.88 | 0.88 | |
| 0.60 | 0.40 | 0.80 | 1.00 | 1.00 | 1.00 | 1.00 | 1.00 | 1.00 | |
| 0.80 | 0.20 | 0.40 | 0.41 | 0.40 | 0.40 | 0.44 | 0.43 | 0.42 | |
| 0.80 | 0.20 | 0.60 | 0.47 | 0.46 | 0.45 | 0.50 | 0.49 | 0.48 | |
| 0.80 | 0.20 | 0.80 | 0.54 | 0.53 | 0.52 | 0.57 | 0.56 | 0.55 | |
| 0.80 | 0.40 | 0.40 | 0.93 | 0.92 | 0.90 | 0.99 | 0.97 | 0.95 | |
| 0.80 | 0.40 | 0.60 | 1.08 | 1.06 | 1.05 | 1.14 | 1.12 | 1.10 | |
| 0.80 | 0.40 | 0.80 | 1.27 | 1.26 | 1.25 | 1.33 | 1.31 | 1.29 | |
| Simulation model |  | ||||||||
Disclaimer/Publisher’s Note: The statements, opinions and data contained in all publications are solely those of the individual author(s) and contributor(s) and not of MDPI and/or the editor(s). MDPI and/or the editor(s) disclaim responsibility for any injury to people or property resulting from any ideas, methods, instructions or products referred to in the content. |
© 2024 by the authors. Licensee MDPI, Basel, Switzerland. This article is an open access article distributed under the terms and conditions of the Creative Commons Attribution (CC BY) license (https://creativecommons.org/licenses/by/4.0/).
Share and Cite
Liu, J.; Li, Z.; Zhang, Z.; Xie, L.; Wu, J. Evaluation and Optimization of Interior Circadian Daylighting Performance for the Elderly in Traditional Dwellings: A Case Study in Western Hunan, China. Sustainability 2024, 16, 3563. https://doi.org/10.3390/su16093563
Liu J, Li Z, Zhang Z, Xie L, Wu J. Evaluation and Optimization of Interior Circadian Daylighting Performance for the Elderly in Traditional Dwellings: A Case Study in Western Hunan, China. Sustainability. 2024; 16(9):3563. https://doi.org/10.3390/su16093563
Chicago/Turabian StyleLiu, Jixin, Zhe Li, Zuopeng Zhang, Liang Xie, and Jiade Wu. 2024. "Evaluation and Optimization of Interior Circadian Daylighting Performance for the Elderly in Traditional Dwellings: A Case Study in Western Hunan, China" Sustainability 16, no. 9: 3563. https://doi.org/10.3390/su16093563