
Sustainable Development of the Real Economy: Supply Chain Finance and Enterprise Financialization
The School of Economics, Anhui University, No. 111 Jiulong Road, Economic and Technological Development Zone, Hefei 230601, China
*
Author to whom correspondence should be addressed.
Sustainability 2024, 16(9), 3574; https://doi.org/10.3390/su16093574
Submission received: 21 March 2024
/
Revised: 16 April 2024
/
Accepted: 23 April 2024
/
Published: 24 April 2024
Abstract
:Supply chain finance, as an important financial instrument supporting the sustainable development of the real economy, has attracted significant attention. In this paper, research is conducted on 3181 non-financial listed enterprises in the A-share market in China from 2012 to 2021. Multiple regression analysis is adopted to examine the relationship between supply chain finance and enterprise financialization, as well as the impact of the former on the latter and the underlying mechanisms at play. The research findings indicate that the supply chain finance model, led by core enterprises, tends to exacerbate enterprise financialization in China. The significant resource dependence of small- and medium-sized enterprises (SMEs) on core enterprises acts as a moderating variable for supply chain finance and enterprise financialization. This dependence amplifies the stimulus of supply chain finance on the “financialization” of enterprises, demonstrates a pronounced moderating effect within state-owned enterprises, and strengthens over time when the core enterprises possess information advantages. The findings articulated herein contribute to the scholarly discourse, offering insights into the improvement of supply chain finance and the advancement of the real economy’s sustainable development via financial services. A good supply chain finance model should align with the requirements for the development of China’s real economy. It should provide not only financial assistance to enterprises but also foster a virtuous cycle within the industrial chain and encourage industrial production over financial investment.
1. Introduction
Supply chain finance, as an innovative financial product, plays a significant role in alleviating the financing constraints of small- and medium-sized enterprises (SMEs). It provides cash flow support for enterprises in the supply chain and optimizes their working capital [1,2]. To better achieve the goal of financial backing for high-quality and sustainable economic development, pertinent authorities in China have enacted a compendium of policies to support and standardize supply chain finance. This is exemplified by the landmark document issued in 2019, titled Guiding Opinions of the General Office of the China Banking and Insurance Regulatory Commission on Advancing Supply Chain Finance to Support the Real Economy, as well as 23 new regulations for regulating the development of supply chain finance jointly issued by eight ministries and commissions in 2020, including the People’s Bank of China and the Ministry of Industry and Information Technology of the People’s Republic of China. These policies demonstrate China’s commitment and support to the advancement of supply chain finance. Backed by the policies aimed at supporting and standardizing supply chain finance issued by national government departments and central institutions, local governments and their respective institutions have started to follow up and launch innovative policies. For example, in 2022, the Sichuan–Chongqing region rolled out and implemented a suite of policies on supply chain finance to ease the challenges faced by SMEs. Regions such as Hunan, Guangzhou, and Guizhou are actively seeking additional strategies to offer supply chain finance services to weak industrial chains, thus promoting the development of the real economy. These examples underscore that supply chain finance has become an important instrument for financial sustenance in economic development.
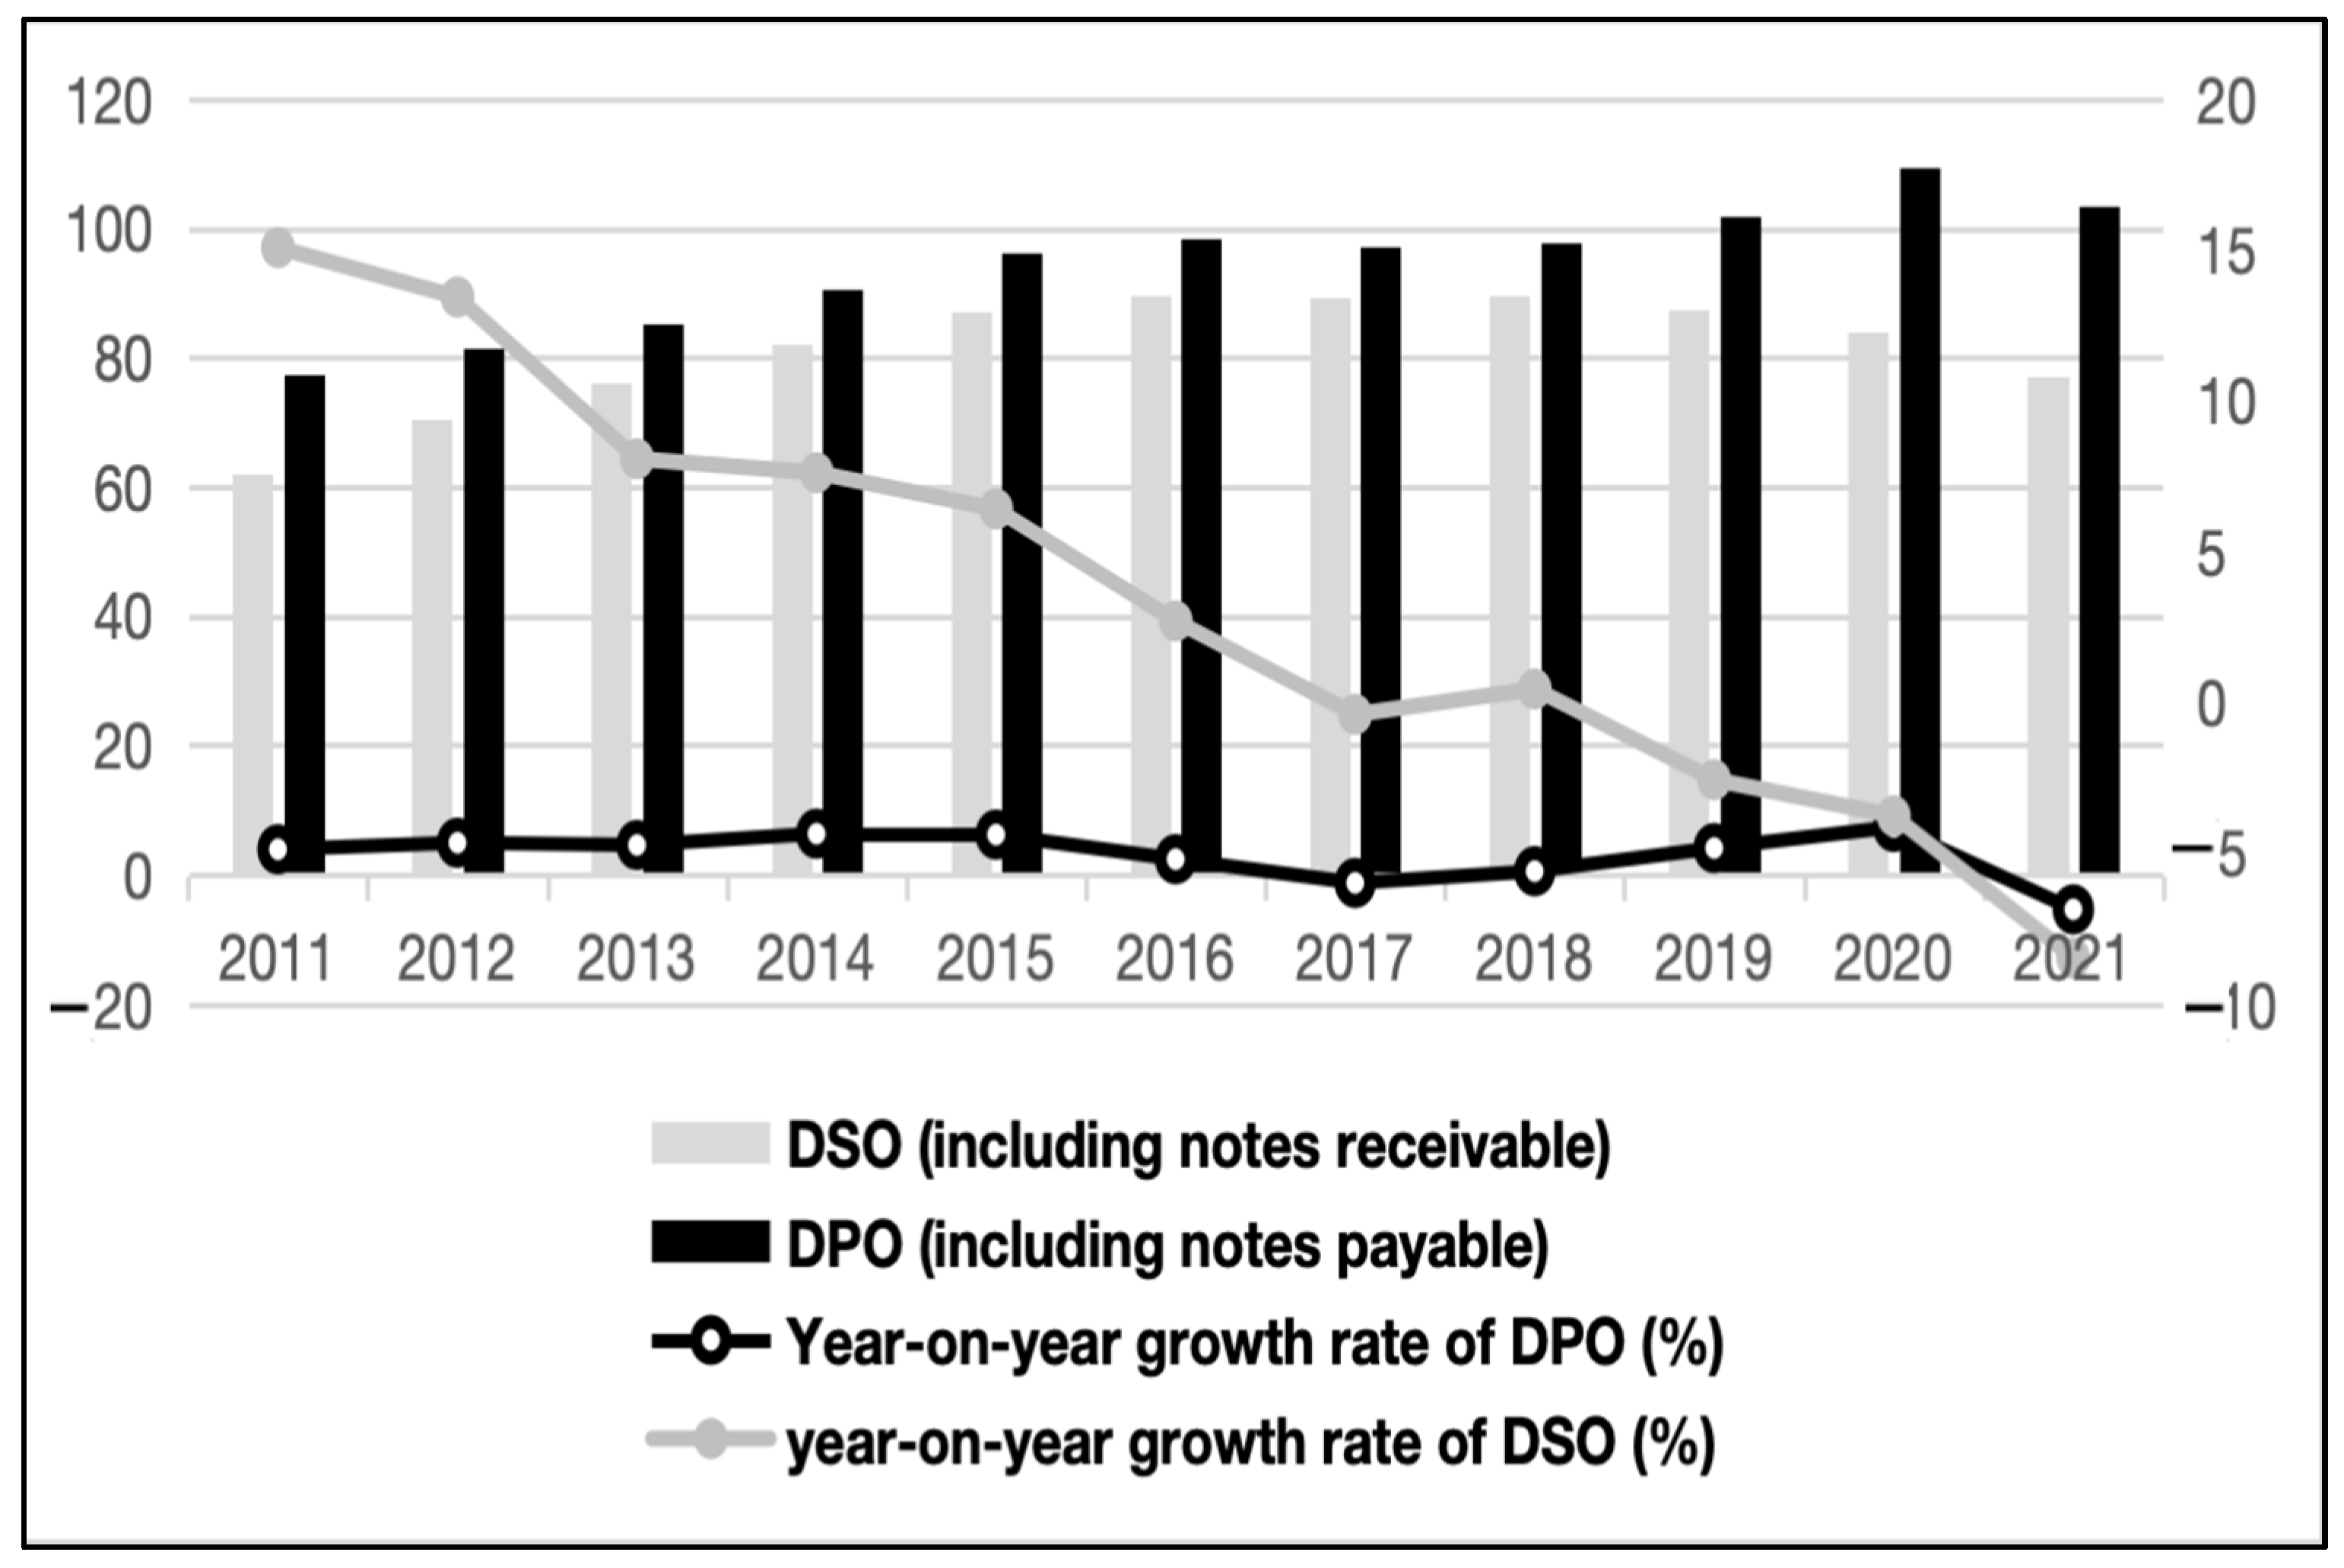
In the context of this policy, supply chain finance defaults have been occurring one after another, exemplified by cases such as the Shanghai steel trade fraud, the Guangdong pulp case, and the Qingdao non-ferrous metal case. While supply chain finance has expanded the financing channels of SMEs, there are still many challenges to be addressed for supply chain finance to further promote the sustainable development of the real economy. Presently, the key issue within China’s supply chain finance lies in designing financing solutions centered on core enterprises, which are yet harmonized with the entire supply chain. However, these core enterprises take advantage of this situation to extend the payable period to upstream and downstream suppliers, thereby reducing their financial costs but inadvertently increasing the financial pressure on SMEs. To more clearly demonstrate this point, an examination of the primary operating capacity data from China’s listed companies reveals (The data are obtained from the annual financial data of all A-share listed companies (excluding ST and financial industry companies) from 2011 to 2021. The figures are created based on information from the iFinD database.) two notable trends. Firstly, the cash conversion cycle (CCC) of core enterprises in supply chain finance shortens due to the extension of days payable outstanding (DPO) (see Figure 1). Secondly, while the days sales outstanding (DSO) of core enterprises exhibit a predominantly downward trend, the DPO continues to rise (see Figure 2). This implies that supply chain finance injects more liquidity into core enterprises, while non-listed companies situated upstream and downstream in the supply chain, especially SMEs, are confronted with increasing cash flow pressure. Core enterprises, already having sufficient cash, may invest more funds in the financial market driven by profit-seeking motives, whereas cash-strapped SMEs find it increasingly difficult to obtain funds for production. This vicious cycle prevents supply chain finance from effectively lubricating the real economy by alleviating liquidity pressures for SMEs and instead exacerbates the financialization of non-financial enterprises.
In the extant body of scholarly work, considerable attention has been devoted to the nexus between supply chain finance and enterprise financialization. However, the literature is scant regarding the exploration of bottlenecks in the development of supply chain finance and its adverse effects on enterprises and even the real economy. Moreover, there is even less research directly examining the impact of supply chain finance on the “financialization” of enterprises. Many domestic and foreign scholars have focused on the benefits that supply chain finance confers upon enterprise development [3,4,5,6,7,8]. Firstly, supply chain finance not only improves the financial performance of enterprises and reduces financing costs but also reduces the risk of bankruptcy for core companies and stabilizes the supply chain. Secondly, compared to the information asymmetry in ordinary bank–enterprise credit relations, supply chain finance can utilize rich transaction information and logistics data among supply chain organizations to optimize inventory management and operational efficiency. Numerous papers have indicated that supply chain finance primarily manifests in the form of trade credit, including deferred payment, discounted cash flow, and date terms, thus providing better financial support for upstream and downstream enterprises in the supply chain. More importantly, new technologies such as digitization and blockchain have gradually penetrated supply chain finance, promoting the construction of trust relationships among enterprises and continuous improvement in production processes and business management. It is evident that most of these scholars’ research revolves around the alleviation of financing constraints on enterprises by supply chain finance, attempting to demonstrate that supply chain finance can support the development of the real economy.
However, some scholars have observed, from different perspectives, that credit support via supply chain finance models is not universally accessible to all enterprises, even those operating in the same supply chain [9]. Moreover, the relief of financial pressure on enterprises may develop in the opposite direction and harm the sustainable development of the real economy. For example, although supply chain finance can expand financing channels for enterprises, it may lead to the continuous lengthening of the credit chain between commercial banks and real-economy-based enterprises, resulting in the accumulation of financial risks. Additionally, supply chain relationship factors, including the bargaining power of buyers, dependence, and trust, can also affect the efficiency of supply chain finance implementation [10], where entities in a position of power within the supply chain may leverage their advantages to compel the adoption of alternative financial solutions [11]. Based on this inference, the alleviation of financing constraints on enterprises by supply chain finance may also contribute to the expansion of enterprise financialization in China, which is detrimental to the sustainable development of the real economy.
In light of the two contrasting perspectives, it becomes imperative to empirically examine whether supply chain finance exacerbates the financialization of non-financial enterprises and to delve deeper into the pathways through which supply chain finance influences enterprise financialization. As listed companies are generally core enterprises in the supply chain, this paper takes non-financial listed companies in the A-share market from 2012 to 2021 as the sample to empirically examine the impact of supply chain finance on enterprise financialization and their interdependence.
The first principal contribution of this paper is the examination of how the selection of supply chain finance models influences the real economy through a microeconomic lens. This investigation not only augments the corpus of theoretical research in the domain of supply chain finance but also offers strategic guidance and potential paths to promote financial innovation and development in China.
Secondly, this paper confronts the challenges and bottlenecks in the advancement of both supply chain finance and enterprises and examines the compatibility of supply chain finance with China’s current real economy, which has practical implications for the pertinent authorities to formulate policies that effectively utilize financial services to promote a virtuous cycle in the industrial chain.
Thirdly, based on the findings of this paper, regulatory authorities and financial institutions should not only promote financial innovation but also pay attention to the distortions in investment and production decisions of micro-enterprises caused by financial innovation. Moreover, there is a need for vigilance against the intensification of structural disequilibrium between the real economy and the fictitious economy.
2. Literature Review and Research Hypothesis
2.1. Literature Review
The adverse effect of enterprise financialization is mainly manifested in the excessive allocation of resources by real-economy-based enterprises towards finance and real estate investments, resulting in a lack of funds for equipment upgrades as well as product research and innovation [12,13]. More and more Chinese enterprises are increasingly inclined towards financial investment, while neglecting physical production and investment [14]. Excessive financialization will impede the sustainable development of the real economy [15]. Many scholars have attributed the motivation for increasing financial asset allocation by enterprises to precautionary savings motives and profit-seeking motives [16,17].
However, these perspectives from the previous literature are not sufficient to explain the internal factors driving the financialization of enterprises through supply chain finance. Firstly, supply chain finance can effectively alleviate the financial pressure on enterprises [3,18], reducing the need for excessive acquisition of financial assets driven by precautionary savings motives. Secondly, the collateral for supply chain finance in China mainly consists of accounts receivables, advance payments, and inventories generated based on real trade transactions, and the funds emanating from these transactions are exclusively allocated for the settlement of sales receipts. In the event that enterprises prioritize the pursuit of returns from financial investments over participation in production and sales, the commercial credit relied upon by supply chain finance would inversely correlate with the accrual of corporate financial assets and high levels of commercial credit and financial asset holdings of enterprises would not occur simultaneously [19]. Considering the existing literature, one point that has been overlooked by many scholars is that the research on enterprise financialization primarily focuses on listed companies, while the alleviation of financing constraints through supply chain finance is targeted at SMEs. Only by focusing on SMEs can the research provide a reasonable explanation for the internal motives driving enterprise financialization through supply chain finance.
Furthermore, several scholars have discovered that trade credit is associated with the dependency between buyers and suppliers, which makes buyers transfer financial pressure to the upstream supply chain [20]. Resource dependence is an important factor in maintaining trust and cooperative relationships among enterprises in the supply chain [21]. However, the resource dependence in supply chain finance is unbalanced in the core-enterprise-led supply chain finance model. Core enterprises have advantages in information, rights, resource allocation, etc., a situation that leads to the strong, one-sided resource dependence of SMEs on core enterprises.
The imbalanced dependence on the supply chain results in the redistribution of profits and primary control rights along the industrial chain, thereby engendering a disproportionate accrual of these advantages in favor of predominant enterprises. In the core-enterprise-led supply chain finance model, the excessive dependence of upstream and downstream enterprises on core enterprises causes profits to tilt toward core enterprises unproportionally. Firstly, the severe imbalance in resource dependence leads to a greater concentration of profits in the downstream of the industrial chain. Secondly, the asymmetric dependence weakens the bargaining power of upstream and downstream members in the supply chain, and the control rights in the industrial chain, disproportionately aggregated among core enterprises, force SMEs to give up a large amount of commercial credit. The impacts of the supply chain bargaining effect on financing constraints in China are readily apparent. The original purpose of supply chain financing was to alleviate financing constraints through collaboration between suppliers and customers. However, due to the dominant position of core enterprises in the supply chain and their enhanced bargaining power, many supply chain financing initiatives have been implemented without significantly easing financing constraints for Chinese enterprises, particularly non-state entities [22].
2.2. Research Hypothesis
2.2.1. Supply Chain Finance and Enterprise Financialization
In general, listed companies are considered core enterprises in supply chain finance. Based on the logic of the “flow-based profitability model” proposed by Yuchao P. (2022) [19], enterprises can utilize the commercial credit obtained from the supply chain to invest in financial assets and “cash the flow”. This logic is based on the behavior of listed companies continually delaying payment of accounts payable, which extends the credit chain. Stated differently, listed companies “cash the flow” of financial assets at the expense of prolonging the CCC of upstream and downstream SMEs in the supply chain under the guise of alleviating the financing constraints on SMEs, yet in reality pursuing profit maximization. From this perspective, the development of supply chain finance contributes to the trend of financialization among listed companies. On the other hand, the risk-averse preference of commercial banks also plays a role in promoting this trend. To reduce the risks associated with supply chain finance, commercial banks tend to rely on core enterprises in the supply chain for credit business. Core enterprises have extensive access to information about other enterprises in the supply chain [23]. They often play the role of intermediaries by leveraging their information advantages in supply chain financing, simultaneously alleviating the financing constraints on SMEs and extracting significant profits from the financial industry. The core enterprises’ departure from traditional bank intermediation can be considered as participation in shadow banking activities [24]. Thus, the core-enterprise-led supply chain finance model may be an important factor contributing to the exacerbation of enterprise financialization through supply chain finance.
To sum up, the following assumptions are made:
H1.
In the core-enterprise-led supply chain finance model, supply chain finance exacerbates the financialization of non-financial enterprises.
2.2.2. Supply Chain Finance, Resource Dependence, and Enterprise Financialization
At a deeper level, the high resource dependence of SMEs on core enterprises is mainly manifested in two internal aspects:
Firstly, there is excessive supply chain concentration. A high degree of supply chain concentration means not having or having limited access to key resources and being in a disadvantaged bargaining position, which can bring unfavorable contractual terms and funding costs for enterprises [25]. In terms of the upstream–downstream relationship in the supply chain, core enterprises may leverage their power and status to compel SMEs into participating in supply chain financing plans. When there is a high degree of supply chain concentration, SMEs also have to hold relationship-specific assets with high conversion costs [26] and will face high conversion costs in times of crisis [27]. In contrast to the adverse effects of resource dependence on SMEs, a lower supply chain concentration of core enterprises can bring them better performance. A lower supply chain concentration of core enterprises means higher dependence on SMEs in the upstream and downstream of the supply chain, giving core enterprises stronger bargaining power. Core enterprises can leverage this situation to extend the payable period [28] or lower product quality and increase product prices to earn more profits [29]. Based on this, resource dependence is likely to drive the intensification of enterprise financialization through supply chain finance. Specifically, the higher the supply chain concentration, the higher the financial investment of enterprises. With the advantage of resource dependence, core enterprises can allocate financial assets by occupying supply chain assets [19]. When an enterprise wields influence over the entirety of the industrial chain, it is inclined to escalate its financial investment, driven by profit-seeking motives. To sum up, the following assumptions are made:
H2.
The higher the supply chain concentration and the stronger the resource dependence of SMEs on core enterprises, the stronger the role of supply chain finance in enterprise financialization.
Secondly, core enterprises have information advantages in the principal–agent relationship. There are two types of supply chain finance models: commercial bank led and core enterprise led. In the former model, there are triple principal–agent relationships among commercial banks, core enterprises, and SMEs, and these relationships are relatively independent. In this case, serious information asymmetry often arises in the principal–agent relationship. Commercial banks, for risk transfer purposes, rely on core enterprises to screen and review SMEs and frequently delegate their credit origination authority to core enterprises, forming a supply chain finance model led by core enterprises [23]. This change in the principal–agent relationship of supply chain finance (see Figure 3) amplifies the rights of core enterprises, shifts the resource dependence of SMEs, and makes SMEs more reliant on core enterprises. According to principal–agent theory, the principal–agent relationship in the core-enterprise-led supply chain finance model is weak, unstable, and prone to moral hazards due to the incompleteness of contractual relationships, unequal responsibilities of various actors in supply chain finance, and inconsistent interests. Even with the introduction of reciprocal preferences, profits in the supply chain still flow towards core enterprises, and the expected revenue of SMEs has significant uncertainty, making it impossible to achieve Pareto optimality in such a principal–agent model. Therefore, from the perspective of information asymmetry, the high resource dependence that accompanies the information advantages of core enterprises will also drive the intensification of enterprise financialization through supply chain finance. To sum up, the following assumptions are made:
H3.
The stronger the core enterprises’ information advantages and the stronger the resource dependence of SMEs on core enterprises, the stronger the role of supply chain finance in enterprise financialization.
3. Research Design
3.1. Sample Selection
The sample for this paper consists of non-financial listed enterprises in the A-share market in China from 2012 to 2021, totaling 3181 enterprises. The industries of this research cover manufacturing, information transmission, and software and information technology services, as well as wholesale and retail trade. Among these enterprises, 2146 are in the manufacturing sector, accounting for 67.4% of the total. In terms of ownership structure, there are both state-owned enterprises and non-state-owned enterprises, with 1036 being state-owned enterprises, accounting for 32.5% of the total. Data on enterprise financialization, supply chain finance, and related financial information were obtained from the RoyalFlush iFinD database, while data on supplier and customer concentration are sourced from the CSMAR database. In 2005, Shenzhen Development Bank, which is now known as PingAn Bank, introduced extensive supply chain finance products, marking the early stages of the development of supply chain finance in China. In 2012, the Ministry of Commerce of PRC began to gradually promote commercial factoring pilot projects. The improvement of internal and external environments has made this period a mature and rapidly developing stage for supply chain finance. Consequently, the sample chosen for this paper within the specified timeframe offers a more accurate representation of the impact of the development of supply chain finance on enterprise financialization. The original data is processed as follows: first, based on the 2012 industry classification guidelines for listed companies by the China Securities Regulatory Commission, companies in the financial and real estate industries are excluded; second, listed companies with ST or *ST marks are excluded; third, enterprise samples with severe data missingness are excluded; fourth, enterprise samples with less than five observations are excluded to eliminate noisy data; fifth, a 1% winsorization is performed on continuous variables to eliminate the interference of extreme values. Upon completion of the aforementioned procedures, this study amassed a comprehensive dataset encompassing 27,537 firm–year observations.
3.2. Description of Variables
3.2.1. Response Variable: Enterprise Financialization
This paper adopts the measurement of enterprise financialization (Fe) from the perspective of asset allocation, following the research of Demir F. (2009) [30] and Song, J. (2015) [31]. Fe is defined as the ratio of financial assets to total assets. Considering that the sample data spans the period before and after the implementation of the new accounting standards in 2019, the definition of enterprise financialization is defined separately for the pre-and post-change periods of the new accounting standards:
Under the old accounting standards, Fe1 = financial assets/total assets, where financial assets include trading financial assets, derivative financial assets, redemptory financial assets for sale, non-current assets due within one year, loans and advances, available-for-sale financial assets, held-to-maturity investments, interest receivable, dividends receivable, long-term equity investments, other non-current assets, and investment properties.
Under the new accounting standards, Fe1 = financial assets/total assets, where financial assets include trading financial assets, debt investments, other debt investments, interest receivable, other equity instrument investments, other non-current financial assets, dividends receivable, and investment properties.
3.2.2. Core Explanatory Variable: Supply Chain Finance
According to the existing literature, there are currently two methods to measure supply chain finance. The first method, used by Wangxin Y., et al. (2017) [32], measures supply chain finance by calculating the ratio of short-term borrowings and notes payable to total assets. The second method, used by Zhang T. (2019) [4], Cho W. (2019) [21], and Pirttilä M. (2020) [33], et al., uses the CCC as a proxy variable to measure the relationship between supply chain finance and firm financial performance. Based on the development of commercial credit and trade credit theories, existing theories and practices have shown the close relationship between supply chain finance and the inventories, accounts receivable, accounts payable, and cash flow management of enterprises. The computation of the CCC is determined by aggregating the DSO and the days sales of inventory (DSI) and then subtracting the DPO. It represents the enterprise’s need for short-term debt financing and is an important factor in studying the internal financing of enterprises [34]. Considering that enterprise financialization focuses on financial management, it is reasonable to use the CCC as a proxy variable to measure the relationship between supply chain finance and enterprise financialization. To standardize the data, this paper defines that: the degree of supply chain finance development (Scf) = 1 − CCC/the turnover days of total assets. This means that the lower the proportion of the CCC to the turnover days of total assets, the higher the degree of supply chain finance development.
3.2.3. Moderating Variable: Resource Dependence
Since the resource dependence of SMEs on core enterprises in the supply chain is mainly derived from excessive supply chain concentration and the information advantages of core enterprises, proxy variables for resource dependence are selected from the perspectives of supply chain concentration and the information advantages of core enterprises. This is performed to more accurately measure the moderating effect of resource dependence.
- (1)
- Supply chain concentration (Please note that some data on supply chain resource dependence are missing, so the sample data where the resource dependence is missing due to the simultaneous absence of the proportion of purchases from the top five suppliers and the proportion of sales to the top five customers are excluded. When the resource dependence is missing due to either the absence of the proportion of purchases from the top five suppliers or the absence of the proportion of sales to the top five customers, it is marked as “0”, indicating that no data is produced. After the above screening process, a total of 24,580 observations are obtained.)
While enterprises rely on external resources, they need to be aware of the pressures brought about by dependency. According to Porter’s five forces model, when core enterprises have numerous suppliers and customers, they possess strong bargaining power in the supply chain and enjoy resource and information advantages in supply chain finance. The strength of relationships between upstream and downstream enterprises in the supply chain can influence the functioning of supply chain finance. A lower supply chain concentration of core enterprises indicates that a core enterprise has a larger number of suppliers and customers, which means it has stronger bargaining power. Therefore, when the supply chain concentration of core enterprises is lower, SMEs in the upstream and downstream have a higher degree of resource dependence on the core enterprises. Utilizing the methodology proposed by Patatoukas (2012) [35], the supply chain concentration may be quantified by calculating half of the combined proportion of purchases from the top five suppliers and sales from the top five customers, as reported in the annual financial statements of listed companies. The lower the supply chain concentration of core enterprises, the stronger the resource dependence of SMEs on core enterprises. For ease of understanding, the reciprocal of the supply chain concentration of core enterprises is used as a proxy variable to measure the resource dependence of SMEs.
- (2)
- Information advantages of core enterprises
The extent to which a company discloses information to the public can to some extent reflect the degree of information symmetry in the supply chain. The stronger the information advantages possessed by core enterprises in the supply chain, the higher the willingness of the core enterprises to disclose information and the higher the supply chain transparency. A higher transparency level indicates a lower degree of information asymmetry in the supply chain. In this case, banks are also inclined to favor core enterprises in promoting the implementation of supply chain finance, forming a principal–agent model dominated by the core enterprises. Drawing on the approach of Xiaoyun G. (2022) [36], supply chain transparency (Tran_cy) can be measured by the number of the top five suppliers and the top five customers explicitly disclosed by listed companies. This transparency measure (Tran_cy) serves as a proxy variable for resource dependence. It only counts the number of companies whose names are specifically disclosed and does not include vague references (such as “Supplier A”, “Customer B”, “Company X”, etc.). The higher the value, the higher the supply chain transparency of core enterprises, indicating the stronger dependence of SMEs on the core enterprises.
3.2.4. Control Variables
In addition to the main explanatory variables, several control variables that may affect enterprise financialization are included in the basic econometric model to reduce omitted variable bias. The following control variables are used: firm size, financial leverage, revenue scale, ownership concentration, CEO duality, net profit growth rate, and capital intensity. Fixed effects are controlled for firms and years. The detailed definitions of the variables are shown in Table 1.
3.3. Model Construction
To test hypothesis H1, this paper constructs the following regression model:
In Equation (1), Fei,t represents the dependent variable “Enterprise Financialization”, Scfi,t represents the core explanatory variable “Supply Chain Finance”, and Controlsi,t represents a series of control variables, including firm size, financial leverage, revenue scale, ownership concentration, CEO duality, net profit growth rate, and capital intensity. The selection of control variables has been described in detail in the literature review. i denotes the sample, t denotes time, α0 is the constant term, α1 and α2 represent parameters to be estimated, Firm and Year represent firm and year fixed effects, respectively, and εi,t is the random error term that varies across regions and time. In the literature on listed companies, most studies use mixed regression methods to control year and industry fixed effects. However, employing fixed effects models for firms, industries, and years at the same time can cause significant issues with multicollinearity. Considering these factors, a panel regression analysis is conducted using a two-way fixed effects model that controls for firm and year fixed effects. Moreover, all regressions use robust standard errors at the firm level to control for heteroscedasticity and potential autocorrelation issues.
3.4. Empirical Results
3.4.1. Descriptive Statistical Analysis
Table 2 presents the descriptive statistics of the main variables. The standard deviations of the main response variable, “Enterprise financialization”, and the core explanatory variable, “Supply chain finance”, are 0.1 and 0.18, respectively. This indicates that the data is dispersed and exhibits varying degrees of differences. The mean and maximum levels of financialization for non-financial enterprises are 0.07 and 0.52, respectively, indicating significant disparity in the allocation of financial assets among these enterprises, with only a small number exhibiting high levels of financial asset allocation. The average level of supply chain finance is 0.82, with a maximum of 1.24 (exceeding 1), indicating that certain enterprises extend their accounts payable turnover days and utilize suppliers’ funds through supply chain finance, which aligns with the economic reality. Therefore, conducting regression analysis on the sample is feasible.
3.4.2. Baseline Regression Results
Table 3 presents the baseline regression results. The first and second columns show the results without and with the inclusion of control variables, respectively. The regression coefficients of Scf are 0.0427 and 0.0390, indicating that Scf is significantly positive at the 1% significance level regardless of the inclusion of control variables. This suggests that supply chain finance positively intensifies the level of financial asset allocation of enterprises, supporting the expectation of hypothesis H1.
3.4.3. Endogeneity Issues and Robustness Tests
Enterprise financialization may affect the development of supply chain finance, indicating that there is a possibility of reverse causality in the model. Additionally, sample data with fewer than five observations are excluded to accurately estimate the impact of the core-enterprise-led supply chain finance model on enterprise financialization. However, this selective sample may include important core enterprises after the removal of noisy data, leading to concerns about sample selection bias. Therefore, the instrumental variable (IV) method and Heckman’s two-step method are used to address the potential endogeneity issues. Robustness tests are also conducted by replacing the response variable, replacing the core explanatory variable, and expanding the sample size.
- (1)
- Instrumental variable (IV) method
Following the approach of X. Zhou (2020) [37], the average supply chain finance level of other enterprises in the same industry and year is selected as an IV. Since the actions of individual enterprises cannot influence the entire industry but they are directly correlated with the explanatory variable, this IV satisfies the conditions of “relevance” and “exogeneity”. Columns (1) and (2) of Table 4 list the results of the two-stage least squares (2SLS) regression. In the first-stage regression, the IV is significantly positive at the 1% significance level and the F-statistic is greater than 10, indicating the absence of a weak IV. After potential endogeneity issues are controlled, the correlation coefficient of Scf in Fe1 remains significantly positive at the 1% significance level, which is consistent with the previous results.
- (2)
- Heckman two-step method
Generally, the scale of supply chain finance of core enterprises is higher than that of non-core enterprises. A sample selection equation for the scale of supply chain finance is constructed accordingly, and the estimated inverse Mills ratio (IMR) is introduced as a control variable in the regression equation. The regression model is as follows:
In general, banks mainly consider the financial scale and nature of enterprises when selecting core enterprises. In the sample selection equation, firm size in the previous period, financial leverage in the previous period, and the nature of enterprises are included as explanatory variables for estimating IMR. In the second-stage results, IMR is significant at the 1% significance level, indicating the presence of sample selection bias to some extent. The core explanatory variable remains significantly positive and its deviation from the baseline regression coefficient is small.
- (3)
- Replacement of dependent variables
In the robustness test, “investment properties” are not counted as part of the enterprise’s financial assets and Fe2 is used in place of Fe1. Column (1) in Table 5 presents the regression results after the response variable is replaced. The results show that Scf remains significantly positive at the 1% significance level after the response variable is replaced.
- (4)
- Replacement of core explanatory variables
Following the approach of Wangxin Y., et al. [32], Scf2 = (short-term borrowings + notes payable)/total assets at the end of the period, and Scf2 is used in place of the core explanatory variable Scf. Column (2) in Table 5 presents the regression results after the core explanatory variable is replaced. The results show that the coefficient of supply chain finance remains significantly positive after the core explanatory variable is replaced, which is consistent with the previous results.
- (5)
- Expansion of the sample size
For the robustness of the results, the previously excluded noisy data with fewer than five observations are reintroduced, resulting in a total of 29,918 firm–year observations. Column (3) in Table 5 presents the regression results after the sample size is expanded. The results remain significant after the noisy data are reintroduced, which is consistent with the previous results.
3.4.4. Heterogeneity Analysis
Drawing upon the theoretical framework and the literature review presented in the preceding sections, the resource dependence theory and the principal–agent theory furnish empirical support for the underlying mechanisms through which supply chain finance influences enterprise financialization. To explore the heterogeneous effects of the supply chain finance model on the financial asset allocation in listed companies, sample regression analysis is conducted based on the levels of supply chain concentration and supply chain transparency, resulting in three groups of heterogeneous regression results.
- (1)
- Supply chain concentration
According to the resource dependence theory, supply chain concentration is another important factor influencing supply chain finance. To verify the impact of supply chain concentration, the upstream–downstream relationship for core enterprises in the supply chain is grouped. Following the approach of Patatoukas (2012) [35], the “proportion of sales to top five customers” is used as a proxy variable for customer concentration and the “proportion of purchases from the top five suppliers” is used as a proxy variable for supplier concentration. Regression analysis is conducted by grouping enterprises based on the median values of customer concentration and supplier concentration. Columns (1) and (2) of Table 6 represent the regression results for high and low customer concentrations, respectively. The regression coefficient of Scf in the low-customer-concentration subgroup is slightly higher, indicating that the enterprises with lower customer concentrations have a higher level of financialization. Columns (3) and (4) of Table 6 represent the regression results for high and low supplier concentrations, respectively. The higher the regression coefficient of Scf in the high-supplier-concentration subgroup, the higher the level of financialization in the enterprises with higher supplier concentrations.
Based on the inference from the resource dependence theory in the previous analysis, lower customer and supplier concentrations indicate a stronger resource dependence for SMEs on core enterprises, leading to the higher financialization of core enterprises. However, the subgroup heterogeneity analysis yields inconsistent conclusions. One possible explanation is that core enterprises have different levels of supply chain influence on SMEs in the upstream and downstream. Another possibility is that the discrepancy in results is due to data limitations. Therefore, further mechanism tests are necessary to verify hypothesis H2.
- (2)
- Supply chain transparency
According to the principal–agent theory, information asymmetry and banks’ risk-averse preferences give core enterprises information advantages in the supply chain, and SMEs have strong resource dependence on them. Therefore, regression analysis is conducted by grouping enterprises based on the median values of supply chain transparency. Columns (5) and (6) of Table 6 represent the regression results for high and low supply chain transparency, respectively. The correlation coefficients of Scf in both subgroups are significantly positive at the 1% significance level. The correlation coefficient of the high-supply-chain-transparency subgroup is 0.0733, which is much higher than the correlation coefficient of the low-supply-chain-transparency subgroup. This indicates that the higher the supply chain transparency of core enterprises, the stronger the impact of supply chain finance on enterprise financialization. The information advantages of core enterprises exacerbate their level of financialization. To some extent, this provides support for hypothesis H3, suggesting the need for further mechanism tests.
4. Study on Influencing Mechanisms
4.1. Test of the Moderating Effect of Resource Dependence from the Perspective of Supply Chain Concentration
To examine the moderating effect of resource dependence on supply chain finance and enterprise financialization, model (2) is constructed by adding two variables: resource dependence Scfci,t and the interaction term between centralized supply chain finance and resource dependence Scfi,t × Scfci,t. This paper focuses on the regression coefficient of the interaction term Scfi,t × Scfci,t. If α3 > 0, then H2 is supported, indicating that the stronger the resource dependence of SMEs on core enterprises, the more supply chain finance will exacerbate enterprise financialization.
Table 7 presents the test results of the moderating effect of resource dependence and includes subgroup regression analysis based on the nature of enterprises. Column (1) of Table 7 shows the regression results for the entire sample. The correlation coefficient of Scf is significantly positive, and the correlation coefficient of the interaction term Scfi,t × Scfci,t is also significantly positive. This indicates that resource dependence serves as a moderating variable between supply chain finance and enterprise financialization, strengthening the positive impact of supply chain finance on enterprise financialization. In other words, the stronger the resource dependence of SMEs on core enterprises, the more severe the financialization of core enterprises. This aligns with the expectations of hypothesis H2.
Compared to non-state-owned enterprises, state-owned enterprises hold advantageous positions in terms of financial strength and brand reputation. They are the preferred partners for cooperation among upstream and downstream enterprises in the supply chain and are the primary customers trusted by banks. According to statistics, as of 2022, several commercial factoring companies and financial companies of enterprise groups have been established by central enterprise groups under the management of the State-owned Assets Supervision and Administration Commission (SASAC) of the State Council of PRC, engaging in various levels of supply chain finance activities within and outside the system. Subgroup regression analysis based on the ownership nature of enterprises reveals that the correlation coefficient of Scf for state-owned enterprises is higher and exhibits a stronger moderating effect of resource dependence. The interaction term Scfi,t × Scfci,t is significantly positive at the 1% significance level. However, the effect is not significant in the subgroup of non-state-owned enterprises. This suggests that state-owned enterprises among core enterprises hold a more dominant position in the supply chain, have higher control rights, and can leverage their resource advantages to pursue higher returns.
4.2. Test of the Moderating Effect of Resource Dependence from the Perspective of Core Enterprises’ Information Advantages
The principal–agent relationship formed in the core-enterprise-led supply chain finance model intensifies the resource dependence of SMEs on core enterprises. To test the hypothesis H3, model (3) is constructed by including two variables: resource dependence Tran_cyi,t and the interaction term between centralized supply chain finance and resource dependence Scfi,t × Tran_cyi,t. This paper focuses on the interaction term Scfi,t × Tran_cyi,t. If α3 > 0, then H3 is supported, indicating that when core enterprises have information advantages, resource dependence amplifies the impact of supply chain finance on enterprise financialization. Given that it is less likely for upstream and downstream enterprises in the supply chain to immediately become dependent on enterprises with information advantages, the proxy variable for resource dependence is lagged by one and two periods to assess its delayed impact, aligning more closely with economic rationale.
Table 8 presents the test results of the moderating effect of resource dependence from the perspective of core enterprises’ information advantages. Columns (1)–(3) represent the test results of the moderating effect of resource dependence in the current period, one period later, and two periods later, respectively. According to the data in column (1), although the correlation coefficient of Scf is significantly positive, the correlation coefficient of the interaction term is not significant, indicating that resource dependence does not have a moderating effect in the current period when core enterprises have information advantages. On the other hand, a review of the lagged data in columns (2) and (3) of Table 8 reveals that the interaction term is significantly positive at the 1% significance level, which corroborates hypothesis H3. It also indicates that the information advantages of core enterprises do not play a role in the current period but become more influential over time. The stronger the resource dependence of SMEs on core enterprises, the stronger the impact of supply chain finance on enterprise financialization.
5. Conclusions and Policy Suggestions
Based on the resource dependence theory and the principal–agent theory, this paper analyzes the nexus between supply chain finance and enterprise financialization, as well as the impact of the former on the latter and the underlying mechanisms at play, and explores important pathways through which finance influences the sustainable development of the real economy. The following findings can be drawn: Firstly, the core-enterprise-led supply chain finance model has become a significant factor exacerbating enterprise financialization. This paper finds that supply chain finance positively intensifies the level of financial asset allocation of enterprises. Listed enterprises, leveraging their core position in the supply chain, extend the payable period to upstream and downstream suppliers, reducing their financial costs while increasing financial assets. Secondly, the resource dependence of SMEs on core enterprises is the main driver of enterprise financialization. Theoretical analysis and empirical tests reveal that the resource dependence of SMEs on core enterprises in the supply chain primarily stems from excessive supply chain concentration and the information advantages of core enterprises. The higher the bargaining power of core enterprises and the more pronounced their information advantages, the more they can intensify the allocation of financial assets. Thirdly, state-owned enterprises among core enterprises hold a more dominant position in the supply chain, have higher control rights, and can leverage their resource advantages to pursue higher returns.
According to the findings, the policy implications are as follows:
First, the underlying reason lies in the fact that core enterprises, as the leaders of the industrial chain, have not effectively played their leading role. While enhancing their development benefits, core enterprises should also pay more attention to benefiting the upstream and downstream of the industry chain, using supply chain finance to build a more robust supply chain structure and achieve a virtuous cycle in the supply chain, thereby promoting the development of the real economy. Furthermore, the findings in this paper indicate that the existing development model of supply chain finance in China is quite limited. It needs to be further improved to become more standardized and adaptable to economic development changes. It is imperative to innovate supply chain finance models and product designs that prevent the over-concentration of resources and power in supply chain finance. The main goals of supply chain finance should be to aid SME financing, as was intended from the start, and to make sure that the rules of supply chain finance make it easier for SMEs to get funds.
Second, it is necessary to utilize digital and information technologies to optimize the upstream and downstream information-sharing mechanisms along the supply chain, gradually improve the enterprise credit system and regulatory mechanisms, standardize enterprise information disclosure, enhance supply chain transparency, and reduce the overall information asymmetry in the supply chain. By improving the overall business environment and reducing the uncertainty faced by them, SMEs’ credit availability can be enhanced, thereby improving their development quality, strengthening their influence in the supply chain, and maximizing the balance of right distribution in the supply chain.
Third, it is imperative to enhance policy guidance, improve the investment environment for the real economy, utilize various policy instruments to encourage core enterprises, especially state-owned enterprises, pay more attention to the development of real economy-based industries, strengthen the demonstration effect of large enterprises, and stimulate the flow of funds into the real economy.
The paper presents a new research perspective. While most scholars focus on the benefits of supply chain finance development [3,4,5,6,7,8], we confront the challenges and obstacles in its progress and reveal the potential negative impacts on the real economy. This enriches the theoretical research on supply chain finance. It is undeniable that this study has its limitations, as it only examines the development status of supply chain finance in China. With the rapid growth of supply chain finance in China, many enterprises are increasingly prioritizing financial investment over production. Whether this trend is universal worldwide requires further investigation through expanded sample studies.
Author Contributions
Conceptualization, Q.Z.; Data curation, Q.Z.; Writing—original draft, J.D.; writing—review and editing, J.D.; funding acquisition, Q.Z. All authors have read and agreed to the published version of the manuscript.
Funding
This article is a phased achievement of the General Project of the National Social Science Foundation of China, titled “Measurement, Causes, and Countermeasures of Interest Rate Transmission Blockages between Financial Markets after Interest Rate Liberalization” (No.19BJY241).
Institutional Review Board Statement
Not applicable.
Informed Consent Statement
Not applicable.
Data Availability Statement
Data are contained within the article.
Conflicts of Interest
The authors declare no conflict of interest.
References
- Lekkakos, S.D.; Serrano, A. Supply chain finance for small and medium sized enterprises: The case of reverse factoring. Int. J. Phys. Distr. Log. 2016, 46, 367–392. [Google Scholar] [CrossRef]
- Gelsomino, L.M.; Mangiaracina, R.; Perego, A.; Tumino, A. Supply chain finance: A literature review. Int. J. Phys. Distr. Log. 2016, 46, 348–366. [Google Scholar] [CrossRef]
- Raghavan, N.S.; Mishra, V.K. Short-term financing in a cash-constrained supply chain. Int. J. Prod. Econ. 2011, 134, 407–412. [Google Scholar] [CrossRef]
- Zhang, T.; Zhang, C.Y.; Pei, Q. Misconception of providing supply chain finance: Its stabilising role. Int. J. Prod. Econ. 2019, 213, 175–184. [Google Scholar] [CrossRef]
- Wuttke, D.A.; Blome, C.; Henke, M. Focusing the financial flow of supply chains: An empirical investigation of financial supply chain management. Int. J. Prod. Econ. 2013, 145, 773–789. [Google Scholar] [CrossRef]
- Xu, X.; Chen, X.; Jia, F.; Brown, S.; Gong, Y.; Xu, Y. Supply chain finance: A systematic literature review and bibliometric analysis. Int. J. Prod. Econ. 2018, 204, 160–173. [Google Scholar] [CrossRef]
- Moretto, A.; Caniato, F. Can Supply Chain Finance help mitigate the financial disruption brought by COVID-19? J. Purch. Supply Manag. 2021, 27, 100713. [Google Scholar] [CrossRef]
- Kurpjuweit, S.; Schmidt, C.G.; Klöckner, M.; Wagner, S.M. Blockchain in additive manufacturing and its impact on supply chains. J. Bus. Logist. 2021, 42, 46–70. [Google Scholar] [CrossRef]
- Song, H.; Lu, Q.; Yu, K. A comparative study on the impact of supply chain finance and bank lending on the financing performance of SMEs. J. Manag. 2017, 14, 897–907. [Google Scholar]
- Martin, J. Suppliers’ participation in supply chain finance practices: Predictors and outcomes. Int. J. Intergr. Supply Manag. 2017, 11, 193–216. [Google Scholar] [CrossRef]
- Liebl, J.; Hartmann, E.; Feisel, E. Reverse factoring in the supply chain: Objectives, antecedents and implementation barriers. Int. J. Phys. Distr. Log. 2016, 46, 393–413. [Google Scholar] [CrossRef]
- Dore, R. Stock market capitalism vs. Welfare Capitalism: Stock market capitalism and its diffusion. New Polit. Econ. 2002, 7, 115. [Google Scholar]
- Tori, D.; Onaran, Z. The Effects of Financialisation and Financial Development on Investment: Evidence from Firm-Level Data in Europe; Greenwich Papers in Political Economy; University of Greenwich: London, UK, 2017. [Google Scholar]
- Tang, H.; Zhang, C. Investment risk, return gap, and financialization of non-listed non-financial firms in China. Pac-Basin. Financ. J. 2019, 58, 101213. [Google Scholar] [CrossRef]
- Zhao, Y.; Su, K. Economic policy uncertainty and corporate financialization: Evidence from China. Int. Rev. Financ. Anal. 2022, 82, 102182. [Google Scholar] [CrossRef]
- Theurillat, T.; Corpataux, J.; Crevoisier, O. Property sector financialization: The case of Swiss pension funds (1992–2005). Eur. Plan. Stud. 2010, 18, 189–212. [Google Scholar] [CrossRef]
- Davis, G.F.; Kim, S. Financialization of the Economy. Annu. Rev. Sociol. 2015, 41, 203–221. [Google Scholar] [CrossRef]
- Wuttke, D.A.; Blome, C.; Heese, H.S.; Protopappa-Sieke, M. Supply chain finance: Optimal introduction and adoption decisions. Int. J. Prod. Econ. 2016, 178, 72–81. [Google Scholar] [CrossRef]
- Peng, Y.C.; Wang, N.; Deng, G.; Gu, L. Flow Thought in the Era of Digital Economy: Based on the Linkage of Capital Occupation in Supply Chain and Financial Asset Investments. Manag. World 2022, 38, 170–187. [Google Scholar]
- Parviziomran, E.; Elliot, V. The effects of bargaining power on trade credit in a supply network. J. Purch. Supply Manag. 2023, 29, 100818. [Google Scholar] [CrossRef]
- Cho, W.; Ke, J.Y.F.; Han, C. An empirical examination of the use of bargaining power and its impacts on supply chain financial performance. J. Purch. Supply Manag. 2019, 25, 100550. [Google Scholar] [CrossRef]
- Ni, J.; Cao, X.; Zhou, W.; Li, J. Customer concentration and financing constraints. J. Corp. Financ. 2023, 82, 102432. [Google Scholar] [CrossRef]
- Granovetter, M. The impact of social structure on economic outcomes. J. Econ. Perspect. 2005, 19, 35–50. [Google Scholar] [CrossRef]
- Tsai, C.H.; Peng, K.J. The FinTech revolution and financial regulation: The case of online supply-chain financing. Asian J. Law Soc. 2017, 4, 109–132. [Google Scholar] [CrossRef]
- Zhang, X.; Zou, M.; Liu, W.; Zhang, Y. Does a firm’s supplier concentration affect its cash holding? Econ. Model. 2020, 90, 527–535. [Google Scholar] [CrossRef]
- Jorion, P.; Zhang, G. Credit contagion from counterparty risk. J. Financ. 2009, 64, 2053–2087. [Google Scholar] [CrossRef]
- Raman, K.; Shahrur, H. Relationship-specific investments and earnings management: Evidence on corporate suppliers and customers. Account. Rev. 2008, 83, 1041–1081. [Google Scholar] [CrossRef]
- Fabbri, D.; Klapper, L.F. Bargaining power and trade credit. J. Corp. Financ. 2016, 41, 66–80. [Google Scholar] [CrossRef]
- Gosman, M.L.; Kohlbeck, M.J. Effects of the existence and identity of major customers on supplier profitability: Is Wal-Mart different? J. Manag. Account. Res. 2009, 21, 179–201. [Google Scholar] [CrossRef]
- Demir, F. Capital market imperfections and financialization of real sectors in emerging markets: Private investment and cash flow relationship revisited. World Dev. 2009, 37, 953–964. [Google Scholar] [CrossRef]
- Song, J.; Lu, Y. U-shape relationship between non-currency financial assets and operating profit: Evidence from financialization of Chinese listed non-financial corporates. J. Financ. Res. 2015, 6, 111–127. [Google Scholar]
- Yao, W.; Xia, J.; Sun, T. A Study on Financing Constraint and its Mitigation in Hi-Tec SMEs in the View of Supply Chain Financing. Sci. Technol. Prog. Policy 2017, 34, 105–110. [Google Scholar]
- Pirttilä, M.; Virolainen, V.M.; Lind, L.; Kärri, T. Working capital management in the Russian automotive industry supply chain. Int. J. Prod. Econ. 2020, 221, 107474. [Google Scholar] [CrossRef]
- Mansilla-Fernández, J.M.; Milgram-Baleix, J. Working capital management, financial constraints and exports: Evidence from European and US manufacturers. Empir. Econ. 2023, 64, 1769–1810. [Google Scholar] [CrossRef] [PubMed]
- Patatoukas, P.N. Customer-base concentration: Implications for firm performance and capital markets: 2011 American accounting association competitive manuscript award winner. Account. Rev. 2012, 87, 363–392. [Google Scholar] [CrossRef]
- Gong, X.; Quan, X.; Liu, X. Supply chain transparency and corporate tax avoidance. China Ind. Econ 2022, 416, 155–173. [Google Scholar]
- Zhou, X.; Xu, X.; Lu, Z. Deleveraging, who is more positive and conservative. Manag. World 2020, 36, 127–147. [Google Scholar]
Figure 1.
Mean Operating Capacity of Listed Companies.

Figure 2.
Median DSO and DPO for Listed Companies.

Figure 3.
Principal–Agent Relationship among Main Bodies in Supply Chain Finance.


Table 1.
Variable Definition.
| Variable | Symbol | Definition |
|---|---|---|
| Enterprise financialization | Fe1 | Financial assets (including investment properties)/Total assets |
| Fe2 | Financial assets (excluding investment properties)/Total assets | |
| Supply chain finance | Scf | 1 − CCC/Turnover days of total assets |
| Resource dependence | Scfc | 1 − 1/2 (Proportion of purchases from top 5 suppliers + Proportion of sales to top 5 customers) |
| Tran_cy | Number of top five suppliers and top five customers explicitly disclosed by listed companies | |
| Firm size | Size | Natural logarithm of total assets |
| Financial leverage | Lever | Asset–liability ratio |
| Revenue scale | Scale | Natural logarithm of operating revenue |
| Ownership concentration | Oc | Shareholding ratio of the largest shareholder |
| CEO duality | Concurrent | 1 if the chairman is also the CEO; 0 otherwise |
| Net profit growth rate | Npr | (Net profit for the current year − net profit for the previous year)/net profit for the current year |
| Capital intensity | Capinten | Proportion of total assets to main operating revenue |
Table 2.
Descriptive Statistics.
| Variable | Obs | Mean | Std. Dev. | Min | Median | Max |
|---|---|---|---|---|---|---|
| Fe1 | 27,537 | 0.07 | 0.1 | 0 | 0.04 | 0.52 |
| Scf | 27,537 | 0.82 | 0.18 | 0.21 | 0.83 | 1.24 |
| Oc | 27,537 | 0.34 | 0.15 | 0.08 | 0.32 | 0.75 |
| Npr | 27,537 | −0.2 | 3.76 | −24.86 | 0.11 | 12 |
| Scale | 27,537 | 21.44 | 1.49 | 18.17 | 21.31 | 25.63 |
| Concurrent | 27,537 | 0.28 | 0.45 | 0 | 0 | 1 |
| Size | 27,537 | 22.09 | 1.33 | 19.18 | 21.96 | 26.07 |
| Lever | 27,537 | 0.42 | 0.2 | 0.05 | 0.41 | 0.91 |
| Capinten | 27,537 | 2.39 | 1.92 | 0.39 | 1.87 | 12.81 |
Table 3.
Results of Baseline Regression.
| (1) | (2) | |
|---|---|---|
| Variables | Fe1 | Fe1 |
| Scf | 0.0427 *** (5.9077) | 0.0390 *** (5.4394) |
| Oc | −0.0332 ** (−2.5687) | |
| Npr | −0.0000 (−0.3849) | |
| Scale | −0.0068 (−1.5036) | |
| Concurrent | −0.0059 *** (−2.7187) | |
| Size | 0.0019 (0.3869) | |
| Lever | −0.0068 (−0.8676) | |
| Capinten | 0.0018 (1.1431) | |
| Control variables | No | Yes |
| Constant | 0.0180 *** (2.9624) | 0.1352 *** (2.6318) |
| Firm/Year | YES | YES |
| N | 27,537 | 27,537 |
| R2 | 0.0207 | 0.0265 |
Notes: values of t are in brackets. ***, ** represent significance at the 1%, 5% levels, respectively.
Table 4.
2SLS Regression Results.
| (1) | (2) | |
|---|---|---|
| Variable | Fe1 | Fe1 |
| Scf | 0.1375 *** (11.59) | 0.0512 *** (3.49) |
| Control variables | No | Yes |
| Constant | −0.0413 *** (−4.26) | −0.0705 *** (−6.12) |
| Firm/Year | YES | YES |
| Sample size | 27,532 | 27,532 |
| R2 | 0.0084 | 0.0789 |
| Result of the Phase 1 | ||
| IV | 0.9390 *** (58.60) | 0.7820 *** (42.13) |
| F statistics | 3433.95 | 562.72 |
Notes: values of t are in brackets. *** represent significance at the 1% levels, respectively.
Table 5.
Robustness Test Analysis.
| (1) | (2) | (3) | |
|---|---|---|---|
| Replacement of Dependent Variables | Replacement of Core Explanatory Variables | Expansion of the Sample Size | |
| Variable | Fe2 | Fe1 | Fe1 |
| Scf | 0.030 *** | 0.039 *** | |
| (4.775) | (5.786) | ||
| Scf2 | 0.045 *** | ||
| (3.961) | |||
| Control variables | YES | YES | YES |
| Constant | 0.004 | 0.159 *** | 0.120 ** |
| (0.090) | (3.109) | (2.333) | |
| Firm/Year | YES | YES | YES |
| N | 27,537 | 27,537 | 29,918 |
| R2 | 0.021 | 0.025 | 0.025 |
Notes: values of t are in brackets. ***, ** represent significance at the 1%, 5% levels, respectively.
Table 6.
Results of the Heterogeneity Test.
| (1) | (2) | (3) | (4) | (5) | (6) | |
|---|---|---|---|---|---|---|
| High Customer Concentration | Low Customer Concentration | High Supplier Concentration | Low Supplier Concentration | High Supply Chain Transparency | Low Supply Chain Transparency | |
| Variable | Fe1 | Fe1 | Fe1 | Fe1 | Fe1 | Fe1 |
| Scf | 0.0326 *** (3.6799) | 0.0474 *** (4.6769) | 0.0398 *** (3.829) | 0.0307 *** (3.314) | 0.0733 *** (4.8860) | 0.0279 *** (3.3267) |
| Control variables | YES | YES | YES | YES | YES | YES |
| Constant | 0.1312 * (1.9506) | 0.0165 (0.2126) | 0.2495 *** (2.971) | 0.0361 (0.611) | 0.1043 (1.0983) | 0.0975 * (1.6565) |
| N | 12,430 | 12,150 | 12,063 | 12,517 | 6863 | 20,674 |
| R2 | 0.0196 | 0.0242 | 0.018 | 0.023 | 0.0514 | 0.0242 |
Notes: values of t are in brackets. ***, * represent significance at the 1%, 10% levels, respectively.
Table 7.
Test Results of the Moderating Effect of Resource Dependence from the Perspective of Supply Chain Concentration.
Table 7.
Test Results of the Moderating Effect of Resource Dependence from the Perspective of Supply Chain Concentration.
| (1) | (2) | (3) | |
|---|---|---|---|
| All Enterprises | State-Owned Enterprises | Non-State-Owned Enterprises | |
| Variable | Fe1 | Fe1 | Fe1 |
| Scf | 0.0390 *** (5.68) | 0.0595 *** (5.664) | 0.0271 *** (3.156) |
| Scfc | −0.0090 (−1.17) | −0.0152 (−1.378) | −0.0065 (−0.638) |
| Scf × Scfc | 0.0483 * (1.89) | 0.0978 *** (3.233) | 0.0067 (0.174) |
| Control variables | YES | YES | YES |
| Constant | 0.1442 *** (2.69) | 0.2163 *** (3.011) | 0.1610 ** (2.180) |
| Firm/Year | YES | YES | YES |
| N | 24,580 | 8469 | 16,111 |
| R2 | 0.021 | 0.060 | 0.038 |
Notes: values of t are in brackets. ***, **, and * represent significance at the 1%, 5%, and 10% levels, respectively.
Table 8.
Test Results of the Moderating Effect of Resource Dependence from the Perspective of Core Enterprises’ Information Advantages.
Table 8.
Test Results of the Moderating Effect of Resource Dependence from the Perspective of Core Enterprises’ Information Advantages.
| (1) | (2) | (3) | |
|---|---|---|---|
| T | T-1 | T-2 | |
| Variable | Fe1 | Fe1 | Fe1 |
| Scf | 0.0389 *** | 0.0340 *** | 0.0362 *** |
| (5.420) | (4.635) | (4.738) | |
| Trans_cy | 0.0006 | −0.0008 | −0.0040 * |
| (0.296) | (−0.392) | (−1.947) | |
| Scf × Trans_cy | 0.0129 | 0.0233 *** | 0.0258 *** |
| (1.495) | (2.738) | (2.743) | |
| Control variables | YES | YES | YES |
| Constant | 0.1356 *** | 0.1883 *** | 0.2441 *** |
| (2.637) | (3.318) | (3.914) | |
| Firm/Year | YES | YES | YES |
| N | 27,537 | 24,353 | 21,171 |
| R2 | 0.027 | 0.020 | 0.023 |
Notes: values of t are in brackets. ***, * represent significance at the 1%, 10% levels, respectively.
Disclaimer/Publisher’s Note: The statements, opinions and data contained in all publications are solely those of the individual author(s) and contributor(s) and not of MDPI and/or the editor(s). MDPI and/or the editor(s) disclaim responsibility for any injury to people or property resulting from any ideas, methods, instructions or products referred to in the content. |
© 2024 by the authors. Licensee MDPI, Basel, Switzerland. This article is an open access article distributed under the terms and conditions of the Creative Commons Attribution (CC BY) license (https://creativecommons.org/licenses/by/4.0/).
Share and Cite
MDPI and ACS Style
Dong, J.; Zhang, Q. Sustainable Development of the Real Economy: Supply Chain Finance and Enterprise Financialization. Sustainability 2024, 16, 3574. https://doi.org/10.3390/su16093574
AMA Style
Dong J, Zhang Q. Sustainable Development of the Real Economy: Supply Chain Finance and Enterprise Financialization. Sustainability. 2024; 16(9):3574. https://doi.org/10.3390/su16093574
Chicago/Turabian StyleDong, Jingjing, and Qiancheng Zhang. 2024. "Sustainable Development of the Real Economy: Supply Chain Finance and Enterprise Financialization" Sustainability 16, no. 9: 3574. https://doi.org/10.3390/su16093574
Note that from the first issue of 2016, this journal uses article numbers instead of page numbers. See further details here.