
Reconsidering the Long-Term Impacts of Digitalization, Industrialization, and Financial Development on Environmental Sustainability in GCC Countries

1
Department of Business Administration, College of Administrative Science, Najran University, Najran 1988, Saudi Arabia
2
Department of Finance and Insurance, College of Business Administration, Northern Border University, Arar 91411, Saudi Arabia
*
Author to whom correspondence should be addressed.
Sustainability 2024, 16(9), 3576; https://doi.org/10.3390/su16093576
Submission received: 7 February 2024
/
Revised: 27 March 2024
/
Accepted: 2 April 2024
/
Published: 24 April 2024
(This article belongs to the Section Environmental Sustainability and Applications)
Abstract
:Gulf Cooperation Council (GCC) countries have faced environmental challenges in recent decades. This study aims to identify the contribution of digitalization, industrialization, and financial development to the ecological footprint (EF) in GCC countries between 2000 and 2021. The empirical investigation involves estimating the STochastic Impacts by Regression on Population, Affluence, and Technology (STIRPAT) model using the augmented mean group (AMG), common correlated effects mean group (CCEMG) and cross-sectionally augmented autoregressive distributed lag (CS-ARDL) estimators. The findings reveal the existence of long-term linkages between EF and the factors mentioned above. Furthermore, there is evidence that adopting digitalization and information and communication technologies (ICT) improves long-term environmental quality. In contrast, both industrialization and financial development exert detrimental effects on the environment. Finally, the JKS Granger non-causality test revealed that all variables, except financial development, predict environmental degradation in GCC countries. These findings can assist in formulating efficient strategies to reduce ecological degradation and achieve environmental sustainability in GCC countries.
1. Introduction
Global environmental challenges have garnered substantial attention from academics, policymakers, and international organizations. Rapid and uncontrolled ecological degradation has represented a substantial challenge, resulting in detrimental implications for ecosystems, human health, and overall welfare [1]. The main causes of environmental deterioration have been the subject of much debate. The objective consists of identifying the measures that should be implemented to address climate change and alleviate its detrimental impacts [2,3]. Both theoretical and empirical studies have delved deeply into what causes environmental degradation. Following the endorsement of the 17 Sustainable Development Goals (SDGs) in 2015 to achieve these goals by 2030, there has been a surge in research interest in this topic. However, achieving these goals requires reducing greenhouse gas (GHG) emissions, promoting a green economy, and other environmental protection strategies [4].
Identifying potential factors contributing to environmental degradation is a crucial prerequisite for designing and implementing efficient public policies to mitigate climate change. The existing literature has identified several factors contributing to ecological degradation. These factors include, for instance, natural resource abundance, nonrenewable energy demand, economic openness, population growth, and urbanization. Moreover, there have been a few but growing research investigations conducted on the impacts of digitalization and information and communication technologies (ICT) on environmental sustainability [5,6,7,8]. Previous literature yielded conflicting results regarding the environmental consequences of ICT. While some research has indicated a beneficial influence on the environment, other studies have reached opposite conclusions. On the one hand, digitalization raises demand for products and promotes international trade, which can result in higher energy use and emissions. On the other hand, digitalization can enhance environmental quality by minimizing human activities and mobility through videoconferencing and decreasing GHG emissions from the transportation sector. The consequences of financial development (FD) on the environment have also garnered scholarly interest, although no definitive conclusions have been reached. Indeed, financially developed systems have better liquidity positions and may provide more financial resources. FD can improve environmental quality by fostering environmentally friendly projects and promoting energy transition. However, the financial sector may also promote projects in unsustainable polluting sectors, including fossil fuel energy exploration and exploitation, leading to environmental deterioration [9]. Finally, some works have focused on industrialization as a driver of environmental quality. On the one hand, industrialization can harm the environment because it is generally associated with increasing energy demand and carbon dioxide (CO2) emissions. On the other hand, industrialization can improve economic conditions and foster energy transition, thereby contributing to environmental preservation. Indeed, countries that have made significant progress in energy transition are, in fact, industrialized countries. To summarize, the previous discussion suggests the ambiguity regarding the implications of digitalization, FD, and industrialization on the environment. Such ambiguity motivates the present research.
This study explores the repercussions of digitalization, FD, and industrialization on the environment in the Gulf Cooperation Council (GCC) countries between 2000 and 2021. The choice of GCC countries is motivated by several reasons. First, recent years have been marked by a deterioration in the environmental conditions of GCC nations. According to a report by the Organization of Islamic Cooperation (OIC) in 2021, GCC countries were the most significant emitters of CO2 emissions among all OIC members in 2019 [10]. Between 2000 and 2017, these countries recorded increased CO2 emissions per capita. Qatar recorded the highest per capita CO2 emissions (37.61 metric tons), followed by Kuwait (23.52 metric tons), the United Arab Emirates (22.78 metric tons), Bahrain (21.59 metric tons), Oman (21.59 metric tons), and Saudi Arabia (17.94 metric tons). It is worth mentioning that CO2 emissions per capita in GCC nations have been above the global average of 4.93 metric tons. Therefore, GCC countries are confronted with significant environmental challenges that require a concentrated effort to address their underlying causes. Second, GCC countries have conducted extensive economic reforms to lower reliance on natural resources and promote industrialization to enhance economic development. In addition, most GCC countries have targeted the promotion of the digital economy through modernization, digitalization, and automation of the production processes. According to statistics from ref. [11], almost all GCC countries have achieved a 100% internet usage rate among citizens. Additionally, significant progress has been made by countries like the United Arab Emirates and Saudi Arabia in establishing e-government, as they were ranked 13th and 31st globally in 2022 [12]. These efforts to promote the digital economy and ICT may raise concerns about their environmental effects. Finally, the financial sectors in GCC countries have experienced substantial development during the last decades. FD has been mainly due to the multiple initiatives undertaken by those countries, including the National Programme for Fiscal Sustainability and Financial Sector Development in Oman, the Financial Sector Development Program in Saudi Arabia, and the Financial Services Sector Development Strategy in Bahrain. It would be interesting to explore the implications of digital transformation, FD, and industrialization on the environment in GCC countries.
This research adds to the body of knowledge in many ways. First, while the existing empirical literature has explored the many factors that affect environmental sustainability in GCC nations, such as economic openness and urbanization, there is a lack of studies on the environmental consequences of ICT, FD, and industrialization. Therefore, the present research aims to fill this gap by studying the environmental repercussions of digitalization, industrialization, and FD. Second, the research employs advanced statistical methods, specifically the augmented mean group (AMG), the common correlated effects mean group (CCEMG) and the cross-sectionally augmented autoregressive distributed lag (CS-ARDL), to estimate an augmented STochastic Impacts by Regression on Population, Affluence, and Technology (STIRPAT) model. Such estimators have the advantage of accounting for cross-section dependence (CSD) among cross-sections. This is imperative, as GCC countries are known to be economically and financially interconnected. Furthermore, the study uses the recently developed panel Granger non-causality testing technique of ref. [13]. In addition, the ecological footprint (EF) was used in the study as a metric of environmental quality. EF is preferred above conventional environmental indicators, such as CO2 emissions, since it may consider various human environmental impacts, including the carbon footprint [14,15].
The remainder of this research is structured as follows. Section 2 summarizes the extant theoretical and empirical literature. In Section 3, empirical issues are described, whereas Section 4 discusses the empirical outcomes. Finally, Section 5 is reserved for the conclusion, policy recommendations, and limitations.
2. Literature Underpinnings
2.1. ICT and Environmental Quality
Extensive debate has occurred on the implications of ICT in ecology [16,17]. According to [18], ICT could have three potential effects on the environment: (1) first-order effects, (2) second-order effects, and (3) third-order effects. The first-order or direct effects are perceived as the adverse impacts of ICT on the environment. For example, the widespread adoption of ICT increases CO2 emissions [4,19]. These adverse effects are mainly associated with the different stages of ICT products’ life cycle, which include the production and use of these technologies and their disposal at the end of the life cycle. During these stages, there will be a rise in the energy demand and an increase in polluting emissions. As an illustration, producing a desktop computer and its screen necessitates at least 18 tons of diverse materials, including 240 kg of fossil energy and 22 kg of chemical products [20]. Ref. [21] reported that the carbon footprint of ICT rose by 40% from 2002 to 2012. Moreover, ref. [22] estimated ICT-related CO2 emissions to be 1100 million tons. The second-order or indirect effects are represented by the positive environmental repercussions of ICT. Many studies, such as those by refs [23,24], emphasized that adopting ICT can reduce GHG emissions. There are some possible explanations for the positive environmental impacts of ICT. For example, using videoconferences and online exchanges may minimize the need for travel, thereby decreasing GHG emissions resulting from people’s movements and transportation. In addition, reducing the storage space needed for goods would decrease electricity consumption for lighting, air conditioning, and other activities. The third-order effects are also called systemic effects or rebound effects. Theoretically, energy efficiency gains could lead to reduced energy-related costs and an overall rise in energy consumption [25]. In other words, the environmental benefits of improved energy efficiency (second-order effects) could be neutralized if the demand for digital information storage increased.
At the empirical level, several empirical studies concluded that ICT has mixed effects on the environment. For instance, refs. [26,27] showed that using the internet increases CO2 emissions in BRICS (Brazil, Russia, India, China, and South Africa). Furthermore, the effects of internet use on CO2 emissions in Organisation for Economic Cooperation and Development (OECD) nations were estimated by ref. [28] utilizing the Pooled Mean Group. The outcomes suggest a robust long-run linkage between the variables, showing that a 10% rise in internet use is associated with a 1.6% rise in CO2 emissions. Another strand of the literature suggests that ICT improves environmental quality. In addition, ref. [29] concluded that ICT reduced medium- and long-term environmental degradation in South Korea from 1973 to 2016. Furthermore, ref. [30] employed the fixed effect and Tobit models to check the implications of ICT on CO2 emissions in 44 Sub-Saharan African nations between 2000 and 2012. Increasing mobile phone penetration was found to reduce liquid fuel consumption-based CO2 emissions. Research on GCC nations is scarce. Refs. [31,32,33] examined the impact of ICT on CO2 emissions in GCC nations. While using the same econometric techniques, the studies reported conflicting environmental effects of ICT. The former suggested that ICT increased emissions, while the latter two studies suggested that ICT reduced emissions. Therefore, no clear conclusion regarding the environmental effects of digitalization has been reached.
2.2. Industrialization and Environmental Quality
The linkage between industrialization and the environment has been documented by a large body of theoretical and empirical literature [34]. According to ref. [35], industrialization leads to a rise in GHG emissions because it increases energy consumption and employs carbon-intensive processes for energy production. In addition, [36] emphasized that an upsurge in industrialization results in natural resource depletion and waste generation. On the other hand, industrialization may mitigate environmental degradation by facilitating the workforce shift from agriculture to industry, decreasing GHG emissions from deforestation and environmentally harmful agricultural practices. In addition, industrialization may benefit the environment by enhancing economic growth and accelerating the energy transition process. Indeed, increased industrialization may result in higher growth rates, leading to the adoption of more efficient technologies and a growing interest in environmental standards.
It is worth mentioning that most prior empirical research examined the effects of industry on CO2 emissions. Some studies revealed the detrimental effects of industrialization on environmental quality. Ref. [37] focused on the impacts of industrialization on CO2 emissions in 23 nations using the panel ARDL. Their findings showed that a 1% rise in industrialization raises emissions by 0.54%. Other studies suggested the detrimental effects of industrialization on the EF. According to the findings of refs. [38,39], energy demand is impacted by human activities in industrialized countries, which leads to increased emissions and amplification of the EF. Moreover, ref. [40] revealed that industrialization had detrimental effects on the EF in ten countries with the most healthcare spending. Ref. [41] checked the implications of industrialization on the EF in 107 countries from 1995 to 2017. According to the quantile regression, industrialization has adverse impacts at the lower quantiles and beneficial impacts at the upper quantiles. Overall, the existing body of literature indicates a lack of agreement regarding the environmental repercussions of industrialization.
2.3. Financial Development and Environmental Quality
In recent decades, there has been an increasing discussion regarding the repercussions of FD on the environment. Ref. [42] identified three possible mechanisms by which FD influences the environment. First, FD may affect environmental quality via economic growth. Indeed, abundant literature suggested that FD significantly impacts economic growth [43,44,45]. Second, developed financial systems can allocate more credits, which may foster investments and energy consumption. At this stage, FD’s ecological impacts may depend on the type of projects funded. The financial system can help to protect the environment by promoting clean and green projects. However, if the funded projects heavily rely on fossil fuels, they can harm the environment. Third, FD may affect the environment via the reduction of income inequality. The extant literature suggests that FD may reduce market imperfections, i.e., substantial obstacles to accessing the financial market for small enterprises and people, and thus diminish income inequality [46,47,48]. By reducing market imperfections and income inequality and facilitating access to financial markets, FD can stimulate economic activity while contributing to environmental degradation. It is noteworthy that the analysis of this specific channel has been relatively limited in the previous literature, as highlighted by ref. [42].
The empirical literature suggests that FD may deteriorate or improve the environment. Ref. [49] analyzed the effects of FD on the EF in the 27 countries with the highest emissions. The results obtained from the dynamic ordinary least squares estimator indicate that FD positively impacts the environment. Additionally, ref. [50] suggested that developing digital financial systems reduces the EF in China. The ecological implications of FD in Saudi Arabia were recently analyzed by ref. [51] based on the nonlinear ARDL model. According to the analysis, an increase (decrease) in the development of financial institutions leads to less (more) long-run environmental degradation. In contrast, enhancing the financial market development has adverse consequences for environmental quality. In a study by ref. [42], the environmental impacts of FD were examined in 100 countries. The outcomes revealed that the direct and indirect repercussions of FD, particularly in terms of heightened energy demand, increase GHG emissions. The adverse consequences of FD have also been demonstrated by ref. [52], who examined the repercussions of FD on CO2 emissions in Turkey. Their analysis confirmed a positive linkage between FD and CO2 emissions. Concerning the effects of FD on the ecology in GCC countries, the limited number of studies produced conflicting outcomes. For instance, refs. [53,54] found no significant effects, whereas ref. [55] concluded that FD deteriorates the environment, while ref. [56] suggested that FD reduces CO2 emissions. Finally, ref. [57] reached mixed results. Therefore, findings regarding the environmental effects of FD in GCC countries have been divergent.
3. Empirical Issues
3.1. Model
There has been a heightened debate surrounding the elements that lead to environmental deterioration. The current investigation employs the STochastic Impacts by Regression on Population, Affluence, and Technology (STIRPAT) model, which was initially formulated by ref. [58] as an expansion of the Influence, Population, Affluence, and Technology (IPAT) model put forth by ref. [59]. The STIRPAT model deals with socioeconomic factors that could affect environmental degradation. It suggests that environmental degradation is affected by three factors: population (P), affluence (A), and technology (T). The initial form of the STIRPAT model is as follows:
Equation (1) can be expressed as follows after using the logarithmic transformation:
where I represents the environmental degradation indicator, and P, A, and T are population, affluence, and technology. Environmental quality (I) is represented in Equation (2) by the EF. Furthermore, in accordance with prior literature, including [60,61], we measure P, A, and T using urbanization rate, real GDP per capita, and energy use. To examine the effects of interest variables on EF, we augment Equation (2) with ICT, FD, and industrialization. Once the interest variables are introduced, and considering the presence of many countries, Equation (2) may be expressed in a panel data form as follows:
where EF, URB, GDP, EC, ICT, IND, and FD represent ecological footprint, urbanization, GDP per capita, energy consumption, ICT, industrialization, and FD, respectively. , , , , , and are coefficients to be estimated, while and are countries ( = 1, …, 6) and years (t = 1, …, 22), respectively. Finally, is the error term.
3.2. Methodology
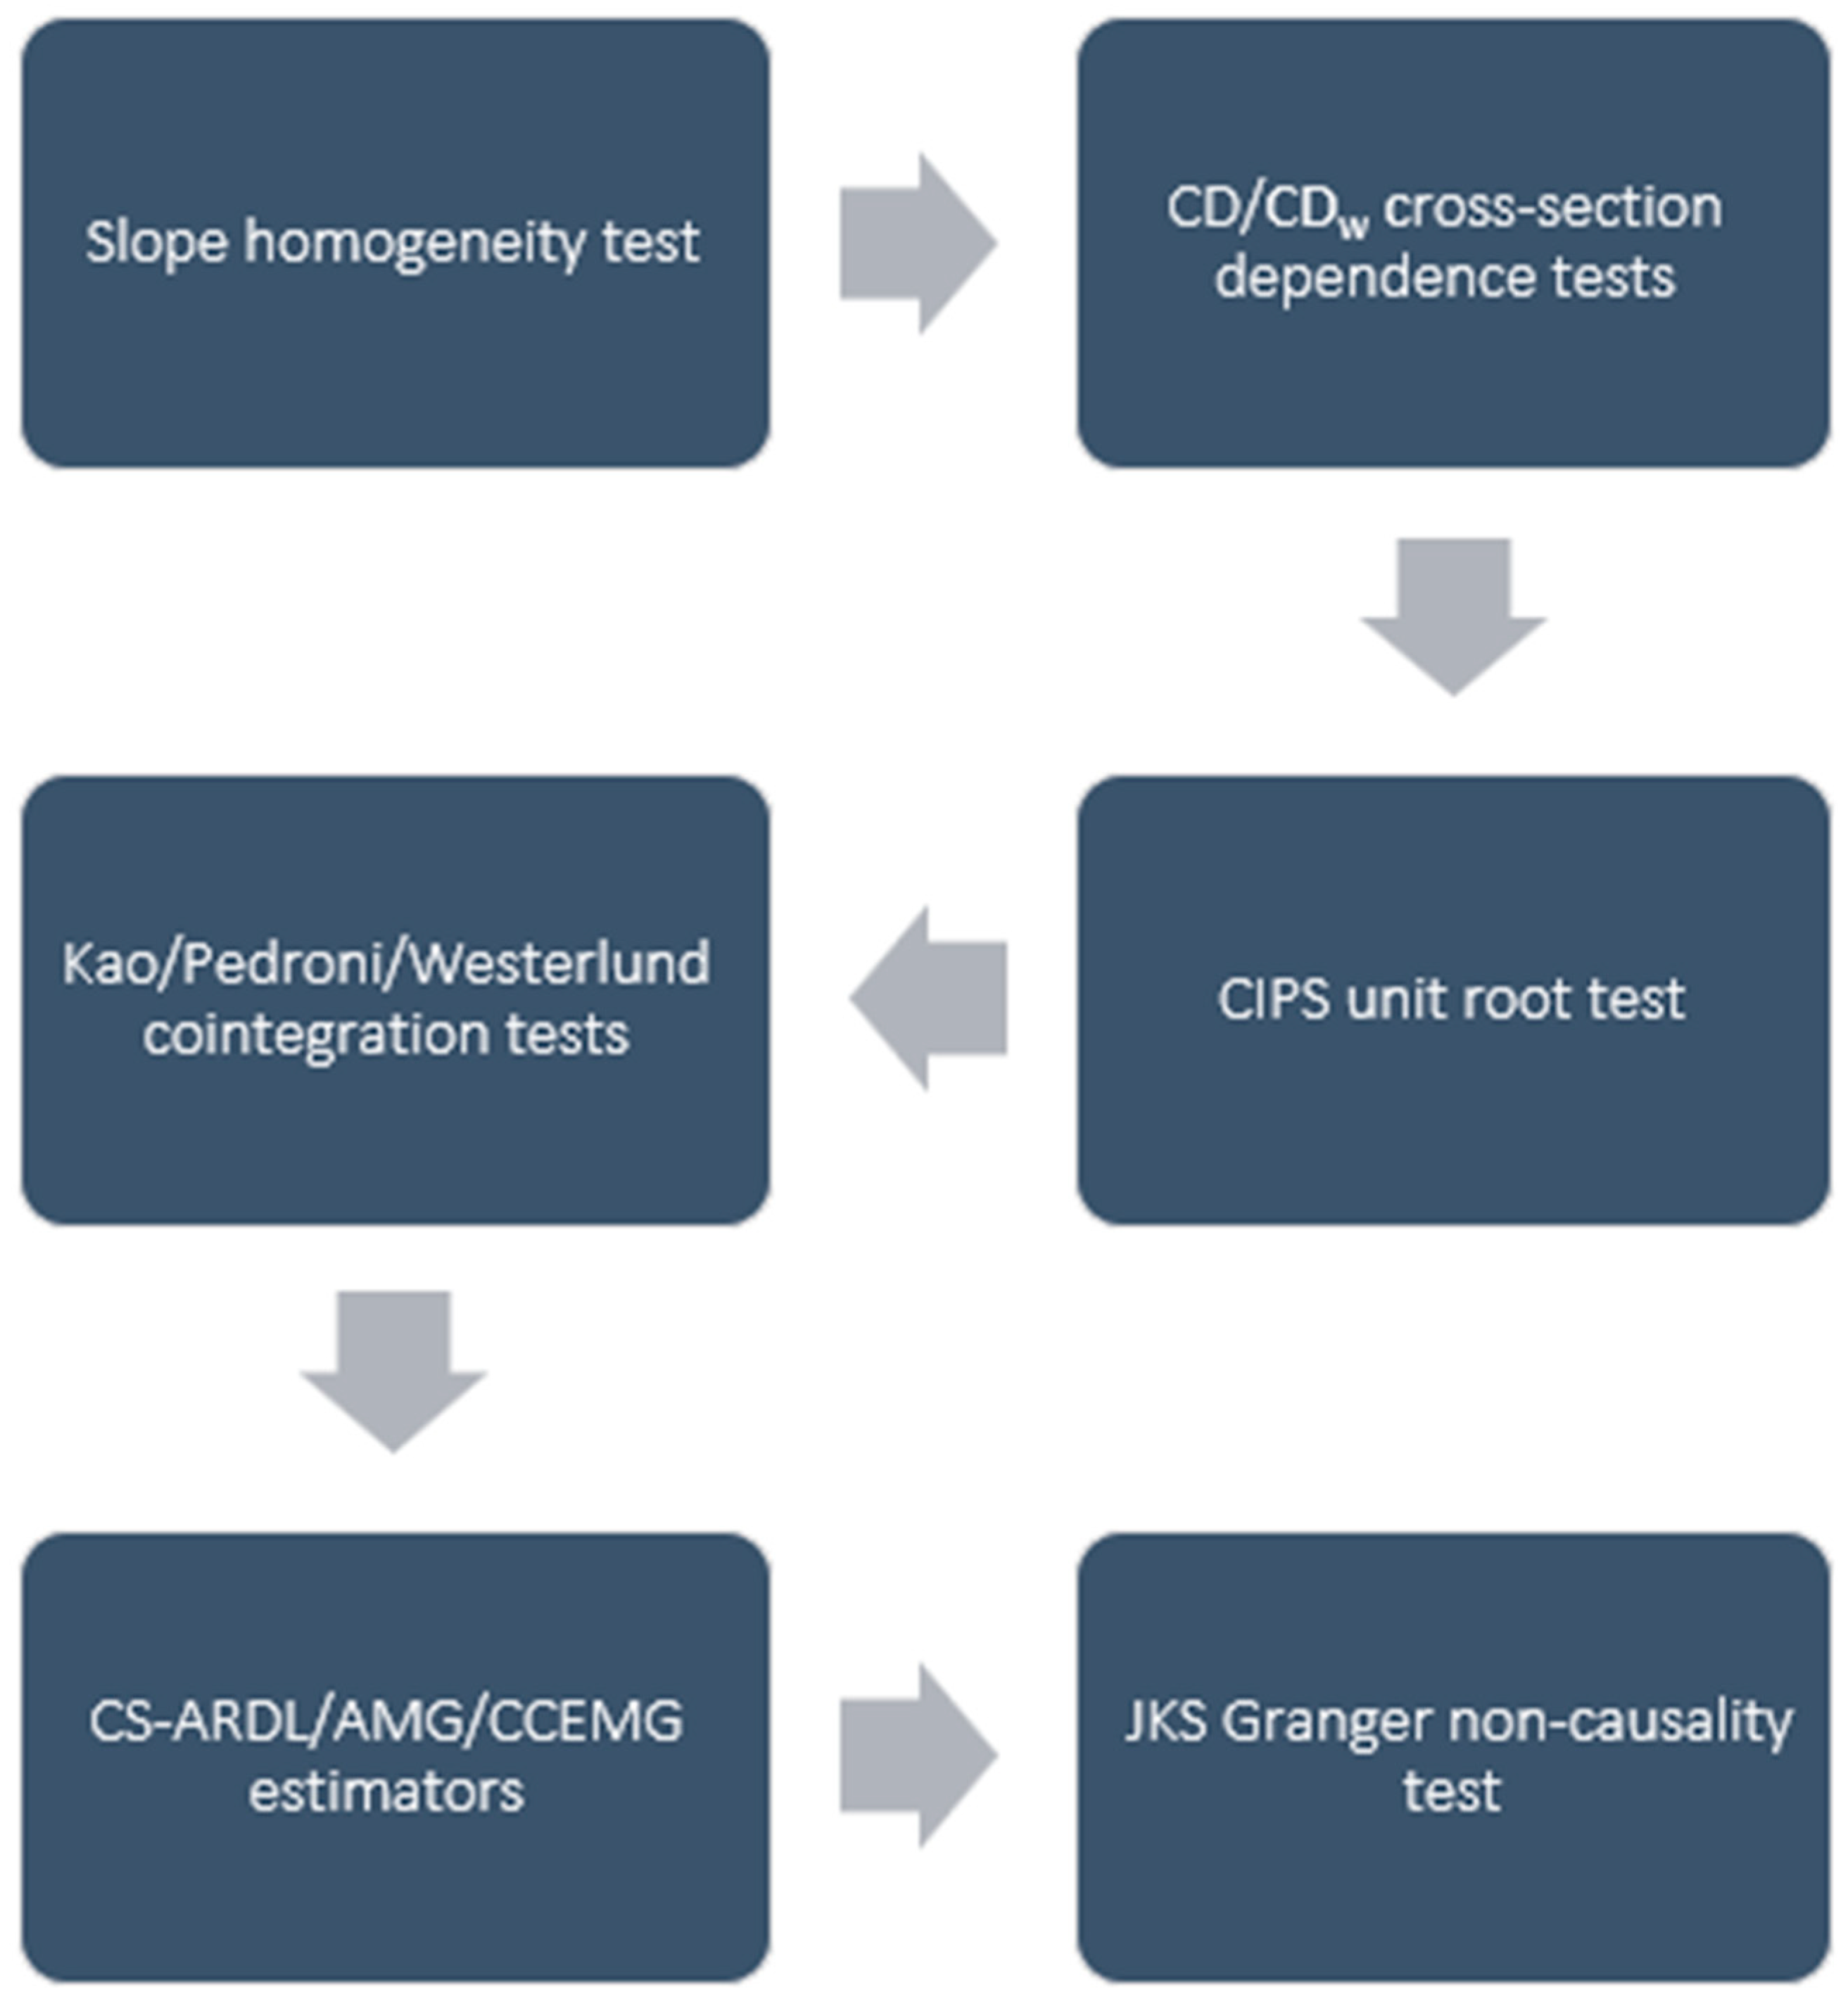
This work estimates the implications of ICT, FD, and industrialization on the EF. As outlined in previous literature, conventional first-generation panel data techniques may not be appropriate in the presence of CSD. Therefore, one should start by checking the presence of CSD before estimating the long-run effects. Therefore, the empirical methodology conducted in this paper involves many stages, as described in Figure 1.
We start by testing the presence of slope homogeneity and CSD for all variables. The importance of this stage lies in its ability to determine the suitability of first-generation or second-generation panel data techniques for the study. To account for potential CSD, this study employs various methodologies, including unit root tests, cointegration tests, long-run estimation techniques, and causality tests, that provide reliable estimation even when CSD is present. To check the sensitivity of the findings, the long-run impacts are estimated based on three different estimators: AMG, CCEMG, and CS-ARDL. It is worth noting that all of these estimators account for CSD. The validity of these estimators is checked using the weighted CD test statistic (CDw) test suggested by ref. [62]. Moreover, the root mean square error (RMSE) is used to identify the most accurate estimation technique. Finally, the JKS non-causality test of ref. [13] is implemented to identify the causal linkages in the presence of CSD. As ref. [63] mentioned, the JKS non-causality test provides better size and power performance than other non-causality tests.
3.3. Data
The present research analyzes the implications of ICT, industrialization, and FD on the environment in GCC nations between 2000 and 2021. Environmental degradation is measured through the EF. Ref. [14] indicated that EF allows for the overall human pressure on natural capital to be considered. According to refs. [15,64], the EF outperforms conventional environmental indicators, including CO2 emissions, since it considers multiple aspects of the ecosystem (fishing grounds, forest land, carbon land, grazing land, and built-up land). In accordance with previous research, such as studies by refs. [65,66], ICT is assessed by the share of individuals using the internet. The industrial value-added serves as an indicator of industrialization, while the Financial Development Index of the International Monetary Fund is utilized as a proxy of FD. The Financial Development Index has the advantage of considering financial institutions and financial markets. As discussed previously, we include three control variables: urbanization rate, total energy use, and real GDP per capita. Table 1 provides some details on the variables.
3.4. Descriptive Statistics
Descriptive statistics are reported in Table 2. First, the EF has an average of 5.13 × 10⁷ gha, fluctuating between a minimum of 6.35 × 10⁷ in Qatar (2000) and a maximum of 22.4 × 10⁷ in Saudi Arabia (2015). This indicates that GCC countries have a relatively high EF, mainly due to their high reliance on natural resources, which deteriorates environmental quality. In addition, ICT has an average of 56.110%, fluctuating between 2.210% and 100%. The data indicate that 100% of the population in most GCC countries have internet access in 2021.
The average GDP per capita in GCC countries exceeded 33,420 USD and reached 73,493 USD in Qatar. Likewise, Table 2 reveals high energy consumption over the period, with an average of 2,935,240 Terajoules due to the abundance of fossil fuel energy at low/moderate prices. The average urbanization rate in GCC countries is about 89% during the overall period, with Kuwait and Qatar having about 100% of their populations in urban areas. Furthermore, the average Financial Development Index is 0.433, displaying fluctuations between 0.264 and 0.585. Finally, the industrialization rate has an average of nearly 56%, which means that the industry share in GDP was about 56%, with a maximum of about 75%. This could be explained by the efforts of GCC countries in recent years to diversify their economies and develop other potential industries.
To get a more in-depth understanding of environmental conditions in GCC countries, we report the EF (in logarithmic form) in Figure 2. As shown, Saudi Arabia has the highest EF, followed by the United Arab Emirates and Kuwait. Additionally, the EF showed an increasing trend in almost all countries during the 2000s. Nevertheless, Bahrain has seen some decrease in EF since 2010, and the United Arab Emirates has experienced no growth and a marginal collapse since late 2010. In addition, Saudi Arabia has witnessed a modest decline since the second half of the 2010s. Overall, notwithstanding the slight decrease in EF observed in some GCC countries over the last decade, EF has risen during the whole period of the study, indicating increased environmental degradation.
4. Empirical Findings
4.1. Slope Homogeneity Test
In the initial stage of the analysis, the test of ref. [67] is employed to examine the homogeneity of slope coefficients. The results reported in Table 3 suggest rejecting the slope homogeneity hypothesis based on the ∆ and ∆adj statistics. These findings indicate the slope heterogeneity across GCC members. Hence, the coefficients are not constant, meaning that the slope differs across countries.
4.2. Cross-Section Dependence Analysis
In order to ascertain the appropriate choice between first-generation and second-generation panel data techniques, it is necessary to assess the existence of CSD. This task was accomplished using the CD test of ref. [68] and the CDw test proposed by ref. [62]. Table 4 suggests rejecting the null hypothesis for most variables. Indeed, the CD and CDw tests suggest the existence of CSD at 1% for EF, ICT, IND, EC, and URB. On the other hand, only the CD test reveals that FD and GDP are cross-sectionally dependent. Overall, Table 4 indicates the existence of strong linkages between GCC members for all variables. This means that shocks that impact any variable within a given country propagate to other countries. Accordingly, second-generation techniques should be applied in the subsequent stages.
4.3. Unit Root Test Results
Based on the findings above, we utilized the Cross-sectionally augmented Im, Pesaran and Shin (CIPS) panel unit root test, which accounts for CSD. The test is conducted for each of the variables independently and, for each variable, at levels and first differences. The results are presented in Table 5. A mixture of integration orders is obtained for variables at levels. On the one hand, EF, ICT, EC, and IND are not stationary at levels but stationary when considering their first differences, i.e., all of these series are I(1). On the other hand, URB, GDP, and FD are I(0) series, given the acceptance of the null hypothesis at levels. Therefore, there are mixed findings regarding the stationarity of the variables. These findings require the application of ARDL-based models, such as the CS-ARDL, which are considered appropriate for addressing I(0) and I(1) variables.
4.4. Cointegration Analysis
We then checked the long-run linkages between the explanatory variables and the EF. For this purpose, we implemented the demeaned Kao and demeaned Pedroni panel cointegration tests. Despite being first-generation cointegration tests, demeaning the data before using them allows for accounting for CSD [69]. In addition, we implemented the cointegration test of ref. [70]. The findings are summarized in Table 6.
The Kao and Pedroni tests suggest rejecting the null hypothesis, confirming a significant long-term association. Furthermore, the Westerlund ECM-based panel cointegration test validates these findings and indicates cointegration based on Gt and Pt statistics. It should be mentioned that the statistical significance of Gt and Pt gives enough evidence to reject no cointegration [71,72]. Consequently, there is ample evidence of long-term connections between the variables. It is thus worthwhile to assess the long-run effects of the various variables on the EF.
4.5. Long-Run Estimates
After completing the preliminary analysis, which includes examining slope homogeneity, CSD, stationarity, and cointegration, we assessed the long-run implications of explanatory variables, specifically ICT, IND, and FD, on the EF. To this end, we employed the AMG, CCEMG, and CS-ARDL. These techniques enable addressing several characteristics of macroeconomic data, including CSD, heteroscedasticity, heterogeneity in slope, serial correlation, endogeneity, and fractional integration [73]. The findings of the three estimation methods are presented in Table 7. Before discussing the findings, one should note that the CDw test confirms the absence of CSD in estimation residuals for the three techniques. As expected, the AMG, CCEMG, and CS-ARDL allowed accounting for the CSD issue in the estimation residuals. Additionally, the RMSE at the bottom of Table 7 indicates that the CCEMG model provides the most accurate estimation since it has the lowest statistic.
First, the estimation techniques show a negative and significant coefficient of ICT. More specifically, the CCEMG findings reveal that a rise in internet adoption by 1% results in a 0.104% decrease in the EF in the long-run. These results suggest that the development of ICT and digitalization in recent decades have enhanced environmental quality. As explained in the literature review section, ICT allows reducing the storage space needed for goods, which results in decreased electricity consumption for lighting, air conditioning, and other functions. This could therefore lessen the use of nonrenewable energy and mitigate environmental deterioration. In addition, ICT reduces the need for physical travel and transportation by promoting remote work, virtual meetings, e-commerce, and e-government services. Consequently, implementing ICT would improve energy efficiency across many sectors, lessen energy consumption, and diminish the EF [73,74,75]. In addition, ICT facilitates communication by reducing transaction costs using ICT (e-banking, e-commerce, smartphone applications, and e-business). These outcomes corroborate several works, such as ref. [76] for the top 10 nations in terms of ICT adoption; ref. [77] for 16 developing economies; ref. [78] for the MINT (Mexico, Indonesia, Nigeria, and Turkey); ref. [79] for 46 countries; and ref. [73] for G7 countries.
Second, industrialization has a positive and significant coefficient when using AMG, CCEMG, and CS-ARDL. Therefore, one could confirm the harmful effects of industrialization on the EF in the long run. Particularly, a rise in industrialization by 1% raises the EF by 0.186% (AMG), 0.281% (CCEMG), and 0.621% (CS-ARDL) in the long run. However, we rely on the CCEMG, which yields the most accurate findings, as indicated by the RMSE. Despite some differences in the magnitude of coefficients, there is compelling evidence of the adverse long-term effects of industrialization. Such results are expected for GCC economies, which rely heavily on the oil and gas sectors as the most significant industries. Oil and gas exploration and extraction activities are well acknowledged for their substantial role in emitting GHGs, mainly methane, which is a potent pollutant. Indeed, methane is the second largest GHG emission causing global warming worldwide [80]. The oil and gas industries continue to dominate in GCC countries despite increased efforts in recent years to diversify economies and stimulate the development of alternative economic sectors, such as tourism, financial services, and mining. Indeed, the growth of the industrial sector results in a higher demand for nonrenewable energy sources, primarily because of their abundant supply in GCC countries. This would worsen the environmental conditions in the long-term. These findings corroborate previous studies, such as ref. [35], who concluded that industrialization increases GHG emissions by increasing energy consumption and carbon-intensive production processes. The deterioration of environmental indicators and the exhaustion of natural resources are two further consequences of industrialization, as pointed out by ref. [36]. Finally, Table 7 indicates that FD is positively correlated with EF, as determined by the AMG and CCEMG estimators. This indicates that developed financial systems contribute to ecological deterioration in GCC nations. In particular, the CCEMG estimates that a 1% rise in FD leads to a 0.259% rise in EF. The concentration of the financial system in GCC countries on energy-intensive sectors, such as gas and oil exploitation, which require substantial energy consumption and generate substantial GHG emissions, could have contributed to the observed outcomes. These results corroborate previous studies conducted on GCC nations, including ref. [55], who concluded that FD induced a rise in CO2 emissions in GCC nations.
Regarding control variables, the findings indicate limited evidence of the influence of GDP on EF. Indeed, only the AMG estimator indicates a significant and negative impact of GDP per capita at 10%. Therefore, the AMG findings suggest that income reduces long-term environmental deterioration, partially supporting the Environmental Kuznets Curve (EKC) hypothesis in GCC nations. The results are consistent with prior research that has established the validity of the EKC hypothesis in GCC nations. These studies include the works of refs. [55,81,82]. Nevertheless, the CCEMG estimator does not support these findings while being regarded as the most appropriate estimator. As expected, energy consumption positively impacts EF, where an increase in EC by 1% induces a rise in EF by 0.267% in the long run. This conclusion is anticipated because GCC nations predominantly depend on affordable and readily available fossil fuel energy, mainly oil and gas. These energy sources are widely recognized for producing GHG emissions, which result in an increase in the EF and a decline in long-term environmental quality. In addition, the findings suggest the insignificant impact of urbanization on EF using both AMG and CCEMG estimators. Nevertheless, the CS-ARDL estimate shows a negative coefficient, suggesting that urbanization significantly enhances environmental quality. One possible explanation for this result is that urban areas generally exhibit higher levels of energy efficiency, resulting in reduced per capita energy use. This is mainly due to the ability to supply energy to many residents simultaneously through using, for example, public transportation and shared utilities. Urban areas also exhibit technological progress and employ environmentally sustainable production methods, including efficient waste management and reduced land usage.
4.6. Causality Analysis
The last stage involves investigating the causal linkages from the different explanatory variables to EF using the JKS Granger non-causality test. As previously indicated, this test is founded upon the Split Panel Jackknife method and performs better than alternative panel non-causality tests, including the one developed by ref. [83]. Table 8 summarizes the causality analysis findings. The outcomes suggest significant causal flows from all explanatory variables except FD to EF. These results confirms that past values of ICT, GDP, EC, URB, and IND affect the current values of EF. This implies that these factors contribute to variations in EF and can be utilized to forecast future values of EF. Overall, the causality analysis confirms the previous findings and suggests that only FD does not cause the EF. The observed result may be attributed to the potential weak effect of FD on the environment reported in Table 7.
5. Conclusions and Policy Implications
GCC countries have experienced increased environmental degradation in recent decades. The ongoing debate revolves around the factors that could lead to environmental degradation in these countries. This research adds to the extant literature by exploring the consequences of ICT, industrialization, and FD on the EF in six GCC countries between 2000 and 2021. The empirical analysis relies on the STIRPAT model. It implements various second-generation panel data estimators, namely AMG, CCEMG, and CS-ARDL, which effectively account for CSD and slope heterogeneity. In addition, the recently developed JKS Granger non-causality test was employed to check causal linkages.
The preliminary analysis confirms the presence of slope heterogeneity and CSD across GCC members. Furthermore, the CIPS unit root test indicates the presence of mixed orders of integration, while the cointegration tests provide evidence for long-term linkages. Estimating the long-run effects using the AMG, CCEMG, and CS-ARDL provides interesting findings. First, digitalization and ICT technologies reduce the EF and improve the long-run environmental indicators in GCC countries. Second, industrialization has a long-term detrimental environmental impact. Indeed, the industrial sectors of GCC countries are primarily focused on the oil and gas sectors, which may harm the environment. Finally, the study shows that FD increased the long-run EF, resulting in detrimental environmental consequences. This may be due to the fact that financial systems are providing financial resources to unsustainable polluting projects, leading to environmental degradation. Finally, the causality analysis confirms that all variables, except FD, predict the environmental degradation in GCC countries.
Some implications may be drawn from the current study. First, the findings indicate that ICT reduces the EF and improves environmental quality in GCC countries. Therefore, digitalization and ICT can be further developed and adopted to improve energy efficiency across the different economic sectors and reduce environmental degradation. This can be accomplished by promoting investments in environmentally friendly information technologies and allocating additional financial and human resources to R&D in those technologies. Second, the findings reveal that industrialization has an adverse long-run effect on the environment. Hence, it is mandatory to make more efforts to mitigate the detrimental impacts of industrialization on the environment within GCC countries. This can be achieved by enhancing industrial energy efficiency through operational enhancements, equipment maintenance, and waste heat recycling technologies. Furthermore, stricter environmental regulations may be implemented to reduce the adverse ecological repercussions of the industrial sector. In addition, GCC countries may be interested in creating an Environmental Preservation Fund by imposing taxes on the most polluting firms operating in the industrial sector. This fund may contribute to environmental sustainability and tackle ecological issues, including deforestation and biodiversity loss. Third, it is imperative to account for the detrimental long-term effects of FD on the environment in GCC countries. On the one hand, more efforts should be made to ensure that the financial system supports environmentally friendly projects and provides the necessary resources for their implementation. This can be accomplished by introducing specific frameworks by central banks that mandate a portion of credits to be allocated towards ecologically sustainable initiatives, such as implementing renewable energy projects. On the other hand, promoting green finance and developing the green bond market may help reduce environmental degradation and promote long-term environmental sustainability in GCC countries.
Although this research provided fresh evidence for the environmental implications of ICT, FD, and industrialization in GCC countries, it could be improved in many ways. On the one hand, future studies may employ alternative proxies of ICT that allow the overall development of information and communication technologies to be captured rather than solely focusing on the share of individuals using the internet. On the other hand, implementing methodologies that allow identifying the nonlinear asymmetric impacts of ICT, industrialization, and FD on the environment may be useful for designing specific policy recommendations.
Author Contributions
Conceptualization, K.T. and O.B.-S.; methodology, O.B.-S.; software, O.B.-S.; data curation, K.T.; writing—original draft preparation, K.T. and O.B.-S.; writing—review and editing, K.T. and O.B.-S.; supervision, O.B.-S. All authors have read and agreed to the published version of the manuscript.
Funding
The authors are thankful to the Deanship of Scientific Research at Najran University for funding this work, under the General Research Funding program grant code (NU/DRP/SEHRC/12/41).
Institutional Review Board Statement
Not applicable.
Informed Consent Statement
Not applicable.
Data Availability Statement
The data are available from the corresponding author.
Acknowledgments
The authors are thankful to the Deanship of Scientific Research at Najran University for funding this work, under the General Research Funding program grant code (NU/DRP/SEHRC/12/41).
Conflicts of Interest
The authors declare no conflicts of interest.
References
- Dar, J.A.; Asif, M. Does financial development improve environmental quality in Turkey? An application of endogenous structural breaks based cointegration approach. Manag. Environ. Qual. Int. J. 2018, 29, 368–384. [Google Scholar] [CrossRef]
- Danish; Baloch, M.A.; Mahmood, N.; Zhang, J.W. Effect of natural resources, renewable energy and economic development on CO2 emissions in BRICS countries. Sci. Total Environ. 2019, 678, 632–638. [Google Scholar] [CrossRef] [PubMed]
- Aller, C.; Ductor, L.; Grechyna, D. Robust determinants of CO2 emissions. Energy Econ. 2021, 96, 105154. [Google Scholar] [CrossRef]
- Alataş, S. The role of information and communication technologies for environmental sustainability: Evidence from a large panel data analysis. J. Environ. Manag. 2021, 293, 112889. [Google Scholar] [CrossRef] [PubMed]
- Ozcan, B.; Apergis, N. The impact of internet use on air pollution: Evidence from emerging countries. Environ. Sci. Pollut. Res. 2018, 25, 4174–4189. [Google Scholar] [CrossRef] [PubMed]
- Avom, D.; Nkengfack, H.; Fotio, H.K.; Totouom, A. ICT and environmental quality in Sub-Saharan Africa: Effects and transmission channels. Technol. Forecast. Soc. Chang. 2020, 155, 120028. [Google Scholar] [CrossRef]
- Usman, A.; Ozturk, I.; Ullah, S.; Hassan, A. Does ICT have symmetric or asymmetric effects on CO2 emissions? Evidence from selected Asian economies. Technol. Soc. 2021, 67, 101692. [Google Scholar] [CrossRef]
- Jakada, A.H.; Mahmood, S.; Ali, U.A.; Ismail Aliyu, D. The moderating role of ICT on the relationship between foreign direct investment and the quality of environment in selected African countries. Cogent Econ. Financ. 2023, 11, 2197694. [Google Scholar] [CrossRef]
- Baloch, M.A.; Zhang, J.; Iqbal, K.; Iqbal, Z. The effect of financial development on ecological footprint in BRI countries: Evidence from panel data estimation. Environ. Sci. Pollut. Res. 2019, 26, 6199–6208. [Google Scholar] [CrossRef]
- Organization of Islamic Cooperation. OIC Environment Report 2021. Statistical, Economic and Social Research and Training Centre for Islamic Countries (SESRIC). 2021. Available online: https://sesricdiag.blob.core.windows.net/sesric-site-blob/files/article/805.pdf (accessed on 5 January 2024).
- World Bank. World Development Indicators. 2023. Available online: https://data.worldbank.org/indicator/IT.NET.USER.ZS (accessed on 25 October 2023).
- United Nations Department of Economic and Social Affairs. UN e-Government Knowledgebase. United Nations, Division for Public Institutions and Digital Government. 2023. Available online: https://publicadministration.un.org/egovkb/en-us (accessed on 2 December 2023).
- Juodis, A.; Karavias, Y.; Sarafidis, V. A homogeneous approach to testing for Granger non-causality in heterogeneous panels. Empir. Econ. 2021, 60, 93–112. [Google Scholar] [CrossRef]
- Yilanci, V.; Pata, U.K. Investigating the EKC hypothesis for China: The role of economic complexity on ecological footprint. Environ. Sci. Pollut. Res. 2020, 27, 32683–32694. [Google Scholar] [CrossRef] [PubMed]
- Ben-Salha, O.; Zmami, M. Analyzing the symmetric and asymmetric effects of disaggregate natural resources on the ecological footprint in Saudi Arabia: Insights from the dynamic ARDL approach. Environ. Sci. Pollut. Res. 2023, 30, 59424–59442. [Google Scholar] [CrossRef] [PubMed]
- Danish; Ulucak, R.; Khan, S.U.-D. Determinants of the ecological footprint: Role of renewable energy, natural resources, and urbanization. Sustain. Cities Soc. 2020, 54, 101996. [Google Scholar] [CrossRef]
- Palvia, P.; Baqir, N.; Nemati, H. ICT for socio-economic development: A citizens’ perspective. Inf. Manag. 2018, 55, 160–176. [Google Scholar] [CrossRef]
- Berkhout, F.; Hertin, J. Impacts of Information and Communication Technologies on Environmental Sustainability: Speculations and Evidence; Report to the OECD; OECD: Paris, France, 2001. [Google Scholar]
- Malmodin, J.; Lundén, D. The energy and carbon footprint of the global ICT and E&M sectors 2010–2015. Sustainability 2018, 10, 3027. [Google Scholar] [CrossRef]
- Drezet, E. Les Faces Cachées de l’informatique: Énergie et Déchets. Admin06-Resinfo 05/2006. A. CNRS-CRHEA. 2006. Available online: https://slideplayer.fr/slide/3702860/ (accessed on 18 November 2023).
- Charfeddine, L.; Umlai, M. ICT sector, digitization and environmental sustainability: A systematic review of the literature from 2000 to 2022. Renew. Sustain. Energy Rev. 2023, 184, 113482. [Google Scholar] [CrossRef]
- Popli, S.; Jha, R.K.; Jain, S. A comprehensive survey on Green ICT with 5G-NB-IoT: Towards sustainable planet. Comput. Netw. 2021, 199, 108433. [Google Scholar] [CrossRef]
- Sahoo, M.; Sethi, N.; Padilla, M.A.E. Unpacking the dynamics of information and communication technology, control of corruption and sustainability in green development in developing economies: New evidence. Renew. Energy 2023, 216, 119088. [Google Scholar] [CrossRef]
- Tsimisaraka, R.S.M.; Xiang, L.; Andrianarivo, A.R.N.A.; Josoa, E.Z.; Khan, N.; Hanif, M.S.; Limongi, R. Impact of financial inclusion, globalization, renewable energy, ICT, and economic growth on CO2 emission in OBOR countries. Sustainability 2023, 15, 6534. [Google Scholar] [CrossRef]
- Greening, L.A.; Greene, D.L.; Difiglio, C. Energy efficiency and consumption—The rebound effect—A survey. Energy Policy 2000, 28, 389–401. [Google Scholar] [CrossRef]
- Haseeb, A.; Xia, E.; Saud, S.; Ahmad, A.; Khurshid, H. Does information and communication technologies improve environmental quality in the era of globalization? An empirical analysis. Environ. Sci. Pollut. Res. 2019, 26, 8594–8608. [Google Scholar] [CrossRef]
- Balsalobre-Lorente, D.; Driha, O.M.; Bekun, F.V.; Osundina, O.A. Do agricultural activities induce carbon emissions? The BRICS experience. Environ. Sci. Pollut. Res. 2019, 26, 25218–25234. [Google Scholar] [CrossRef] [PubMed]
- Salahuddin, M.; Alam, K.; Ozturk, I. The effects of Internet usage and economic growth on CO2 emissions in OECD countries: A panel investigation. Renew. Sustain. Energy Rev. 2016, 62, 1226–1235. [Google Scholar] [CrossRef]
- Batool, R.; Sharif, A.; Islam, T.; Zaman, K.; Shoukry, A.M.; Sharkawy, M.A.; Hishan, S.S. Green is clean: The role of ICT in resource management. Environ. Sci. Pollut. Res. 2019, 26, 25341–25358. [Google Scholar] [CrossRef] [PubMed]
- Asongu, S.A.; Le Roux, S.; Biekpe, N. Enhancing ICT for environmental sustainability in sub-Saharan Africa. Technol. Forecast. Soc. Change 2018, 127, 209–216. [Google Scholar] [CrossRef]
- Islam, M.S.; Rahaman, S.H. The asymmetric effect of ICT on CO2 emissions in the context of an EKC framework in GCC countries: The role of energy consumption, energy intensity, trade, and financial development. Environ. Sci. Pollut. Res. 2023, 30, 77729–77741. [Google Scholar] [CrossRef] [PubMed]
- Ebaidalla, E.M.; Abusin, S. The effect of ICT on CO2 emissions in the GCC countries: Does globalization matter? Int. J. Energy Econ. Policy 2022, 12, 56–66. [Google Scholar] [CrossRef]
- Islam, M.S.; Rahaman, S.H.; ur Rehman, A.; Khan, I. ICT’s impact on CO2 emissions in GCC region: The relevance of energy use and financial development. Energy Strategy Rev. 2023, 49, 101147. [Google Scholar] [CrossRef]
- Armeanu, D.S.; Joldes, C.C.; Gherghina, S.C.; Andrei, J.V. Understanding the multidimensional linkages among renewable energy, pollution, economic growth and urbanization in contemporary economies: Quantitative assessments across different income countries’ groups. Renew. Sustain. Energy Rev. 2021, 142, 110818. [Google Scholar] [CrossRef]
- Naudé, W. Climate change and industrial policy. Sustainability 2011, 3, 1003–1021. [Google Scholar] [CrossRef]
- Panayotou, T. Empirical Tests and Policy Analysis of Environmental Degradation at Different Stages of Economic Development; ILO Working Papers 992927783402676; International Labour Organization: Geneva, Switzerland, 1993. [Google Scholar]
- Sikder, M.; Wang, C.; Yao, X.; Huai, X.; Wu, L.; KwameYeboah, F.; Dou, X. The integrated impact of GDP growth, industrialization, energy use, and urbanization on CO2 emissions in developing countries: Evidence from the panel ARDL approach. Sci. Total Environ. 2022, 837, 155795. [Google Scholar] [CrossRef] [PubMed]
- Grimes, P.; Kentor, J. Exporting the greenhouse: Foreign capital penetration and CO2 Emissions 1980–1996. J. World-Syst. Res. 2003, 9, 261–275. [Google Scholar] [CrossRef]
- Halicioglu, F. An econometric study of CO2 emissions, energy consumption, income and foreign trade in Turkey. Energy Policy 2009, 37, 1156–1164. [Google Scholar] [CrossRef]
- Yang, B.; Usman, M. Do industrialization, economic growth and globalization processes influence the ecological footprint and healthcare expenditures? Fresh insights based on the STIRPAT model for countries with the highest healthcare expenditures. Sustain. Prod. Consum. 2021, 28, 893–910. [Google Scholar] [CrossRef]
- Quito, B.; del Río-Rama MD, L.C.; Álvarez-García, J.; Durán-Sánchez, A. Impacts of industrialization, renewable energy and urbanization on the global ecological footprint: A quantile regression approach. Bus. Strategy Environ. 2023, 32, 1529–1541. [Google Scholar] [CrossRef]
- Bui, D.T. Transmission channels between financial development and CO2 emissions: A global perspective. Heliyon 2020, 6, e05509. [Google Scholar] [CrossRef] [PubMed]
- Levine, R. Financial development and economic growth: Views and agenda. J. Econ. Lit. 1997, 35, 688–726. [Google Scholar]
- Guru, B.K.; Yadav, I.S. Financial development and economic growth: Panel evidence from BRICS. J. Econ. Financ. Adm. Sci. 2019, 24, 113–126. [Google Scholar] [CrossRef]
- Rahman, A.; Khan, M.A.; Charfeddine, L. Financial development–economic growth nexus in Pakistan: New evidence from the Markov switching model. Cogent Econ. Financ. 2020, 8, 1716446. [Google Scholar] [CrossRef]
- Demirgüç-Kunt, A.; Levine, R. Finance and inequality: Theory and evidence. Annu. Rev. Financ. Econ. 2009, 1, 287–318. [Google Scholar] [CrossRef]
- Zhang, R.; Naceur, S.B. Financial development, inequality, and poverty: Some international evidence. Int. Rev. Econ. Financ. 2019, 61, 1–16. [Google Scholar] [CrossRef]
- Chiu, Y.B.; Lee, C.C. Financial development, income inequality, and country risk. J. Int. Money Financ. 2019, 93, 1–18. [Google Scholar] [CrossRef]
- Uddin, G.A.; Salahuddin, M.; Alam, K.; Gow, J. Ecological footprint and real income: Panel data evidence from the 27 highest emitting countries. Ecol. Indic. 2017, 77, 166–175. [Google Scholar] [CrossRef]
- Feng, S.; Chong, Y.; Yu, H.; Ye, X.; Li, G. Digital financial development and ecological footprint: Evidence from green-biased technology innovation and environmental inclusion. J. Clean. Prod. 2022, 380, 135069. [Google Scholar] [CrossRef]
- Raggad, B.; Ben-Salha, O.; Zrelly, H.; Jbir, R. How do financial institutions and markets impact the ecological footprint in Saudi Arabia? A nonlinear cointegration approach. Stoch. Environ. Res. Risk Assess. 2024, 38, 1099–1119. [Google Scholar] [CrossRef]
- Cetin, M.; Ecevit, E.; Yucel, A.G. The impact of economic growth, energy consumption, trade openness, and financial development on carbon emissions: Empirical evidence from Turkey. Environ. Sci. Pollut. Res. 2018, 25, 36589–36603. [Google Scholar] [CrossRef] [PubMed]
- Mahmood, H. Impact of financial market development on the CO2 Emissions in GCC countries. Accounting 2020, 6, 649–656. [Google Scholar] [CrossRef]
- Baydoun, H.; Aga, M. The effect of energy consumption and economic growth on environmental sustainability in the GCC countries: Does financial development matter? Energies 2021, 14, 5897. [Google Scholar] [CrossRef]
- Omer, H.; Bein, M. Does the Moderating Role of Financial Development on Energy Utilization contributes to Environmental Sustainability in GCC Economies? Energies 2022, 15, 4663. [Google Scholar] [CrossRef]
- Salahuddin, M.; Gow, J.; Ozturk, I. Is the long-run relationship between economic growth, electricity consumption, carbon dioxide emissions and financial development in Gulf Cooperation Council Countries robust? Renew. Sustain. Energy Rev. 2015, 51, 317–326. [Google Scholar] [CrossRef]
- Bekhet, H.A.; Matar, A.; Yasmin, T. CO2 emissions, energy consumption, economic growth, and financial development in GCC countries: Dynamic simultaneous equation models. Renew. Sustain. Energy Rev. 2017, 70, 117–132. [Google Scholar] [CrossRef]
- Dietz, T.; Rosa, E.A. Effects of population and affluence on CO2 emissions. Proc. Natl. Acad. Sci. USA 1997, 94, 175–179. [Google Scholar] [CrossRef]
- Ehrlich, P.R.; Holdren, J.P. Impact of Population Growth: Complacency concerning this component of man’s predicament is unjustified and counterproductive. Science 1971, 171, 1212–1217. [Google Scholar] [CrossRef] [PubMed]
- Al Shammre, A.S.; Benhamed, A.; Ben-Salha, O.; Jaidi, Z. Do environmental taxes affect carbon dioxide emissions in OECD countries? Evidence from the dynamic panel threshold model. Systems 2023, 11, 307. [Google Scholar] [CrossRef]
- Xu, X.; Zeng, L.; Li, S.; Liu, Y.; Zhang, T. Dynamic nonlinear CO2 emission effects of urbanization routes in the eight most populous countries. PLoS ONE 2024, 19, e0296997. [Google Scholar] [CrossRef] [PubMed]
- Juodis, A.; Reese, S. The incidental parameters problem in testing for remaining cross-section correlation. J. Bus. Econ. Stat. 2022, 40, 1191–1203. [Google Scholar] [CrossRef]
- Xiao, J.; Karavias, Y.; Juodis, A.; Sarafidis, V.; Ditzen, J. Improved tests for Granger noncausality in panel data. Stata J. 2023, 23, 230–242. [Google Scholar] [CrossRef]
- Djedaiet, A.; Ayad, H.; Ben-Salha, O. Oil prices and the load capacity factor in African oil-producing OPEC members: Modeling the symmetric and asymmetric effects. Resour. Policy 2024, 89, 104598. [Google Scholar] [CrossRef]
- Danish Khan, N.; Baloch, M.A.; Saud, S.; Fatima, T. The effect of ICT on CO2 emissions in emerging economies: Does the level of income matters? Environ. Sci. Pollut. Res. 2018, 25, 22850–22860. [Google Scholar] [CrossRef]
- Wang, J.; Xu, Y. Internet usage, human capital and CO2 emissions: A global perspective. Sustainability 2021, 13, 8268. [Google Scholar] [CrossRef]
- Pesaran, M.H.; Yamagata, T. Testing slope homogeneity in large panels. J. Econom. 2008, 142, 50–93. [Google Scholar] [CrossRef]
- Pesaran, M.H. General diagnostic tests for cross-sectional dependence in panels. Empir. Econ. 2021, 60, 13–50. [Google Scholar] [CrossRef]
- Solberger, M. Demeaning the data in panel-cointegration models to control for cross-sectional dependencies. Econ. Lett. 2011, 110, 252–254. [Google Scholar] [CrossRef]
- Westerlund, J. Testing for error correction in panel data. Oxf. Bull. Econ. Stat. 2007, 69, 709–748. [Google Scholar] [CrossRef]
- Jahanger, A.; Hossain, M.R.; Onwe, J.C.; Ogwu, S.O.; Awan, A.; Balsalobre-Lorente, D. Analyzing the N-shaped EKC among top nuclear energy generating nations: A novel dynamic common correlated effects approach. Gondwana Res. 2023, 116, 73–88. [Google Scholar] [CrossRef]
- Ayad, H. Investigating the fishing grounds load capacity curve in G7 nations: Evaluating the influence of human capital and renewable energy use. Mar. Pollut. Bull. 2023, 194, 115413. [Google Scholar] [CrossRef] [PubMed]
- Huang, Y.; Haseeb, M.; Usman, M.; Ozturk, I. Dynamic association between ICT, renewable energy, economic complexity and ecological footprint: Is there any difference between E-7 (developing) and G-7 (developed) countries? Technol. Soc. 2022, 68, 101853. [Google Scholar] [CrossRef]
- Ahmed, Z.; Nathaniel, S.P.; Shahbaz, M. The criticality of information and communication technology and human capital in environmental sustainability: Evidence from Latin American and Caribbean countries. J. Clean. Prod. 2021, 286, 125529. [Google Scholar] [CrossRef]
- Alola, A.A.; Ozturk, I.; Bekun, F.V. Is clean energy prosperity and technological innovation rapidly mitigating sustainable energy-development deficit in selected sub-Saharan Africa? A myth or reality. Energy Policy 2021, 158, 112520. [Google Scholar] [CrossRef]
- Adebayo, T.S.; Agyekum, E.B.; Altuntaş, M.; Khudoyqulov, S.; Zawbaa, H.M.; Kamel, S. Does information and communication technology impede environmental degradation? Fresh insights from non-parametric approaches. Heliyon 2022, 8, e09108. [Google Scholar] [CrossRef]
- Haldar, A.; Sethi, N. Environmental effects of Information and Communication Technology-Exploring the roles of renewable energy, innovation, trade and financial development. Renew. Sustain. Energy Rev. 2022, 153, 111754. [Google Scholar] [CrossRef]
- Wen, Y.; Shabbir, M.S.; Haseeb, M.; Kamal, M.; Anwar, A.; Khan, M.F.; Malik, S. The dynamic effect of information and communication technology and renewable energy on CO2 emission: Fresh evidence from panel quantile regression. Front. Environ. Sci. 2022, 10, 953035. [Google Scholar] [CrossRef]
- Chatti, W.; Majeed, M.T. Investigating the links between ICTs, passenger transportation, and environmental sustainability. Environ. Sci. Pollut. Res. 2022, 29, 26564–26574. [Google Scholar] [CrossRef] [PubMed]
- International Energy Agency. Methane Tracker; IEA: Paris, France, 2021; Available online: https://www.iea.org/reports/methane-tracker-2021 (accessed on 11 December 2023).
- Alsamara, M.; Mrabet, Z.; Saleh, A.S.; Anwar, S. The environmental Kuznets curve relationship: A case study of the Gulf Cooperation Council region. Environ. Sci. Pollut. Res. 2018, 25, 33183–33195. [Google Scholar] [CrossRef] [PubMed]
- Zmami, M.; Ben-Salha, O. An empirical analysis of the determinants of CO2 emissions in GCC countries. Int. J. Sustain. Dev. World Ecol. 2020, 27, 469–480. [Google Scholar] [CrossRef]
- Dumitrescu, E.I.; Hurlin, C. Testing for Granger non-causality in heterogeneous panels. Econ. Model. 2012, 29, 1450–1460. [Google Scholar] [CrossRef]
Figure 1.
Empirical methodology.

Figure 2.
Ecological footprint in GCC countries, 2000–2021.


Table 1.
Definition and sources of the variables.
| Variable | Acronym | Definition | Source |
|---|---|---|---|
| Environmental quality | EF | Ecological footprint (global hectares) | GFN |
| Urbanization rate | URB | Urban population (% of total population) | WDI |
| Gross domestic product | GDP | GDP per capita (constant 2015 USD) | WDI |
| Energy consumption | EC | Total energy consumption (Terajoules) | EIA |
| Information and Communication Technologies | ICT | Individuals using the Internet (% of the population) | WDI |
| Industrialization | IND | Industry value added (% of GDP) | WDI |
| Financial development | FD | Financial Development Index (0–1) | IMF |
GFN: Global Footprint Network; WDI: World Development Indicators; EIA: U.S. Energy Information Administration; IMF: International Monetary Fund.
Table 2.
Descriptive statistics.
| Mean | 51,360,885 | 88.442 | 33,421.36 | 2,935,240 | 56.110 | 55.988 | 0.433 |
| Median | 28,976,275 | 87.834 | 23,671.85 | 1,489,395 | 60.750 | 55.631 | 0.434 |
| Max | 224,000,000 | 100 | 73,493.27 | 12,945,509 | 100 | 74.812 | 0.585 |
| Min | 6,356,151 | 71.509 | 15,561.48 | 386,651 | 2.210 | 32.472 | 0.264 |
Table 3.
Slope homogeneity test results.
| Test | Statistics | p-Value |
|---|---|---|
| ∆ | 5.359 *** | 0.000 |
| ∆adj | 6.718 *** | 0.000 |
*** denotes the rejection of the null hypothesis at 1%.
Table 4.
Cross-section dependence (CSD) test results.
| Variables | CD Test | CDw Test | ||
|---|---|---|---|---|
| Statistics | p-Value | Statistics | p-Value | |
| EF | 15.860 *** | 0.000 | −2.730 *** | 0.006 |
| URB | 13.700 *** | 0.000 | −3.020 *** | 0.003 |
| GDP | −1.770 * | 0.077 | −0.860 | 0.388 |
| EC | 17.430 *** | 0.000 | −3.430 *** | 0.001 |
| ICT | 17.660 *** | 0.000 | −3.590 *** | 0.000 |
| IND | 14.610 *** | 0.000 | −2.740 *** | 0.006 |
| FD | 4.350 *** | 0.000 | −0.550 | 0.580 |
*** and * denote the rejection of the null hypothesis at the 1 and 10% levels, respectively.
Table 5.
CIPS panel unit root test results.
| Variables | Level | 1st Difference | ||
|---|---|---|---|---|
| Statistics | p-Value | Statistics | p-Value | |
| EF | −1.796 | 0.360 | −7.339 *** | 0.000 |
| URB | −2.460 *** | 0.007 | −9.462 *** | 0.000 |
| GDP | −5.139 *** | 0.000 | −7.055 *** | 0.000 |
| EC | −1.196 | 0.116 | −8.493 *** | 0.000 |
| ICT | −0.985 | 0.162 | −7.826 *** | 0.000 |
| IND | −1.134 | 0.128 | −1.602 * | 0.055 |
| FD | −2.508 *** | 0.006 | −6.339 *** | 0.000 |
*** and * denote the rejection of the null hypothesis at 1 and 10%, respectively.
Table 6.
Cointegration tests results.
| Statistics | p-Value | |
|---|---|---|
| Kao cointegration test (demeaned) | ||
| Modified Dickey–Fuller t | −3.040 *** | 0.001 |
| Dickey–Fuller t | −1.902 ** | 0.028 |
| Augmented Dickey–Fuller t | −2.246 ** | 0.012 |
| Unadjusted modified Dickey–Fuller t | −3.977 *** | 0.000 |
| Unadjusted Dickey–Fuller t | −2.206 ** | 0.013 |
| Pedroni panel cointegration test (demeaned) | ||
| Modified Phillips–Perron t | 2.303 *** | 0.010 |
| Phillips–Perron t | −2.829 *** | 0.002 |
| Augmented Dickey–Fuller t | −2.501 *** | 0.006 |
| Westerlund ECM-based panel cointegration test | ||
| Gt | −7.004 * | 0.067 |
| Ga | −0.110 | 0.533 |
| Pt | −4.774 *** | 0.000 |
| Pa | −0.180 | 0.467 |
***, **, and * denote the rejection of the null hypothesis at the 1, 5, and 10% levels, respectively. For the Westerlund test, p-values are generated through 1000 bootstrap replications.
Table 7.
Long-run estimates.
| Variable | AMG | CCEMG | CS-ARDL | |||
|---|---|---|---|---|---|---|
| Coefficient | p-Value | Coefficient | p-Value | Coefficient | p-Value | |
| URB | 9.072 | 0.169 | 7.638 | 0.603 | −10.117 *** | 0.001 |
| GDP | −0.619 * | 0.089 | −0.077 | 0.832 | −0.453 | 0.467 |
| EC | −0.056 | 0.489 | 0.267 *** | 0.000 | 0.593 ** | 0.020 |
| ICT | −0.098 ** | 0.047 | −0.104 ** | 0.033 | −0.340 *** | 0.005 |
| IND | 0.186 ** | 0.028 | 0.281 ** | 0.041 | 0.621 * | 0.064 |
| FD | 0.187 ** | 0.020 | 0.259 ** | 0.039 | −0.387 | 0.534 |
| CDw test | 0.210 (0.832) | −0.120 (0.901) | −0.200 (0.839) | |||
| RMSE | 0.044 | 0.026 | 0.070 | |||
***, **, and * denote the statistical significance of coefficients at the 1, 5, and 10% levels, respectively.
Table 8.
JKS Granger non-causality test results.
| Null Hypothesis | HPJ Wald Test | p-Value | Conclusion |
|---|---|---|---|
| URB EF | 636.211 *** | 0.000 | Yes |
| GDP EF | 37.522 *** | 0.000 | Yes |
| EC EF | 86.305 *** | 0.000 | Yes |
| ICT EF | 96.139 *** | 0.000 | Yes |
| IND EF | 280.254 *** | 0.000 | Yes |
| FD EF | 4.991 | 0.172 | No |
Half-Panel Jackknife coefficients are estimated using the cross-sectional heteroskedasticity-robust variance. *** stands for rejecting the null hypothesis at the 1% significance level. The symbol ⇏ symbolizes the null hypothesis of no Granger causality.
Disclaimer/Publisher’s Note: The statements, opinions and data contained in all publications are solely those of the individual author(s) and contributor(s) and not of MDPI and/or the editor(s). MDPI and/or the editor(s) disclaim responsibility for any injury to people or property resulting from any ideas, methods, instructions or products referred to in the content. |
© 2024 by the authors. Licensee MDPI, Basel, Switzerland. This article is an open access article distributed under the terms and conditions of the Creative Commons Attribution (CC BY) license (https://creativecommons.org/licenses/by/4.0/).
Share and Cite
MDPI and ACS Style
Touati, K.; Ben-Salha, O. Reconsidering the Long-Term Impacts of Digitalization, Industrialization, and Financial Development on Environmental Sustainability in GCC Countries. Sustainability 2024, 16, 3576. https://doi.org/10.3390/su16093576
AMA Style
Touati K, Ben-Salha O. Reconsidering the Long-Term Impacts of Digitalization, Industrialization, and Financial Development on Environmental Sustainability in GCC Countries. Sustainability. 2024; 16(9):3576. https://doi.org/10.3390/su16093576
Chicago/Turabian StyleTouati, Kamel, and Ousama Ben-Salha. 2024. "Reconsidering the Long-Term Impacts of Digitalization, Industrialization, and Financial Development on Environmental Sustainability in GCC Countries" Sustainability 16, no. 9: 3576. https://doi.org/10.3390/su16093576
Note that from the first issue of 2016, this journal uses article numbers instead of page numbers. See further details here.