
Water Resource Management of Salalah Plain Aquifer Using a Sustainable Approach


Department of Civil and Environmental Engineering, College of Engineering, Dhofar University, Salalah 211, Oman
Sustainability 2024, 16(9), 3670; https://doi.org/10.3390/su16093670
Submission received: 7 April 2024
/
Revised: 25 April 2024
/
Accepted: 26 April 2024
/
Published: 27 April 2024
(This article belongs to the Topic Hydrology and Water Resources Management)
Abstract
:A sustainable approach is proposed for managing the effects of salinity ingression in Salalah coastal aquifer, Oman. This paper aims to analyze and compare the groundwater levels and salinity of the aquifer from 1993 to 2027, considering both predictive and actual transient scenarios. Two novel scenarios were proposed, established, and examined in this study to bring back the aquifer to steady-state condition. The first scenario entails ceasing groundwater pumping from both Salalah and Saada wellfields, while compensating for the groundwater supply from these sources with surplus desalinated water. This scenario is projected to occur during the predictive period spanning from 2023 to 2027, denoted Scenario A. The second scenario is business as usual and involves continuing pumping from both wellfields during the same predictive period, denoted Scenario B. A numerical model for 3D flow simulation and advective transport modeling showed that on the eastern side of the Salalah coastal aquifer, the extent of seawater intrusion (SWI) was identified stretching from the shoreline to a distance of 1800 m, 1200 m, 0 m, and 600 m, in years 2011, 2014, 2018, and 2022 under the transient period, whereas SWI was delineated in land up to 0 m and 700 m in the predictive year 2027 under Scenarios A and B, respectively. In the western side of Salalah coastal aquifer, SWI was delineated in land up to 2000 m, 1700 m, 0 m, and 800 m, in years 2011, 2014, 2018, and 2022 under the transient period, whereas SWI was delineated in land up to 0 m and 750 m in the predictive year 2027 under Scenarios A and B, respectively. This study claims that Scenario A effectively pushed the seawater interface back to the coastline, projecting its reach to the shoreline (0 m) by 2027. In contrast, in baseline Scenario B, the wedge of saline intrusion in the Salalah coastal aquifer was delineated from the shoreline, up to 800 m inland, which accounted for continuation of pumping from both wellfields during the predictive period. The study concludes that Scenario A has the capability to efficiently reduce the impact of saline inflows from the coast, while Scenario B results in a more pronounced impact of salinity intrusion.
1. Introduction
This research aims to address the existing gap in the literature related to water resource management with a focus on the Salalah coastal aquifer. The objective is to improve comprehension of implementing strategies for overseeing this aquifer and enhancing its long-term sustainability. Additionally, the study seeks to broaden the knowledge base on water resource management and sustainable development by drawing upon research by the author [1] pertaining to the Salalah coastal aquifer. It is anticipated that this study will provide a framework and practical guidance for stakeholders involved in decision-making processes and practical applications within this domain. This effort is positioned to contribute to enhancing policies and methodologies in water resource management by using the sustainable approach proposed in this work.
In the year 2020, the Omani census disclosed that Salalah city had a population of 331,949. Seawater intrusion (SWI) stands out as the primary cause of groundwater contamination within the Salalah coastal aquifer, as noted by [1]. In the Salalah coastal aquifer, a recharge and discharge system for the area was established [1]. The wedge of saline intrusion was mapped up to 2 km from the coast in 2005 [1]. Notably, the underflow flushing is less robust in the eastern and western coastal areas compared to the central part of the Salalah plain [1]. This imbalance in the aquifer water budget, as previously indicated [1], could further exacerbate the situation. The underflow from the mountain catchment areas to the Salalah coastal aquifer is derived from the developed numerical groundwater flow modeling and calibrated on hydraulic heads of 1992 at 50 Mm3/year [1]. The underflow or subsurface recharge is the combined recharge from the vertical component of precipitation (rainfall/drizzle) and recharge from the horizontal component of precipitation (fogwater/mists) captured by mountain vegetation cover [2]. Recent years have witnessed a decline in horizontal precipitation due to the degradation of fogwater forests, resulting in a deficit of groundwater recharge [2]. It is required to identify key aspects of SWI in groundwater management and anticipate its future changes [3]. The problem of freshwater shortage has been exacerbated by SWI [1]. A previous study [4] illuminated the foundation by which artificial recharge can help combat seawater intrusion in the Salalah coastal aquifer. It is important to develop effective preventive and control measures to mitigate the environmental degradation of the Salalah coastal aquifer [5]. Salalah city used to depend totally on the Salalah coastal aquifer as the major groundwater source before Sembcorp Salalah began operating an electricity generation and seawater desalination plant in 2013 [6].
Research indicates that a mere 3% of seawater mixed with freshwater in a coastal aquifer can render the freshwater resource unfit for human consumption [7]. Given the escalating impact of climate change and the heightened risks associated with human activities, SWI has emerged as a critical threat to both human health and sustainable economic development in coastal areas [8]. Recognizing and evaluating SWI are crucial steps for preventing and mitigating contamination in aquifers, as previously emphasized [9]. The implications of SWI on coastal aquifers pose a significant concern in the effective management of groundwater resources, as previously highlighted [10]. Urban water demand could be managed by reallocation of the supply systems through state interest [11]. This study [12] indicated that the Jordanian government’s concern over citizens’ water use habits is driving the state to devote more resources towards behavior change as a method of water demand management. A conceptual model to account for the observed changes in groundwater levels and salinity has been developed through an integrated approach of remote sensing and geographic information systems [13].
1.1. Aims and Objectives
The primary aim was to identify a set of scenarios applicable in the region to mitigate SWI.
The objectives were:
- To investigate the status of SWI in the aquifer and determine the most effective strategies for aquifer management.
- To combat SWI in the Salalah coastal aquifer through the implementation of a comprehensive approach.
- To simulate the hydrodynamics of the aquifer by using the established numerical code.
- To evaluate sustainable management scenarios by using the established model.
1.2. Problem Identification
- Increased extraction of groundwater has caused the seawater interface to move inland [1].
- Under the business-as-usual situation, SWI is expected to continue and cause groundwater contamination [5].
In the coming years, two key points are obvious:
- The natural subsurface recharge into the aquifer will not rise each year because of the continuous deterioration of the fogwater forest, which acts as the catchment area of the Salalah coastal aquifer [2].
- The annual demand for water will increase over the coming 5 years by at least 3% annually.
To help in this problem, Scenario A, i.e., to stop pumping from Salalah and Saada wellfields and compensate groundwater supply from both wellfields by surplus desalinated water, is proposed in this study to be implemented. Yet the need for agricultural irrigation still heavily depends on pumping groundwater from the aquifer at 46 million cubic meters per year (Mm3/year) [1,2,3,4,5,6]. In this study, because using desalinated seawater is too expensive for agricultural purposes, pumping from the aquifer for agricultural purposes is assumed at 46 Mm3/year.
Additionally, the effective control of seawater intrusion (SWI) through Managed Aquifer Recharge (MAR) using artificial Municipal Treated Effluents (MTEs) has been investigated [4,6]. The injection boreholes are designed to reach depths of 48 m below the Earth’s surface within a third limestone layer [4]. The improvement in the water levels and the decrease in saline intrusion flow towards inland were the main outcomes of this study [4].
This study suggests continuation of artificial recharge flows by MTEs, and their quantities to be increased, especially via injection boreholes with highly permeable aquifer conditions. The objective is to achieve a balanced water budget within the aquifer. However, recent findings by [14] suggest that both seawater intrusion (SWI) and subsequent Managed Aquifer Recharge (MAR) could lead to the release, transport, and transformation of arsenic (As), offering new insights into the geochemical processes of arsenic in coastal aquifers. The authors of [15] studied MAR sites using reclaimed water and showed that artificial recharge, with a rate of 1500 m3/day and a salinity of 3.3 g/L, could produce a recovery in the groundwater level by up to 2.7 m and a reduction in groundwater salinity by as much as 5.7 g/L over an extended simulation period. The authors of [16] mentioned that MAR using tertiary treated wastewater (TTWW) is a feasible approach to developing water resources in arid regions, and the best scenario depends on the decision-maker’s preference when weighing the benefits of MAR and the level of damage to the aquifer.
SWI, on the other hand, can play a mitigating role in nitrate contamination by fostering denitrification and anammox in coastal areas, as indicated by [17]. Laboratory-scale experiments, coupled with numerical simulations, conducted by [18], examined the impact of tides on the effectiveness of artificial freshwater injection in controlling SWI in an unconfined coastal aquifer. While physical barrier techniques prove effective for shallow aquifers, the management of deep aquifers necessitates expensive processes, as highlighted by [19]. A comprehensive approach to SWI management involves hydraulic barriers, encompassing aquifer recharge, brackish water abstraction, or a combination of both, according to [20].
Managed Aquifer Recharge (MAR) emerges as a valuable contributor to colloid and pathogen removal from injectant water, albeit with the challenge of aquifer permeability reduction causing clogging during water infiltration in subsoil, as noted by [21]. Therefore, regular environmental monitoring through the collection of routine water samples from observation boreholes in the injection area is essential. This monitoring aims to assess the presence of heavy metals, cations, anions, and bacteriological components.
In this study, the established MODFLOW, a 3D simulation flow model that is transient in the saturated zone flow, MT3DMS for solute transport, and PMPATH simulation for advective transport, as outlined by [5], are utilized.
1.3. Groundwater Development
To address SWI and maintain a balanced groundwater budget, two key approaches can be implemented:
- Reducing aquifer discharge rates:
- Reducing well abstraction (demand management through appropriate policy tools: economic, environmental);
- Use surplus desalination plant output to substitute for groundwater.
- Increasing aquifer recharge rate:
- MAR techniques by utilizing MTEs to substitute for groundwater.
Practicing both approaches in a sustainable manner is crucial. Additionally, numerical groundwater modeling is used as a tool to measure the effectiveness of these schemes.
1.4. Available Measures to Government
This study estimated the current (2022) water demand in Salalah city at 98 Mm3, and pumping rates at 64 Mm3.
Looking to the future, annual demand for water will increase.
The current (2022) consumption from the seawater desalination plants is 34 Mm3 and demand will increase over the coming 5 years by at least 3% annually. (See Table 1).
Demand through wellfield abstraction rates must be stopped, and the new source of freshwater is from surplus desalinated water, in addition to increasing the aquifer recharge rates by surface irrigation and artificial recharge by reusing MTEs. According to [3], the issue of saltwater intrusion arises from both qualitative and quantitative challenges.
1.5. Numerical Modeling
The study outlines a method that suggests and evaluates two scenarios for groundwater sustainable development to control the SWI in the Salalah coastal aquifer, through transient and predictive simulations for the period 1993 to 2027. (See Figure 1).
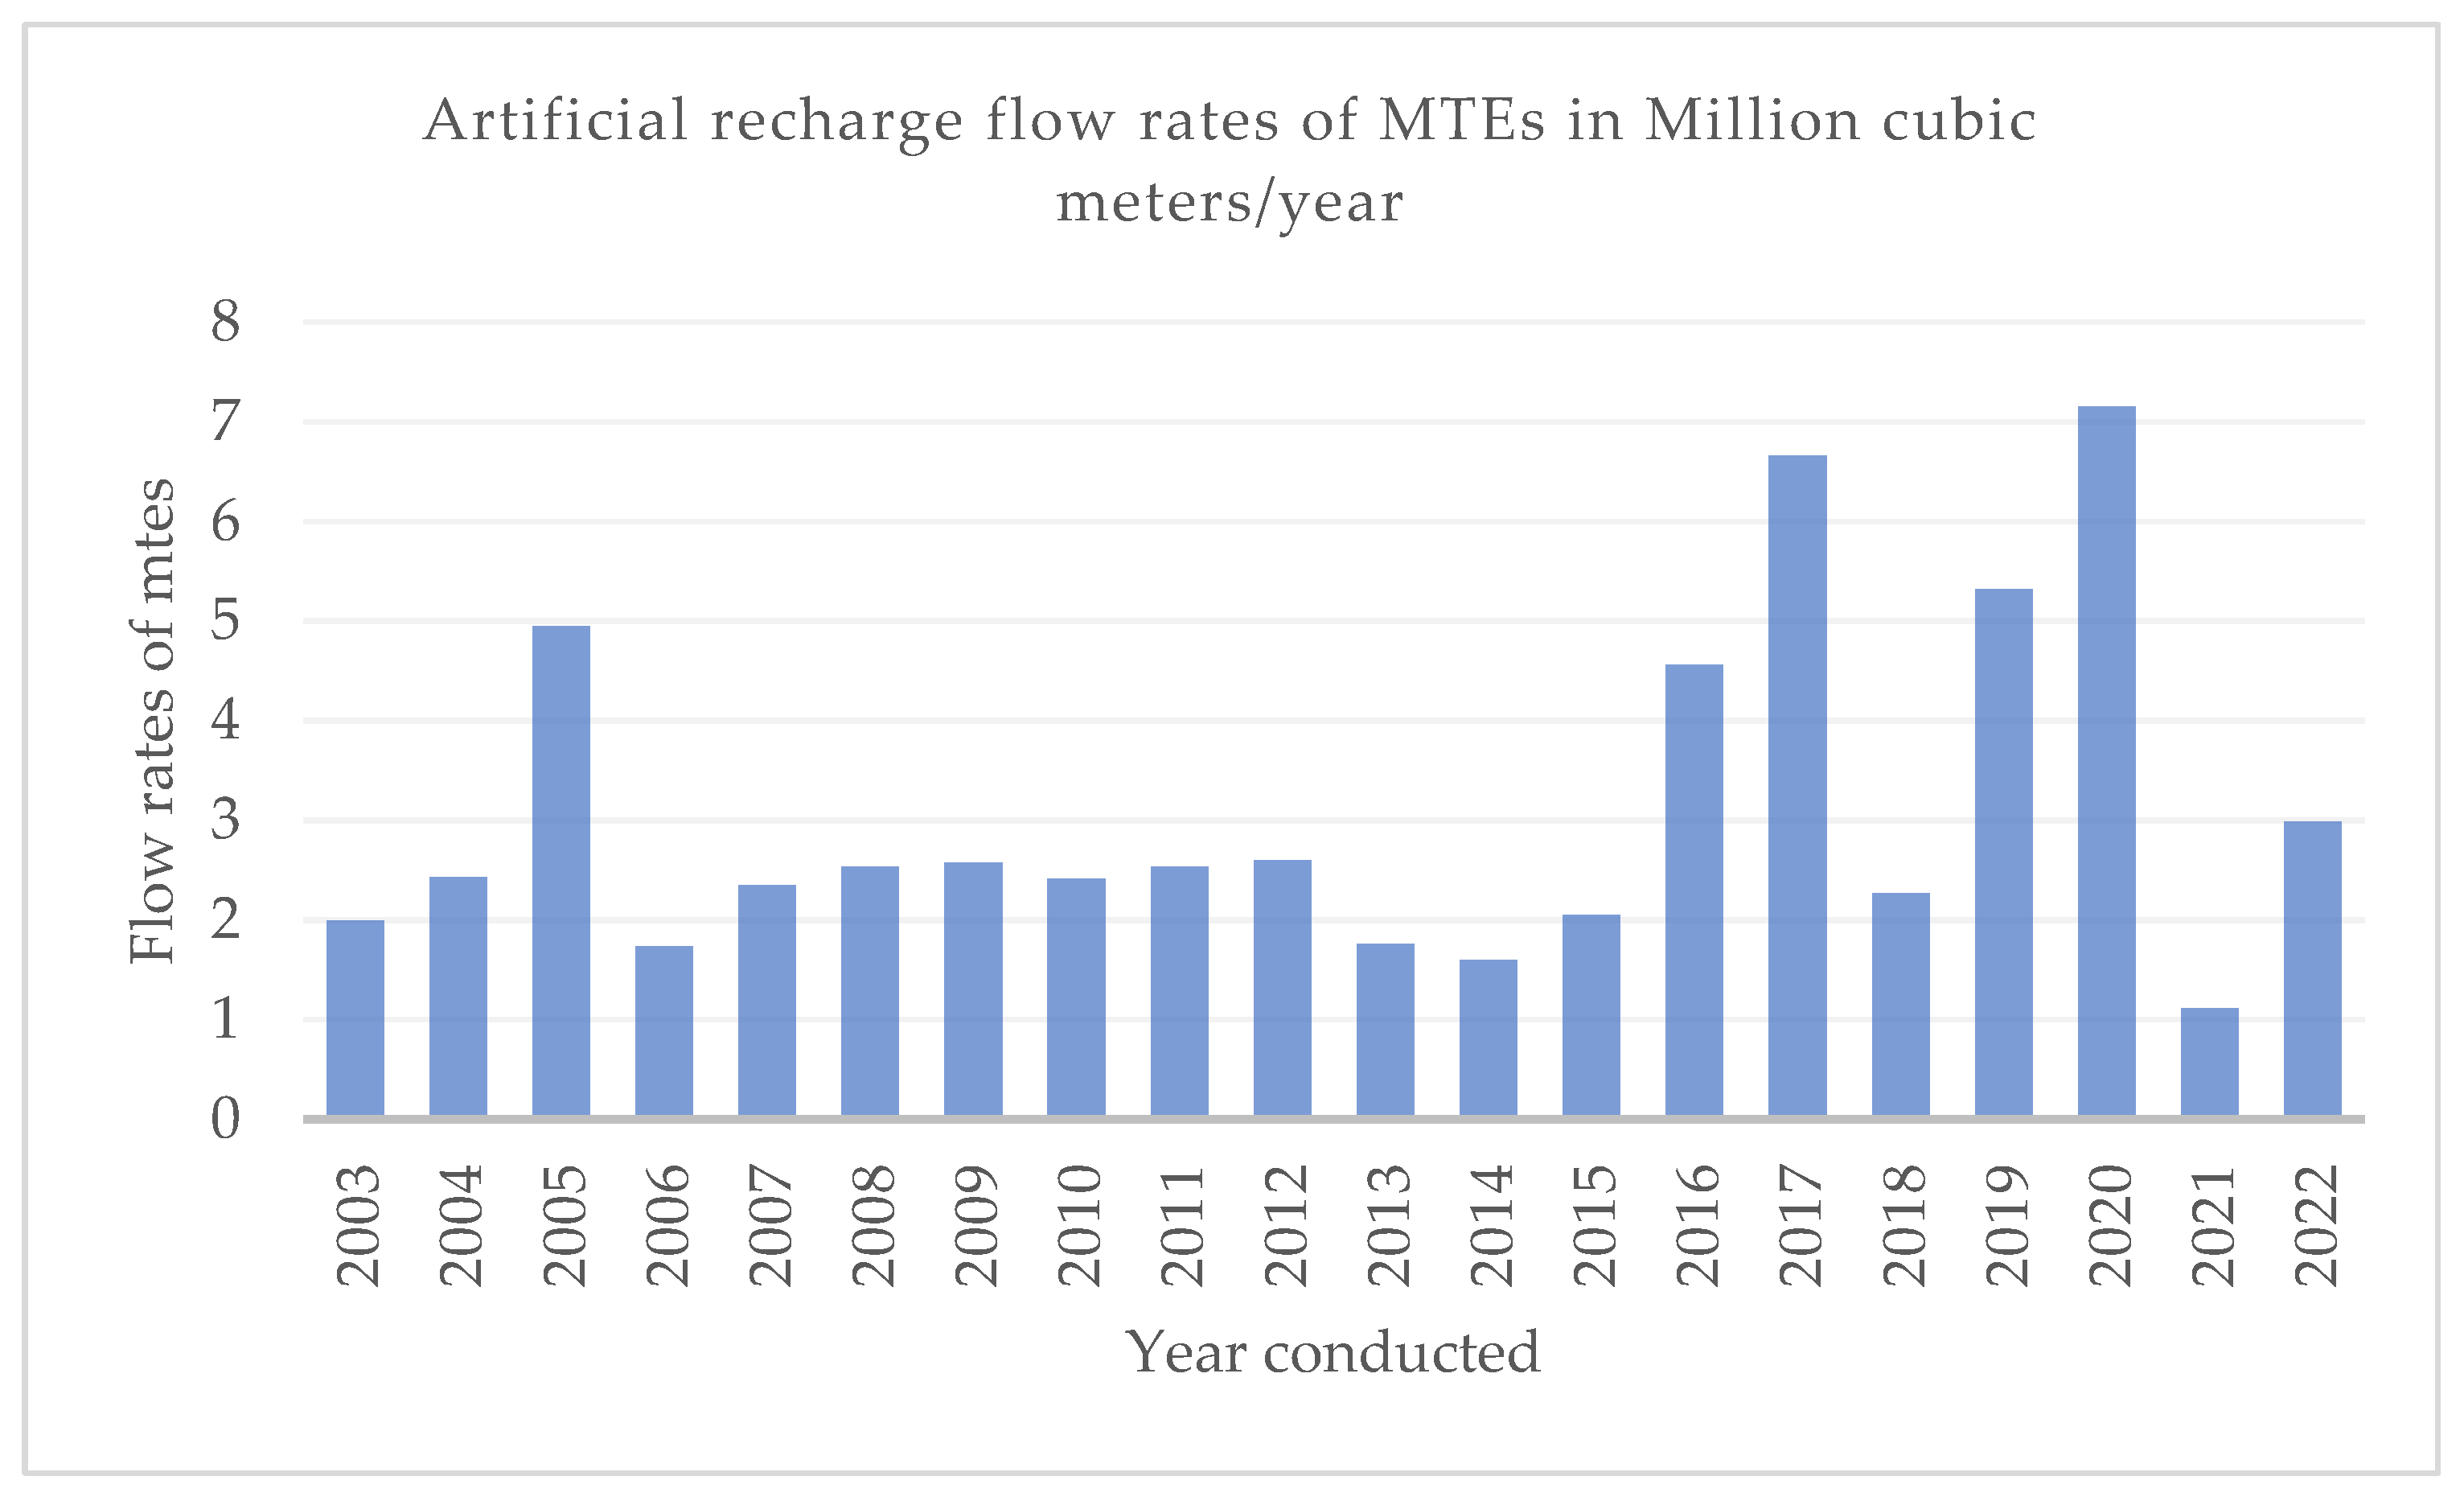
Figure 2 below shows the artificial recharge flow rates by MTEs into injection wells (Mm3/year).
In the first half of 2022 (Jan. to June), the artificial recharge flow rate of MTEs was 1.5 million m3; by assuming flow rates of MTEs in the second half of 2022 were the same as in the first half, then flow rates are assumed at 3 million m3 in 2022.
The hypothetical problem of the flow and solute transport of two novel scenarios along with injected treated wastewater from point sources in the Salalah coastal aquifer was modeled and simulated using computer programs MODFLOW 8.0.31 and MT3DMS 8.0.31. Under transient and predictive conditions, the constructed model was used to predict the behavior of the aquifer under the proposed demand management and supply augmentation from desalinated water. Specifically, two scenarios were explored and run to compute the potentiometric surface and salinity distribution. One involved the cessation of pumping for city water supply from both wellfields, substituted by surplus desalinated water, and the other represented the “business as usual” condition without management interference. The simulations provide insights into the expected changes in hydraulic heads and salinity distribution with and without management intervention for the period 2023 to 2027.
A numerical model was utilized to predict the groundwater levels in the Wadi Al-Jizi coastal aquifer in response to various water abstraction scenarios [22]. Additionally, previous studies used groundwater modeling to predict water and salinity levels, assisting in the management of water resources [23,24,25,26,27,28,29,30,31,32,33,34,35,36].
2. Materials and Methods
The methodology presented in this study involves proposing and assessing scenarios for groundwater sustainable development to manage SWI in the Salalah coastal aquifer using transient and predictive simulation. In this study, two novel scenarios were formulated and investigated for the transient and predictive scenario from 1993 to 2027 to restore the aquifer to a steady-state condition. Scenario A involves ceasing groundwater from both wellfields and supplementing groundwater supply with surplus desalinated water from 2023 to 2027. Conversely, Scenario B maintains business as usual, with continuing pumping from groundwater wellfields during the same predictive period. All scenarios were simulated under a constant underflow. These scenarios represent innovative proposals aimed at addressing aquifer sustainability.
The research utilized modeling methods, such as 3D groundwater flow simulation modeling and predictive modeling of solute advection transport, to analyze the behavior of the Salalah coastal aquifer. Utilizing a 3D groundwater flow simulation model, MODFLOW [37], numerical modeling was conducted. Solute transport modeling was achieved through MT3DMS, a mass transport simulation model, coupled with PMPATH for advective transport simulation [38]. The theoretical framework of the model for seawater intrusion in the Salalah coastal aquifer was elucidated by [1]. Ref. [5] enhanced the framework by focusing on predicting flow and solute transport to manage the Salalah coastal aquifer utilizing the MODFLOW model. Moreover, Ref. [6] examined the use of artificial recharge to halt saline intrusion in the Salalah coastal aquifer. The hydrogeological conceptual model and aquifer boundary conditions were explained in a previous study [1,3,5].
In terms of restrictions and limitations, in using the Processing MODFLOW data editor, the study only employed 3 layers, despite the software allowing up to 80 layers. Additionally, each stress period in the study represents a year within a 35-year timeframe, from 1993 to 2027, for analysis, even though MODFLOW permits up to 100 stress periods. As a result, any limitations, within the MODFLOW model did not affect the research methodology or results.
3. Results and Discussions
As of 2022, various sectors in Salalah city rely on different water sources, with approximately 36% from desalinated seawater, around 52% from groundwater, and 9% from natural rainfall recharge in the Salalah plain area. Additionally, 3% of the water supply is provided by Municipal Treated Effluents (MTEs) from the Salalah central sewage treatment plant in Raysut (West Salalah) (Figure 3).
The domestic water demand is projected to increase by 3% annually through the predictive period 2023–2027. During this study, the researcher constructed, formulated, and examined two innovative scenarios covering the period from 1993 to 2027, with the aim of stabilizing the water balance of the aquifer. Scenario A proposes to stop groundwater extraction from both wellfields and to compensate the water supply from surplus desalinated water plants from the predictive period 2023 to 2027. In contrast, Scenario B follows the business-as-usual condition, and continues to pump groundwater from the wellfields throughout the same time frame. These scenarios suggested new perspectives and potential solutions to address the sustainability challenges facing the Salalah coastal aquifer.
The simulations were conducted based on two scenarios. The initial scenario involved ceasing abstraction from Salalah and Saada Wellfields during the predictive period from 2023 to 2027. The developed flow model projected that, under constant underflow, the saline intrusion wedge in 2027 would extend up to 0 m and 750 m from the shoreline for Scenarios A and B, respectively.
In the Batinah coastal aquifer of Northern Oman, the delineation of the saline intrusion wedge reached up to 10 kilometers from the coast, as reported by [39]. Delineation of the saline intrusion wedge was detected [40,41]. Seawater Intrusion was studied for water resource management [42,43,44]. According to this study, Scenario A is deemed effective in advancing the saline zone front to the shoreline (0 m) in 2027 under constant underflow. In the transient case of pumping wells at Garziz Farms for years 2023–2027, it is assumed the pumping from the three wells will remain constant.
3.1. Water Levels Results (Piezometric Surface)
The model predicted a decrease in drawdowns by the end of the prediction period (2027) for Scenarios A and B, as compared to the drawdowns in 2011. Scenario B, representing “business as usual”, demonstrated a sustained decline in potentiometric heads throughout both the transient calibration and predictive stages. Conversely, Scenario A, involving the cessation of groundwater pumping from Salalah and Saada wellfields, exhibited an increase in potentiometric heads during the transient calibration and predictive stages.
Figure 4A illustrates the encroachment of seawater intrusion into the southern part of the Salalah coastal aquifer. The figure reveals a notable decrease in the water level, with the water level dropping to 0 m at a distance of over 2 km inland.
Figure 4B shows the intrusion of seawater into the southern section of the Salalah coastal aquifer. The figure describes a notable decrease in the water level, with the water level falling to 0 m at a distance of over 1 km inland.
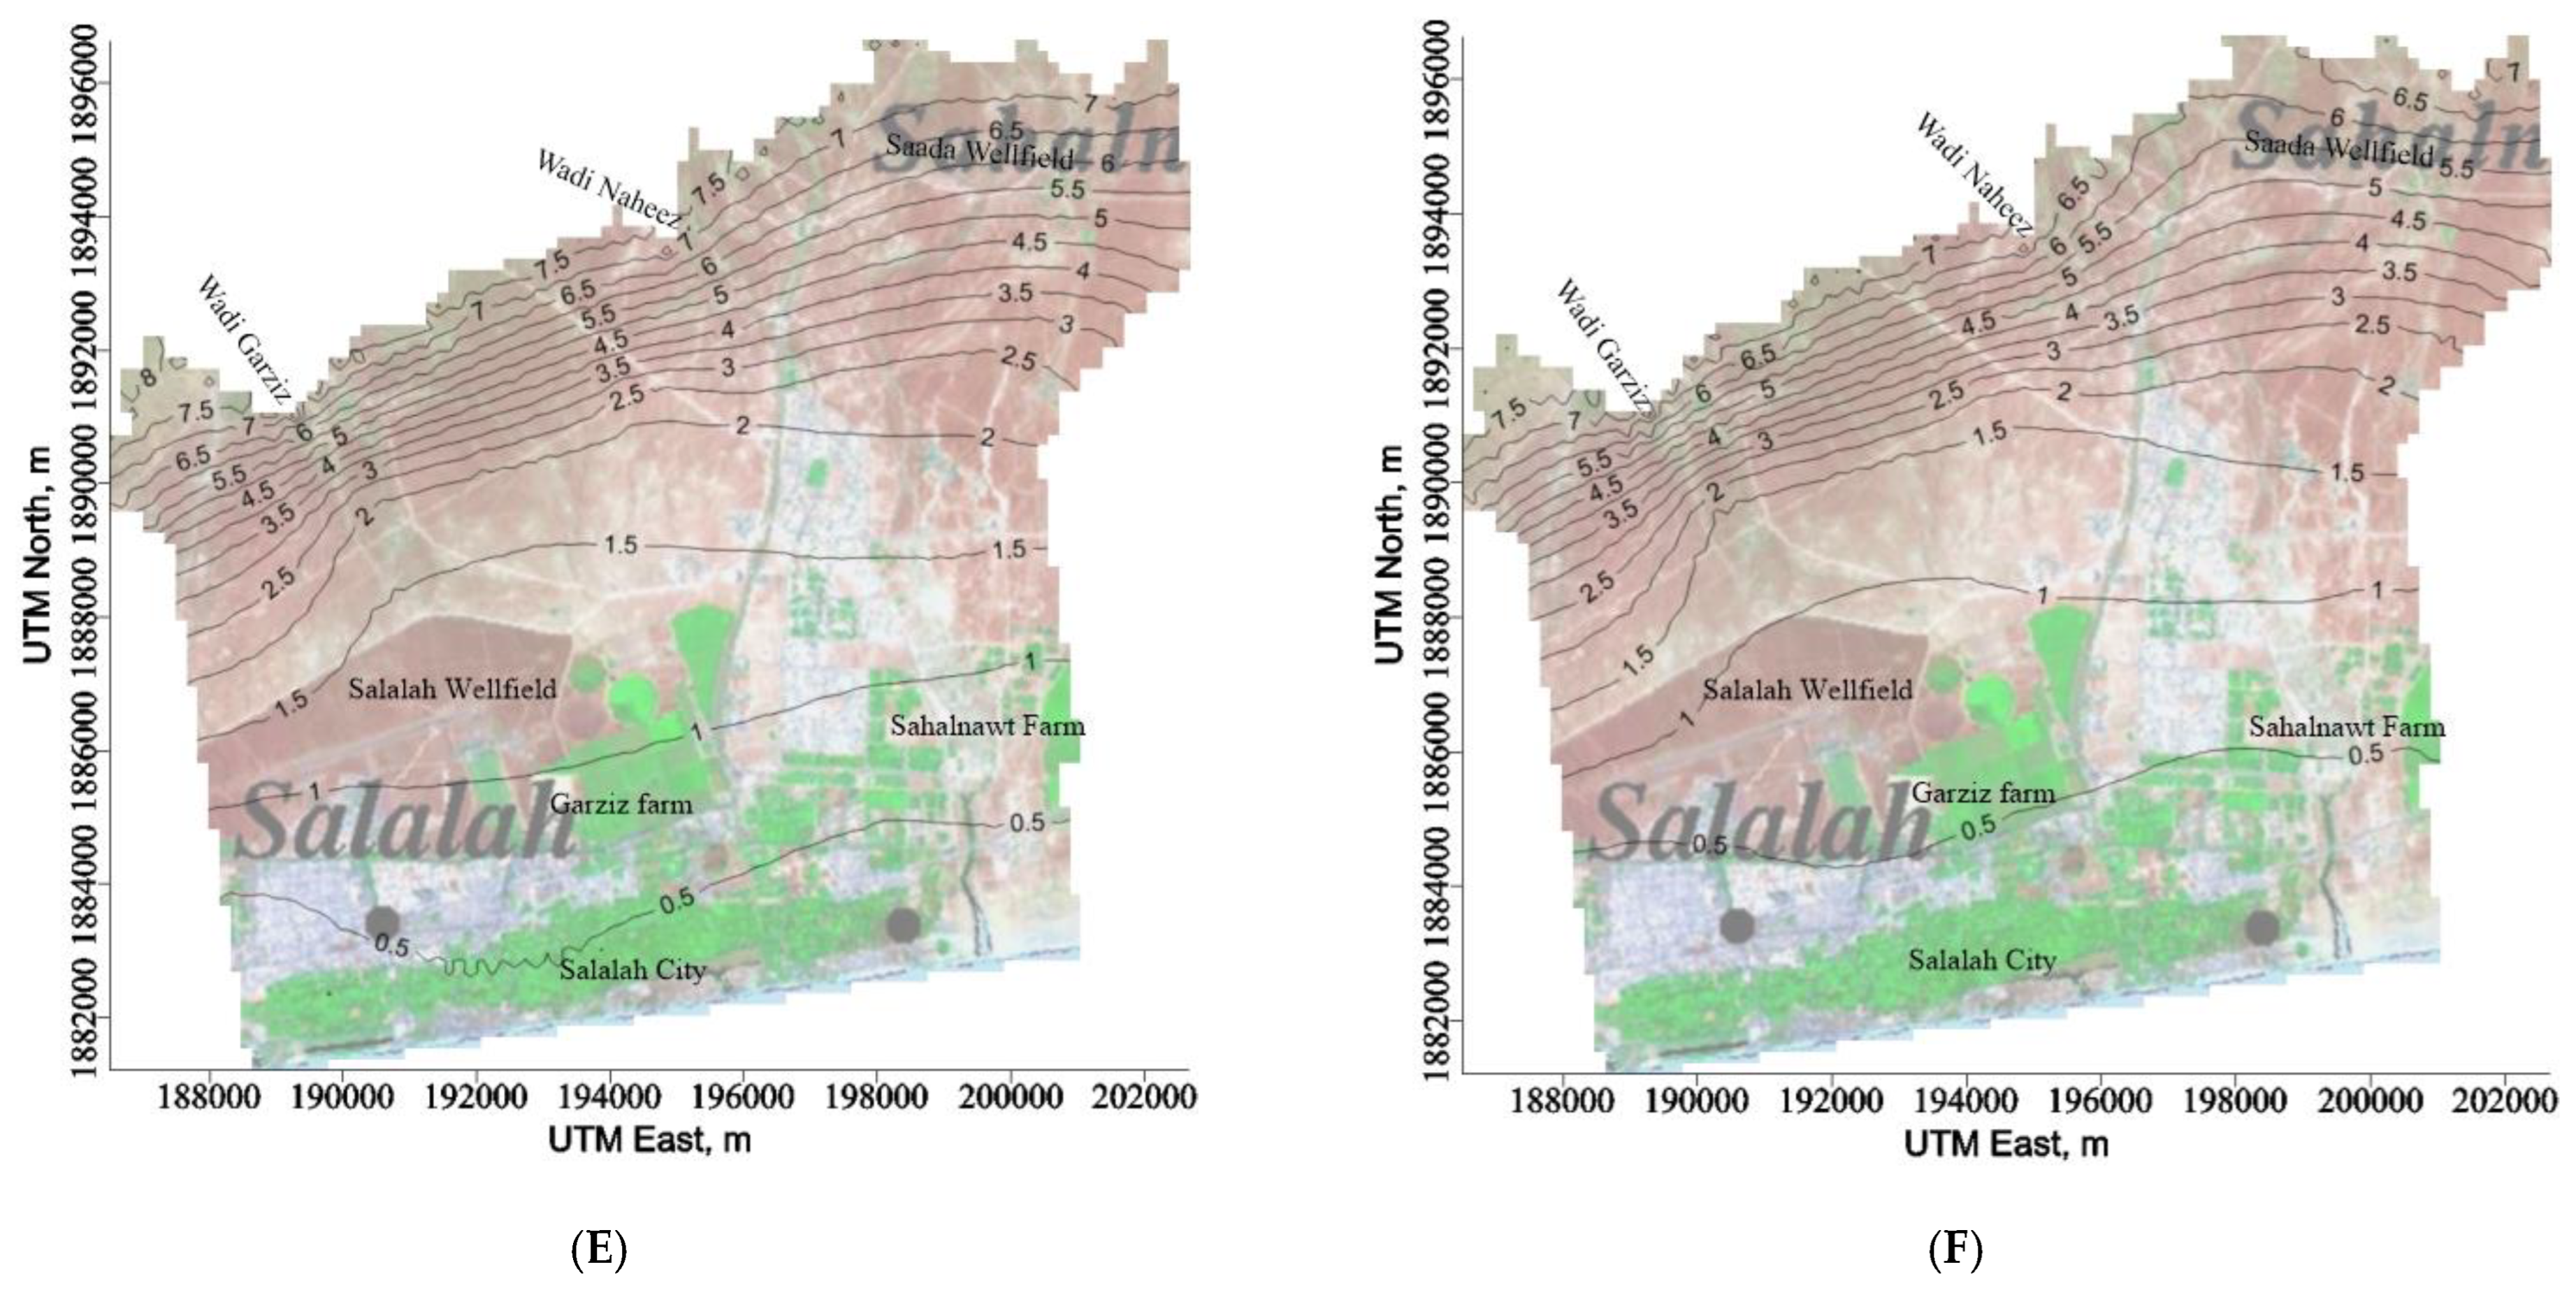
Figure 4C shows that no saline intrusion is simulated in year 2018 because a surplus in the Salalah plain recharge, estimated in this study at 53 million cubic meters, percolated into the aquifer from the rainfall of Cyclone Mekunu, which occurred in Dhofar Governorate, Oman, in May 2018.
Figure 4D demonstrates that there was a small simulated saline intrusion in the year 2022 because various sectors in Salalah city depend on different water sources, with approximately 36% from desalinated seawater and approx. 52% from the Salalah coastal aquifer.
Figure 4E demonstrates that there will be no simulated saline intrusion in the year 2027 under Scenario A: stop pumping from both wellfields during the predictive scenario, because the abstraction from both wellfields is stopped under Scenario A, allowing the aquifer water level to return to a steady-state situation.
Figure 4F presents the intrusion of seawater into the southern part of the Salalah coastal aquifer. In the year 2027 under Scenario B: business as usual during the predictive scenario, the wedge of saline intrusion was delineated from the shoreline up to 800 m inland. The flow model anticipates the groundwater levels in the Salalah coastal aquifer as of the current year (2022) will continue, and the underflow from the mountain remains constant for both scenarios (Table 2).
To calculate the percentage of reduction or increase in drawdown (m/year) in Scenario A and Scenario B in 2022 compared to the drawdown in 2011, the following formula was used:
For Scenario A: Old Value (2011) = 0.7319909 m/year and New Value (2022) = 0.3525451 m/year.
For Scenario B: Old Value (2011) = 0.7319909 m/year and New Value (2022) = 0.5206156 m/year.
In Scenario A, the drawdown (m/year) in 2022 decreased by approximately 51.79% compared to the drawdown in 2011. This indicates a significant reduction in drawdown, which could be seen as a positive outcome for the aquifer. A decrease in drawdown suggests that the rate of water level decline has slowed.
In Scenario B, the drawdown (m/year) in 2022 decreased by approximately 28.90% compared to the drawdown in 2011. While there is still a reduction, it is not as significant as that in Scenario A. The aquifer in Scenario B also experienced a decrease in drawdown, indicating a relatively slower rate of water level decline compared to 2011.
In both scenarios, there is a reduction in drawdown by 2022, which suggests some level of conservation or better management of the aquifer. However, Scenario A shows a more substantial reduction, which might indicate more effective measures in controlling drawdown and preserving the aquifer’s water levels. Further analysis would be needed to determine the specific factors and management practices that led to these changes.
From Table 2, drawdown is decreased in 2027 in predictive Scenario A compared to the transient scenario in 2022.
To calculate the percentage of reduction or increase in drawdown (m/year) in Scenario A and Scenario B in 2022 compared to the drawdown in 2014 and 2018, you can use Equation (1):
Calculate the percentage changes for both scenarios compared to the drawdown values in 2014 and 2018:
For Scenario A: Old Value (2014) = 0.6089069 m/year, Old Value (2018) = 0.4557001 m/year, New Value (2022) = 0.3525451 m/year.
Percentage Change in Scenario A:
For 2014 to 2022: Percentage Change in Scenario A: () × 100% ≈ −42.10%
For 2018 to 2022: Percentage Change in Scenario A: () × 100% ≈ −22.57%
For Scenario B: Old Value (2014) = 0.6089069 m/year, Old Value (2018) = 0.4557001 m/year, and New Value (2022) = 0.5206156 m/year
Percentage Change in Scenario B:
For 2014 to 2022: Percentage Change in Scenario B: () × 100% ≈ −14.53%
For 2018 to 2022: Percentage Change in Scenario B: () × 100% ≈ 14.26%
In Scenario A, from 2014 to 2022, there is a reduction in drawdown of approximately 42.1%. This suggests an overall improvement in the drawdown situation in Scenario A during this period. From 2018 to 2022, there is still a reduction in drawdown, but it is less significant, at approximately 22.57%. This indicates that the rate of improvement has slowed between 2018 and 2022 compared to the earlier period.
For Scenario B: From 2014 to 2022, there is a reduction in drawdown of approximately 14.53%. This suggests an improvement in drawdown, although it is not as significant as that in Scenario A. From 2018 to 2022, there is an increase in drawdown of approximately 14.26%. This indicates a reversal of the improvement observed between 2018 and 2022.
It is important to note that the recharge event from the 2018 cyclone had a significant positive impact in 2018, replenishing the aquifer and reducing drawdown. The subsequent trends in drawdown from 2018 to 2022 differ between the two scenarios, with Scenario A showing a continued reduction in drawdown, albeit at a slower rate, and Scenario B showing an increase. These changes may be influenced by various factors, including an effective strategy for aquifer sustainable management in Scenario A.
On the east side of the Salalah coastal aquifer, the wedge of saline intrusion was delineated, up to 1800 m from the shoreline in year 2011, and decreased to 1200 m in year 2014 and to nil (0 m) in year 2018. This is because the extra surplus of the Salalah plain recharge, estimated in this study at 53 million cubic meters, percolated into the aquifer from the rainfall of Cyclone Mekunu, which occurred in Dhofar Governorate, Oman, in May 2018. In 2022, the wedge of saline intrusion was delineated, up to 600 m from the shoreline, and in 2027 it was nil (0 m) and up to 700 m under Scenarios A and B, respectively. By comparison, on the west side of the Salalah coastal aquifer, the wedge of saline intrusion was delineated, up to 2000 m, 1700 m, 800 m, and 750 m from the shoreline, in years 2011, 2014, 2022, and 2027 (under Scenario B), respectively.
3.2. Solute Transport Results
The business-as-usual Scenario B demonstrates a persistent rise in Total Dissolved Solids (TDSs) during both the transient calibration and predictive phases. According to Table 3, TDS exhibits an upward trend in the predictive baseline Scenario B. Notably, the model cell (Layer, Row, Column) = (1, 51, 6) is situated approximately 200 m below the treated sewage injection bores.
Figure 5A illustrates the intrusion of seawater into the southern part of the Salalah coastal aquifer. The figure shows a notable increase in the salinity levels, with the salinity levels rising to 10,000 mg/L at a distance of over 500 m inland.
Figure 5B demonstrates the intrusion of seawater into the southern part of the Salalah coastal aquifer. The figure illustrates a notable increase in the salinity levels, with the salinity levels rising to 10,000 mg/L at a distance of over 300 m inland.
Figure 5C illustrates that there was no rise in the TDS levels into the entire Salalah coastal aquifer. This is attributed to the surplus recharge from Cyclone Mekunu rainfall that occurred in Salalah in May 2018.
Figure 5D shows that there is slight simulated saline intrusion in the southern part of the Salalah coastal aquifer in the year 2022. This is primarily because various sectors in Salalah city rely on the Salalah coastal aquifer for 52% of their water needs, and approx. 36% of the water demand is supplied through pipelines from desalinated seawater.
Figure 5E shows that in the year 2027 under Scenario A: stop pumping from both wellfields during the predictive scenario, there was no simulated saline intrusion and no rise in TDS levels in the entire Salalah coastal aquifer because the extraction from both wellfields ceased under Scenario A, allowing the salinity levels to return to a steady-state condition.
Figure 5F shows that in the year 2027 under Scenario B: business as usual during the predictive scenario, saline intrusion was simulated and TDS levels increased throughout the Salalah coastal aquifer due to the persistence of business-as-usual conditions in Scenario B.
From Table 3, TDS (mg/L) decreases in 2027 in predictive Scenario A compared to the transient scenario in 2022. TDS (mg/L) decreases in 2027 in predictive Scenario B compared to the transient scenario in 2022.
To calculate the percentage reduction or increase in Total Dissolved Solid (TDS) levels in Scenario A and Scenario B in 2027 compared to the TDS levels in 2011, 2014, 2018, and 2022, you can use Equation (1):
Calculate the percentage changes for both scenarios compared to the TDS values in each year:
For Scenario A in 2027: TDS in 2011 = 12,477 mg/L, TDS in 2014 = 14,381 mg/L, TDS in 2018 = 13,828 mg/L, TDS in 2022 = 12,233 mg/L, and TDS in 2027 = 8712 mg/L.
Percentage Change in Scenario A (2027 vs. 2011) = () × 100% ≈ −30.28%
Percentage Change in Scenario A (2027 vs. 2014) = () × 100% ≈ −39.55%
Percentage Change in Scenario A (2027 vs. 2018) = () × 100% ≈ −36.97%
Percentage Change in Scenario A (2027 vs. 2022) = () × 100% ≈ −28.95%. This indicates a decrease of approximately 29% in the TDS (mg/L) value from 2022 to 2027 in Scenario A.
For Scenario B in 2027: TDS in 2011 = 12,477 mg/L, TDS in 2014 = 14,381 mg/L, TDS in 2018 = 13,828 mg/L, TDS in 2022 = 12,233 mg/L, and TDS in 2027 = 10,299 mg/L.
Percentage Change in Scenario B (2027 vs. 2011) = () × 100% ≈ −17.46%
Percentage Change in Scenario B (2027 vs. 2014) = () × 100% ≈ −28.40%
Percentage Change in Scenario B (2027 vs. 2018) = () × 100% ≈ −25.82%
Percentage Change in Scenario B (2027 vs. 2022) = () × 100% ≈ −15.79%. This indicates a decrease of approximately 16% in the TDS (mg/L) value from 2022 to 2027 in Scenario B.
In both Scenario A and Scenario B, the TDS levels in 2027 are lower than the TDS levels in each of the previous years (2011, 2014, 2018, and 2022). This indicates a reduction in salinity levels in both scenarios over time.
Scenario A generally shows a higher percentage reduction in TDS levels compared to Scenario B. This suggests that the measures or conditions in Scenario A have been more effective in reducing salinity levels. In Scenario A, the reduction ranges from approximately 29% (compared to 2022) to 40% (compared to 2014). In Scenario B, the reduction ranges from approximately 16% (compared to 2022) to 28.4% (compared to 2014).
To compare the TDS within the agricultural coastal belt in Baseline B to Baseline A, we can use the percentage changes: Scenario A has a larger negative percentage change, approx. −29%, compared to Scenario B, approx. −16%; this indicates that the TDS in Scenario A has decreased more than that in Scenario B from 2022 to 2027.
The reduction in salinity levels can have positive implications for the quality of the aquifer water, making it more suitable for various uses, including drinking water and irrigation. The specific factors contributing to the reduction in TDS levels may include improved sustainable management practices in Scenario A compared to in Scenario B.
3.3. Advection Transport Results
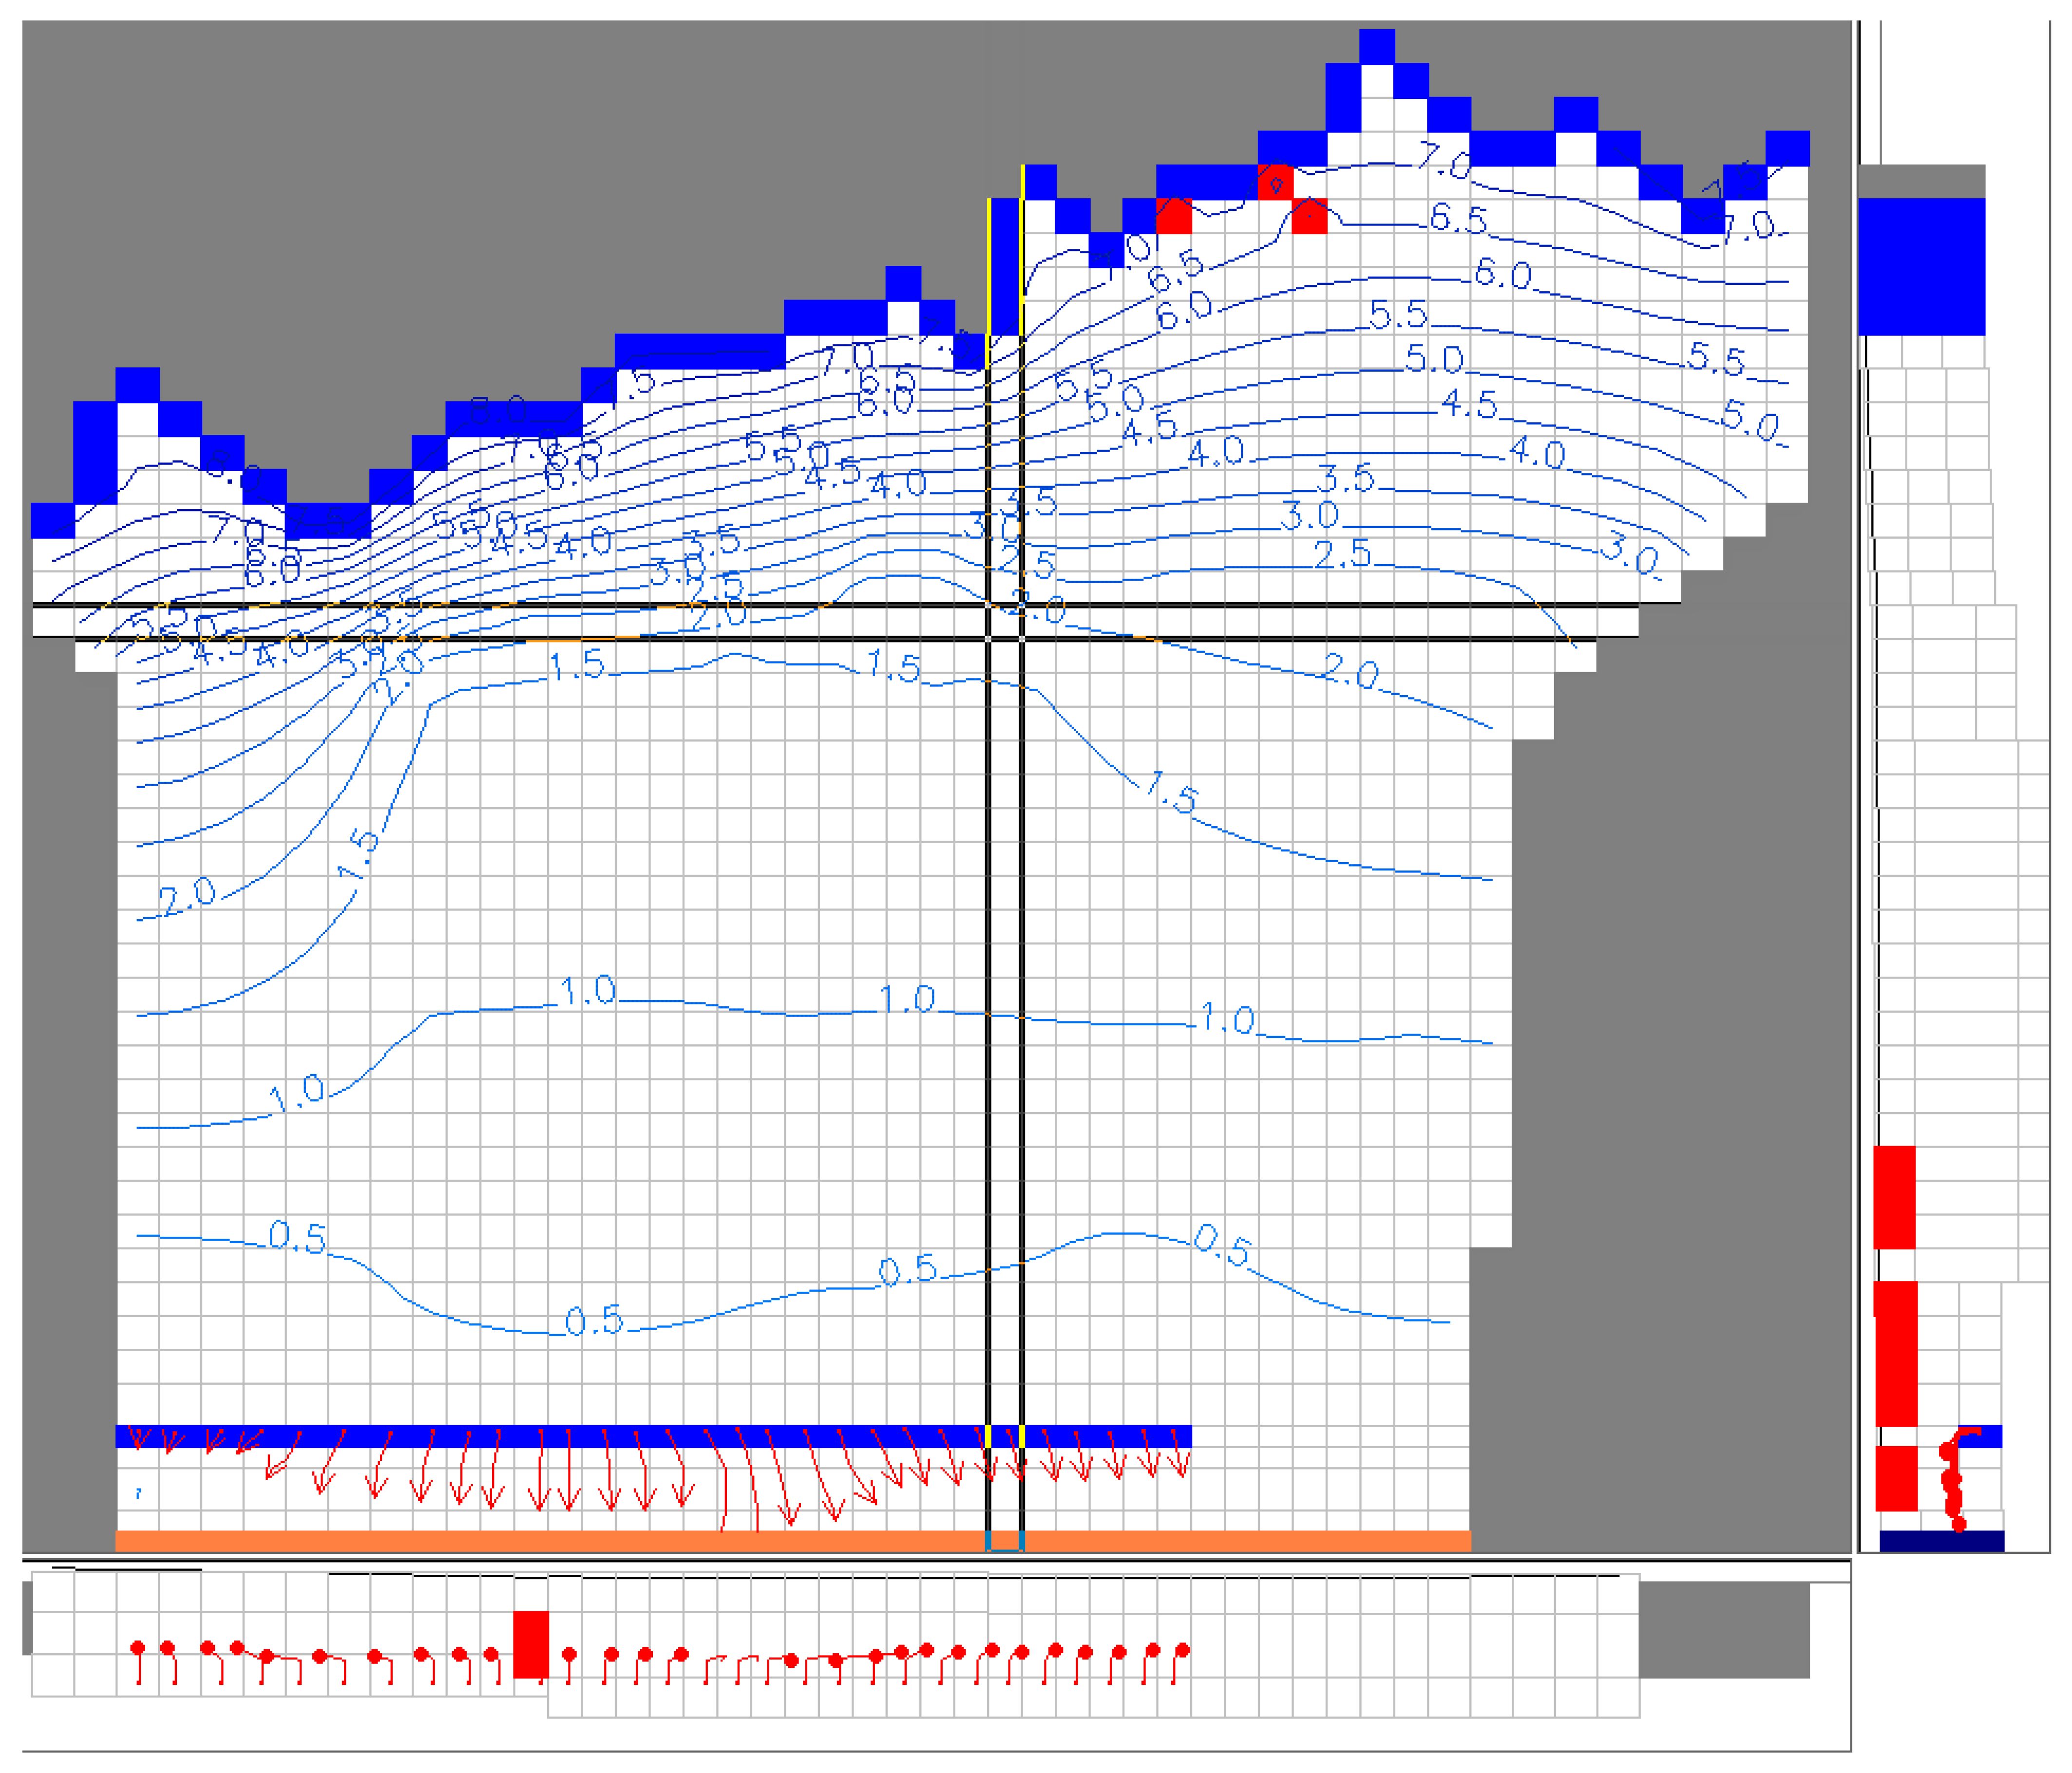
Figure 6 illustrates the invasion of seawater intrusion into the southern part of the Salalah aquifer. This figure shows a drop in the water level in the southern part of the plain coastal area, with the water level decreasing to 0 m at over 2 km landward.
Figure 7 shows the intrusion of seawater into the southern section of the Salalah coastal aquifer. This figure illustrates a remarkable decrease in the water level, with the water level dropping to 0 m at a distance of over 1 km upstream of the shoreline.
Figure 8 demonstrates that PMPATH (advection transport) shows that the advection transport of the injected treated wastewater fluids would exceed a distance of 1000 m downstream from the injection bores after two years. This indicates the likely dispersion of the injected MTEs subsurface towards the shoreline within a two-year period in Scenario A. This can be attributed to the excess recharge resulting from the rainfall of Cyclone Mekunu, which hit Salalah in May 2018, pushing back the seawater interface towards the coast.
Figure 9 shows that there a slight saline intrusion was simulated in the year 2022, as many sectors in Salalah city depend on different water sources, with water supply from both desalinated seawater plants at approx. 36%, in addition to 3% from artificial recharge from MTEs, versus a decrease in the abstraction from Salalah plain aquifer, which reached only approx. 52%.
Figure 10 shows that the advection transport of the injected treated wastewater fluids would exceed a distance of 1000 m downstream from the injection bores after one year. This indicates the potential dispersion of the injected treated wastewater effluents subsurface towards the downstream within a one-year period under predictive Scenario A, pushing the seawater interface back strongly towards the coast.
Figure 11 shows that the advection transport of the injected treated wastewater fluids would reach a distance of 200 m downstream from the injection bores after one year. This indicates the low dispersion of the injected treated wastewater effluents underground towards downstream within a one-year period due to business-as-usual Scenario B, pushing the seawater interface back ineffectively towards the coast.
4. Conclusions
This study examined two innovative scenarios to assess the status of the current and predictive SWI in the Salalah coastal aquifer. This investigation developed numerical groundwater modeling scenarios to determine the behavior of the aquifer. This study was a comprehensive assessment, in which numerical groundwater modeling scenarios were developed to determine the status of the current and predictive SWI in the Salalah coastal aquifer.
This study examined flow simulation to obtain groundwater levels results using MODFLOW, and salinity levels were simulated using solute transport MT3DMS and advective transport was simulated using the PMPATH model. This study focused on developing and evaluating two novel scenarios, with particular emphasis on the transient and predictive scenarios spanning from 1993 to 2027. The first scenario is to stop groundwater pumping from Salalah and Saada wellfields and compensate groundwater supply from both wellfields using surplus desalinated water. The second scenario is business as usual, and involves a continuation of pumping from both wellfields during the predictive period from 2023 to 2027. This study shed light on the aspects of proposed scenarios and their implications for managing the Salalah coastal aquifer.
4.1. Flow Model—Conclusions
Two scenarios were run to determine the effects of management and absence of management on the aquifer’s water levels and salinity. Both scenarios predict how the aquifer will perform over the next 5 years. The management scenario (Scenario A) has a positive impact on the quality and quantity of water in the aquifer.
Scenario A proposes a 17% reduction in the current discharge from the aquifer compared to the levels in 2022. The introduction of treated wastewater into the Salalah coastal aquifer has played a crucial role in stabilizing water levels. However, the efficacy of this injection scheme is significantly compromised without adequate management, especially in the eastern and western regions of the plain and coastal areas (Scenario B). In these areas, hydraulic conductivity is lower compared to the central part of the plain and coastal area.
4.2. Solute Transport Model—Conclusions
Throughout the predicted time, the natural flow of water remains constant. In Scenario B, “business as usual”, the impact of saltwater intrusion is more noticeable than in Scenario A. By 2027, the expected decrease in salt levels within the agricultural coastal area is around 13% less in Scenario A than in Scenario B. So, according to this study, Scenario A is predicted to have a more significant reduction in salt levels in the coastal farming area compared to Scenario B over the period from 2022 to 2027.
Under Scenario A, the impact of saline water from the coast diminishes. This study suggests that Scenario A is successful in pushing back the saline zone by approximately 1000 m. On the other hand, in Scenario B, in which water continues to be pumped from both wells, the salt levels will decrease slightly.
4.3. Advection Transport Model—Conclusions
The PMPATH model highlights the dispersion of the injected treated wastewater effluents underground towards downstream within a one-year period, causing the seawater interface to move back towards the coast.
5. Recommendations
Scenario A is the best sustainable approach in terms of increasing groundwater levels and reducing the TDS during predictive period. The following are strongly recommended for managing the water resources of the Salalah coastal aquifer:
- Stop groundwater pumping from Salalah and Saada wellfields and compensate groundwater supply from both wellfields using surplus desalinated water.
- Increase the injection of treated wastewater effluents into the constructed boreholes.
- In the future, the study of sustainable development by implementing Scenario A, with an evaluation after five years of operation, is recommended.
- This research emphasizes the need to quickly reduce the current excessive withdrawal of water from both wellfields to ensure the sustainable development of the aquifer.
Funding
This research received no external funding.
Institutional Review Board Statement
Not applicable.
Informed Consent Statement
Not applicable.
Data Availability Statement
Data is contained within the article.
Conflicts of Interest
The author declares no conflicts of interest.
References
- Shammas, M.I.; Jacks, G. Seawater intrusion in the Salalah plain aquifer, Oman. Environ. Geol. 2007, 53, 575–587. [Google Scholar] [CrossRef]
- Shammas, M.I. Impact of the Al-Qara mountain fogwater forest on groundwater recharge in the Salalah coastal aquifer: Sultanate of Oman. Ecohydrol. Hydrobiol. 2007, 7, 37–49. [Google Scholar] [CrossRef]
- Shammas, M.I. Sustainable Management of the Salalah Coastal Aquifer in Oman Using an Integrated Approach. TRITA-LWR PHD. Doctoral Thesis in Land and Water Resources Sciences, KTH Architecture and the Built Environment, Stockholm, Sweden. 2007, p. 1031. Available online: https://www.diva-portal.org/smash/get/diva2:12072/FULLTEXT01.pdf (accessed on 6 April 2024).
- Shammas, M.I. The effectiveness of artificial recharge in combating seawater intrusion in Salalah coastal aquifer, Oman. Environ. Geol. 2008, 55, 191–204. [Google Scholar] [CrossRef]
- Shammas, M.I.; Thunvik, R. Predictive simulation of flow and solute transport for managing the Salalah coastal aquifer, Oman. Water Resour. Manag. 2009, 23, 2941–2963. [Google Scholar] [CrossRef]
- Shammas, M.I. Artificial recharge via injection wells for salinity ingress control of Salalah plain aquifer, Sultanate of Oman. Desalination Water Treat. 2022, 263, 230–247. [Google Scholar] [CrossRef]
- Sherif, M.M.; Singh, V.P. Effect of groundwater pumping on seawater intrusion in coastal aquifers. Agric. Sci. J. 2002, 7, 61–67. Available online: https://journals.squ.edu.om/index.php/jams/article/view/605 (accessed on 6 April 2024).
- Yang, H.; Sun, H.; Liu, T.; Yang, X.; Yang, F.; Jiao, J. Characterization of seawater intrusion based on machine learning and implications for offshore management under shared socioeconomic paths. J. Hydrol. 2023, 623, 129862. [Google Scholar] [CrossRef]
- Kumar, P.; Mukherjee, S. Impact of limestone caves and seawater intrusion on coastal aquifer of middle Andaman. J. Contam. Hydrol. 2023, 256, 104197. [Google Scholar] [CrossRef]
- Bourjila, A.; Dimane, F.; Ghalit, M.; Taher, M.; Kamari, S.; El Hammoudani, Y.; Achoukhi, I.; Haboubi, K. Mapping the spatiotemporal evolution of seawater intrusion in the Moroccan coastal aquifer of Ghiss-Nekor using GIS-based modeling. Water Cycle 2023, 4, 104–119. [Google Scholar] [CrossRef]
- Liptrot, T.; Hussein, H. Between regulation and targeted expropriation: Rural-to-urban groundwater reallocation in Jordan. Water Altern. 2020, 13, 864–885. [Google Scholar]
- Benedict, S.; Hussein, H. An Analysis of Water Awareness Campaign Messaging in the Case of Jordan: Water Conservation for State Security. Water 2019, 11, 1156. [Google Scholar] [CrossRef]
- Odeh, T.; Mohammad, A.H.; Hussein, H.; Ismail, M.; Almomani, T. Over-pumping of groundwater in Irbid governorate, northern Jordan: A conceptual model to analyze the effects of urbanization and agricultural activities on groundwater levels and salinity. Environ. Earth. Sci. 2019, 78, 40. [Google Scholar] [CrossRef]
- Yuan, C.; Wei, Y.; Xu, X.; Cao, X. Transport and transformation of arsenic in coastal aquifer at the scenario of seawater intrusion followed by managed aquifer recharge. Water Res. 2023, 229, 119440. [Google Scholar] [CrossRef] [PubMed]
- Jarraya Horriche, F.; Benabdallah, S. Assessing Aquifer Water Level and Salinity for a Managed Artificial Recharge Site Using Reclaimed Water. Water 2020, 12, 341. [Google Scholar] [CrossRef]
- Al-Maktoumi, A.; Zekri, S.; El-Rawy, M.; Abdalla, O.; Al-Abri, R.; Triki, C.; Bazargan-Lari, M.R. Aquifer storage and recovery, and managed aquifer recharge of reclaimed water for management of coastal aquifers. Desalination Water Treat. 2020, 176, 67–77. [Google Scholar] [CrossRef]
- Xiong, G.; Zhu, X.; Wu, J.; Liu, M.; Yang, Y.; Zeng, X. Seawater intrusion alters nitrogen cycling patterns through hydrodynamic behavior and biochemical reactions: Based on Bayesian isotope mixing model and microbial functional network. Sci. Total Environ. 2023, 867, 161368. [Google Scholar] [CrossRef] [PubMed]
- Wu, P.; Comte, J.-C.; Li, F.; Chen, H. Influence of tides on the effectiveness of artificial freshwater injection in mitigating seawater intrusion in an unconfined coastal aquifer. J. Hydrol. 2023, 617 Pt B, 129043. [Google Scholar] [CrossRef]
- Benaafi, M.; Abba, S.I.; Aljundi, I.H. State-of-the-art on the conceptual advancement of seawater intrusion: A comprehensive review, management, and possible future research direction. J. King Saud Univ.–Sci. 2023, 35, 102749. [Google Scholar] [CrossRef]
- Hussain, M.S.; Abd-Elhamid, H.F.; Javadi, A.A.; Sherif, M.M. Management of Seawater Intrusion in Coastal Aquifers: A Review. Water 2019, 11, 2467. [Google Scholar] [CrossRef]
- Masciopinto, C. Management of aquifer recharge in Lebanon by removing seawater intrusion from coastal aquifers. J. Environ. Manag. 2013, 130, 306–312. [Google Scholar] [CrossRef]
- Akhtar, J.; Sana, A.; Tauseef, S.M. Application of numerical modelling to predict the groundwater heads in coastal aquifers of Sultanate of Oman. In International Conference on Water Resources Management and Sustainability: Solutions for Arid Regions; Sherif, M., Faiz, M.A., Sefelnasr, A., Eds.; UAE University: Al Ain, United Arab Emirates, 2022; pp. 164–167. [Google Scholar]
- Xiong, Y.; Zhang, T.; Sun, X.; Yuan, W.; Gao, M.; Wu, J.; Han, Z. Groundwater Quality Assessment Based on the Random Forest Water Quality Index—Taking Karamay City as an Example. Sustainability 2023, 15, 14477. [Google Scholar] [CrossRef]
- Derdour, A.; Abdo, H.G.; Almohamad, H.; Alodah, A.; Al Dughairi, A.A.; Ghoneim, S.S.M.; Ali, E. Prediction of Groundwater Quality Index Using Classification Techniques in Arid Environments. Sustainability 2023, 15, 9687. [Google Scholar] [CrossRef]
- Khadim, F.K.; Dokou, Z.; Lazin, R.; Bagtzoglou, A.C.; Anagnostou, E. Groundwater Modeling to Assess Climate Change Impacts and Sustainability in the Tana Basin, Upper Blue Nile, Ethiopia. Sustainability 2023, 15, 6284. [Google Scholar] [CrossRef]
- Awais, M.; Arshad, M.; Ahmad, S.R.; Nazeer, A.; Waqas, M.M.; Aziz, R.; Shakoor, A.; Rizwan, M.; Chauhdary, J.N.; Mehmood, Q.; et al. Simulation of Groundwater Flow Dynamics under Different Stresses Using MODFLOW in Rechna Doab, Pakistan. Sustainability 2023, 15, 661. [Google Scholar] [CrossRef]
- Lee, D.; Park, J.; Lee, H.A.; Woo, N.C. A Numerical Approach to Evaluating Groundwater Vulnerability to Seawater Intrusion on Jeju Volcanic Island, South Korea. Sustainability 2023, 15, 3081. [Google Scholar] [CrossRef]
- Zhang, L.; Dai, Y.; Lin, J.; Han, J.; Sun, X.; Li, X.; Liu, P.; Liao, A. Evaluating Spatiotemporal Variations of Groundwater–Surface Water Interaction Using an Integrated Hydrological Model in Huashan Basin, China. Sustainability 2022, 14, 14325. [Google Scholar] [CrossRef]
- Aslam, M.; Arshad, M.; Singh, V.P.; Shahid, M.A. Hydrological Modeling of Aquifer’s Recharge and Discharge Potential by Coupling WetSpass and MODFLOW for the Chaj Doab, Pakistan. Sustainability 2022, 14, 4421. [Google Scholar] [CrossRef]
- Kayhomayoon, Z.; Milan, S.G.; Arya Azar, N.; Bettinger, P.; Babaian, F.; Jaafari, A. A Simulation-Optimization Modeling Approach for Conjunctive Water Use Management in a Semi-Arid Region of Iran. Sustainability 2022, 14, 2691. [Google Scholar] [CrossRef]
- Zhang, J.; Huo, A.; Zhao, Z.; Yang, L.; Peng, J.; Cheng, Y.; Wang, Z. Impact of Mountain Reservoir Construction on Groundwater Level in Downstream Loess Areas in Guanzhong Basin, China. Water 2022, 14, 1470. [Google Scholar] [CrossRef]
- Zhao, M.; Meng, X.; Wang, B.; Zhang, D.; Zhao, Y.; Li, R. Groundwater Recharge Modeling under Water Diversion Engineering: A Case Study in Beijing. Water 2022, 14, 985. [Google Scholar] [CrossRef]
- Zhang, D.; Xie, X.; Wang, T.; Wang, B.; Pei, S. Research on Water Resources Allocation System Based on Rational Utilization of Brackish Water. Water 2022, 14, 948. [Google Scholar] [CrossRef]
- Rotz, R.; Milewski, A.; Rasmussen, T.C. Transient Evolution of Inland Freshwater Lenses: Comparison of Numerical and Physical Experiments. Water 2020, 12, 1154. [Google Scholar] [CrossRef]
- Zhang, M.; Hu, L.; Yao, L.; Yin, W. Surrogate Models for Sub-Region Groundwater Management in the Beijing Plain, China. Water 2017, 9, 766. [Google Scholar] [CrossRef]
- Polemio, M. Monitoring and Management of Karstic Coastal Groundwater in a Changing Environment (Southern Italy): A Review of a Regional Experience. Water 2016, 8, 148. [Google Scholar] [CrossRef]
- McDonald, M.G.; Harbaugh, A.W. A Modular Three-Dimensional Finite-Difference Groundwater Flow Model; USGS open-file report Modelling techniques; US Geological Survey: Reston, VA, USA, 1988; pp. 83–875, Book 6, Chapter A1.
- Zheng, C.; Wang, P.P. MT3DMS: A Modular Three-Dimensional Multispecies Transport Model for Simulation of Advection, Dispersion, and Chemical Reactions of Contaminants in Groundwater Systems; Contract Report SERDP-99-1; U.S. Army Corps of Engineers: Washington, DC, USA, 1999.
- Young, M.E.; de Bruijn, R.G.M.; Al-Ismaily, A.S. Exploration of an alluvial aquifer in Oman by time-domain electromagnetic sounding. Hydrogeol. J. 1998, 6, 383–393. [Google Scholar] [CrossRef]
- Cordero-Acosta, J.R.; Otero Díaz, L.J.; Higgins Álvarez, A.E. Influence of Fluvial Discharges and Tides on the Salt Wedge Position of a Microtidal Estuary: Magdalena River. Water 2024, 16, 1139. [Google Scholar] [CrossRef]
- Mastrocicco, M.; Colombani, N. The Issue of Groundwater Salinization in Coastal Areas of the Mediterranean Region: A Review. Water 2021, 13, 90. [Google Scholar] [CrossRef]
- Huang, H.; Wang, Y.; Wang, S.; Lan, Y.; Huang, X. Saltwater Intrusion in the Changjiang River Estuary in Response to the East Route of the South-to-North Water Transfer Project in the New Period after 2003. Sustainability 2024, 16, 683. [Google Scholar] [CrossRef]
- Benaafi, M.; Abba, S.I.; Aljundi, I.H. Effects of Seawater Intrusion on the Groundwater Quality of Multi-Layered Aquifers in Eastern Saudi Arabia. Molecules 2023, 28, 3173. [Google Scholar] [CrossRef]
- Sbai, M.A.; Larabi, A.; Fahs, M.; Doummar, J. A New Normalized Groundwater Age-Based Index for Quantitative Evaluation of the Vulnerability to Seawater Intrusion in Coastal Aquifers: Implications for Management and Risk Assessments. Water 2021, 13, 2496. [Google Scholar] [CrossRef]
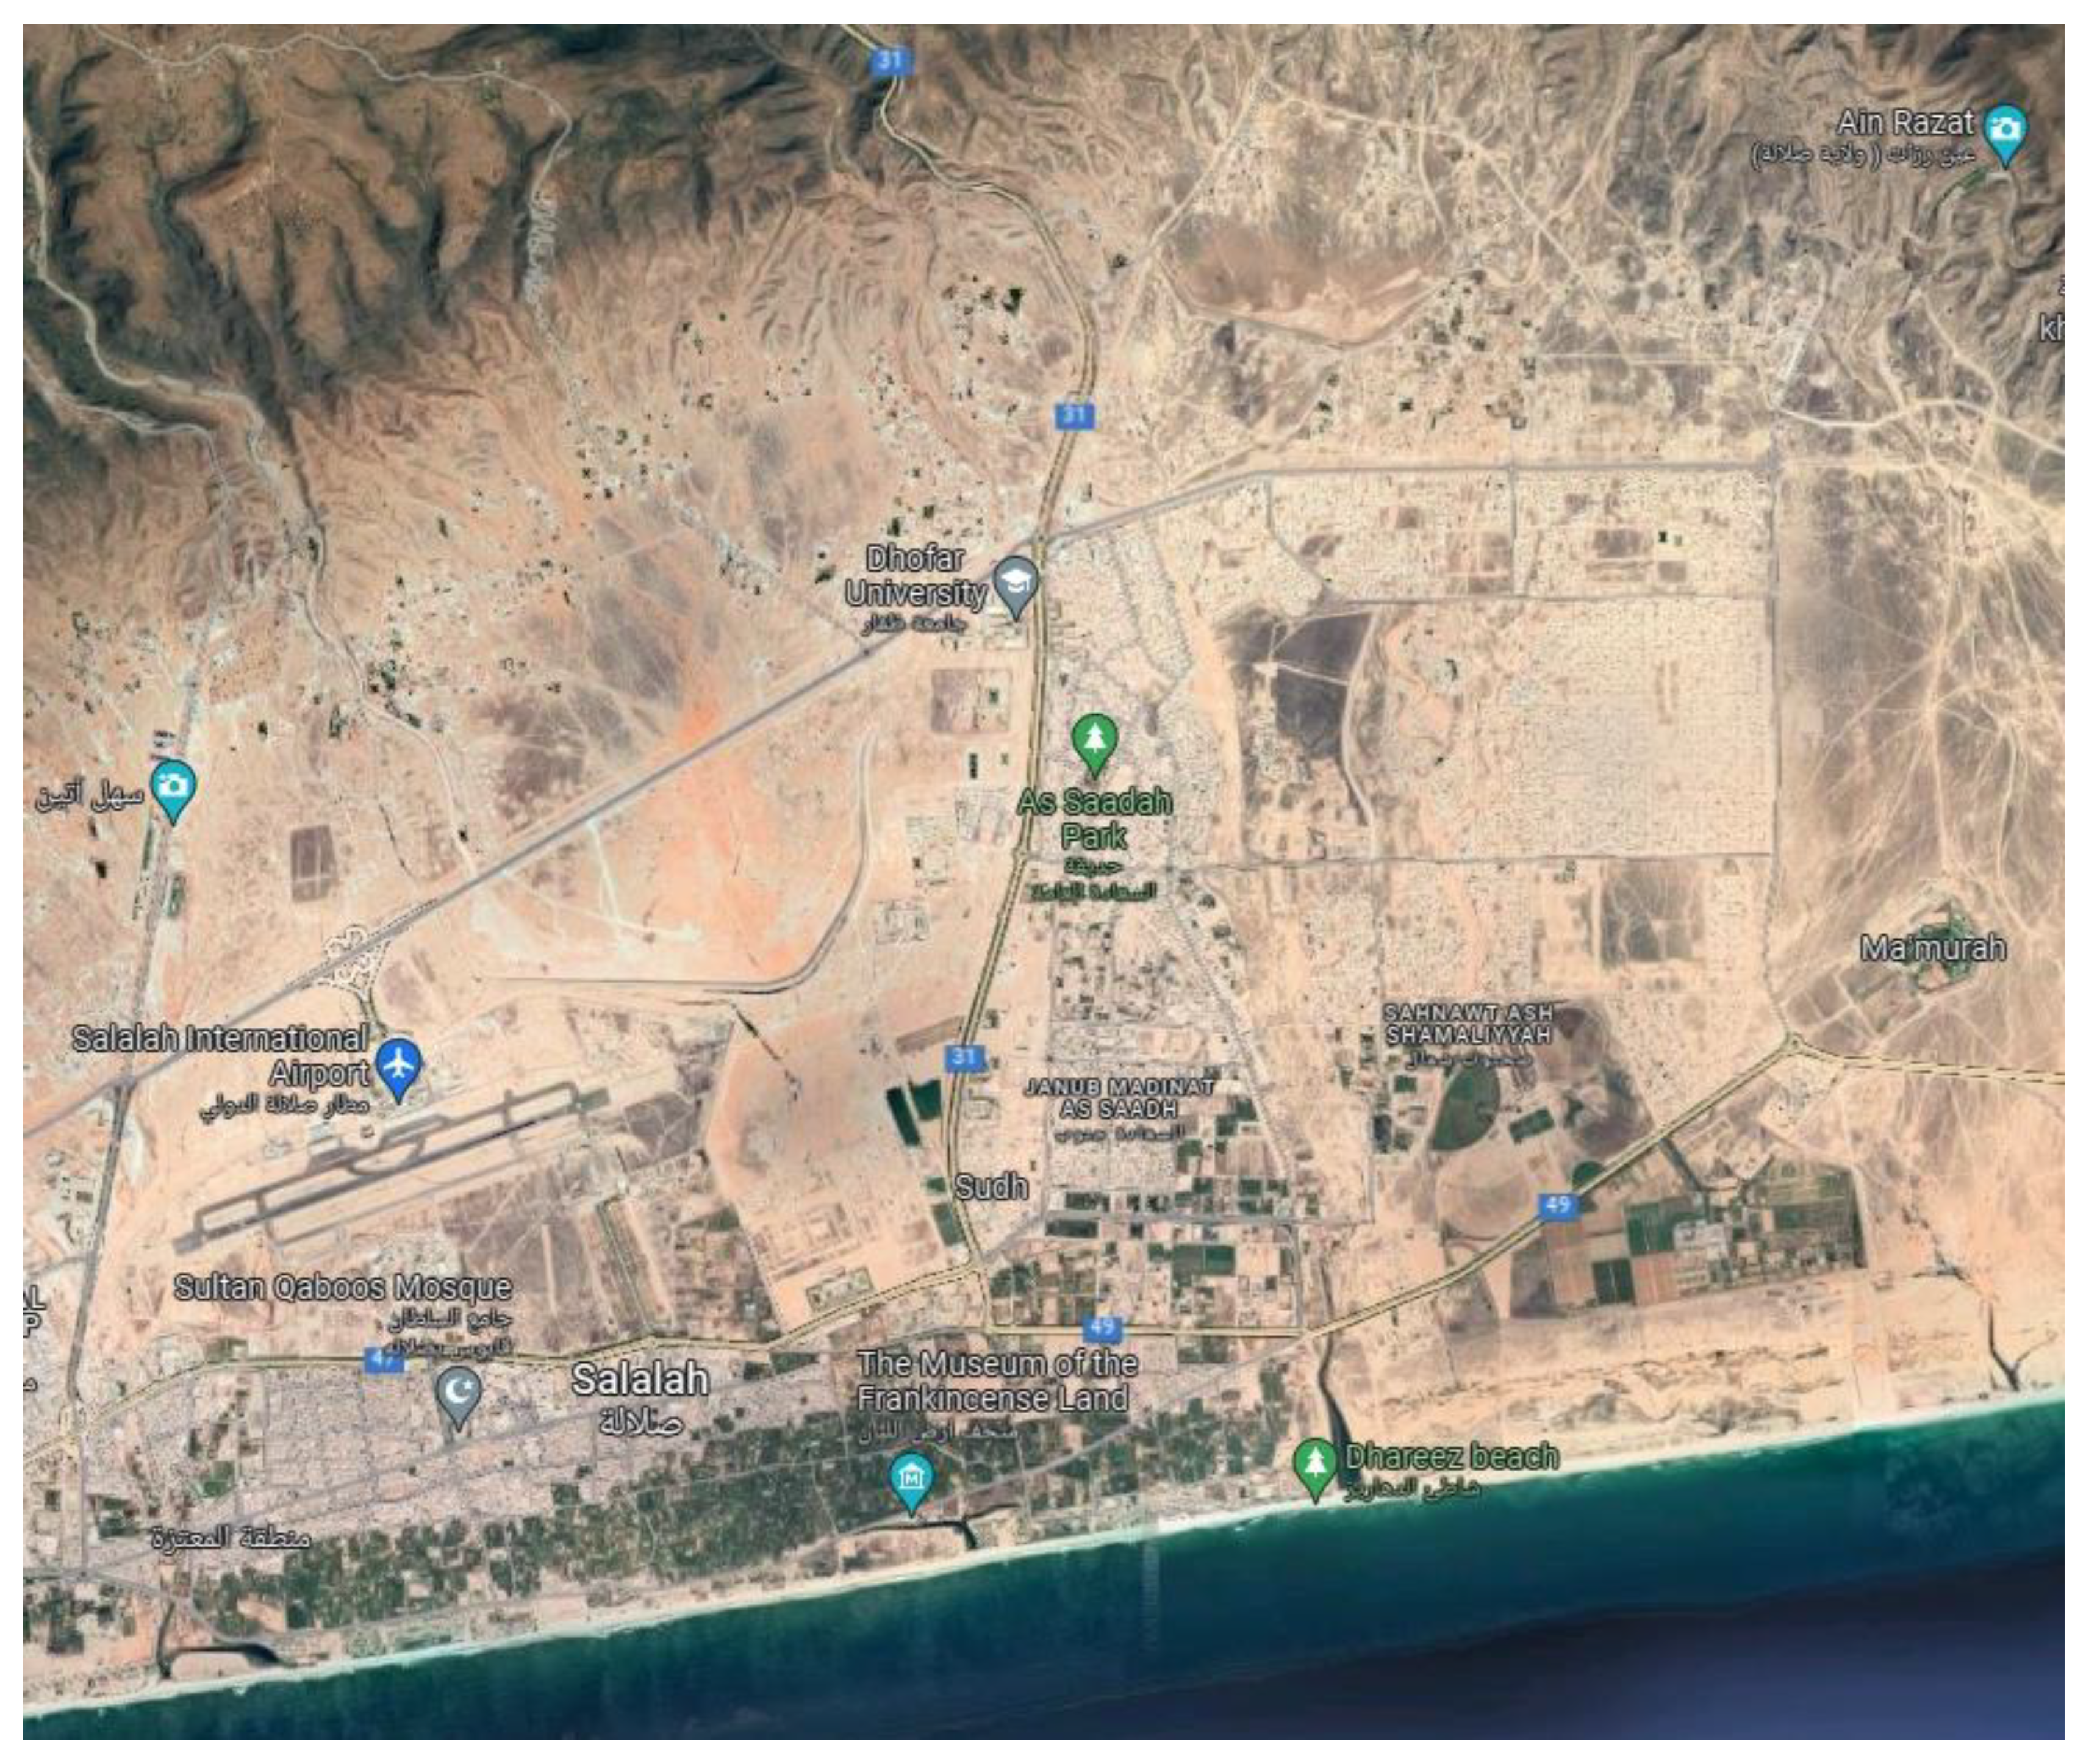
Figure 1.
Salalah coastal location map (google.com/maps (accessed on 29 August 2022).

Figure 2.
The artificial recharge flow rates of MTEs into injection wells.

Figure 3.
The current (2022) domestic water demand of Salalah City.

Figure 4.
The schematic diagram of calculate water levels (m amsl) in the Salalah coastal aquifer for the years (A) 2011, (B) 2014, (C) 2018, (D) 2022, (E) 2027 (Scenario A), and (F) 2027 (Scenario B).
Figure 4.
The schematic diagram of calculate water levels (m amsl) in the Salalah coastal aquifer for the years (A) 2011, (B) 2014, (C) 2018, (D) 2022, (E) 2027 (Scenario A), and (F) 2027 (Scenario B).


Figure 5.
Schematic diagram of the calculated salinity levels (TDS in mg/L) in the Salalah coastal aquifer for the years: (A) 2011, (B) 2014, (C) 2018, (D) 2022, (E) 2027 (Scenario A), and (F) 2027 (Scenario B).
Figure 5.
Schematic diagram of the calculated salinity levels (TDS in mg/L) in the Salalah coastal aquifer for the years: (A) 2011, (B) 2014, (C) 2018, (D) 2022, (E) 2027 (Scenario A), and (F) 2027 (Scenario B).


Figure 6.
PMPATH results of the calculated groundwater levels (in meters above mean sea level, m amsl) in the Salalah aquifer during a two-year simulation period, incorporating Municipal Treated Effluents (MTEs) injected into wells for the year 2011 under the transient scenario.
Figure 6.
PMPATH results of the calculated groundwater levels (in meters above mean sea level, m amsl) in the Salalah aquifer during a two-year simulation period, incorporating Municipal Treated Effluents (MTEs) injected into wells for the year 2011 under the transient scenario.

Figure 7.
PMPATH results of the calculated groundwater levels (in meters above mean sea level, m amsl) in the Salalah aquifer during a two-year simulation period, incorporating Municipal Treated Effluents (MTEs) injected into wells for the year 2014 under the transient scenario.
Figure 7.
PMPATH results of the calculated groundwater levels (in meters above mean sea level, m amsl) in the Salalah aquifer during a two-year simulation period, incorporating Municipal Treated Effluents (MTEs) injected into wells for the year 2014 under the transient scenario.

Figure 8.
PMPATH results of the calculated groundwater levels (in meters above mean sea level, m amsl) in the Salalah aquifer during a two-year simulation period, incorporating Municipal Treated Effluents (MTEs) injected into wells for the year 2018 under the transient scenario.
Figure 8.
PMPATH results of the calculated groundwater levels (in meters above mean sea level, m amsl) in the Salalah aquifer during a two-year simulation period, incorporating Municipal Treated Effluents (MTEs) injected into wells for the year 2018 under the transient scenario.

Figure 9.
PMPATH results of the calculated groundwater levels (in meters above mean sea level, m amsl) in the Salalah aquifer during a two-year simulation period, incorporating Municipal Treated Effluents (MTEs) injected into wells for the year 2022 under the transient scenario.
Figure 9.
PMPATH results of the calculated groundwater levels (in meters above mean sea level, m amsl) in the Salalah aquifer during a two-year simulation period, incorporating Municipal Treated Effluents (MTEs) injected into wells for the year 2022 under the transient scenario.

Figure 10.
PMPATH results of the calculated groundwater levels (in meters above mean sea level, m amsl) in the Salalah aquifer during a two-year simulation period, incorporating Municipal Treated Effluents (MTEs) injected into wells for the year 2027 under predictive Scenario A: stop pumping from both wellfields under the predictive period.

Figure 11.
PMPATH results of the calculated groundwater levels (in meters above mean sea level, m amsl) in the Salalah aquifer during a two-year simulation period, incorporating Municipal Treated Effluents (MTEs) injected into wells for the year 2027 under predictive Scenario B: business as usual for both wellfields under the predictive period.


Table 1.
Illustration of groundwater levels and TDS (mg/L).
| Predictive Options | Objectives | % of Increase/Decrease |
|---|---|---|
| Stop groundwater pumping from Salalah and Saada wellfields and compensate groundwater supply from both wellfields by surplus desalinated water. | To see the impact of the abstraction stoppage from both wellfields on the aquifer water balance. | This scenario will reduce the current (2022) pumping by 13.78 million m3, approx. 21.44%. |
| Business as usual and continuing pumping from both wellfields during the predictive period from 2023 to 2027. | To see the impact of the continued abstraction from both wellfields on the aquifer water balance. | This option will increase the abstraction from the aquifer during Scenario B by at least 13.78 million m3 annually approx. |
| The artificial recharge by injecting treated wastewater effluents into the constructed boreholes along Salalah coastline will remain the same flow in both scenarios during transient and predictive scenarios. | To observe the effectiveness of the direct injection MTEs in boreholes to compact saline intrusion in the aquifer coastal agricultural strip. | This option will recharge the aquifer artificially by 3 million m3 in the current (2022), will add approx. 3%. |
Table 2.
The computed drawdown (in meters) within the agricultural coastal belt at the position (Layer, Row, Column) = (1, 47, 20) for both baseline Scenario A and predictive Scenario B (business as usual).
Table 2.
The computed drawdown (in meters) within the agricultural coastal belt at the position (Layer, Row, Column) = (1, 47, 20) for both baseline Scenario A and predictive Scenario B (business as usual).
| Drawdown (m)/Years | 2011 | 2014 | 2018 | 2022 | 2027 |
|---|---|---|---|---|---|
| Scenario A | 0.7319909 | 0.6089069 | 0.4557001 | 0.5307458 | 0.3525451 |
| Scenario B | 0.5206156 |
Table 3.
The calculated solute concentration of salinity (TDS) within the agricultural coastal belt in position (Layer, Row, Column) = (1, 51, 6) for the baseline Scenarios A and B: business as usual.
Table 3.
The calculated solute concentration of salinity (TDS) within the agricultural coastal belt in position (Layer, Row, Column) = (1, 51, 6) for the baseline Scenarios A and B: business as usual.
| Salinity (TDS)/Years | 2011 | 2014 | 2018 | 2022 | 2027 |
|---|---|---|---|---|---|
| Scenario A | 12,477 | 14,381 | 13,828 | 12,233 | 8712 |
| Scenario B | 10,299 |
Disclaimer/Publisher’s Note: The statements, opinions and data contained in all publications are solely those of the individual author(s) and contributor(s) and not of MDPI and/or the editor(s). MDPI and/or the editor(s) disclaim responsibility for any injury to people or property resulting from any ideas, methods, instructions or products referred to in the content. |
© 2024 by the author. Licensee MDPI, Basel, Switzerland. This article is an open access article distributed under the terms and conditions of the Creative Commons Attribution (CC BY) license (https://creativecommons.org/licenses/by/4.0/).
Share and Cite
MDPI and ACS Style
Shammas, M.I. Water Resource Management of Salalah Plain Aquifer Using a Sustainable Approach. Sustainability 2024, 16, 3670. https://doi.org/10.3390/su16093670
AMA Style
Shammas MI. Water Resource Management of Salalah Plain Aquifer Using a Sustainable Approach. Sustainability. 2024; 16(9):3670. https://doi.org/10.3390/su16093670
Chicago/Turabian StyleShammas, Mahaad Issa. 2024. "Water Resource Management of Salalah Plain Aquifer Using a Sustainable Approach" Sustainability 16, no. 9: 3670. https://doi.org/10.3390/su16093670
Note that from the first issue of 2016, this journal uses article numbers instead of page numbers. See further details here.